Figure 2.

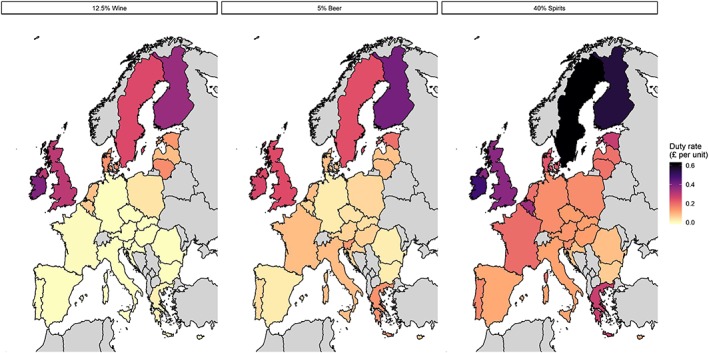
Geographical distribution of alcohol duty rates per unit for selected products. [Colour figure can be viewed at wileyonlinelibrary.com]

Geographical distribution of alcohol duty rates per unit for selected products. [Colour figure can be viewed at wileyonlinelibrary.com]