Abstract
Purpose
The noise navigator is a passive way to detect physiological motion occurring in a patient through thermal noise modulations measured by standard clinical radiofrequency receive coils. The aim is to gain a deeper understanding of the potential and applications of physiologically induced thermal noise modulations.
Methods
Numerical electromagnetic simulations and MR measurements were performed to investigate the relative contribution of tissue displacement versus modulation of the dielectric lung properties over the respiratory cycle, the impact of coil diameter and position with respect to the body. Furthermore, the spatial motion sensitivity of specific noise covariance matrix elements of a receive array was investigated.
Results
The influence of dielectric lung property variations on the noise variance is negligible compared to tissue displacement. Coil size affected the thermal noise variance modulation, but the location of the coil with respect to the body had a larger impact. The modulation depth of a 15 cm diameter stationary coil approximately 3 cm away from the chest (i.e. radiotherapy setup) was 39.7% compared to 4.2% for a coil of the same size on the chest, moving along with respiratory motion. A combination of particular noise covariance matrix elements creates a specific spatial sensitivity for motion.
Conclusions
The insight gained on the physical relations governing the noise navigator will allow for optimized use and development of new applications. An optimized combination of elements from the noise covariance matrix offer new ways of performing, e.g. motion tracking.
Keywords: body resistance, magnetic resonance imaging, physiological motion, radiofrequency receive coil, thermal noise
1. INTRODUCTION
The noise navigator is a passive way to detect physiological motion occurring in a patient utilizing standard clinical radio frequency (RF) receive coils.1, 2 As the name suggests, the noise navigator is based on thermal noise. The origins and characterization of thermal noise has been described extensively.3, 4 The variance of the thermal noise voltage depends linearly on the real part of the coil impedance.5 At frequencies above 21 MHz the body resistance dominates this real part of the coil impedance.6 Thus, any motion that effectively alters the body resistance, will affect the variance of the thermal noise voltage measured by an RF receive coil.
To understand the physical relations behind the noise navigator, one should explore the source of the measured thermal noise, i.e. the human body. The body consists of numerous tissues with different dielectric properties (i.e. conductivity and permittivity). The spatial distribution of these dielectric properties governs the observed electric impedance of the body. This body impedance (often called bioimpedance) has been used extensively in clinical status monitoring and diagnosis of disease in the pulmonary,7, 8 cardiovascular9 and circulatory systems.10, 11 Instead of measuring bioimpedance changes with electrodes at kHz frequencies, as is usually done,12 it is possible to use MR coils in the RF frequency range. Here we focus on observing changes in the body impedance caused by temporal modulations of the spatial dielectric tissue property distribution due to physiological motion. These changes in the spatial dielectric tissue property distribution are generally induced by a combination of physiological tissue displacement (e.g. respiration or cardiac contraction) and dielectric tissue property variations (e.g. in‐ and deflation of lungs13, 14).
A few physiological motion detection methods based on measuring body impedance fluctuations with MR have been demonstrated. The pilot tone navigator15 utilizes a continuous wave RF signal generator with a frequency outside the frequency band of the MR signal, but within the receiver bandwidth. Physiological motion alters the body impedance and thus leads to modulation of this signal detected by a standard MR receive array. This method, however, requires active signal generation with dedicated hardware and careful calibration to prevent interference with MR imaging. Another active method monitors the reflected RF power of a transmit/receive coil using a directional coupler16, 17 or pick‐up coils.18 The fluctuations in the body impedance modulate the mismatch (S‐matrix) of the RF coil. It was shown that respiratory and cardiac motion can be detected by monitoring the reflected RF power. Unfortunately, a directional coupler or pick‐up coils are not standard in clinical MR scanners and thus hardware modifications are required. Alternatively, the noise navigator is a passive method requiring no hardware modifications or RF excitation. It measures the real part of body impedance fluctuations indirectly through the variance of the thermal noise voltage. Experimental results with the noise navigator demonstrated that thermal noise can be used to detect respiratory motion.1
The effect of physiological motion on thermal noise fluctuations has never been investigated to our knowledge. The Theory section concisely describes the physical origins and relations governing the thermal noise measured by an RF receive coil in an MR experiment and how it is affected by physiological motion. We believe that a better comprehension of physiologically induced thermal noise modulations will uncover optimal design principles, potential limitations and insight for future applications of the noise navigator for motion detection.
For a deeper understanding of the potential and applications of physiologically induced thermal noise modulations, numerical electromagnetic simulations were performed on a digital human phantom. In this study, we investigated a number of specific aspects. First of all, we investigated the relative contribution of tissue displacement versus modulation of the lung conductivity and permittivity over the respiratory cycle. Secondly, we explored the impact of coil diameter and position with respect to the body. Aimed toward motion tracking applications,19 we also investigated the relations between the various elements in the noise covariance matrix (NCM) of a receive array and the sensitivity to motion in particular spatial regions.
2. THEORY
Thermal noise detected by an RF receive coil has its origins in a fundamental physical phenomenon, i.e. thermal agitation. The electric charge carriers in a conductor are in thermodynamic equilibrium with the heat motion of the matter of the conductor.3 According to the fluctuation‐dissipation theorem,20 the electrical energy of an electric current is dissipated in a resistance and turned into thermal energy and vice versa. In other words, thermal motion of electric charge carriers within a conductive material (e.g. human body) causes rapid fluctuations in the density of electric charge carriers leading to electromagnetic fields. These fluctuating electromagnetic fields induce an electromotive force in the RF receive coil through Faraday induction (i.e. the same principle used for NMR signal detection). This electromotive force is the thermal noise observed in an NMR experiment.
To calculate the noise voltage induced in an RF coil, current sources have to be modeled throughout the whole sample (in this case human body). Subsequently, the individual electric field responses of each source have to be integrated over the coil. An electromagnetically equivalent, and much easier situation to model, occurs when the reciprocal situation is assumed, i.e. when we analyze the situation when a current source at the coil generates an electric field distribution in the sample leading to dissipation in the conductive medium. In this way, the resistance of the Johnson noise model3 can be calculated. This can be generalized to include the noise covariance between coil i and j, by calculating the mutual body resistance of their overlapping electric fields in the volume integral (see Equation (1)). The typical formulation was slightly adapted to include the spatial and time dependency of the conductivity (σ) and reciprocal electric field (E) due to effects of physiological motion (e.g. breathing).
| (1) |
where I denotes the amplitude of the sinusoidal current on the RF coil when driven in transmit and the asterisk represents the complex conjugate. Notice that the body resistance becomes purely real in case of a single coil (i.e. i = j). For a combination of coils (i.e. i ≠ j), the superposition of the reciprocal electric fields of both coils will have a phase and thus results in a complex body resistance. The real part of this body resistance describes correlated noise, whereas the imaginary part denotes the uncorrelated noise.21
The amplitude of the thermal noise measured on the scanner depends on the voltage received by the preamplifier. This voltage is determined by the real part of the effective impedance (see Figure 1A). The effective impedance in turn is a combination of the coil impedance () and impedance of the matching circuitry. The matching circuitry is not susceptible to motion, but the coil impedance is. Moreover, the real part of the coil impedance is dominated by the body resistance for sufficiently large frequencies (e.g. 21 MHz for typical MR systems6), i.e. . The relationship between the real part of the effective impedance and body resistance can be seen from the equation in Figure 1B by substitution of by .
Figure 1.
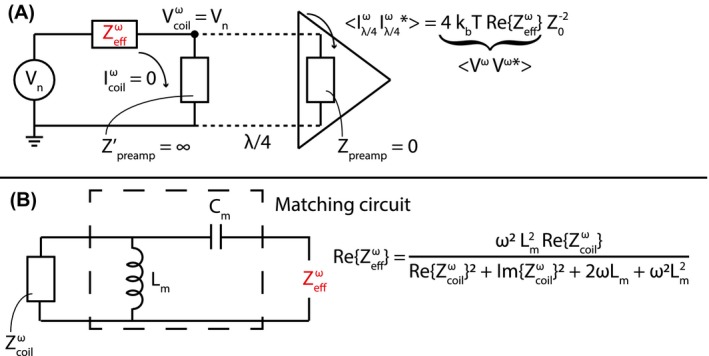
A schematic representation of the receive setup at a certain frequency ω, where the coil and preamplifier are connected by a λ/4 transmission line (adapted from Brown, et al Figure 2A22) is shown in A. Since this is an open circuit (i.e. the preamplifier impedance viewed from the transmission line ), there is zero current in the coil. is the input impedance of the preamplifier, which is very low. represents the emf induced in the coil by thermal agitation and is the effective impedance of the coil and matching circuit together. How the effective impedance depends on the coil impedance and the matching circuit used in this paper is shown in B
The purpose of a matching circuit, in the situation sketched in Figure 1A, is to transform the impedance of the coil to the complex conjugate of the noise match impedance of the preamplifier. In the ideal case, where the coil impedance is equal to the complex conjugate of the noise match impedance, minimal preamplifier‐induced noise is generated during signal detection. There are many possible configurations for matching circuits, and the one used throughout this paper is depicted in Figure 1B. Typically, the noise match impedance is close to but not equal to 50 Ω. It was assumed that the noise match impedance () is 50 Ω and through the derived effective impedance equation (not shown here) an expression for the matching inductor () and capacitor () was obtained.
| (2) |
| (3) |
where ω is the carrier frequency.
The mean‐square of the potential fluctuation induced in an RF receive coil by thermal agitation is proportional to the real part of the effective impedance () and the absolute temperature () of the body.3 In principle, the spectral density is no longer flat due to the presence of reactive components in the effective impedance. However, if we assume that the spectral density is flat over the receive bandwidth (i.e. maximally 1 MHz), the individual frequency components can simply be summed resulting in Equation (4). As thermal noise by definition is white and thus has a mean of zero, the thermal noise variance is equal to the mean‐square potential fluctuation.
| (4) |
where is the Boltzman constant and BW is the receive bandwidth.4 The mean‐square potential fluctuation, and thus thermal noise variance, is a function of only the frequency, effective resistance, temperature, and receive bandwidth. In general, it is assumed that the absolute body temperature, frequency, and receive bandwidth do not change during an NMR experiment. Thus all thermal noise variance fluctuations are caused by the real part of the effective impedance.
3. METHODS
3.1. Digital human phantom
A 4D digital human phantom (male, 180 cm height and 80 kg weight) with a 2 mm isotropic voxel size was generated using XCAT.23 The phantom contained 30 distinct tissues with different dielectric properties at 127.74 MHz. The heart rate and breathing frequency were set to 60 beats per minute and 16 breaths per minute, respectively. The maximum respiratory displacement in feet‐head and anterior‐posterior was set to 3 cm24 and 1 cm, respectively. Twenty respiratory phases were simulated within one breathing cycle (with a duration of 3.75 seconds). The simulated breathing cycle started and ended in exhale position (see Figure 2A). During inhalation the diaphragm moves down (i.e. negative feet‐head displacement) and the chest wall moves in anterior direction until the inhaled state at 1.7 seconds is reached. During exhalation the opposite occurs, however due to the simulated hysteresis, it takes more time to complete. The dielectric properties of the lungs during the breathing cycle were linearly interpolated between the deflated and inflated values (see Figure 2B). Figure 2C shows the simulated cardiac activity at each respiratory phase. The end‐diastolic and end‐systolic volumes of the left ventricle were 132.2 and 50.6 mL, respectively.
Figure 2.

The simulated respiratory displacement of the diaphragm in feet‐head direction (diamonds) and anterior‐posterior displacement (dots) in A. The used dielectric lung properties for deflated and inflated lung were obtained from literature25 and are shown in the table (B). C shows the simulated cardiac motion curve at the same discrete time points as the respiratory displacement
3.2. Simulations
Numerical electromagnetic simulations (Sim4Life, ZMT, Zurich) were performed for all twenty respiratory phases of the digital human phantom during a respiratory cycle. Three different loop sizes, i.e. 10, 15, and 20 cm diameter, that are commonly used as RF receive coils in clinical practice were simulated. All simulations were performed at 127.74 MHz (i.e. the operating frequency of receive coils for protons at a 3 T static magnetic field strength), and the RF coils of different sizes were all tuned to this frequency.
For each simulation the source impedance (i.e. equivalent to the coil impedance in receive setting) was exported per respiratory phase. However, as was explained in the Theory section, the measured thermal noise (co)variance depends on the real part of the effective impedance of the measurement system.22 This effective impedance includes both the RF receive coil and matching circuitry (see Figure 1B). The effect of the matching circuit was calculated and added retrospectively. The matching circuit elements (i.e. capacitor and inductor ) were calculated once using a separate single coil simulation for all loop sizes, where the coil was loaded by a phantom to mimic a typical matching procedure. In these simulations the loop was located 0.5 cm away from a 40 × 40 × 40 cm3 water phantom with 3.5 g/l NaCl added to it. This corresponded to a 0.56 S/m conductivity and 84.6 permittivity for the phantom used for matching. The matching inductor and capacitor values were calculated by Equations (2) and (3), respectively. The calculated matching inductor values were 96.8, 98.5, and 98.0 nH for a 10, 15, and 20 cm loop diameter, respectively. Additionally, the calculated matching capacitor values were 13.0, 13.8, and 12.7 pF for a 10, 15, and 20 cm loop diameter, respectively.
The effective resistance (i.e. real part of the effective impedance) was calculated by
| (5) |
The simulated effective resistance and measured thermal noise (co)variance cannot be directly compared, because of a scaling factor (i.e. ). Hence, both the effective resistance and thermal noise variance signals were divided by their median for comparison between simulations and measurements. Subsequently, the normalized signals were demeaned and multiplied with 100% to obtain the modulation with respect to the median. For quantitative comparison between different simulation setups and measurements, the modulation depth was defined as 3 times the standard deviation of this modulation.
To investigate the spatial origins of the thermal noise (co)variance, the simulated electric (E) and current density (J) fields were exported for each respiratory phase. Where the current density was defined as J = σE. The E and J fields were used to calculate differential body resistance maps (see Equation (6)) through a slightly modified version of Equation (1). The impact of the matching network was ignored as we were only interested in the spatial origins of the thermal noise covariances.
| (6) |
Only the real part was taken into account, because this represents the correlated noise.
3.2.1. Single coil: Dielectric lung property variations
The contribution of tissue displacement and dielectric lung property variations on the effective resistance during a breathing cycle was investigated separately by means of simulations of a single 15 cm loop coil on the middle of the chest (see Figure 3A). This loop coil was moving along with respiratory motion at a fixed distance of 1 cm with respect to the chest to negate potential effective resistance fluctuations due to variations in the distance between the coil and chest. The simulations were performed three times, i.e. with linearly changing, constant deflated and inflated dielectric lung properties. The linearly changing dielectric lung properties approximate a realistic in vivo case. The simulations with constant lung properties effectively only contain tissue displacement. For each of these 3, the effective resistance was calculated using Equation (5).
Figure 3.
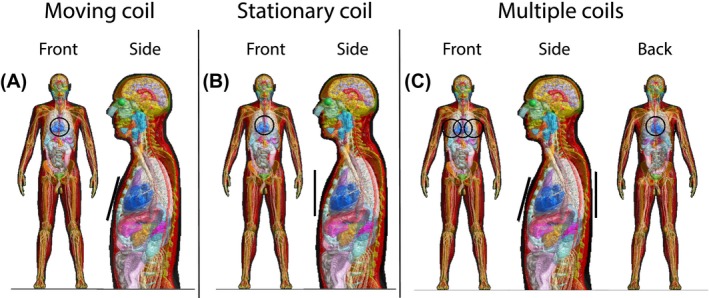
The simulated body model with a 15 cm loop coil (depicted in black) in multiple positions. The single coil setup is shown for a moving (A) and stationary coil (B). In C, the setup with multiple coils is shown
3.2.2. Single coil: Moving and stationary coil
The contribution of a constant and varying distance between the coil and the body was investigated through two experiments with a single coil. Similar to the previous setup a single loop coil on the middle of the chest (see Figure 3A) with a constant 1 cm distance to the chest was used (i.e. moving coil). The second experiment was performed with a stationary coil located 3 cm away from the middle of the chest at mid‐ventilation (see Figure 3B). As this coil is stationary, the chest wall moves toward it during inhalation and away from it during exhalation. For these experiments both the effective resistance (see Equation (5)) and differential body resistance maps (see Equation (6)) were calculated. Additionally, the difference between the differential body resistance maps at inflated and deflated respiratory phases was calculated. For this purpose, non‐rigid registration was applied to the inflated differential body resistance map (using the available deformation vector fields from XCAT) to transform it to the deflated anatomy. Subsequently, the difference between the inflated and deflated maps was calculated to see which regions contributed most to the physiologically induced body resistance variations.
3.2.3. Multiple coils
The mutual effective resistance governs the noise correlation between coils and is characterized in practice by computing the NCM from thermal noise samples acquired by multiple coils. To investigate the effect of respiratory and cardiac motion on the (mutual) effective resistance, simulations were performed with 4 coils. All combinations of the three coils on the chest moving along with respiratory motion and a stationary coil on the back (see Figure 3C) were simulated. For these 4 coils, multi‐port simulations were performed where each coil was terminated with a matched source impedance. The mutual effective resistance was calculated by substituting the real and imaginary part of the body resistance in Equation (5). The differential (mutual) body resistance maps were calculated through Equation (6).
3.2.4. MRI measurements
Experiments were performed on a clinical 3T MR scanner (Ingenia, Philips Healthcare, Best, The Netherlands) on 3 healthy volunteers, resembling the digital human phantom, with a mean height and weight of 181 cm and 75 kg, respectively. Signal was collected with a 15 cm diameter loop coil, which was placed on the simulated positions (see Figure 3). Prior to the measurements, the volunteers signed a written informed consent, approved by the institutional review board. A Cartesian balanced 2D gradient echo sequence (2.1 ms repetition time, 1120 samples per readout (1 MHz receive bandwidth), and 86 readouts per dynamic) was used to collect the experimental data continuously with 181 ms per dynamic (i.e. similar to the temporal resolution of the simulations). The gradients and RF were both turned off during the entire MR sequence to ensure that only thermal noise was collected. The thermal noise variance was estimated over all noise samples acquired during a dynamic. During the experiments, the volunteer was breathing freely. The respiratory bellows signal26, 27 was recorded during data acquisition to serve as an external reference based on which a single breathing cycle was selected (as was simulated).
4. RESULTS
4.1. Single coil: Dielectric lung property variations
In the simulations with constant deflated or inflated dielectric lung properties the effective resistance was only modulated by tissue displacement due to physiological motion. The effective resistance curve for constant inflated and deflated lung properties showed similar behavior (see Figure 4). There is, however, an mean offset of 0.2 Ω between the two. This means that the lower dielectric properties of inflated lung yield a slightly higher effective resistance compared to deflated lung.
Figure 4.
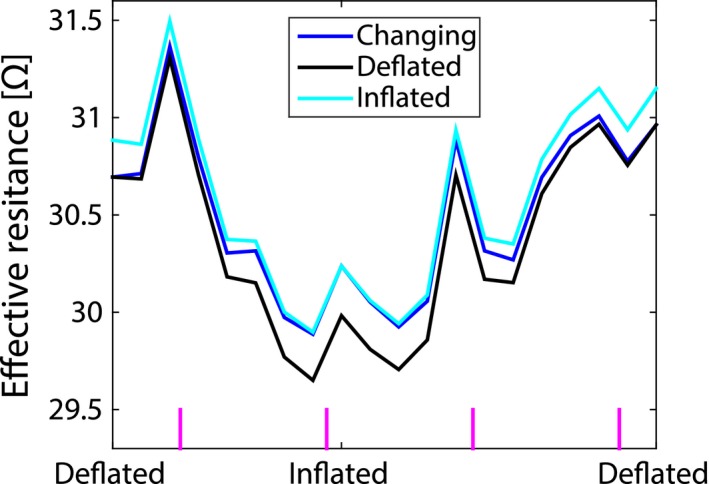
The effective resistance simulated for a 15 cm loop coil on the chest moving along with respiratory motion during the respiratory cycle with changing (blue), deflated (black), and inflated (cyan) dielectric lung properties assigned to the lung. The vertical magenta lines at the bottom indicate systole of the heart
The effective resistance from simulations with linearly changing lung properties was affected by both tissue displacement and dielectric lung property variations. Notice that the effective resistance for changing dielectric lung properties is always in between the deflated and inflated curves.
The effective resistance modulation depth was 4.2, 4.9, and 4.6% for linearly changing, constant deflated and inflated dielectric lung properties, respectively. The changing lung properties curve had the lowest modulation depth. Thus the effects of tissue displacement and dielectric lung property variations counter each other. Apart from their differences, note that all 3 curves were not as smooth as the simulated respiratory motion curve shown in Figure 2A. Most likely, the additional peaks in the effective resistance over the respiration cycle, can be attributed to cardiac motion as they closely coincided with systole (indicated by the vertical magenta lines).
4.2. Single coil: Moving and stationary coil
Figure 5 shows the modulation of the simulated effective resistance and measured thermal noise variance for a stationary and moving coil setup. The simulations were performed for three different coil sizes for both setups, whereas the measurements were performed with a 15 cm diameter loop coil. In the stationary coil setup (Figure 5A), the simulated modulation depth decreased with increasing coil diameter, i.e. 50.1, 39.7, and 33.6% for 10, 15, and 20 cm, respectively. Compared to a stationary coil, it should be noted that the resistance modulation was approximately ten times lower for the moving coil setup (Figure 5B). Additionally, the modulation depth increased with increasing coil diameter, i.e. 3.5, 4.2, and 5.3% for 10, 15, and 20 cm diameter coils, respectively. Notice that the effective resistance curves are much smoother for the stationary coil compared to the moving coil. Most likely the peaks on top of the moving coil effective resistance were caused by cardiac activity as they approximately coincide with systole of the heart. This effect of cardiac motion was lower for a larger coil diameter.
Figure 5.
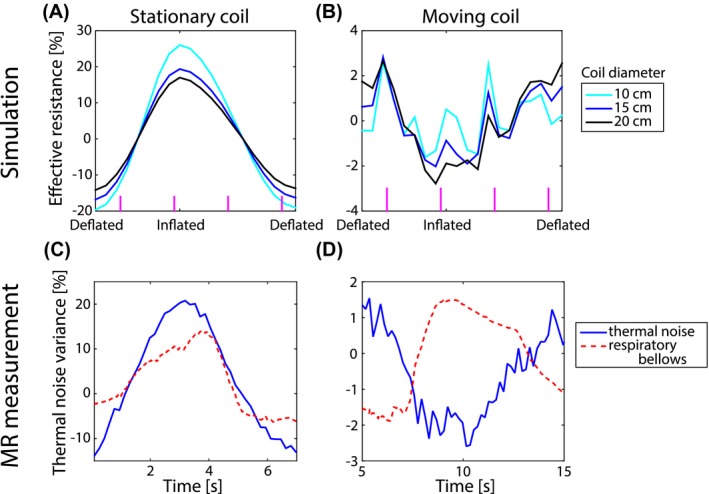
The effective resistance modulation as a function of the respiratory phase for a coil that is stationary (A and C) or moving along with the chest (B and D). The upper row shows simulated data from the digital human phantom for three different coil sizes, whereas in the bottom representative data measured on a volunteer is depicted. The volunteer data was recorded with a 15 cm diameter loop coil (blue) and the reference respiratory bellows signal is shown in red for the sationary (C) and moving (D) coil setup
The mean measured modulation depth for the stationary coil setup (i.e. 38.3%) was comparable to the simulated modulation depth (i.e. 39.7%). The measured and simulated modulation depths for the moving coil setup agreed too, with 3.2 and 4.2%, respectively. Note that both the simulated effective resistance and measured thermal noise variance increased with inhalation for the stationary coil, whereas they both decreased with inhalation for the moving coil.
To investigate the origin of this opposite behavior between a stationary and moving coil during the respiratory cycle (see Figure 5), differential body resistance maps were calculated and overlaid on the conductivity maps (see Figure 6). The conductivity map mainly served as an anatomical reference, but also depicts the conductivity changes in the lungs. Notice that the scale is logarithmic and thus the differential body resistance amplitude decayed rapidly with distance from the coil. Nevertheless, a relatively large part of the body contributed significantly to the body resistance.
Figure 6.
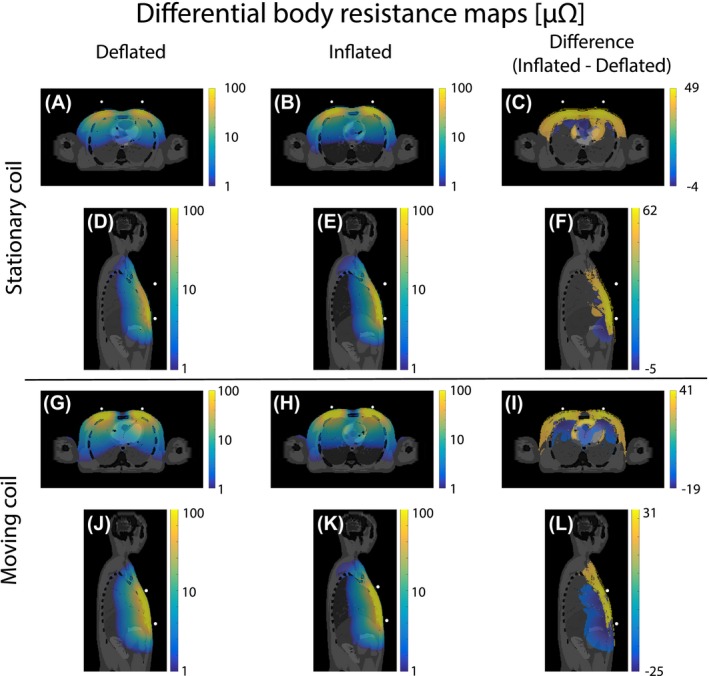
The differential body resistance maps overlaid on the conductivity of the body. The upper half shows the maps at deflated (A and D) and inflated (B and E) respiratory phases for a stationary coil approximately 3 cm away from the body. The lower half shows this for a coil moving along with respiratory motion (G, H, J, and K). The difference between the inflated and deflated differential body resistance is shown in the right column (C, F, I, and L). For clearer visualization, the overlay only shows the differential body resistance with an absolute value above 1 μΩ and a logarithmic scale was used
For the stationary coil, the volume integral over the differential body resistance was higher for inflated (Figure 6B and E) than deflated (Figure 6A and D) phase. This can be visually best appreciated in the high intensity region close to the surface of the body where the coil was located. The differences in deflated and inflated differential body resistance maps were more clearly depicted in the difference maps (Figure 6C and F), where the differential body resistance clearly increased with inhalation at the surface. For the moving coil setup the opposite behavior was seen in Figure 6G, H, J and K. During the deflated respiratory phase the highest differential body resistance was observed. In the difference maps (Figure 6I and L), the same high intensity pattern at the surface as for the stationary coil was observed. However, there was an additional decrease deeper within the body.
4.3. Multiple coils
Figure 7 shows the modulation of the simulated effective resistance and measured thermal noise variance of a coil on the left, middle and right of the chest and the back. The simulations were performed for coils with a diameter of 10, 15, and 20 cm. Notice the smoothness of the effective resistance modulation of the back coil (see Figure 7D). As this coil was located relatively far away from the heart compared to the 3 coils on the chest (see Figure 3C), it was most likely only susceptible to respiratory motion. The thermal noise variance modulation of a 15 cm diameter loop coil located at a similar position as the simulations was comparable to the simulated modulation for all setups.
Figure 7.
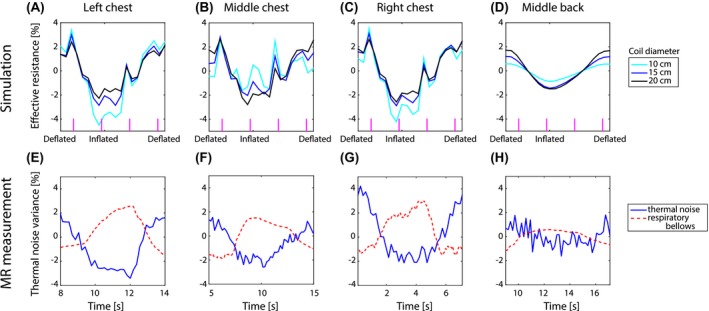
The effective resistance modulation as a function of the respiratory phase for a coil on the left (A), middle (B) and right (C) of the chest and middle of the back (D) for a 10, 15 and 20 cm diameter loop coil is shown in the upper row. The vertical magenta lines indicate cardiac systole. The bottom row shows the corresponding representative measured thermal noise variance modulation for a 15 cm diameter coil in the same positions (E, F, G, and H). The respiratory bellows serves as an external reference for breathing
The simulated and measured modulation depths are shown in Table 1. For the individual volunteer MRI measurement results see Supporting Information Figure S1 and Table S1. Notice that the simulated modulation depth decreased with coil size for a coil on the left and right of the chest, similar to the stationary coil. The modulation depth of a coil on the middle of the chest or back increased with increasing coil size. The main difference between these sets of coils was their position with respect to the body. The position of these loops (indicated by white dots) with respect to the body can be seen on the diagonal of Figure 8. For a coil on the middle of the chest or back, the full loop was close to the body. Part of the loop on the left and right of the chest was located further from the body as they did not curve with the body outline.
Table 1.
The modulation depth (in %) of the simulated effective resistance and mean measured thermal noise variance induced in a loop coil caused by physiological motion. In brackets behind the mean measured modulation depth the standard deviation is reported
| Coil diameter | Left chest | Middle chest | Right chest | Middle back | Stationary coil |
|---|---|---|---|---|---|
| 10 cm (simulation) | 7.7 | 3.5 | 6.8 | 1.6 | 50.1 |
| 15 cm (simulation) | 5.6 | 4.2 | 5.8 | 2.9 | 39.7 |
| 20 cm (simulation) | 4.5 | 5.3 | 5.1 | 3.6 | 33.6 |
| 15 cm (measurement) | 5.7 (1.1) | 3.2 (0.8) | 6.1 (1.3) | 1.8 (0.5) | 38.3 (4.6) |
Figure 8.
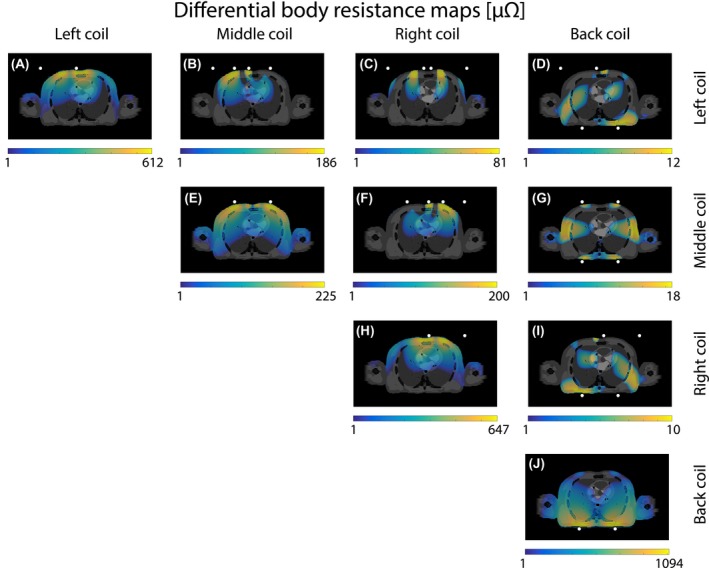
The differential (mutual) body resistance maps induced at mid‐ventilation by the interaction of four 15 cm loop coils. The white dots indicate the location of the coil. For clearer visualization, the overlay only shows the differential body resistance with an absolute value above 1 μΩ and a logarithmic scale was used
The differential body resistance maps of a transverse slice through the heart are shown on the diagonal of the body resistance matrix (see Figure 8A, E, H, and J). The highest differential body resistance intensity was observed close to the coil. On the off‐diagonal of Figure 8, the differential mutual body resistance maps of the same slice are depicted. Notice that the mutual body resistance was approximately 10 times larger for a left or right coil in combination with the middle coil (see Figure 8B and F) compared to any combination of a coil on the back and chest (see Figure 8D, G, and I). The spatial patterns of the mutual body resistance maps resembled the overlay of the high intensity regions of the differential body resistance maps of the individual coils. Hence, each differential mutual body resistance map had a distinct spatial pattern different from the pattern of the individual coils.
The mutual effective resistance calculated from the mutual body resistance over a single respiratory cycle is shown in Figure 9. Where the effective resistance of the individual coils was modulated by respiratory motion for all coils (see Figure 7), this was not obvious for the mutual effective resistance. The modulation depth was 5.9, 11.6, 5.2, 6.5, 2.1, and 6.3% for the mutual body resistance between middle‐left, left‐right, back‐left, middle‐right, back‐middle, and back‐right, respectively. These modulation depth values were similar to the single coil case. The respiratory motion curve could only be observed for a left‐right coil combination. The respiratory component seemed suppressed in the mutual effective resistance with respect to the cardiac component for a left‐middle and right‐middle coil combination.
Figure 9.
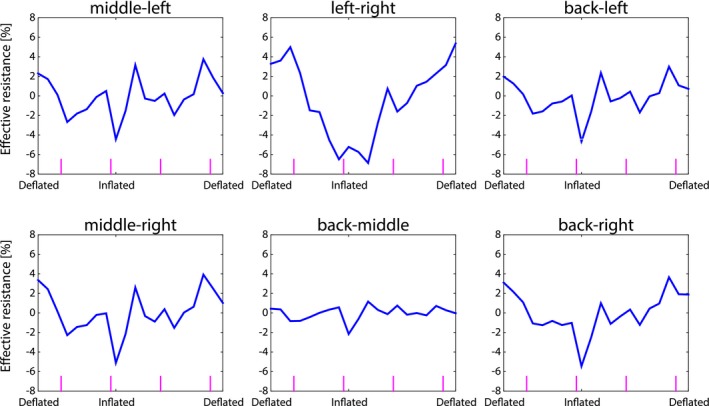
The mutual body resistance modulation of two coils as a function of respiratory phase. The vertical magenta lines indicate systole of the heart
5. DISCUSSION
For a deeper understanding of the potential and applications of physiologically induced thermal noise modulations, numerical electromagnetic simulations were performed on a digital human phantom. A number of specific aspects were investigated.
First of all, it was discovered that lung conductivity and permittivity variations over the respiratory cycle have a negligible contribution to the effective resistance of a coil compared to tissue displacement (see Figure 4). This is an important finding for motion tracking applications based on the noise navigator19 as it can be concluded that predominantly tissue displacement modulated the measured thermal noise (co)variances. Additionally aimed toward motion tracking applications, we also investigated the relations between the various NCM elements and their spatial motion sensitivity. Different elements of the NCM have distinct spatial sensitivity patterns (see Figure 8). This means that these elements are sensitive to motion in different regions of the body. This could be exploited in dense receiver arrays to create a specific spatial sensitivity, e.g. be only sensitive to a particular region of the lung or heart.
Secondly, it was observed that the coil size had an effect on the detected effective resistance modulation depth due to physiological motion. It was even observed that a 20 cm diameter coil was most sensitive to respiration, whereas a 10 cm diameter coil was more susceptible to cardiac motion while on the middle of the chest (see Figure 7B). This effect of coil size, however, depends strongly on the position of the coil with respect to the body. An illustrative example is the comparison between a coil on the chest moving along with respiratory motion (Figure 5B) and a stationary coil (Figure 5A). The stationary coil does not show any cardiac motion, solely respiration, for all simulated coil sizes. Additionally, the modulation depth was approximately 10 times larger. Both effects were caused by the fact that the stationary coil is only sensitive to superficial motion of the chest wall (see Figure 6C and F). At deflated phase the coil was 2.67 cm away from the chest, whereas at inflated phase the distance between the chest and coil was 3.32 cm. Compared to this alteration in distance between the body and coil, the contribution of internal tissue displacement to the effective resistance was negligible. For the stationary coil setup both simulated and measured data increased during inflation and decreased during deflation (see Figure 5A and C), like the input anterior‐posterior respiratory displacement curve (see Figure 2A) and respiratory bellows. The moving coil setup, however, is mainly sensitive to regions deeper within the body (see Figure 6I and L). Moreover, the effective resistance of a moving coil (see Figure 5B and D) resembles the input feet‐head respiratory displacement curve (see Figure 2A) and thus decreased during inflation and increased during deflation.
From Figure 5B it was seen that the effective resistance of a moving coil was modulated by both respiratory and cardiac motion. The thermal noise variance measured with a 15 cm diameter moving loop coil (see Figure 5D), however, only showed respiratory modulation. The estimation of the thermal noise variance is based on statistics and thus more noise samples included in the calculation lead to a more accurate variance estimation. In this specific case all noise samples within a dynamic (i.e. 181 ms) were used to calculate the variance. The relatively low temporal resolution with respect to the duration of the cardiac cycle means that inadvertently noise samples were averaged over a time period in which the heart shows considerable motion. Thus leading to smoothing. This smoothing effect is absent in the simulations, as they depict snapshots of the effective resistance and the stochastic nature of thermal noise is not present. In practice, for the measurements to match the simulations, it would be required to acquire an infinite amount of noise samples (for a perfect thermal noise variance estimation) instantly. An optimal trade‐off between the variance estimation accuracy and temporal resolution has to be found in order to detect cardiac motion. We believe this is possible as cardiac motion detection has already been shown with the reflected power method.16 For breathing this trade‐off is not such a large problem, since the time scale on which respiratory motion occurs is significantly larger than for cardiac motion.
As a matching circuit was not present in the simulation, it was added retrospectively. The used matching circuit was chosen, because it matched the real part of the impedance exactly to 50 Ω with a relatively small imaginary part. Furthermore, the modulation depth of the simulated effective resistance (i.e. including the matching circuit) and measured thermal noise variance was comparable for all setups (see Table 1). For additional, independent measurements validating the simulations on four more volunteers see Supporting Information Figure S2 and Table S2. The multiple coils simulation setup could not be experimentally validated, because only two loop coils were available for measurements. Performing subsequent measurements with different positions of two loops is not the same as the simulations with four coils. Coils that are present in the simulation, although not actively transmitting, will still influence the resulting electromagnetic fields due to their presence (as passive structures). The measurement and simulation setup would therefore not match and thus render the results incomparable.
The noise navigator is a passive method requiring no hardware modifications or RF excitation. Moreover, it is compatible with any MR image contrast and most readout strategies. For details on the incorporation of the noise navigator in an imaging sequence, the reader is referred to.2 In summary, the thermal noise variance is calculated over the proton‐free area per readout line, after spatially disentangling the MR signal and noise by a 1D Fourier transform. To ensure sufficient thermal noise samples oversampling is increased (i.e. equivalent to increasing the field‐of‐view in image space). This does not affect the signal‐to‐noise ratio as the number of samples in readout scales linearly with the increase in receive bandwidth.28
In the end, the optimal setup depends strongly on the desired motion to be measured. For respiratory motion detection a relatively small coil (i.e. 10 cm diameter) at a 3 cm distance away from the chest at mid‐ventilation had the highest modulation depth (see Figure 5A). This setup, however, is dominated by the respiratory induced chest motion (see Figure 6C and F). If respiratory motion of the internal tissues is of interest, then it would be better to have a larger coil (e.g. 20 cm diameter) on the chest moving along with the chest. Assuming enough samples could be acquired within a sufficiently short time period for cardiac motion detection, the thermal noise covariance elements could be useful. As was observed in Figure 9 middle‐left and middle‐right, the imprint of respiratory motion in the noise covariance elements was suppressed and cardiac motion was more pronounced. Through an optimized combination of receive coils in a dense receive array, the spatial sensitivity to motion can be controlled. This offers new ways to perform motion tracking using the elements of the NCM.19
6. CONCLUSION
Simulations and measurements were performed to investigate the effective resistance modulation induced by physiological motion. The largest contribution to the effective resistance originates from superficial structures (mainly muscle and skin) close to the coil. However, motion induced changes in the effective resistance mainly originate from deeper regions in the body. Through the mutual effective resistance modulation between two coils it becomes possible to suppress certain motion (e.g. breathing) and create a spatial selectivity to a particular regions (e.g. the heart). This phenomenon will be further investigated for applications as a surrogate for motion models.
Supporting information
TABLE S1 The simulated effective resistance and measured thermal noise variance modulation depth (in %) for a 15 cm diameter loop coil on different positions with respect to the body
FIGURE S1 The thermal noise variance modulation over the respiratory cycle at multiple positions for a single coil. The upper row shows volunteer 2 and the bottom row volunteer 3. The red dashed line is the respiratory bellows signal, whereas the blue solid line indicates the thermal noise variance
TABLE S2 The simulated and measured effective resistance modulation depth (in %). The mean effective resistance modulation depth agrees with the simulated values
FIGURE S2 The measured effective resistance (upper row) and effective resistance modulation (bottom row) measured with a network analyzer for a representative volunteer
ACKNOWLEDGMENTS
The authors would like to thank S. Gavazzi, D. Welting, and L. van Dijk for helpful discussions.
Navest RJM, Mandija S, Andreychenko A, et al. Understanding the physical relations governing the noise navigator. Magn Reson Med. 2019;82:2236–2247. 10.1002/mrm.27906
REFERENCES
- 1. Andreychenko A, Raaijmakers AJE, Sbrizzi A, et al. Thermal noise variance of a receive radiofrequency coil as a respiratory motion sensor. Magn Reson Med. 2017;77:221–228. [DOI] [PubMed] [Google Scholar]
- 2. Navest RJM, Andreychenko A, Lagendijk JJW, van den Berg CAT. Prospective respiration detection in magnetic resonance imaging by a non‐interfering noise navigator. IEEE Trans Med Imaging. 2018;37:1751–1760. [DOI] [PubMed] [Google Scholar]
- 3. Johnson JB. Thermal agitation of electricity in conductors. Phys Rev. 1928;32:97–109. [Google Scholar]
- 4. Nyquist H. Thermal agitation of electric charge in conductors. Phys Rev. 1928;32:110. [Google Scholar]
- 5. Redpath TW. Noise correlation in multicoil receiver systems. Magn Reson Med. 1992;24:85–89. [DOI] [PubMed] [Google Scholar]
- 6. Brown RW, Cheng YCN, Haacke EM, Thompson MR, Venkatesan R. In: Brown RW, Cheng YCN, Haacke EM, Thompson MR, Venkatesan R, eds. Magnetic Resonance Imaging. 2nd ed. Chichester, UK: Wiley; 2014. [Google Scholar]
- 7. Toso S, Piccoli A, Gusella M, et al. Altered tissue electric properties in lung cancer patients as detected by bioelectric impedance vector analysis. Nutrition. 2000;16:120–124. [DOI] [PubMed] [Google Scholar]
- 8. Zlochiver S, Arad M, Radai MM, et al. A portable bio‐impedance system for monitoring lung resistivity. Med Eng Phys. 2007;29:93–100. [DOI] [PubMed] [Google Scholar]
- 9. Bracco D, Revelly JP, Berger MM, Chiolero RL. Bedside determination of fluid accumulation after cardiac surgery using segmental bioelectrical impedance. Crit Care Med. 1998;26:1065–1070. [DOI] [PubMed] [Google Scholar]
- 10. Hoyle GE, Chua M, Soiza RL. Volaemic assessment of the elderly hyponatraemic patient: reliability of clinical assessment and validation of bioelectrical impedance analysis. QJM. 2011;104:35–39. [DOI] [PubMed] [Google Scholar]
- 11. Cumming K, Hoyle GE, Hutchison JD, Soiza RL. Bioelectrical impedance analysis is more accurate than clinical examination in determining the volaemic status of elderly patients with fragility fracture and hyponatraemia. J Nutri Health Aging. 2014;18:744–750. [DOI] [PubMed] [Google Scholar]
- 12. Bayford R, Tizzard A. Bioimpedance imaging: an overview of potential clinical applications. The Analyst. 2012;137:4635–4643. [DOI] [PubMed] [Google Scholar]
- 13. Nopp P, Rapp E, Pfützner H, Nakesch H, Ruhsam C. Dielectric properties of lung tissue as a function of air content. Phys Med Biol. 1993;38:699–716. [DOI] [PubMed] [Google Scholar]
- 14. Nopp P, Harris ND, Zhao TX, Brown BH. Model for the dielectric properties of human lung tissue against frequency and air content. Med Biol Eng Comput. 1997;35:695–702. [DOI] [PubMed] [Google Scholar]
- 15. Speier P, Fenchel M, Rehmer R. PT‐Nav: a novel respiratory navigation method for continuous acquisitions based on modulation of a pilot tone in the MR‐receiver. Magn Reson Mater Phys Biol Med. 2015;28:S97–S98. [Google Scholar]
- 16. Buikman D, Helzel T, Röschmann P. The RF coil as a sensitive motion detector for magnetic resonance imaging. Magn Reson Imaging. 1988;6:281–289. [DOI] [PubMed] [Google Scholar]
- 17. Hess AT, Tunnicliffe EM, Rodgers CT, Robson MD. Diaphragm position can be accurately estimated from the scattering of a parallel transmit RF coil at 7 T. Magn Reson Med. 2018;79:2164–2169. [DOI] [PMC free article] [PubMed] [Google Scholar]
- 18. Graesslin I, Glaesel D, Börnert P, et al. An alternative concept of non‐sequence‐interfering patient respiration monitoring. In Proceedings of the International Society for Magnetic Resonance in Medicine, 2008; Toronto. Abstract 202.
- 19. Andreychenko A, Denis de Senneville B, Navest RJM, Tijssen RHN, Lagendijk JJW, van den Berg CAT. Respiratory motion model based on the noise covariance matrix of a receive array. Magn Reson Med. 2018;79:1730–1735. [DOI] [PubMed] [Google Scholar]
- 20. Kubo R. The fluctuation‐dissipation theorem. Rep Progress Phys. 1966;29:306. [Google Scholar]
- 21. Roemer PB, Edelstein WA, Hayes CE, Souza SP, Mueller OM. The NMR phased array. Magn Reson Med. 1990;16:192–225. [DOI] [PubMed] [Google Scholar]
- 22. Brown R, Wang Y, Spincemaille P, Lee RF. On the noise correlation matrix for multiple radio frequency coils. Magn Reson Med. 2007;58:218–224. [DOI] [PubMed] [Google Scholar]
- 23. Segars WP, Sturgeon G, Mendonca S, Grimes J, Tsui BMW. 4D XCAT phantom for multimodality imaging research. Med Phys. 2010;37:4902–4915. [DOI] [PMC free article] [PubMed] [Google Scholar]
- 24. Blaney F, English CS, Sawyer T. Sonographic measurement of diaphragmatic displacement during tidal breathing manoeuvres—a reliability study. Aust J Physiother. 1998;44:41–43. [DOI] [PubMed] [Google Scholar]
- 25. Gabriel C. Compilation of the dielectric properties of body tissues at RF and microwave frequencies. Texas: Air Force materiel command. Brooks Air Force Base. 1996;272. [Google Scholar]
- 26. Ehman RL, McNamara MT, Pallack M, Hricak H, Higgins CB. Magnetic resonance imaging with respiratory gating: techniques and advantages. Am J Roentgenol. 1984;143:1175–1182. [DOI] [PubMed] [Google Scholar]
- 27. Runge VM, Clanton JA, Partain CL, James AE. Respiratory gating in magnetic resonance imaging at 0.5 Tesla. Radiology. 1984;151:521–523. [DOI] [PubMed] [Google Scholar]
- 28. Parker DL, Gullberg GT. Signal‐to‐noise efficiency in magnetic resonance imaging. Med Phys. 1990;17:250–257. [DOI] [PubMed] [Google Scholar]
Associated Data
This section collects any data citations, data availability statements, or supplementary materials included in this article.
Supplementary Materials
TABLE S1 The simulated effective resistance and measured thermal noise variance modulation depth (in %) for a 15 cm diameter loop coil on different positions with respect to the body
FIGURE S1 The thermal noise variance modulation over the respiratory cycle at multiple positions for a single coil. The upper row shows volunteer 2 and the bottom row volunteer 3. The red dashed line is the respiratory bellows signal, whereas the blue solid line indicates the thermal noise variance
TABLE S2 The simulated and measured effective resistance modulation depth (in %). The mean effective resistance modulation depth agrees with the simulated values
FIGURE S2 The measured effective resistance (upper row) and effective resistance modulation (bottom row) measured with a network analyzer for a representative volunteer


