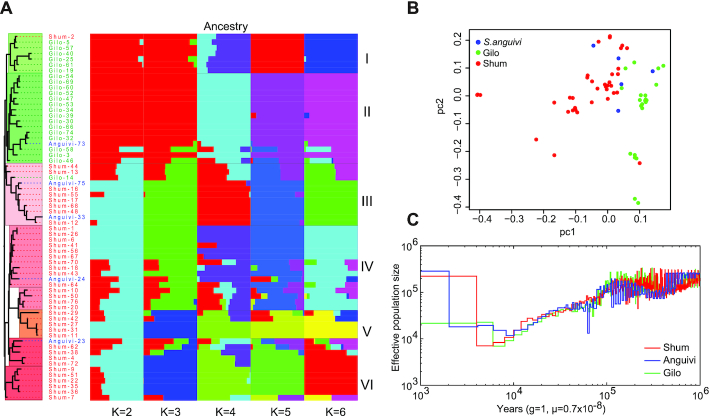
Figure 5:
Population structure and demographic history of Solanum aethiopicum. (A) A maximum-likelihood phylogenetic tree and population structure constructed using the full set of single-nucleotide polymorphisms (SNPs). (B) Principal component analysis (PCA). (C) Pairwise sequential Markovian coalescent model analysis indicated a distinct demographic history of S. aethiopicum from 10,000 to 100 years ago, in which a bottleneck was shown ∼4,000–5,000 years ago, followed by an immediate expansion of population size.

