Abstract
Aberrant expression of long noncoding RNAs (lncRNAs) contributes to all phenotypes of cancer including metastasis, which is a major cause of death in many advanced malignancies. One particular lncRNA, H19, is found to be a crucial player in cancer progression by modulating multiple microRNAs (miRNAs). In this study, we screened miRNAs possibly associated with H19 using lung carcinoma cell lines and patient with lung cancer tissues, and selected one possible hit, hsa‐miR‐6515‐3p, to perform in vitro functional assays. Its inhibition leads to decreased proliferation and migration of SPC‐A1 lung cancer cells and is in good correlation with H19‐knockdown groups. These results indicate that H19 may be an epigenetic regulator of miR‐6515‐3p, and its dysregulation may contribute to lung cancer progression and metastasis.
Keywords: hsa‐miR‐6515‐3p, lncRNA H19, lung cancer, SPC‐A1
1. INTRODUCTION
According to the latest GLOBOCAN 2018 data published recently,1 lung cancer is ranked on top of the most common cancers in men and third in women worldwide. In 2018, 2.1 million new lung cancer cases and 1.8 million death is predicted. Despite the efforts devoted to tobacco control and advances made for new therapies, the global incidence and death estimations of lung cancer had increased from GLOBOCAN's last survey in 2012.2 A dismal aspect about lung cancer is that it has relatively high frequency of metastases among major solid malignant tumor types.3 Fortunately, past few years have seen significantly prolonged survival of advanced patients with non–small cell lung carcinoma (NSCLC) via novel treatments, notably the paradigm‐shifting immune checkpoint blockade therapy based on PD‐1/PD‐L1 inhibitors.4, 5, 6 Nonetheless, a vast majority of patients with cancer with late‐stage metastasis are beyond cure under the current treatment regimes. It remains of paramount importance to elucidate the mechanisms of lung cancer development, progression, and metastasis.
Long noncoding RNA (lncRNA; transcript >200 nucleotides in length that does not appear to contain a protein‐coding sequence) constituents an enormous and diverse class of genome transcripts.7 Among the versatile biological roles lncRNAs are discovered to play,8, 9 their function as epigenetic regulator and aberrant expression link to cancer had been well recognized as increasing evidence emerged in recent years.8, 10 A pan‐cancer analysis has found that hundreds of dysregulated lncRNAs operate as ensembles to dysregulate cancer genes and pathways by altering the activity of transcription factors, RNA‐binding proteins, and microRNAs (miRNAs) in multiple tumor contexts.11 Notably, by acting as miRNA decoys/sponges, messenger RNA (mRNA) binding competitors, and miRNA precursors, the lncRNA regulation of miRNA has profound influence on various aspects of cancer.12 Due to the complex nature of this regulatory network, many key lncRNA‐miRNA interactions in cancer are yet to be identified and clarified.
H19 is an intergenic lncRNA and a major gene in cancer that plays pivotal roles in tumorigenesis.13, 14 It has been found to promote cell proliferation, enhance tumor metastasis, and/or promote epithelial to mesenchymal transition (EMT) in the bladder,15, 16 gastric,17 pancreatic,18, 19 colorectal,20, 21 and other cancers. In lung cancer, accumulating studies have demonstrated that the potential crosstalk between H19 and multiple miRNAs may contribute to tumor progression. For instance, H19 may promote lung cancer development via sponging miR‐1722 or miR‐196b,23 or promote EMT through regulating miR‐48424 and miR‐203.25 The prognostic value of the correlation between H19 and let‐7 has also been probed.26 Taken together, these preliminary results suggest that overexpression of H19 and its aberrant modulation of related miRNAs exert oncogenic functions in lung cancer. However, a comprehensive understanding of the H19‐miRNA network in lung cancer is not established which requires further characterization.
In the presented study, we constructed miRNA expression profile in a H19‐knockdown lung carcinoma cell line (SPC‐A1) to identify candidate miRNAs whose expression has been altered and further validated the results using tissue specimens from patients with lung cancer. We found that hsa‐miR‐6515‐3p, which is not seen in previous reports, has been significantly downregulated in H19‐knockdown cell lines and upregulated in clinical samples. Subsequent functional assays demonstrated that inhibition of miR‐6515‐3p resulted in decrease capabilities of SPC‐A1 on proliferation, migration, and invasion.
2. MATERIALS AND METHODS
2.1. Cell culture
Human lung cancer cell lines A549, H1299, and SPC‐A1 immortalized human bronchial/lung cell line BEAS‐2B, and gastric cancer cell line SGC7901 were purchased from Cell Bank of Shanghai Institute for Biological Sciences, National Infrastructure of Cell Line Resource. These cell lines are cultured a humidified incubator (Forma 4111; Thermo Fisher Scientific) at 37°C with 5% CO2, in Dulbecco's modified Eagle's medium (with 4.5 g/L glucose; Cat No 15‐017‐CVR; Corning) or Roswell Park Memorial Institute 1640 medium (Cat No 10‐043‐CVR; Corning) supplemented with 10% fetal bovine serum (FBS; Cat No 10099‐141; Gibco). Subculture passage is performed in every 2 or 3 days.
2.2. Human tissue specimens
Tissues from patients with lung cancer in Taizhou Hospital (Zhejiang Province, China) were immediately frozen in liquid nitrogen and were stored at −80°C until further use. Forty‐seven pathologically diagnosed specimens were acquired from patients with lung cancer.
2.3. RNA extraction
Total RNA was extracted from the cultured cells or tissue samples using the TRIzol reagent (Cat No 15596‐026; Thermo Fisher Scientific) following the product's official user guide. The miRNA was extracted and purified using miRNeasy Micro Kit (Cat No 217084; Qiagen) according to the protocol provided by the manufacturer. Extracted RNA purity was examined using a NanoDrop 2000c (Thermo Fisher Scientific) by measuring the 260/280 absorbance ratio.
2.4. Quantitative real‐time polymerase chain reaction
For lncRNA, 2 µg of the extracted total RNA was reverse‐transcribed to complementary DNA (cDNA) using the High Capacity cDNA Reverse Transcription Kit (Cat No 4368814; Thermo Fisher Scientific). Next, the target cDNA level in the RT product was determined by quantitative polymerase chain reaction (qPCR) using the UltraSYBR Mixture (Cat No CW0957M; CW Biotech). For miRNA, 2 µg of the extracted miRNA were reverse‐transcribed to cDNA using the miRNA specific RT Primer provided in the Bulge‐Loop miRNA quantitative real‐time PCR (qRT‐PCR) Kit (RiboBio). Next, the target cDNA level in the RT product was determined by qRT‐PCR using the miRNA specific forward primer, the universal reverse primer and Taq‐containing SYBR Green Mix provided in the same qRT‐PCR Kit. All RT amplifications were performed on an ABI 9700 thermocycler (Thermo Fisher Scientific). All qPCR assays were performed on a LightCycler 480 Instrument II System (Roche), while β‐actin mRNA and U6 small nuclear RNA was used as an endogenous control for lncRNA and miRNA assays, respectively. The primer sequences for qPCR are listed in Table 1.
Table 1.
Primer sequences for quantitative real‐time PCR
| Primer designation | Sequence |
|---|---|
| H19 Fw | GACATCTGGAGTCTGGCAGG |
| H19 Rv | CTGCCACGTCCTGTAACCAA |
| β‐Actin Fw | CACCAACTGGGACGACAT |
| β‐Actin Rv | ACAGCCTGGATAGCAACG |
| U6 Fw | ATTGGAACGATACAGAGAAGATT |
| U6 Rv | GGAACGCTTCACGAATTTG |
| hsa‐miR‐4500 Fw | CGTCGCACTGTGAGGTAGTAG |
| hsa‐miR‐4500 Rv | TATGCTTGTTCTCGTCTCTGTGTC |
| hsa‐miR‐5194 Fw | ACTGTGAGGGGTTTGGAATG |
| hsa‐miR‐5194 Rv | TATGCTTGTTCTCGTCTCTGTGTC |
| hsa‐miR‐6129 Fw | TGTCTCTGTGAGGGAGTTGGG |
| hsa‐miR‐6129 Rv | TATGCTTGTTCTCGTCTCTGTGTC |
| hsa‐miR‐6515‐3p Fw | GTCGCACTGTCTCTTCATCTACC |
| hsa‐miR‐6515‐3p Rv | TATGCTTGTTCTCGTCTCTGTGTC |
| hsa‐miR‐3611 Fw | GTCGCATGTTGTGAAGAAAGAAA |
| hsa‐miR‐3611 Rv | TATGCTTGTTCTCGTCTCTGTGTC |
| hsa‐miR‐518d‐5p Fw | GCTCAGTCTCTAGAGGGAAGCAC |
| hsa‐miR‐518d‐5p Rv | TATGCTTGTTCTCGTCTCTGTGTC |
| hsa‐miR‐574‐5p Fw | GCTCAGTCTCTAGAGGGAAGCAC |
| hsa‐miR‐574‐5p Rv | TATGCTTGTTCTCGTCTCTGTGTC |
Abbreviation: PCR, polymerase chain reaction.
2.5. RNA interference and transfection
We designed two small interfering RNA (siRNA) targeting the H19 lncRNA designated siH19‐1 and siH19‐2, and a control RNA designated siNC (see Table 2 for the sequences), and have them synthesized (RiboBio). Cells were seeded in a six‐well plate and transfected 24 hours later with 10 nM siRNA using the Lipofectamine RNAiMax Transfection Reagent (Cat No 13778030; Thermo Fisher Scientific) following the manufacturer's instructions. The cells were harvested 72 hours after transfection for RNA extraction.
Table 2.
Sequences for RNAi
| siRNA designation | Sequence |
|---|---|
| siH19‐1 sense | GCAAGAAGCGGGUCUGUUU |
| siH19‐1 antisense | AAACAGACCCGCUUCUUGC |
| siH19‐2 sense | CCAACAUCAAAGACACCAU |
| siH19‐2 antisense | AUGGUGUCUUUGAUGUUGG |
Abbreviation: RNAi, RNA interference.
Mimics and inhibitors to specific miRNAs along with appropriate controls were obtained commercially (RiboBio). Cultured cells were transfected after 24 hours with mimics, inhibitors, or controls (final concentration varies in different experiment settings) using the Lipofectamine 3000 Transfection Reagent (Cat No L3000008; Thermo Fisher Scientific) following the manufacturer's instructions.
2.6. Microarray profiling of miRNA expression
The miRNA expression profile was obtained by high‐throughput microarray analysis using the UniTag label‐free human miRNA array (miRBase 19 version; EigenBio). Two micrograms of total RNA extracted from cells and 100 nM (final concentration) Cy3‐labeled reporter DNA (UniTag) were dissolved in the hybridization buffer, then the mixtures were applied to the microarray slides, incubated for 48 hours at 44°C in a hybridization oven (Agilent 2545A). After hybridization, slides were scanned at 532 nm excitation using a GenePix 4100A Microarray Scanner (Molecular Devices) with fixed laser power and PMT gain settings. The acquired raw images were processed by the GenePix Pro 7.0 software package to extract the fluorescence signals of each spot, then the data was normalized and analyzed using the R statistical package to get final results.
2.7. Cell proliferation by 5‐ethynyl‐2′‐deoxyuridine incorporation assay
SPC‐A1 cells cultured in 96‐well microplates (Cat No 655090; Greiner) were transfected with miRNA mimics or inhibitors 24 hours after seeding. At different timepoints after transfection, de novo synthesized DNA in the S phase cells were stained using the Cell‐Light EdU Apollo643 In Vitro Imaging Kit (Cat No C10310‐2; RiboBio) based on the method established by Salic et al.27 Briefly, each culture well was added with 100 μL 50 μM 5‐ethynyl‐2′‐deoxyuridine (EdU) diluted in culture media, then incubated for 2 hours and washed with phosphate‐buffered saline. Fix and permeabilize the cells with paraformaldehyde and Triton X‐100. Next, add 100 μL 1X Apollo dye to stain the replicating DNA for 30 minutes followed by nuclear staining using Hoechst 33342. After the final wash, dual channel fluorescent images of the stained cells were captured using an Operetta CLS High‐content Analysis System (PerkinElmer). Under a 10× objective, a grid of 21 fields were imaged for each well to cover nearly the whole bottom area to eliminate the bias associated with insufficient sampling. The total cell number and EdU positive cell number per well were counted by the Harmony High Content Imaging and Analysis Software (PerkinElmer). The proliferating ratio in each well was calculated as (number of EdU+cells/number of Hoechst stained cells) × 100%.
2.8. Cell proliferation, migration, and invasion by real‐time cell analysis
These assays are all performed using cultured SPC‐A1 cells on an xCELLigence DP Real‐Time Cell Analyzer (RTCA; ACEA Biosciences) placed within a CO2 incubator (Forma 4111; Thermo Fisher Scientific).
For the proliferation assay, cells were seeded at 1 × 10⁴ per well in E‐Plate 16 VIEW plates (ACEA Biosciences). Then the loaded plates were mounted on the RTCA instrument inside the incubator. After 24 hours cell adherence, miRNA‐ or siRNA‐lipofectamine complexes were added. Cell index (CI; ie, relative cell impedance) values were monitored every 20 minutes for 72 hours and normalized.
For the migration assay, cells were seeded at 5 × 10⁴ per well in the upper chamber of CIM‐Plate 16 plates (ACEA Biosciences) with serum‐free medium and assembled with the lower chamber filled with FBS‐containing medium. Then the assembly were mounted on the RTCA instrument inside the incubator. After 24 hours, miRNA‐ or siRNA‐lipofectamine complexes were added. CI (ie, relative cell impedance) values were monitored every 20 minutes for 72 hours and normalized.
The invasion assay is performed in a similar manner to the migration assay except for the upper chamber is coated with the Matrigel basement membrane matrix (Cat No 354234; BD) before cell addition.
2.9. Data analysis and statistics
All qRT‐PCR and RTCA experiments are run in triplicate. The imaging assay are run in quadruplicate. The qPCR data were analyzed using the method. Statistical significance was determined by performing a two‐tail, two sample t test in Microsoft Excel, with α = .05. An F test is performed before t test to determine either equal or unequal variance assumption should be used.
3. RESULTS
3.1. Knockdown of H19 in selected lung cancer cell line with overexpressed H19
Three lung cancer cell lines (A549, H1299, and SPC‐A1) were tested for their H19 mRNA level by qRT‐PCR, while primary and immortalized human bronchial/lung epithelial cell line BEAS‐2B and gastric cancer cell line SGC7901 served as low‐ and high H19 expression control, respectively. The result (Figure 1) shows that transcription of H19 is high in SPC‐A1 and SGC7901 but low in A549 and H1299 cell lines, which is consistent with previous reports.28 Hence, we select SPC‐A1 as the H19 overexpression lung cancer cell line to conduct this study.
Figure 1.
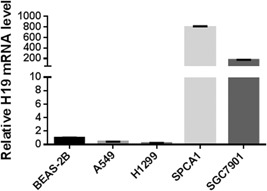
Relative H19 mRNA expression level in different cell lines. BEAS‐2B, immortalized normal lung cells; A549 / H1299 / SPC‐A1, lung carcinoma; SGC7901, gastric cancer. mRNA, messenger RNA
Transfection of the two siRNAs designed for H19 to SPC‐A1 cells has effectively knocked down the expression of H19 in both cases (Figure 2), and siH19‐1 was chosen as H19 RNA interference (RNAi) reagent throughout later experiments.
Figure 2.
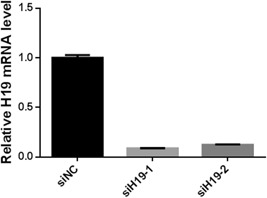
Relative H19 mRNA expression level in siRNA transfected SPC‐A1 cells: siNC is a negative control, siH19‐1, and siH19‐2 were two siRNAs designed against lncRNA H19. lncRNA, long noncoding RNA; mRNA, messenger RNA; siRNAs, small interfering RNAs
3.2. Screen of differentially expressed miRNA in H19‐knockdown SPC‐A1 cells
The miRNA expression in normal and H19‐knockdown SPC‐A1 cell lines were profiled by microarray analysis. In over 2000 human miRNAs, 92 miRNAs were found to have 1.5 or higher fold change between the two cell lines. Among them, some were closely related to previously reported miRNAs that were affected by H19 in lung cancer, such as let‐7e‐3p, miR‐196a‐5p, and miR‐203a. We choose seven miRNAs with high fold change and scarcely seen in previous publications to perform qRT‐PCR verification using tumor tissue sections from three patients with lung cancer and negative control. Among the selected miRNAs, six (miR‐574‐5p, miR‐3611, miR‐6515‐3p, miR‐518d‐5p, miR‐6129, and miR‐5194) were downregulated in H19‐knockdown SPC‐A1 cell lines (indicates overexpression in normal H19 cancer cells); while the other one (miR‐4500) were upregulated. When the obtained fold change of the above miRNA level in tissue sections (Figure 3) are compared with those from SPC‐A1 cell line experiments, inconsistency of fold change direction was observed for four miRNAs (miR‐4500, miR‐518d‐5p, miR‐6129, and miR‐5194), which were then discarded from further investigation. Of the left three, the data for miR‐574 and miR‐3611 show relatively large variation for the three patients and these two were also excluded. Therefore, miR‐6515‐3p was selected to conduct follow‐up research.
Figure 3.
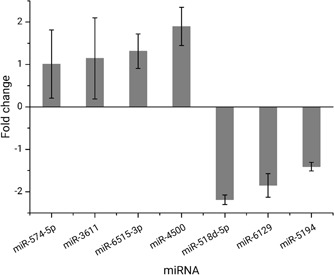
Fold change of seven selected miRNAs in FFPE tissue sections obtained by qPCR. FFPE; miRNAs, microRNAs; qPCR, quantitative polymerase chain reaction
3.3. Examination of H19 and miR‐6515‐3p expression in patients with lung cancer
To assess the in vivo expression of H19 and miR‐6515‐3p in lung carcinoma, FFPE sections from 47 patients with different types (17 lung adenocarcinoma [LUAD], 1 lung adenosquamous carcinoma, and 27 lung squamous cell carcinoma [LUSC] patients constitute the NSCLC group, in addition to a SCLC group of two patients) and stages (25 metastatic stage III and IV, and 22 nonmetastatic stage I and II) of lung cancer were analyzed by qRT‐PCR. From the results (Figure 4) we observed that H19 lncRNA and miR‐6515‐3p miRNA were both upregulated in general. Although it is difficult to draw a clear correlation between tumor progression and the fold change of H19 or miR‐6515‐3p from this small cohort, it seems that H19 is more likely to overexpress in LUAD patients, while miR‐6515‐3p is more likely to overexpress in LUSC patients.
Figure 4.
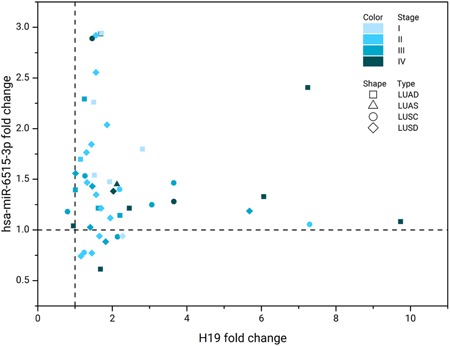
Fold change of H19 and hsa‐miR‐6515‐3p mRNA level in FFPE tumor specimens from patients with lung cancer of different types and stages (I‐IV), determined by qRT‐PCR. FFPE; LUAD, lung adenocarcinoma; LUAS, lung adenosquamous carcinoma; LUSC, lung squamous cell carcinoma; mRNA, messenger RNA; qRT‐PCR, quantitative real‐time polymerase chain reaction; SCLC, small cell lung cancer
3.4. Possible involvement of miR‐6515‐3p in lung cancer cell proliferation, migration, and invasion
Previous studies have established the linkage between lncRNA H19 and progression/metastasis of various cancers. As miRNA miR‐6515‐3p is downregulated in H19‐knockdown SPC‐A1 cell line, we speculate that it may be one of the miRNAs affected by H19 overexpression. To test whether this miRNA actively participates in tumor progression, we conducted functional assays on SPC‐A1 cell lines using a miRNA inhibitor designed for miR‐6515‐3p. First, we investigated the dose‐effect of this inhibitor by EdU cell proliferation assay with 72 hours duration. The data (Figure 5) shows that the proliferation is effectively suppressed over incubation time for input inhibitor concentrations above 50 nM. Typical micrographs of the EdU assay were shown in Figure 6.
Figure 5.
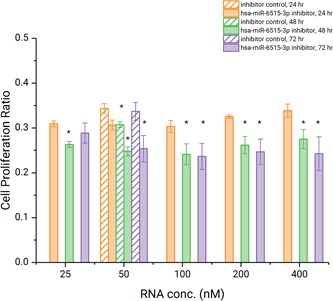
SPC‐A1 cell proliferation after transfection of different amounts of miR‐6515‐3p inhibitor, quantified at 24, 48, and 72 hours by the EdU assay. The 48 and 72 hours data were compared with the 24 hours data by t test, and those with a P < .05 is denoted with an asterisk (*) mark. EdU, 5‐ethynyl‐2′‐deoxyuridine
Figure 6.
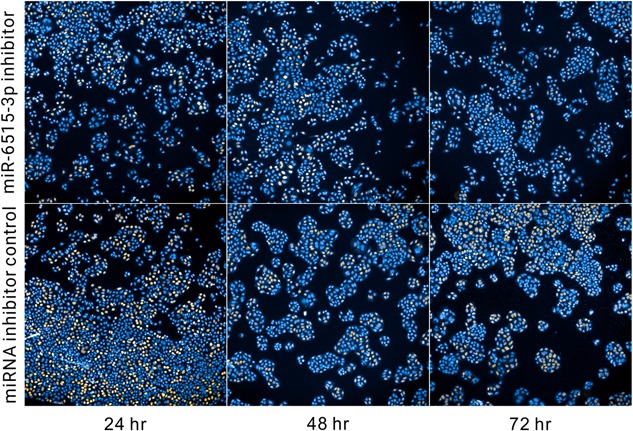
Typical fluorescent micrographs from the EdU cell proliferation assay. The concentration for miR‐6515‐3p inhibitor is 100 nM and for control is 50 nM. EdU, 5‐ethynyl‐2′‐deoxyuridine
Next, we use the RTCA platform to evaluate the phenotypical changes of SPC‐A1 on proliferation, migration, and invasion after RNAi of miR‐6515‐3p, and compared the results with that obtained in parallel after H19 knockdown. A miRNA inhibitor or siRNA concentration of 100 nM was used for transfection throughout all these assays. The real‐time CI value were recorded for 96 hours and their kinetic changes were shown in Figure 7. Figure 7A shows that after transfection of either H19 siRNA or miR‐6515‐3p inhibitor, the tumor cell proliferation decreased gradually, albeit at different rates, by 8% and 16% compared with controls at the 96 hours endpoint. Notably, here the inhibition of miR‐6515‐3p impaired the proliferation of SPC‐A1, which is similar to the observation from the EdU assay. In Figure 7B, miR‐6515‐3p inhibitor transfected cells exhibit a decline of migration signal of 10% compared with the control at the endpoint, while knockdown of H19 lead to a 6% decline of migration signal. However, we did not observe the difference of cell invasion through the Matrigel for the H19 knockdown or miR‐6515‐3p inhibited cells as compared with the corresponding controls (Figure 7C).
Figure 7.
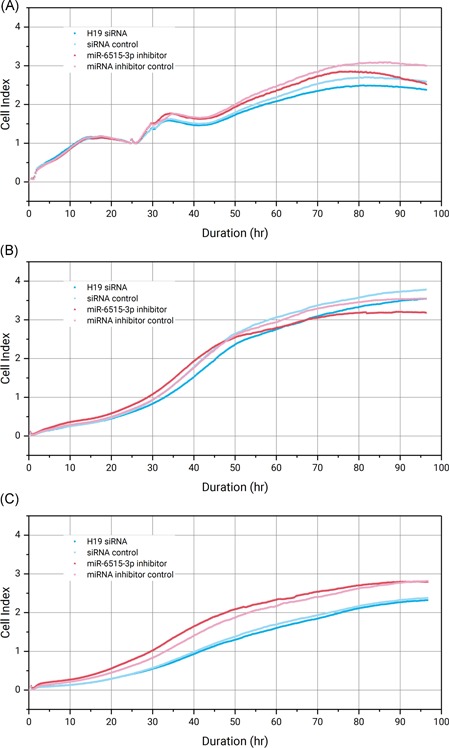
Real‐time monitoring of SPC‐A1 cell proliferation (A), migration (B), and invasion (C) after transfection with 100 nM H19 siRNA or miR‐6515‐3p inhibitor with a duration of 96 hours. The CI values in (A) were normalized to the time point at which transfection reagents were added (24 hours). CI, cell index; miRNA, microRNA; siRNA, small interfering RNA
To summarize, inhibition of the miRNA miR‐6515‐3p in SPC‐A1 has decreased its proliferation and migration, yet no effect on invasion was observed. When these results are corroborated with the data from the H19 siRNA transfected cells run in parallel, a correlation can be clearly seen. Considering that miR‐6515‐3p is downregulated in H19‐knockdown SPC‐A1 and generally overexpressed in H19 upregulated patients with lung cancer, this correlation strongly suggests a hidden link between H19 and miR‐6515‐3p, which may actively contribute to the progression of lung cancers.
4. DISCUSSION
As pointed by Popper,29 metastasis in lung cancer is a multifaceted and multistep process with many genes, cytokines, adhesion molecules, and receptors involved in, which act their roles through various mechanisms and pathways not fully elucidated to date. A recently found novel type of the backstage modulators orchestrating such complex interplay is the lnRNA, which is identified as an active driver of all the cancer phenotype circuits, such as proliferation, angiogenesis, and motility, and so on.30 One of the cancer‐associated lncRNA, H19, has been found to be prometastatic in nature, and high level of H19 was observed in the metastatic sites in animal models and human biopsies. According to a unifying theory suggested by Raveh et al,14 H19 has two major functions as follows, a reservoir of miR‐675 that suppresses its target, and a modulator of miRNAs or proteins via their binding. In the latter case, H19 acts as a miRNA decoy and suppress their activity.
In the present study, SPC‐A1 was selected among several lung carcinoma cell lines because it has high expression of H19. Next, we screened the miRNAs with differential expression accompanying knockdown of H19 in SPC‐A1. Yet, miR‐675 is not one of them, which indicate that in SPC‐A1 the loss of this miRNA may be remedied by other biological cues. Further research is focused on miR‐6515‐3p, whose expression diminished with knockdown of H19. Data from tumor tissue specimens illustrated that the expression levels of both H19 and miR‐6515‐3p are elevated in patients with lung cancer, albeit a strong correlation is not observed. Because miR‐6515‐3p has barely been reported in the literature, its role in cancer progression is largely unknown. We conducted preliminary investigation on this miRNA through in vitro functional assays, and the results show that in SPC‐A1 the capacities of proliferation and migration are weakened by inhibition of miR‐6515‐3p, while the capacity of invasion seems to be intact. Importantly, these phenotypes are in high accordance with those obtained by RNAi of H19, indicating a possible pathway that H19 promotes lung cancer progression and metastasis via its interaction with miR‐6515‐3p.
CONFLICT OF INTERESTS
The authors declare that there are no conflict of interests.
AUTHOR CONTRIBUTIONS
YZX had full access to all of the data in the study and takes responsibility for the integrity of the data and the accuracy of the data analysis and contributed to obtaining tissue specimens of patients from Taizhou Hospital and to project oversight, organization, data collection, statistical analysis, and writing of the manuscript. JL contributed to tissue specimen and cell experiment. YYJ contributed to the writing of the manuscript, statistical analysis, and data collection. MC contributed to cell experiment and analysis. HHZ contributed to tissue specimen experiment and analysis. JXF contributed to patients’ management and manuscript preparation and review.
ACKNOWLEDGMENT
This work was supported by the Taizhou Science and Technology Plan Project (no. 162yw01), and it was partly supported by Medical and Health Science and Technology Project of Zhejiang province (No. 2019KY771).
Xu Y, Lin J, Jin Y, Chen M, Zheng H, Feng J. The miRNA hsa‐miR‐6515‐3p potentially contributes to lncRNA H19‐mediated‐lung cancer metastasis. J Cell Biochem. 2019;120:17413‐17421. 10.1002/jcb.29006
References
REFERENCES
- 1. Bray F, Ferlay J, Soerjomataram I, Siegel RL, Torre LA, Jemal A. Global cancer statistics 2018: GLOBOCAN estimates of incidence and mortality worldwide for 36 cancers in 185 countries. CA Cancer J Clin. 2018;68:394‐424. [DOI] [PubMed] [Google Scholar]
- 2. Torre LA, Bray F, Siegel RL, Ferlay J, Lortet‐Tieulent J, Jemal A. Global cancer statistics, 2012. CA Cancer J Clin. 2015;65:87‐108. [DOI] [PubMed] [Google Scholar]
- 3. Budczies J, von Winterfeld M, Klauschen F, et al. The landscape of metastatic progression patterns across major human cancers. Oncotarget. 2015;6:570‐583. [DOI] [PMC free article] [PubMed] [Google Scholar]
- 4. Reck M, Rodríguez‐Abreu D, Robinson AG, et al. Pembrolizumab versus chemotherapy for PD‐L1–positive non–small‐cell lung cancer. N Engl J Med. 2016;375:1823‐1833. [DOI] [PubMed] [Google Scholar]
- 5. Borghaei H, Paz‐Ares L, Horn L, et al. Nivolumab versus docetaxel in advanced nonsquamous non–small‐cell lung cancer. N Engl J Med. 2015;373:1627‐1639. [DOI] [PMC free article] [PubMed] [Google Scholar]
- 6. Rittmeyer A, Barlesi F, Waterkamp D, et al. Atezolizumab versus docetaxel in patients with previously treated non‐small‐cell lung cancer (OAK): a phase 3, open‐label, multicentre randomised controlled trial. The Lancet. 2017;389:255‐265. [DOI] [PMC free article] [PubMed] [Google Scholar]
- 7. Mattick JS, Rinn JL. Discovery and annotation of long noncoding RNAs. Nat Struct Mol Biol. 2015;22:5‐7. [DOI] [PubMed] [Google Scholar]
- 8. Mercer TR, Mattick JS. Structure and function of long noncoding RNAs in epigenetic regulation. Nat Struct Mol Biol. 2013;20:300‐307. [DOI] [PubMed] [Google Scholar]
- 9. Quinn JJ, Chang HY. Unique features of long non‐coding RNA biogenesis and function. Nat Rev Genet. 2015;17:47‐62. [DOI] [PubMed] [Google Scholar]
- 10. Huarte M. The emerging role of lncRNAs in cancer. Nature Med. 2015;21:1253‐1261. [DOI] [PubMed] [Google Scholar]
- 11. Chiu H‐S, Somvanshi S, Patel E, et al. Pan‐cancer analysis of lncRNA regulation supports their targeting of cancer genes in each tumor context. Cell Rep. 2018;23:297‐312.e12. [DOI] [PMC free article] [PubMed] [Google Scholar]
- 12. Yoon J‐H, Abdelmohsen K, Gorospe M. Functional interactions among microRNAs and long noncoding RNAs. Semin Cell Dev Biol. 2014;34:9‐14. [DOI] [PMC free article] [PubMed] [Google Scholar]
- 13. Barsyte‐Lovejoy D, Lau SK, Boutros PC, et al. The c‐Myc oncogene directly induces the H19 noncoding RNA by Allele‐specific binding to potentiate tumorigenesis. Cancer Res. 2006;66:5330‐5337. [DOI] [PubMed] [Google Scholar]
- 14. Raveh E, Matouk IJ, Gilon M, Hochberg A. The H19 long non‐coding RNA in cancer initiation, progression and metastasis—a proposed unifying theory. Mol Cancer. 2015;14:184. [DOI] [PMC free article] [PubMed] [Google Scholar]
- 15. Luo M, Li Z, Wang W, Zeng Y, Liu Z, Qiu J. Long non‐coding RNA H19 increases bladder cancer metastasis by associating with EZH2 and inhibiting E‐cadherin expression. Cancer Lett. 2013a;333:213‐221. [DOI] [PubMed] [Google Scholar]
- 16. Luo M, Li Z, Wang W, Zeng Y, Liu Z, Qiu J. Upregulated H19 contributes to bladder cancer cell proliferation by regulating ID2 expression. FEBS J. 2013b;280:1709‐1716. [DOI] [PubMed] [Google Scholar]
- 17. Zhou X, Ye F, Yin C, Zhuang Y, Yue G, Zhang G. The interaction between MiR‐141 and lncRNA‐H19 in regulating cell proliferation and migration in gastric cancer. Cell Physiol Biochem. 2015;36:1440‐1452. [DOI] [PubMed] [Google Scholar]
- 18. Ma C, Nong K, Zhu H, et al. H19 promotes pancreatic cancer metastasis by derepressing let‐7's suppression on its target HMGA2‐mediated EMT. Tumor Biol. 2014;35:9163‐9169. [DOI] [PubMed] [Google Scholar]
- 19. Ma L, Tian X, Wang F, et al. The long noncoding RNA H19 promotes cell proliferation via E2F‐1 in pancreatic ductal adenocarcinoma. Cancer Biol Ther. 2016;17:1051‐1061. [DOI] [PMC free article] [PubMed] [Google Scholar]
- 20. Yang W, Ning N, Jin X. The lncRNA H19 promotes cell proliferation by competitively binding to miR‐200a and derepressing β‐catenin expression in colorectal cancer. BioMed Res Int. 2017;2017:8. [DOI] [PMC free article] [PubMed] [Google Scholar]
- 21. Liang W‐C, Fu W‐M, Wong C‐W, et al. The lncRNA H19 promotes epithelial to mesenchymal transition by functioning as miRNA sponges in colorectal cancer. Oncotarget. 2015;6:22513‐22525. [DOI] [PMC free article] [PubMed] [Google Scholar]
- 22. Huang Z, Lei W, Hu H‐B, Zhang H, Zhu Y. H19 promotes non‐small‐cell lung cancer (NSCLC) development through STAT3 signaling via sponging miR‐17. J Cell Physiol. 2018;233:6768‐6776. [DOI] [PubMed] [Google Scholar]
- 23. Ren J, Fu J, Ma T, et al. LncRNA H19‐elevated LIN28B promotes lung cancer progression through sequestering miR‐196b. Cell Cycle. 2018;17:1372‐1380. [DOI] [PMC free article] [PubMed] [Google Scholar]
- 24. Zhang Q, Li X, Li X, Li X, Chen Z. LncRNA H19 promotes epithelial‐mesenchymal transition (EMT) by targeting miR‐484 in human lung cancer cells. J Cell Biochem. 2017;119:4447‐4457. [DOI] [PubMed] [Google Scholar]
- 25. Xiao‐Jun Ge, Li‐Mei Zheng, Zhong‐Xin Feng, et al. H19 contributes to poor clinical features in NSCLC patients and leads to enhanced invasion in A549 cells through regulating miRNA‐203‐mediated epithelial‐mesenchymal transition. Oncol Lett. 2018;16:4480‐4488. [DOI] [PMC free article] [PubMed] [Google Scholar]
- 26. Zhou Y, Sheng B, Xia Q, Guan X, Zhang Y. Association of long non‐coding RNA H19 and microRNA‐21 expression with the biological features and prognosis of non‐small cell lung cancer. Cancer Gene Ther. 2017;24:317‐324. [DOI] [PubMed] [Google Scholar]
- 27. Salic A, Mitchison TJ. A chemical method for fast and sensitive detection of DNA synthesis in vivo . Proceedings of the National Academy of Sciences. 2008;105:2415‐2420. [DOI] [PMC free article] [PubMed] [Google Scholar]
- 28. Li H, Yu B, Li J, et al. Overexpression of lncRNA H19 enhances carcinogenesis and metastasis of gastric cancer. Oncotarget. 2014;5:2318‐2329. [DOI] [PMC free article] [PubMed] [Google Scholar]
- 29. Popper HH. Progression and metastasis of lung cancer. Cancer Metastasis Rev. 2016;35:75‐91. [DOI] [PMC free article] [PubMed] [Google Scholar]
- 30. Schmitt AM, Chang HY. Long noncoding RNAs in cancer pathways. Cancer Cell. 2016;29:452‐463. [DOI] [PMC free article] [PubMed] [Google Scholar]


