

Abstract
Trypanosomosis is a chronic parasitic infection, affecting both humans and livestock. A common hallmark of experimental murine infections is the occurrence of inflammation and the associated remodelling of the spleen compartment. The latter involves the depletion of several lymphocyte populations, the induction of T‐cell‐mediated immune suppression, and the activation of monocyte/macrophage cell populations. Here, we show that in experimental T b brucei infections in mice, these changes are accompanied by the alteration of the spleen neutrophil compartment. Indeed, mature neutrophils are rapidly recruited to the spleen, and cell numbers remain elevated during the entire infection. Following the second peak of parasitemia, the neutrophil cell influx coincides with the rapid reduction of splenic marginal zone (MZ)B and follicular (Fo)B cells, as well as CD8+ T and NK1.1+ cells, the latter encompassing both natural killer (NK) and natural killer T (NKT) cells. This report is the first to show a comprehensive overview of all alterations in spleen cell populations, measured with short intervals throughout the entire course of an experimental T b brucei infection. These data provide new insights into the dynamic interlinked changes in spleen cell numbers associated with trypanosomosis‐associated immunopathology.
Keywords: cell‐mediated immunity, neutrophil, Trypanosoma spp.
1. INTRODUCTION
Trypanosoma brucei is one of the causative agents of African Trypanosomosis.1 These parasites are continuously exposed to attacks by host antibodies, type 1 proinflammatory cytokines and nitric oxide (NO).2, 3, 4 In combination, these molecules can have both direct and indirect trypanotoxic activities. Prolonged inflammation is however also a detrimental hallmark of the infection for the host itself. Indeed, trypanosomosis‐associated immunopathology is linked to excessive activation of the monocyte/macrophage compartment,5, 6, 7, 8 and results in T‐cell‐mediated immune suppression 9, 10 as well as the depletion of several host lymphocyte populations.5, 9, 11, 12, 13 The latter has been addressed at very specific time points of infection, but so far, comprehensive data detailing with the quantitative dynamic changes of these populations throughout infection is lacking. In particular, no published information is available on systematic changes of the mature spleen neutrophil population throughout the entire course of infection covering multiple time points of the early, intermediate and late‐stage of parasitemia.
Neutrophils are known to play a key role in the first line of defence against invading pathogens via the innate arm of the immune system. Upon arrival at the site of inflammation, neutrophils engage their effector functions by eliminating invading pathogens and trigger inflammatory reactions.14, 15, 16 However, recent data demonstrate that neutrophils can also extend their functions beyond their role in pathogen clearance and can play a role in promoting parasite survival, in particular, during the onset of tsetse‐transmitted trypanosomosis.17 The lack of systematic data on quantitative changes in spleen cell numbers throughout infection prompted the data collection reported here.
2. MATERIAL AND METHODS
2.1. Parasites and infection in mice
Eight‐week‐old female C57BL/6 mice were purchased from Koatech (Gyeonggi‐do, Republic of Korea) and infected by intraperitoneal injection using 5 × 10³ T b brucei AnTat1.1E. Experiments were approved by the GUGC IACUC protocol n° LM16‐839/2018‐006. Parasitemia was assessed as previously described.18
2.2. Cell isolation and flow cytometry assay
Single‐cell spleen suspensions were prepared at 0, 4, 5, 6, 7, 8, 9, 10, 14, 17, 21, 24 and 28 days post‐infection (dpi) as previously described.13 Unless otherwise stated, cell suspensions were re‐suspended in 0.05% FBS BD FACSFlow Sheath Fluid. Cell washings were carried out by centrifugation at 314 g for 7 minutes. Incubations were performed at 4°C for 30 minutes. Non‐specific binding sites were blocked using anti‐CD16/CD32 (Fc γ III/II block—final dilution 1/1000). Afterwards, 5 × 10⁵ cells were incubated with antibody cocktails (dilution of 1/600), using anti‐B220‐FITC, anti‐CD1d‐PE, anti‐CD138‐PE/CY7, anti‐CD93‐APC, anti‐CD4‐FITC, anti‐CD8a‐PE, anti‐TCR β chain‐APC, anti‐Ly6G‐AlexaFluor488, anti‐Ly6C‐PE, anti‐CD11b‐APC, anti‐NK1.1‐APC and anti‐Ter119‐PE (BioLegend, San Diego, CA, USA), 1 µg of 7‐amino‐actinomycin D (7AAD) to exclude nonviable cells, and finally analysed using a BD Accuri™ C6 Plus flow cytometer.
2.3. Statistical analysis
Prism® 7.0 software (GraphPad Software Inc) was used to graphically represent data and perform statistical analysis, using unpaired student t tests. Data are presented as mean ± SD.
3. RESULTS
Spleen leucocyte population changes were analysed during T b brucei AnTat1.1E infections. Table 1 shows the number of spleen, early B lineage (encompassing all CD93+ B cells), plasma B, follicular (Fo)B, marginal zone (MZ)B, CD4+ T, CD8+ T, and NK1.1+ cells, monocytes and neutrophils throughout infection (see supplemental Figure 1 for FACS gating strategy). A major influx of mature neutrophils (CD11b+Ly6G+Ly6CInt) is observed as early as 4 dpi (Table 1, Figure 1A, 1), and cell numbers remain elevated throughout infection (Figure 1B). Figure 1C displays the T b brucei AnTat 1.1E parasitemia profile.
Table 1.
Immune cell populations in the spleen of Trypanosoma brucei brucei infected C57BL/6 mice
| Cell type | Mean of cells per spleen (n = 3) | ||||||||||||
|---|---|---|---|---|---|---|---|---|---|---|---|---|---|
| Days post‐infection (dpi) | |||||||||||||
| 0 | 4 | 5 | 6 | 7 | 8 | 9 | 10 | 14 | 17 | 21 | 24 | 28 | |
| Spleena | 1,00E + 8 | 1,85E + 8 | 2,34E + 8 | 3,43E + 8 | 3,25E + 8 | 2,44E + 8 | 2,05E + 8 | 2,16E + 8 | 1,39E + 8 | 1,83E + 8 | 1,43E + 8 | 1,63E + 8 | 1,25E + 8 |
| Early B lineage | 1,59E + 6 | 1,31E + 6 | 1,78E + 6 | 5,03E + 6 | 5,29E + 6 | 3,15E + 6 | 1,92E + 6 | 4,71E + 6 | 1,47E + 6 | 4,71E + 6 | 1,07E + 7 | 4,17E + 6 | 5,14E + 6 |
| Plasma B | 8,19E + 5 | 1,00E + 6 | 1,34E + 6 | 8,23E + 6 | 1,85E + 7 | 1,48E + 7 | 1,98E + 7 | 2,19E + 7 | 7,29E + 6 | 8,72E + 6 | 5,54E + 6 | 7,84E + 6 | 5,82E + 6 |
| Follicular B | 5,76E + 7 | 9,86E + 7 | 1,33E + 8 | 1,60E + 8 | 1,46E + 8 | 9,03E + 7 | 4,54E + 7 | 3,31E + 7 | 2,58E + 7 | 2,96E + 7 | 1,86E + 7 | 1,57E + 7 | 1,13E + 7 |
| Marginal zone B | 4,07E + 6 | 6,57E + 6 | 7,57E + 6 | 7,96E + 6 | 7,14E + 6 | 1,70E + 6 | 7,96E + 5 | 2,72E + 5 | 1,00E + 5 | 5,90E + 4 | 3,99E + 4 | 1,25E + 5 | 1,52E + 5 |
| CD4+ T | 1,64E + 7 | 1,69E + 7 | 2,13E + 7 | 3,20E + 7 | 3,25E + 7 | 1,89E + 7 | 1,05E + 7 | 8,34E + 6 | 9,23E + 6 | 1,49E + 7 | 1,57E + 7 | 1,78E + 7 | 1,44E + 7 |
| CD8+ T | 9,76E + 6 | 9,55E + 6 | 1,34E + 7 | 1,91E + 7 | 1,45E + 7 | 8,72E + 6 | 3,85E + 6 | 2,99E + 6 | 3,47E + 6 | 2,46E + 6 | 2,31E + 6 | 2,64E + 6 | 1,93E + 6 |
| NK1.1+ | 4,79E + 6 | 3,00E + 6 | 1,55E + 6 | 2,49E + 6 | 2,43E + 6 | 2,25E + 6 | 1,13E + 6 | 1,54E + 6 | 1,47E + 6 | 1,98E + 6 | 1,27E + 6 | 1,63E + 6 | 1,67E + 6 |
| Monocyte | 1,00E + 6 | 5,85E + 6 | 3,65E + 6 | 1,14E + 7 | 1,21E + 7 | 1,16E + 7 | 1,05E + 7 | 8,07E + 6 | 7,62E + 6 | 5,67E + 6 | 5,11E + 6 | 8,90E + 6 | 6,35E + 6 |
| Neutrophil | 2,00E + 6 | 1,02E + 7 | 6,87E + 6 | 1,29E + 7 | 4,66E + 6 | 6,99E + 6 | 7,59E + 6 | 2,00E + 7 | 2,95E + 7 | 2,80E + 7 | 2,68E + 7 | 1,91E + 7 | 1,87E + 7 |
Splenocytes of uninfected control mice and T b brucei AnTat1.1E infected mice (n = 3 mice per time point) were stained for surface markers and analysed using flow cytometry. Fold change in cell number of <0.25 (dark red), 0.25‐0.5 (medium red), 0.5‐0.8 (light red), 1.25‐2 (light green), 2‐9 (medium green), and >9 (dark green) are displayed. Data are represented as mean of at least three mice per group. Flow cytometry selection criteria are identical to those described in Figure 1.
Spleen cells are referred to as the number of viable spleen cells, obtained using a haemocytometer and Trypan Blue staining, after performing red blood cell lysis.
Figure 1.
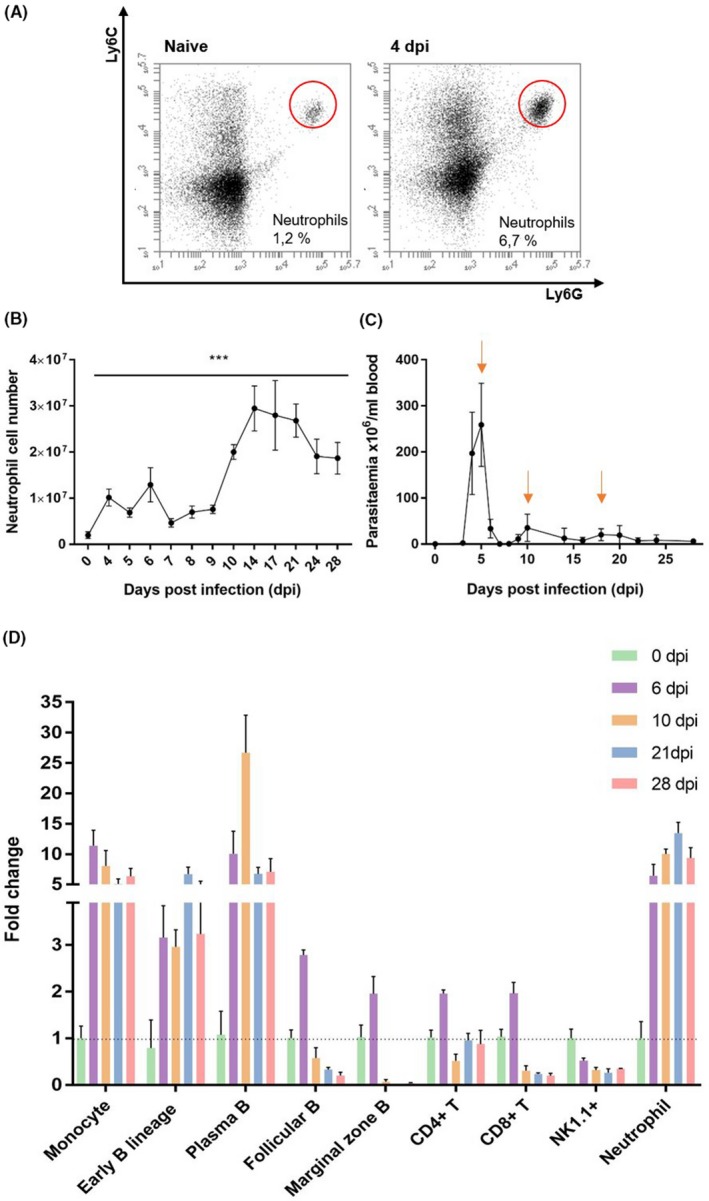
Alterations in spleen immune cell populations and parasitemia of Trypanosoma brucei brucei infected C57BL/6 mice. A, Flow cytometry plots of CD11b+Ly6CIntLy6G+ spleen neutrophils (naive and 4 dpi, one representative result). B, Dynamic changes in spleen neutrophil numbers throughout T b brucei AnTat1.1E infections (n = 3 mice per time point). Statistical analysis is performed by comparing each time point to the data obtained of uninfected controls (0 dpi). ***P < .001. C) Parasitemia levels of T b brucei AnTat1.1E infected mice. Parasitemia peaks are indicated by arrows (n = 5 mice per time point). D) Fold change in cell number of early B lineage, plasma B, follicular (Fo)B, marginal zone (MZ)B, CD4+ T, CD8+ T, and NK1.1+ cells, monocytes, and neutrophils during T b brucei AnTat1.1E infection (n = 3 mice per time point). Absolute cell numbers were obtained by multiplying the viable spleen cell count with the percentage value obtained by flow cytometry for every specific cell population (excluding 7AAD+ and Ter119+ cells). The following criteria were used; Mature neutrophils: CD11b+Ly6CIntLy6G+, Monocytes: CD11b+Ly6C+Ly6G‐, Early B lineage: B220+CD138‐CD93+, †Plasma B: B220IntCD138+, FoB: B220+CD138‐CD93‐CD1d‐, MZB: B220+CD138‐CD93‐CD1d+, CD4+T: TCRβ+CD4+, CD8+T: TCRβ+CD8+, NK1.1+: FSC/NK1.1+. †Plasma B cells express CD93 as well. Data are represented as mean ± SD. One representative of two experiments is shown
Coinciding with the clearance of the first parasitemia peak (6 dpi), a 5‐fold increase in spleen neutrophil cells is observed (Figure 1D, Table 1). The neutrophil cell number remains high throughout the progressing infection, reaching a 15‐fold increase following the control of the third peak of infection. In contrast, while monocyte, plasma B, and early B lineage cells increase immediately following the first wave of infection, cell numbers drop again towards the end of infection, albeit not to baseline levels. Moreover, MZB, FoB, CD4+ T and CD8+ T cells reach peak numbers following the clearance of first peak of parasitemia. Thereafter, progressing infection results in sustained loss of these cells, except for CD4+ T cells, which only show a transient reduction following the second peak of infection (10 dpi). The coinciding significant increase in early B lineage and plasma B cells (previously reported 11, 12), could result from extramedullary B lymphopoiesis, and polyclonal B cell activation and/or differentiation of MZB into plasma B cells. In contrast, NK1.1+ cell numbers (NK and NKT cells) reduce immediately following the onset of infection and remain severely depleted thereafter. Collectively, our data show that following the control of both the first and second T b brucei AnTat1.1E parasitemia peaks, a cumulative increase of neutrophils coincides with the destruction of other mature spleen lymphocyte populations.
4. DISCUSSION
While analysing trypanosomosis‐induced anaemia in the past, we reported the early influx (4 dpi) of neutrophils in the spleen of infected mice, preceding the first peak of parasitemia.5 Here, we show that this cellular recruitment persists throughout the entire course of infection, reaching a 15‐fold increase upon the control of the third peak of infection. At the same time, MZB, FoB, NK1.1+ and CD8+ T cells are all depleted due to the ongoing infection. This persistent infection‐associated neutrophil accumulation is remarkable, as neutrophils are usually characterized as short‐lived cells associated with acute immune responses, dying within a limited time after performing their function.19 However, several recent studies have indicated that neutrophils are capable of executing more diverse functions, including the regulation of inflammatory responses, and acting as effectors of the adaptive immune system.20, 21 Since neutrophils play an important role in regulating immune response during parasite infections, the dynamic change of this cell population was addressed in an experimental T b brucei infection setup.
Following the observed persistent infection‐associated influx of spleen neutrophils during T b brucei AnTat1.1E infections, two questions can be put forward, that is what is the role of these cells with respect to the control of parasitemia, and secondly, could these cells contribute to the observed infection‐associated pathology?
Two possible scenarios can be suggested in which neutrophils would contribute to the regulation of parasitemia, dampening the parasitemia load while other immune cells are being depleted. Indeed, neutrophils could contribute to parasitemia control by (a) phagocytosis, (b) granular secretion of antibacterial compounds, (c) release of neutrophil extracellular traps (NETs), and (d) the induction of a hostile inflammatory environment.22, 23, 24, 25, 26 The latter, that is the combined action of neutrophil‐derived tumour necrosis factor (TNF) and NO, could aid the significantly weakened remaining antibody response in maintaining a certain parasitemia control lever during later stages of infection. In addition, neutrophils can stimulate the adaptive immune response, as they activate splenic B cells through the release of B‐cell‐stimulating factors. This can lead to (a) improved B cell survival, (b) IgM antibody secretion, (c) IgG and IgA isotype switching and (d) somatic hypermutation induction.27 Finally, neutrophils can positively regulate antigen‐specific T cell responses and can act as antigen‐presenting cells.28, 29 Collectively, these neutrophil effector functions could all contribute to parasitemia control by triggering both innate and adaptive defence responses. In contrast, neutrophils can play a role in the establishment and persistence of the parasite infection. A recent study revealed that the rapid recruitment of neutrophils to the dermal bite site of T b brucei infected tsetse flies, did contribute to higher systematic parasitemia levels during the onset of infection.17
With respect to the second question and the possible role of persistent spleen neutrophil accumulation as part of the infection‐associated immunopathology, it should be noted that a link between trypanosomosis‐associated B cell depletion and the activation of the NK‐perforin pathway has been suggested.30 Hence, since neutrophils can be an additional source of perforin, they could possibly contribute to B cell depletion during infection and aggravate the reported detrimental NK cell activity. In an ever‐accelerating cycle of immunopathology, spleen B cell destruction and architecture disruption could than further drive inflammation by enhancing the influx of IFN‐γ producing neutrophils, fueling the ongoing type I inflammatory immune response.
CONFLICT OF INTEREST
The authors declare that the research was conducted in the absence of any commercial of financial relationships that could be construed as a potential conflict of interest.
AUTHOR CONTRIBUTIONS
Research design: CD MR SM. Research acquisition: VD HTTP ID IJ. Data analysis and interpretation: VD ID HTTP IJ CD MR SM. Drafting of paper: VD. Revising of paper: CD MR SM.
Supporting information
ACKNOWLEDGEMENTS
This research is supported by the Research Foundation—Flanders (FWO), Belgium (grant nr G015016N and G013518N). Furthermore, V. D. is a PhD fellow funded by an individual research grant of the Research Foundation—Flanders (grant nr 1S87519N).
Deleeuw V, Phạm HTT, De Poorter I, et al. Trypanosoma brucei brucei causes a rapid and persistent influx of neutrophils in the spleen of infected mice. Parasite Immunol. 2019;41:e12664 10.1111/pim.12664
Magdalena Radwanska and Stefan Magez have contributed equally to this work.
DATA AVAILABILITY
The data that support the findings of this study are available from the corresponding author upon reasonable request.
REFERENCES
- 1. Yaro M, Munyard KA, Stear MJ, Groth D. Combatting African animal trypanosomiasis (AAT) in livestock: the potential role of trypanotolerance. Vet Parasitol. 2016;225:43‐52. [DOI] [PubMed] [Google Scholar]
- 2. Stijlemans B, Radwanska M, De Trez C, Magez S. African trypanosomes undermine humoral responses and vaccine development: link with inflammatory responses? Front Immunol. 2017;8:1‐14. [DOI] [PMC free article] [PubMed] [Google Scholar]
- 3. Vanhamme L, Pays E, McCulloch R, Barry JD. An update on antigenic variation in African trypanosomes. Trends Parasitol. 2001;17(7):338‐343. [DOI] [PubMed] [Google Scholar]
- 4. Reinitz DM, Mansfield JM. T‐cell‐independent and T‐cell‐dependent B‐cell responses to exposed variant surface glycoprotein epitopes in trypanosome‐infected mice. Infect Immun. 1990;58(7):2337‐2342. [DOI] [PMC free article] [PubMed] [Google Scholar]
- 5. Cnops J, De Trez C, Stijlemans B, et al. NK‐, NKT‐ and CD8‐Derived IFNγ drives myeloid cell activation and erythrophagocytosis, resulting in trypanosomosis‐associated acute anemia. PLOS Pathog. 2015;11(6):e1004964. [DOI] [PMC free article] [PubMed] [Google Scholar]
- 6. Magez S, Stijlemans B, Radwanska M, Pays E, Ferguson MA, De Baetselier P. The glycosyl‐inositol‐phosphate and dimyristoylglycerol moieties of the glycosylphosphatidylinositol anchor of the trypanosome variant‐specific surface glycoprotein are distinct macrophage‐activating factors. J Immunol. 1998;160(4):1949‐1956. [PubMed] [Google Scholar]
- 7. Stijlemans B, Leng L, Brys L, et al. MIF contributes to Trypanosoma brucei associated immunopathogenicity development. PLoS Pathog. 2014;10(9):e1004414. [DOI] [PMC free article] [PubMed] [Google Scholar]
- 8. Stijlemans B, Vankrunkelsven A, Brys L, Magez S, De Baetselier P. Role of iron homeostasis in trypanosomiasis‐associated anemia. Immunobiology. 2008;213(9‐10):823‐835. [DOI] [PubMed] [Google Scholar]
- 9. Millar AE, Sternberg J, McSharry C, Wei XQ, Liew FY, Turner CM. T‐Cell responses during Trypanosoma brucei infections in mice deficient in inducible nitric oxide synthase. Infect Immun. 1999;67(7):3334‐3338. [DOI] [PMC free article] [PubMed] [Google Scholar]
- 10. Wu H, Liu G, Shi M. Interferon gamma in African trypanosome infections: friends or foes? Front Immunol. 2017;8:1105. [DOI] [PMC free article] [PubMed] [Google Scholar]
- 11. Bockstal V, Guirnalda P, Caljon G, et al. T brucei infection reduces B lymphopoiesis in bone marrow and truncates compensatory splenic lymphopoiesis through transitional B‐cell apoptosis. PLoS Pathog. 2011;7(6):e1002089. [DOI] [PMC free article] [PubMed] [Google Scholar]
- 12. Radwanska M, Guirnalda P, De Trez C, Ryffel B, Black S, Magez S. Trypanosomiasis‐induced B cell apoptosis results in loss of protective anti‐parasite antibody responses and abolishment of vaccine‐induced memory responses. PLoS Pathog. 2008;4(5):e1000078. [DOI] [PMC free article] [PubMed] [Google Scholar]
- 13. Cnops J, De Trez C, Bulte D, Radwanska M, Ryffel B, Magez S. IFN‐γ mediates early B‐cell loss in experimental African trypanosomosis. Parasite Immunol. 2015;37(9):479‐484. [DOI] [PubMed] [Google Scholar]
- 14. Mayadas TN, Cullere X, Lowell CA. The multifaceted functions of neutrophils. Annu Rev Pathol Mech Dis. 2014;9(1):181‐218. [DOI] [PMC free article] [PubMed] [Google Scholar]
- 15. Nauseef WM, Borregaard NN. Neutrophils at work. Nat Immunol. 2014;15(7):602‐611. [DOI] [PubMed] [Google Scholar]
- 16. Soehnlein O, Lindbom L. Phagocyte partnership during the onset and resolution of inflammation. Nat Rev Immunol. 2010;10(6):427‐439. [DOI] [PubMed] [Google Scholar]
- 17. Caljon G, Mabille D, Stijlemans B, et al. Neutrophils enhance early Trypanosoma brucei infection onset. Sci Rep. 2018;8(1):11203. [DOI] [PMC free article] [PubMed] [Google Scholar]
- 18. Obishakin E, De Trez C, Magez S. Chronic trypanosoma congolense infections in mice cause a sustained disruption of the B‐cell homeostasis in the bone marrow and spleen. Parasite Immunol. 2014;36(5):187‐198. [DOI] [PubMed] [Google Scholar]
- 19. Geering B, Simon H. Peculiarities of cell death mechanisms in neutrophils. Cell Death Differ. 2011;18(9):1457‐1469. [DOI] [PMC free article] [PubMed] [Google Scholar]
- 20. Kolaczkowska E, Kubes P. Neutrophil recruitment and function in health and inflammation. Nat Rev Immunol. 2013;13(3):159‐175. [DOI] [PubMed] [Google Scholar]
- 21. Mócsai A. Diverse novel functions of neutrophils in immunity, inflammation, and beyond. J Exp Med. 2013;210(7):1283‐1299. [DOI] [PMC free article] [PubMed] [Google Scholar]
- 22. Phillipson M, Kubes P. The neutrophil in vascular inflammation. Nat Med. 2011;17(11):1381‐1390. [DOI] [PMC free article] [PubMed] [Google Scholar]
- 23. Brinkmann V, Reichard U, Goosmann C, et al. Neutrophil extracellular traps kill bacteria. Science. 2004;303(5663):1532‐1535. [DOI] [PubMed] [Google Scholar]
- 24. Borregaard N. Neutrophils, from marrow to microbes. Immunity. 2010;33(5):657‐670. [DOI] [PubMed] [Google Scholar]
- 25. Häger M, Cowland JB, Borregaard N. Neutrophil granules in health and disease. J Intern Med. 2010;268:25‐34. [DOI] [PubMed] [Google Scholar]
- 26. Papayannopoulos V, Zychlinsky A. NETs: a new strategy for using old weapons. Trends Immunol. 2009;30(11):513‐521. [DOI] [PubMed] [Google Scholar]
- 27. Puga I, Cols M, Barra CM, et al. B cell–helper neutrophils stimulate the diversification and production of immunoglobulin in the marginal zone of the spleen. Nat Immunol. 2012;13(2):170‐180. [DOI] [PMC free article] [PubMed] [Google Scholar]
- 28. Beauvillain C, Delneste Y, Scotet M, et al. Neutrophils efficiently cross‐prime naive T cells in vivo. Blood. 2007;110(8):2965‐2973. [DOI] [PubMed] [Google Scholar]
- 29. Abi Abdallah DS, Egan CE, Butcher BA, Denkers EY. Mouse neutrophils are professional antigen‐presenting cells programmed to instruct Th1 and Th17 T‐cell differentiation. Int Immunol. 2011;23(5):317‐326. [DOI] [PMC free article] [PubMed] [Google Scholar]
- 30. Frenkel D, Zhang F, Guirnalda P, et al. Trypanosoma brucei Co‐opt NK cells to kill splenic B2 B cells. PLoS Pathog. 2016;12(7):1‐29. [DOI] [PMC free article] [PubMed] [Google Scholar]
Associated Data
This section collects any data citations, data availability statements, or supplementary materials included in this article.
Supplementary Materials
Data Availability Statement
The data that support the findings of this study are available from the corresponding author upon reasonable request.