

Abstract
Objective
Activation of osteoclastogenesis at the bone site in rheumatoid arthritis (RA) is well established. The mechanisms by which circulating osteoclast precursors contribute are still unclear. Peroxisome proliferator–activated receptor γ coactivator 1β (PGC‐1β) is implicated in transcriptional regulation of osteoclastogenesis in mouse models. This study was undertaken to investigate the contribution of PGC‐1β to circulating osteoclast precursors and its link to bone destruction in RA.
Methods
PGC‐1β expression in RA peripheral blood CD14+ monocytes was increased and showed correlation with joint destruction shown on radiographs. Cells from RA patients or healthy controls were transfected with a lentivirus vector for PGC‐1β gene silencing or overexpression and cultured with macrophage colony‐stimulating factor and RANKL. Bone resorption activity, bone‐degrading enzymes, and signaling molecules were measured in these mature osteoclasts.
Results
Increased nuclear accumulation of PGC‐1β was observed in RA peripheral blood CD14+ monocytes, and these cells had stronger osteoclastogenesis than in healthy controls. PGC‐1β protein expression was positively correlated with radiographic joint destruction (r = 0.396–0.413; all P < 0.05). PGC‐1β knockdown suppressed (51–82% reduction) the expression of cathepsin K, tartrate‐resistant acid phosphatase (TRAP), and matrix metalloproteinase 9 (MMP‐9), as well as osteoclast differentiation and bone resorption activity. Conversely, PGC‐1β overexpression increased these markers (by 1.5–1.8‐fold) and osteoclastogenesis. VIVIT, an inhibitor of NFATc1 activation, inhibited the effect of overexpressed PGC‐1β by reducing cathepsin K, TRAP, and MMP‐9 expression. Chromatin immunoprecipitation assay and dual‐luciferase reporter gene assay showed PGC‐1β bound to NFATc1 promoter, leading to transcriptional activation.
Conclusion
Activation of the PGC‐1β/NFATc1 pathway in circulating osteoclast precursors was associated with bone destruction in RA. This may represent a new treatment target.
Introduction
Rheumatoid arthritis (RA) is a systemic autoimmune disease characterized by progressive joint destruction leading to functional disability 1. More than 45% of patients with early RA are reported to have bone erosion at an early stage 2. Overproduction and activation of osteoclasts at the local site are responsible for bone erosion in RA 3. Osteoclast precursors derive from human peripheral blood monocytes, and their differentiation occurs in vitro in the presence of RANKL and macrophage colony‐stimulating factor (M‐CSF) 4. The contribution of monocyte‐derived osteoclast precursors in vivo is unclear. Previous in vitro studies showed that osteoclast differentiation from peripheral blood monocytes was enhanced in patients with RA compared to healthy controls 5, 6. The identification of mechanisms leading to an association between circulating activation and actual bone destruction may represent a new target for treatment in diseases, such as RA, that are associated with increased activation of osteoclasts.
Changes in intracellular metabolic pathways in immune cells could alter their function 7, 8, 9. Ex vivo–generated macrophages from peripheral blood CD14+ monocytes from RA patients produced higher levels of ATP and mitochondrial activity. Monocytes are the common precursors of macrophages and osteoclasts, and such activation in RA may be linked to bone destruction in this disease 10. Peroxisome proliferator–activated receptor γ coactivator 1α (PGC‐1ɑ) and PGC‐1β are part of a group of master regulators of mitochondrial biogenesis and respiration 11. PGC‐1β, but not PGC‐1α, is induced during osteoclast differentiation. PGC‐1β–deficient mice show osteoclast defects associated with impaired bone resorption, suggesting a role of PGC‐1β in osteoclast differentiation and function 12, 13. However, the contribution of PGC‐1β in osteoclast differentiation from osteoclast precursors remains to be studied in RA.
In the current study, we investigated the role of PGC‐1β in circulating osteoclast precursors and its contribution to osteoclastogenesis in RA. In addition, the contribution of NFATc1, a critical transcriptional regulator of osteoclastogenesis, was determined 14. We found an increased nuclear accumulation of PGC‐1β in peripheral blood CD14+ monocytes from patients with RA that correlated with the degree of joint destruction. These cells exhibited a strong capacity for osteoclastogenesis, which was increased by overexpression of PGC‐1β and decreased by PGC‐1β knockdown. The inhibition of NFATc1 activation limited the effect of overexpressed PGC‐1β. These results indicated that activation of the PGC‐1β/NFATc1 pathway in circulating osteoclast precursors was associated with bone destruction in RA.
Patients and Methods
Patients and controls
Forty‐two RA patients who fulfilled the 1987 American College of Rheumatology (ACR) revised classification criteria for RA 15 or the ACR/European League Against Rheumatism (EULAR) 2010 classification criteria for RA 16 were recruited from the Department of Rheumatology at Sun Yat‐Sen Memorial Hospital from April 2016 to September 2018. Sex‐matched healthy volunteers (n = 26) and patients with osteoarthritis (OA) (n = 16) were recruited as controls. The exclusion criteria were being age >65 years; having diabetes mellitus, obesity, severe infection, malignancy, or neurologic disease; or having an overlap with other autoimmune diseases such as lupus, myositis, or scleroderma. The demographic characteristics of the RA patients and controls are summarized in Supplementary Table 1 (available on the Arthritis & Rheumatology web site at http://onlinelibrary.wiley.com/doi/10.1002/art.40868/abstract). The study wasapproved by the Medical Ethics Committee of Sun Yat‐Sen Memorial Hospital (SYSEC‐2014‐LSY‐89). All participants provided written informed consent before clinical data collection.
Demographic and clinical data were collected at the time of recruitment as described previously 17, 18. RA disease activity was assessed using the Disease Activity Score in 28 joints with 4 variables, including C‐reactive protein level 19. Radiographs of bilateral hands, wrists, and feet (anteroposterior view) were performed on all RA patients and assessed with the modified Sharp/van der Heijde score by 2 experienced observers (J‐ZL and L‐FC), who were blinded with regard to clinical data 20, 21. Reliability and agreement were assessed using an intraclass correlation coefficient (ICC); the mean ICC for interobserver agreement was 0.90. Erosive disease was defined according to the 2013 EULAR definition when a cortical break was detected by radiography 22.
Isolation of peripheral blood CD14+ monocytes
Peripheral blood mononuclear cells (PBMCs) were isolated from RA patients and OA patients, as well as healthy controls, by using Ficoll‐Hypaque density‐gradient centrifugation (Sigma‐Aldrich). Cells were washed twice with cold phosphate buffered saline (PBS; Gibco), and monocytes were isolated from PBMCs using CD14+ magnetic bead separation (BD Biosciences), following the protocol of the manufacturer. Separated monocytes were stained with phycoerythrin (PE)–anti‐CD14 antibody (BD Biosciences) for flow cytometric analysis.
Osteoclast differentiation and bone resorption assay
For the osteoclast differentiation assay, 1 × 10⁶ peripheral blood CD14+ monocytes were cultured in 24‐well culture plates in the presence of 100 ng/ml of RANKL and 50 ng/ml of M‐CSF (both from PeproTech). Osteoclasts were confirmed by tartrate‐resistant acid phosphatase (TRAP) staining and further staining with fluorescein isothiocyanate (FITC)–phalloidin (both from Sigma‐Aldrich) to detect F‐actin ring using a Leica DMI4000B inverted wide‐field fluorescence microscope. Mature osteoclasts were defined as TRAP‐positive giant cells including ≥3 nuclei and bands of F‐actin–containing podosomes.
For bone resorption assay, bovine cortical bone slices were layered at the bottom of 48‐well culture plates, and 5 × 10⁵ peripheral blood CD14+ monocytes were seeded onto the slices and cultured in the presence of 100 ng/ml of recombinant human RANKL and 50 ng/ml of M‐CSF. Resorption pits on the slices were shown by toluidine blue staining and measured using an ImageJ 1.47 analysis system (NIH).
Immunofluorescence staining
Peripheral blood CD14+ monocytes were plated on 24‐well culture plates with coverslips. After incubation for 4 hours, the medium was aspirated and cells were washed twice in PBS, fixed in 4% paraformaldehyde for 15–30 minutes, permeabilized in 0.2% Triton X‐100 for 10 minutes at room temperature for the exposure of intracellular antigen, and blocked in PBS containing 3% bovine serum albumin (BSA; Affymetrix) for 30 minutes. Cells were then washed in PBS 3 times for 10 minutes each time and incubated in PBS containing rabbit anti‐human polyclonal antibody against PGC‐1β (Bioss) and mouse anti‐human CD14 monoclonal antibody (Abcam) or normal rabbit IgG overnight at 4°C. Alexa Fluor 594–conjugated goat anti‐rabbit IgG and Alexa Fluor 488–conjugated goat anti‐mouse IgG (1:1,000; concentrations of stock solutions 2 mg/ml) (both from Invitrogen) were added and incubated for 1 hour at 37°C. After washing in PBS, the nucleus was stained with DAPI (Sigma‐Aldrich) for 3 minutes and coverslips were mounted with ProLong Gold Antifade Reagent (Invitrogen). Images were analyzed using a Zeiss LSM 710 Confocal Imaging System 23.
Flow cytometric analysis
Peripheral blood CD14+ monocytes were stained first with PE‐conjugated anti‐CD14 monoclonal antibody (BD Biosciences) for cell surface antigen. Cells were washed twice with staining wash buffer and centrifuged (1,000 revolutions per minute for 5 minutes) to pellet the cells. They were then resuspended with 100 μl of fixation/permeabilization solution (eBioscience) for 30 minutes at 4°C to expose intracellular antigen. Cells were washed twice with 500 μl of wash buffer and suspended with 100 μl of permeabilization buffer mixed with 1 μl of rabbit anti‐human/mouse PGC‐1β antibody (Bioss) in the dark for 30 minutes at room temperature. Next, they were washed twice and resuspended with 100 μl of permeabilization buffer mixed with 1 μl of FITC‐conjugated anti‐rabbit secondary antibody (Invitrogen) in the dark for 20 minutes at room temperature. Stained cells were washed with permeabilization buffer and resuspended with 200 μl of phosphate buffered albumin (0.5% BSA and 0.05% NaN3 in PBS) before flow cytometric analysis. In each case, staining was compared to that of the appropriately labeled isotype control antibody.
PGC‐1β gene silencing or overexpression by lentivirus transfection
To obtain cell lines with stable silencing or overexpression of PGC‐1β, peripheral blood CD14+ monocytes were transfected with PGC‐1β sequence–specific short hairpin RNA (shRNA) expression lentivirus or overexpression lentivirus, which were synthesized by Shanghai GeneChem. The target sequences for human PGC‐1β knockdown were GCATAGTCTAGGCAAAGAAAT, marked as Lv‐sh‐PGC‐1β, and shRNA targeting CCTAAGGTTAAGTCGCCCTCG (noncoding in human) was cloned into the same vector, used as control, and marked as Lv‐sh‐GFP. Human full‐length PGC‐1β complementary DNA (cDNA) was cloned into lentiviral vector pLV[Exp] and marked as Lv‐PGC‐1β, and empty pLV[Exp] vector expressing green fluorescent protein (GFP) only were used as negative control, and referred to as Lv‐GFP. The production and transfection of lentivirus were conducted as described previously 24. Stably transduced cells were selected by addition of puromycin (1 μg/ml) for 48 hours and verified by real‐time quantitative polymerase chain reaction (qPCR) and Western blot analysis.
Real‐time qPCR analysis
Total RNA was prepared from cells, using RNAiso reagent (Takara). RNA was reverse transcribed into cDNA using a reverse transcript kit (Takara) according to the instructions of the manufacturer. Complementary DNA was amplified by using recombinant Taq DNA polymerase (Takara) and specific oligonucleotide primers of PGC‐1β, tumor necrosis factor receptor–associated factor 6 (TRAF6), and β‐actin (Supplementary Table 2, available on the Arthritis & Rheumatology web site at http://onlinelibrary.wiley.com/doi/10.1002/art.40868/abstract). SYBR Green–based qPCR was performed using a Roche LightCycler 480 sequence detector system (25).
Western blot analysis
Cytoplasmic or nuclear proteins from human peripheral blood CD14+ monocytes were extracted separately using nuclear protein extraction kits (Pierce). Target proteins from cytoplasm were detected with primary antibodies to TRAP, DC‐STAMP, cathepsin K (1:1,000; all from Abcam), matrix metalloproteinase 9 (MMP‐9), TRAF6, phospho‐p38, p38, phospho‐ERK1/2, ERK1/2, phospho‐JNK, JNK, and β‐tubulin (1:1,000; all from Cell Signaling Technology). Target proteins from nuclei were detected with primary antibodies to NFATc1, c‐Fos, c‐Jun, and fibrillarin (1:1,000; all from Cell Signaling Technology), as well as PGC‐1β (1:1,000; Abcam). Protein bands were visualized using enhanced chemiluminescence (Millipore) plus Western blot detection reagents, followed by exposure to a scanning imager (G:BOX Gel & Blot Imaging Series; Syngene) 26.
VIVIT treatment of human peripheral blood CD14+ monocytes
VIVIT (MCE) was used as an inhibitor of NFATc1 activation 27. VIVIT powder was dissolved in Dulbecco's modified Eagle's medium at a concentration of 10 μM. After treatment with 10 μM VIVIT plus 100 ng/ml of recombinant human RANKL and 50 ng/ml of M‐CSF for 24 hours, nuclear expression of PGC‐1β and NFATc1 in peripheral blood CD14+ monocytes from healthy controls was detected by Western blotting. After treatment with 10 μM VIVIT plus 100 ng/ml of recombinant human RANKL and 50 ng/ml of M‐CSF for 21 days, cytoplasmic proteins of DC‐STAMP, cathepsin K, TRAP, and MMP‐9 in peripheral blood CD14+ monocytes from healthy controls were detected by Western blotting.
Chromatin immunoprecipitation (ChIP)
ChIP was performed using a ChIP assay kit (Cell Signaling Technology) according to the instructions of the manufacturer. Briefly, cells in a 10‐cm culture plate were crosslinked with 1% formaldehyde for 10 minutes. Crosslinking was neutralized with 0.2M glycine. Cells were collected and suspended in lysis buffer. Genomic fragments were sonicated to a proper length. Protein–DNA complexes were precipitated with PGC‐1β antibody or IgG (Cell Signaling Technology) as a negative control, and anti–RNA polymerase II (Cell Signaling Technology) antibody as a positive control, overnight at 4°C. The complexes were purified using protein A/G magnetic beads, and the crosslinks were reversed at 68°C. The DNA was then purified by applying the sample to a DNA separation column. The purified DNA was amplified by PCR, and the PCR products were analyzed by electrophoresis on a Gel Red–stained 2% agarose gel. The binding capacity of PGC‐1β to the NFATc1 promoter was analyzed by qPCR, and the shear DNA sample served as an input control 28. Primer sequences used in ChIP‐qPCR for NFATc1 were as follows: 5ʹ‐CCCCCTAGTAAGCCCTTTCCT‐3ʹ (forward) and 5ʹ‐GGGAAAGAGTTGAGGGACTTAGAA‐3ʹ (reverse).
Dual‐luciferase reporter gene assay
Plasmid pcDNA3.1‐PGC‐1β was purchased from GeneChem. The DNA sequences of NFATc1 were custom synthesized by GeneChem and cloned into a firefly luciferase plasmid. Peripheral blood CD14+ monocytes from healthy controls with 80% confluence in 24‐well plates were transfected using Lipofectamine 2000 Reagent (Life Technologies) according to the instructions of the manufacturer. Firefly luciferase plasmid of NFATc1 (0.1 μg) and pcDNA3.1‐PGC‐1β (0.2 μg, 0.4 μg, and 0.6 μg) were cotransfected with Renilla luciferase vector (Promega) for normalization. Forty‐eight hours after transfection, luciferase activity was measured using a Dual‐Glo Luciferase Assay System (Promega).
Statistical analysis
All data were analyzed using SPSS, version 13.0. For categorical variables, data were expressed as frequencies and percentages. For continuous variables, data were expressed as the mean ± SD or the median and interquartile range. Parametric data were compared by Student's t‐test, while nonparametric data were compared by Mann‐Whitney rank sum test. The chi‐square test was used for comparison of categorical variables in different groups. The correlation of parametric data was assessed by Pearson's correlation test. P values less than 0.05 were considered significant.
Results
Elevated PGC‐1β expression in peripheral blood CD14+ monocytes from RA patients
To assess PGC‐1β expression in circulating osteoclast precursors, peripheral blood CD14+ monocytes were isolated from RA patients and sex‐matched OA patients and healthy controls. As shown in Figure 1A, the mean ± SD PGC‐1β transcript levels were significantly higher in peripheral blood CD14+ monocytes from RA patients than those from OA patients (2.51 ± 0.32 versus 1.20 ± 0.36; P < 0.001) and healthy controls (2.51 ± 0.32 versus 1.00; P < 0.001). Intense PGC‐1β expression in the nucleus was visualized by dual‐color immunostaining in peripheral blood CD14+ monocytes, and the accumulation of PGC‐1β in the nucleus was confirmed by Western blot analysis (Figures 1B and C). The expression of PGC‐1β protein in RA peripheral blood CD14+ monocytes was detected by flow cytometric analysis of intracellular staining. The mean ± SD mean fluorescence intensity of FITC‐conjugated PGC‐1β in RA patients was significantly higher than in OA patients (85.32 ± 14.20 versus 11.42 ± 3.10; P < 0.001) and healthy controls (85.32 ± 14.20 versus 1.52 ± 0.24; P < 0.001) (Figure 1D). Western blot analysis confirmed the higher PGC‐1β accumulation in peripheral blood CD14+ monocytes in RA patients than in OA patients (0.97 ± 0.68 versus 0.52 ± 0.22; P = 0.007) and healthy controls (0.97 ± 0.68 versus 0.30 ± 0.11; P < 0.001) (Figure 1E).
Figure 1.
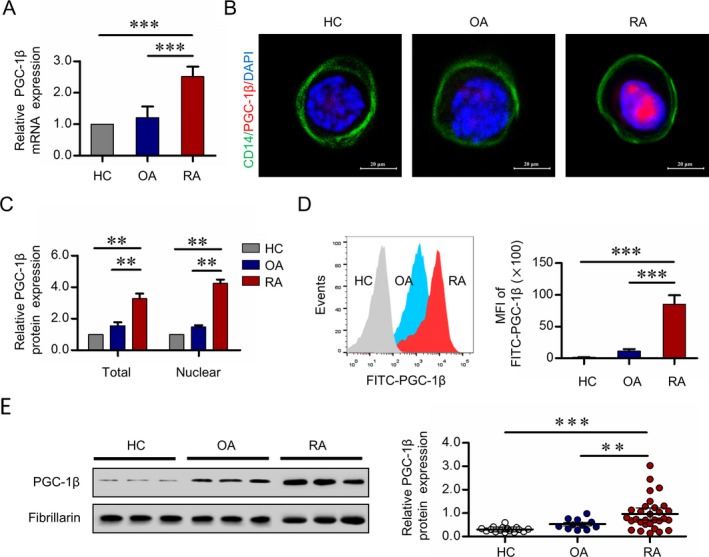
Expression of peroxisome proliferator–activated receptor γ coactivator 1β (PGC‐1β) in peripheral blood (PB) CD14+ monocytes. CD14+ monocytes were isolated from PB mononuclear cells from healthy controls (HCs), osteoarthritis (OA) patients, and rheumatoid arthritis (RA) patients by the use of CD14+ magnetic beads. A, Transcription of PGC‐1β was measured using quantitative polymerase chain reaction. B, Localization of PGC‐1β in PB CD14+ monocytes was detected by immunofluorescence staining. Original magnification × 1,000. C, PGC‐1β expression in total and nuclear protein from PB CD14+ monocytes was detected by Western blot analysis. Data in A and C are representative of results from independent experiments using samples from 6 healthy controls, 6 OA patients, and 6 RA patients. D, PGC‐1β protein levels in PB CD14+ monocytes were analyzed by flow cytometric analysis with fluorescein isothiocyanate (FITC). Left, Representative histograms showing the mean fluorescence intensity (MFI) in samples from 1 healthy control, 1 OA patient, and 1 RA patient are shown. Right, The MFIs of FITC‐conjugated PGC‐1β from peripheral CD14+ monocytes from 16 healthy controls, 11 OA patients, and 30 RA patients were compared. Values in A, C, and D are the mean ± SD. E, Left, Nuclear PGC‐1β protein expression in PB CD14+ monocytes was detected by Western blot analysis. Right, PGC‐1β band intensities were normalized to the values for fibrillarin and compared between groups. Symbols represent individual subjects (n = 16 healthy controls, n = 11 OA patients, and n = 30 RA patients) in independent analysis; bars show the mean ± SD. ** = P < 0.01; *** = P < 0.001, by Student's t‐test. Color figure can be viewed in the online issue, which is available at http://onlinelibrary.wiley.com/doi/10.1002/art.40868/abstract.
Association of PGC‐1β expression in monocytes with bone erosion in RA patients
To investigate the relationship between PGC‐1β expression in circulating osteoclast precursors and bone erosion in RA, 30 patients with RA were included for statistical analysis, with 43.3% (13 of 30) having erosive disease (Supplementary Table 3, available on the Arthritis & Rheumatology web site at http://onlinelibrary.wiley.com/doi/10.1002/art.40868/abstract). Nuclear expression of PGC‐1β as shown by Western blot analysis in peripheral blood CD14+ monocytes was significantly higher in patients with erosive RA than in patients with nonerosive RA (mean ± SD 1.40 ± 0.76 versus 0.63 ± 0.36; P = 0.006) (Figure 2A). Furthermore, there was a positive correlation between PGC‐1β protein expression in peripheral blood CD14+ monocytes and total modified Sharp/van der Heijde score (r = 0.410, P = 0.025), joint space narrowing subscore (r = 0.396, P = 0.030), and erosion subscore (r = 0.413, P = 0.023) (Figure 2B).
Figure 2.
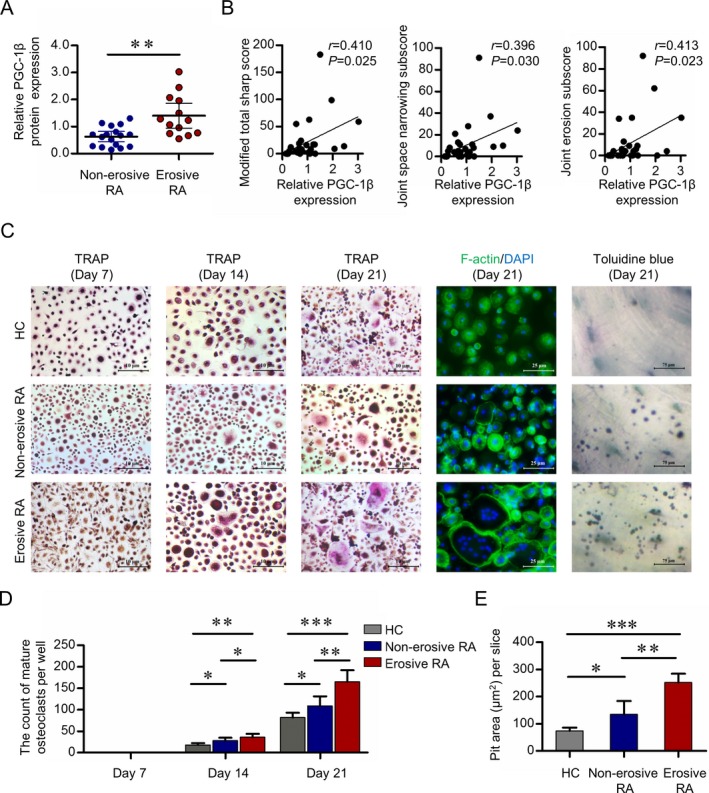
Expression of PGC‐1β in PB CD14+ monocytes from RA patients with erosive disease, and their osteoclastogenesis potential. A, Nuclear PGC‐1β protein expression in PB CD14+ monocytes from 17 patients with nonerosive RA and 13 patients with erosive RA was detected by Western blot analysis and normalized to the values for fibrillarin. Symbols represent individual subjects; bars show the mean ± SD. B, Relative PGC‐1β protein expression in 30 RA patients was assessed for correlation with the modified total Sharp score of radiographic progression (left), joint space narrowing subscore (middle), and erosion subscore (right). C, PB CD14+ monocytes from 6 healthy controls, 6 patients with nonerosive RA, and 10 patients with erosive RA were cultured with RANKL and macrophage colony‐stimulating factor. Mature osteoclasts were detected by tartrate‐resistant acid phosphatase (TRAP) staining (original magnification × 40) on days 7, 14, and 21, and fluorescein isothiocyanate–phalloidin staining (original magnification × 100) on day 21. Bone resorption activity of osteoclasts was detected by toluidine blue staining (original magnification × 400) on day 21. Representative results are shown. D and E, Cell counts of mature osteoclasts on days 7, 14, and 21 (D) and the pit area of bone resorption lacunae on day 21 (E) are shown. Bars show the mean ± SD. * = P < 0.05; ** = P < 0.01; *** = P < 0.001, by Student's t‐test. See Figure 1 for other definitions. Color figure can be viewed in the online issue, which is available at http://onlinelibrary.wiley.com/doi/10.1002/art.40868/abstract.
Stronger capacity for osteoclastogenesis in monocytes with elevated PGC‐1β
To investigate a possible link between elevated PGC‐1β and increased osteoclastogenesis, peripheral blood CD14+ monocytes obtained from 10 RA patients with erosive disease, 6 RA patients with nonerosive disease, and 6 healthy controls were incubated with RANKL and M‐CSF to obtain osteoclasts. The demographic information and clinical features of the 16 RA patients are shown in Supplementary Table 4 (available on the Arthritis & Rheumatology web site at http://onlinelibrary.wiley.com/doi/10.1002/art.40868/abstract). On day 14, the mean ± SD cell of mature osteoclasts in RA patients with or without erosive disease were significantly higher than in healthy controls, as follows: for erosive RA, 36 ± 8 versus 18 ± 4 (P = 0.008), and for nonerosive RA, 28 ± 7 versus 18 ± 4 (P = 0.042). On day 21, the mean ± SD cell counts in RA patients with or without erosive disease were significantly higher than in healthy controls, as follows: for erosive RA, 165 ± 27 versus 82 ± 11 (P < 0.001), and for nonerosive RA, 109 ± 22 versus 82 ± 11 (P = 0.037) (Figures 2C and D). On day 21, the mean ± SD bone resorption lacunae were significantly higher in RA patients with or without erosive disease than in healthy controls, as follows: for erosive RA, 252 ± 32 versus 74 ± 12 μm2 (P < 0.001), and for nonerosive RA, 135 ± 49 versus 74 ± 12 μm2 (P = 0.026) (Figures 2C and E). The mean ± SD cell counts of mature osteoclasts were significantly higher in RA patients with erosive disease versus those without erosive disease (P = 0.038 and P = 0.002 on days 14 and 21, respectively), as was for day 21, 165 ± 27 versus 109 ± 22 [P = 0.024]) and the mean ± SD pit area of bone resorption lacunae on day 21 (P = 0.006) (Figures 2C–E). These results indicate that elevated PGC‐1β expression in peripheral blood CD14+ monocytes may be involved in the dysregulation of osteoclastogenesis in RA.
Suppression of osteoclastogenesis by inhibition of PGC‐1β
To explore the role of PGC‐1β in osteoclastogenesis in circulating osteoclast precursors, a lentiviral vector with specific PGC‐1β sequence was used to knock down PGC‐1β gene and protein expression in peripheral blood CD14+ monocytes from RA patients (72–86%) (Figure 3A). Expression of DC‐STAMP and bone‐degrading enzymes cathepsin K, TRAP, and MMP‐9 was detected by Western blot analysis. DC‐STAMP is an essential regulator of cell fusion among osteoclast precursors. Cathepsin K is responsible for the degradation of bone collagen, whereas TRAP is correlated with resorption activity of osteoclasts. As a potent gelatinase, MMP‐9 is required for matrix solubilization by osteoclasts. Peripheral blood CD14+ monocytes were cultured in M‐CSF and RANKL for 21 days, and Western blot analysis showed that knockdown of PGC‐1β in these monocytes significantly suppressed the cytoplasmic levels of cathepsin K, TRAP, and MMP‐9 (51–82% reduction) (Figure 3B). Knockdown of PGC‐1β in peripheral blood CD14+ monocytes significantly decreased the number of mature osteoclasts and inhibited bone resorption activity of osteoclasts, as shown by the mean ± SD decreased pit area of bone resorption lacunae on day 21 (for mature osteoclasts, 583 ± 73 versus 69 ± 30 [P < 0.001], and for pit area 725 ± 85 versus 138 ± 21 μm2 [P < 0.001]) (Figures 3C–E). These results indicate that elevated PGC‐1β in osteoclast precursors plays an important role in promoting formation of osteoclasts and their bone resorption activity.
Figure 3.
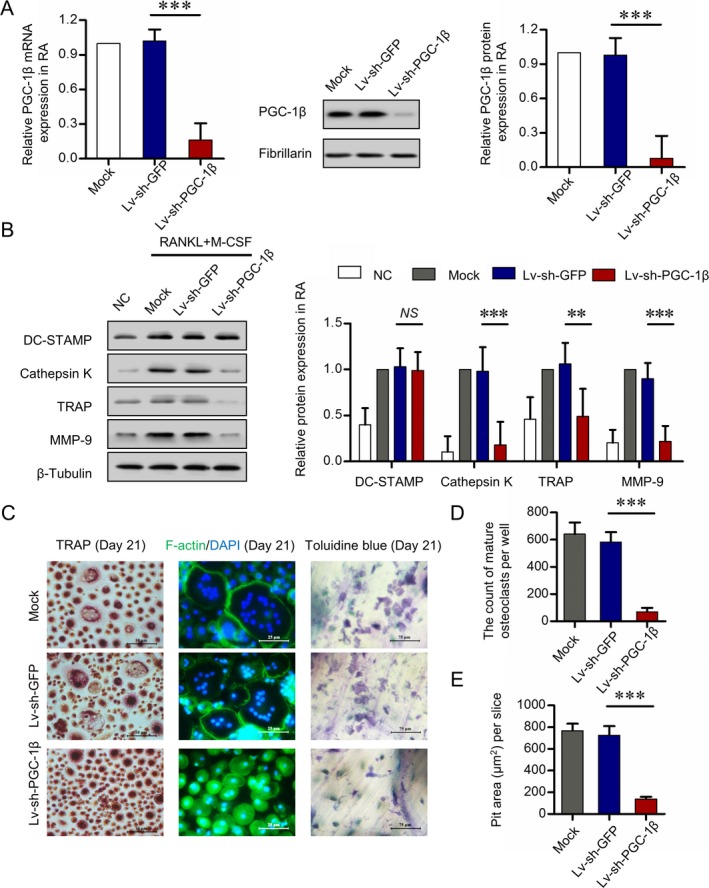
Suppression of osteoclastogenesis with inhibition of PGC‐1β. PB CD14+ monocytes from RA patients were transfected with short hairpin RNA expression lentivirus for PGC‐1β knockdown (lv‐sh‐PGC‐1β) or with empty vector expressing green fluorescent protein (lv‐sh‐GFP) as control. A, Efficiency of PGC‐1β knockdown in PB CD14+ monocytes by lentivirus transfection, detected by quantitative polymerase chain reaction (left and right) and Western blot analysis (middle). B, Expression of DC‐STAMP, cathepsin K, tartrate‐resistant acid phosphatase (TRAP), and matrix metalloproteinase 9 (MMP‐9) following stable knockdown of PGC‐1β in PB CD14+ monocytes for 21 days, assessed by Western blot analysis. The band intensities of DC‐STAMP, cathepsin K, TRAP, and MMP‐9 were normalized to the values for β‐tubulin (left) and compared by Student's t‐test (right). C, PB CD14+ monocytes transfected with lv‐sh‐GFP or lv‐sh‐PGC‐1β and cultured with RANKL and macrophage colony‐stimulating factor (M‐CSF). Mature osteoclasts were detected by TRAP staining (original magnification × 40) on day 21 and fluorescein isothiocyanate–phalloidin staining (original magnification × 100) on day 21. Bone resorption activity of osteoclasts was detected by toluidine blue staining (original magnification × 400) on day 21. D and E, Cell counts of mature osteoclasts (D) and pit area of bone resorption lacunae (E) on day 21. Representative results using samples from 6 RA patients are shown. Data were summarized from 3 independent experiments. Bars show the mean ± SD. ** = P < 0.01; *** = P < 0.001, by Student's t‐test. NC = negative control; NS = not significant (see Figure 1 for other definitions). Color figure can be viewed in the online issue, which is available at http://onlinelibrary.wiley.com/doi/10.1002/art.40868/abstract.
Overexpression of PGC‐1β and promotion of osteoclastogenesis
Confirming our hypothesis that elevated PGC‐1β promotes osteoclastogenesis in circulating osteoclast precursors, we found that a lentiviral vector with PGC‐1β increased the expression of the PGC‐1β gene and protein by 1.9–2.6‐fold in peripheral blood CD14+ monocytes from healthy controls (Figure 4A). Additionally, peripheral blood CD14+ monocytes were cultured in M‐CSF and RANKL for 21 days, and Western blot analysis showed that overexpression of PGC‐1β in these monocytes significantly increased the cytoplasmic levels of cathepsin K, TRAP, and MMP‐9, with a 1.5–1.8‐fold elevation (Figure 4B). Furthermore, overexpression of PGC‐1β significantly increased counts of mature osteoclasts on day 21 and significantly increased bone resorption activity of osteoclasts as measured by the mean ± SD area of bone resorption lacunae on day 21 (for mature osteoclasts, 362 ± 63 versus 184 ± 53 [P = 0.005], and for pit area, 742 ± 53 versus 473 ± 36 μm2 [P = 0.004]) (Figures 4C–E). These results confirmed that PGC‐1β is a critical regulator of osteoclastogenesis and that overexpression of PGC‐1β leads to excessive osteoclast differentiation and their bone resorption activity.
Figure 4.
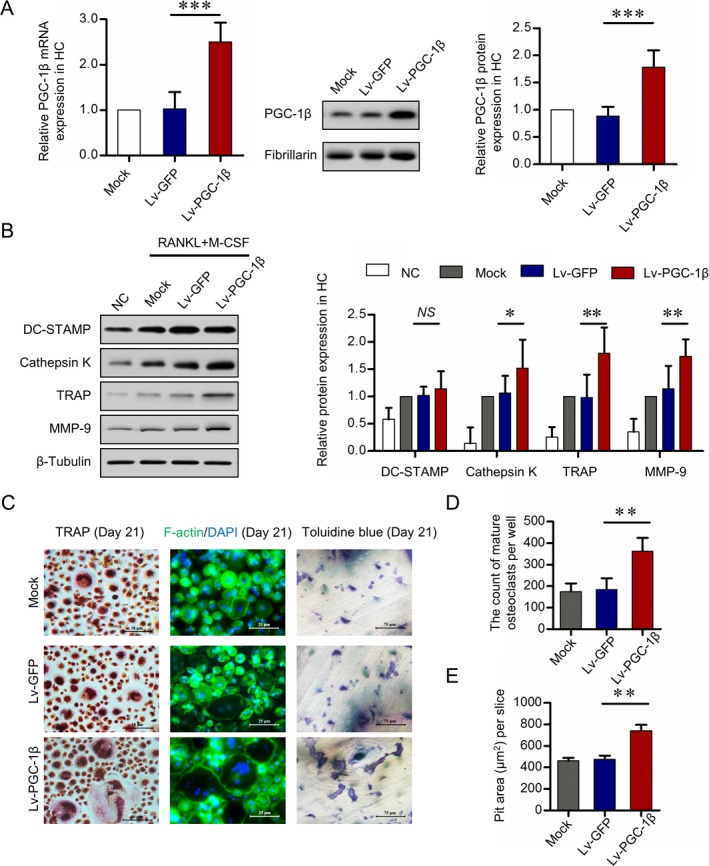
Promotion of osteoclastogenesis by overexpression of PGC‐1β. PB CD14+ monocytes from healthy controls were transfected with lentivirus containing human full‐length PGC‐1β cDNA vector (lv‐PGC‐1β) for PGC‐1β overexpression or with empty vector expressing green fluorescent protein (lv‐GFP) as control. A, Efficiency of PGC‐1β overexpression in PB CD14+ monocytes by lentivirus transfection, detected by quantitative polymerase chain reaction (left and right) and Western blot analysis (middle). B, Expression of DC‐STAMP, cathepsin K, tartrate‐resistant acid phosphatase (TRAP), and matrix metalloproteinase 9 (MMP‐9) following stable overexpression of PGC‐1β in PB CD14+ monocytes for 21 days, assessed by Western blot analysis. The band intensities of DC‐STAMP, cathepsin K, TRAP, and MMP‐9 were normalized to the values for β‐tubulin (left) and compared by Student's t‐test (right). C, PB CD14+ monocytes transfected with lv‐PGC‐1β or lv‐GFP and cultured with RANKL and macrophage colony‐stimulating factor (M‐CSF). Mature osteoclasts were detected by TRAP staining (original magnification × 40) and fluorescein isothiocyanate–phalloidin staining (original magnification × 100) on day 21. Bone resorption activity of osteoclasts was detected by toluidine blue staining (original magnification × 400) on day 21. D and E, Cell counts of mature osteoclasts (D) and pit area of bone resorption lacunae (E) on day 21. Representative results using samples from 6 healthy controls are shown. Data were summarized from 3 independent experiments. Bars show the mean ± SD. ** = P < 0.01; *** = P < 0.001, by Student's t‐test. NC = negative control; NS = not significant (see Figure 1 for other definitions). Color figure can be viewed in the online issue, which is available at http://onlinelibrary.wiley.com/doi/10.1002/art.40868/abstract.
Promotion of osteoclastogenesis through NFATc1 activation
To explore the signaling pathway of PGC‐1β–regulated osteoclastogenesis in circulating osteoclast precursors, peripheral blood CD14+ monocytes with PGC‐1β knockdown from RA patients or with PGC‐1β overexpression from healthy controls were cultured with M‐CSF and RANKL for 24 hours. Western blot analysis showed that knockdown of PGC‐1β in peripheral blood CD14+ monocytes from RA patients significantly decreased the expression of nuclear NFATc1 protein. There was no significant difference in cytoplasmic expression of TRAF6, ERK1/2, p‐ERK1/2, p38, p‐p38, JNK, and p‐JNK or nuclear expression of c‐Jun and c‐Fos between the PGC‐1β knockdown and control groups (Figure 5A). Conversely, overexpression of PGC‐1β in peripheral blood CD14+ monocytes, this time from healthy controls, significantly increased the expression of nuclear NFATc1 protein, but not that of other signaling pathway molecules (Figure 5B).
Figure 5.
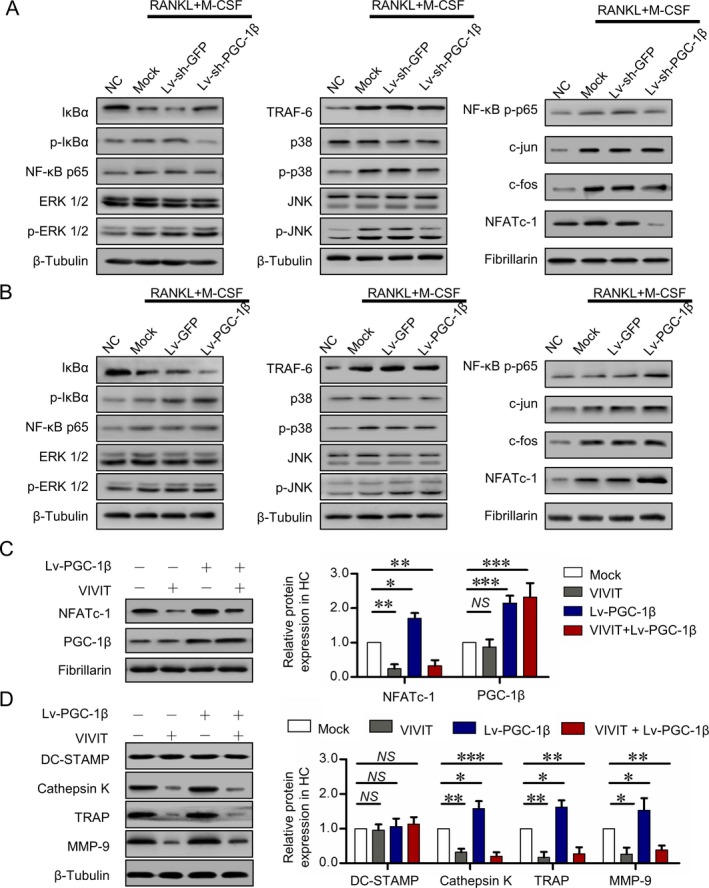
Promotion of osteoclastogenesis by PGC‐1β through the NFATc1 pathway. A, Expression of tumor necrosis factor receptor–associated factor 6 (TRAF6), MAPK, activator protein 1 (AP‐1), and NFATc1 signaling pathways detected by Western blot analysis following stable knockdown of PGC‐1β in PB CD14+ monocytes from RA patients for 24 hours. B, Expression of TRAF6, MAPK, AP‐1, and NFATc1 pathways detected by Western blot analysis following stable overexpression of PGC‐1β in PB CD14+ monocytes from healthy controls for 24 hours. C, Expression of PGC‐1β and NFATc1 detected by Western blot analysis in PB CD14+ monocytes from healthy controls for 24 hours following PGC‐1β overexpression and inhibition of NFATc1. D, DC‐STAMP, cathepsin K, tartrate‐resistant acid phosphatase (TRAP), and matrix metalloproteinase 9 (MMP‐9) expression detected by Western blot analysis in PB CD14+ monocytes from healthy controls for 21 days following PGC‐1β overexpression and inhibition of NFATc1. Data were summarized from 3 independent experiments. Bars show the mean ± SD. * = P < 0.05; ** = P < 0.01; *** = P < 0.001, by Student's t‐test. NC = negative control; lv‐sh‐GFP = short hairpin RNA expression lentivirus expressing green fluorescent protein; lv‐sh‐PGC‐1β = shRNA expression lentivirus for PGC‐1β knockdown; M‐CSF = macrophage colony‐stimulating factor; NS = not significant (see Figure 1 for other definitions). Color figure can be viewed in the online issue, which is available at http://onlinelibrary.wiley.com/doi/10.1002/art.40868/abstract.
To test whether NFATc1 signaling plays a critical role in PGC‐1β–mediated osteoclastogenesis, activation of NFATc1 was inhibited by VIVIT, which selectively inhibits calcineurin‐mediated dephosphorylation of NFAT. Combined with 50 ng/ml of M‐CSF and 100 ng/ml of RANKL for 24 hours, short‐term treatment with 10 μM of VIVIT significantly inhibited nuclear translocation of NFATc1, but not that of PGC‐1β (Figure 5C). Combined with M‐CSF and RANKL for 21 days, long‐term treatment with VIVIT significantly inhibited the cytoplasmic levels of cathepsin K, TRAP, and MMP‐9. It also limited the effect of overexpressed PGC‐1β on promoting the expression of cathepsin K, TRAP, and MMP‐9 in peripheral blood CD14+ monocytes from healthy controls (Figure 5D). These results suggest that PGC‐1β promotes osteoclastogenesis through activation of NFATc1.
Binding of PGC‐1β to NFATc1 promoter and transcriptional activation
In a qPCR analysis to further explore whether PGC‐1β directly regulates NFATc1 transcription, PGC‐1β increased the level of NFATc1 messenger RNA in peripheral blood CD14+ monocytes (data not shown). Dual‐color immunostaining showed a clear NFATc1 and PGC‐1β colocalization signal in the nucleus of peripheral blood CD14+ monocytes from RA patients, whereas the PGC‐1β nuclear signal was markedly lower in cells from healthy controls, and NFATc1 was localized mostly to cytoplasm (Figure 6A). ChIP assay showed that a markedly higher amount of chromosomal DNA containing the NFATc1 promoter was immunoprecipitated with an anti–PGC‐1β antibody compared to control IgG (Figure 6B). ChIP‐qPCR analysis confirmed the immunoprecipitation of PGC‐1β and the NFATc1 promoter (Figure 6C), which indicated that PGC‐1β binds to the NFATc1 promoter region. Dual‐luciferase reporter gene assay showed that overexpressed PGC‐1β in the peripheral blood CD14+ monocytes from healthy controls increased the transcriptional activity of NFATc1 in a dose‐dependent manner (Figure 6D), which suggested that PGC‐1β activates NFATc1transcription.
Figure 6.
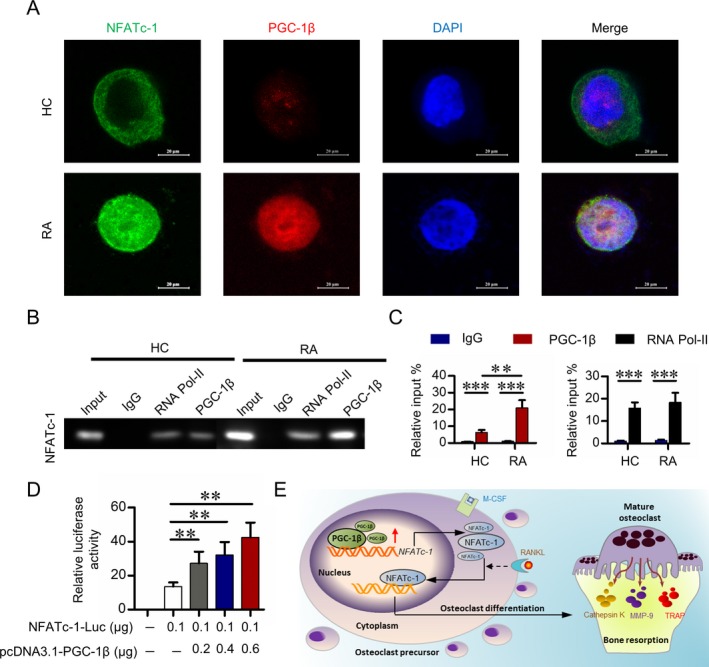
Activation of transcription by the binding of PGC‐1β to the NFATc1 promoter. A, Representative immunofluorescence staining with NFATc1, PGC‐1β, and DAPI in PB CD14+ monocytes from healthy controls and RA patients. Original magnification × 1,000. B, Analysis, by chromatin immunoprecipitation (ChIP) and electrophoresis, of NFATc promoter status of IgG, RNA polymerase II (RNA Pol‐II), and PGC‐1β in PB CD14+ monocytes from healthy controls and RA patients. C, Analysis, by ChIP followed by quantitative polymerase chain reaction, of NFATc promoter status of IgG, RNA polymerase II, and PGC‐1β in PB CD14+ monocytes from RA patients. D, Luciferase activity of the NFATc1 promoter region (shown as fold induction relative to that with the empty pcDNA3.1) after cotransfection with plasmids NFATc1‐luc and pcDNA3.1‐PGC‐1β in PB CD14+ monocytes from healthy controls. Data in C and D were summarized from 3 independent experiments. Bars show the mean ± SD. ** = P < 0.01; *** = P < 0.001, by Student's t‐test. E, Illustration of a novel PGC‐1β/NFATc1 pathway mediating excessive osteoclastogenesis in RA. M‐CSF = macrophage colony‐stimulating factor; MMP‐9 = matrix metalloproteinase 9; TRAP = tartrate‐resistant acid phosphatase (see Figure 1 for other definitions).
Discussion
Excessive bone resorption by osteoclasts is the major cause of bone erosion in RA. Cytokines, such as tumor necrosis factor, interleukin‐1β (IL‐1β), IL‐6, and IL‐17, are effective triggers of bone resorption and some are now targeted in the clinic with inhibitors showing an effect on bone destruction 29, 30, 31. These cytokines induce osteoclast differentiation directly or indirectly by increasing the expression of RANKL, which leads to an increase in osteoclast differentiation and bone resorption activity, and subsequent bone erosion 32, 33, 34. Joint damage can be found in patients who have had RA for only a short time, and studies have shown enhanced levels of bone metabolism markers in RA patients with preclinical disease, which suggests that bone erosion might happen before the onset of clinical inflammation 35, 36. Our in vitro study also showed that peripheral blood CD14+ monocytes from RA patients, especially with erosive disease, had a stronger capability had differentiating into osteoclasts and higher bone resorption activity than cells from healthy controls. Therefore, monocytes preexposed to inflammation in bone marrow and exposed to circulating cytokines exhibit intracellular dysregulation leading to increased osteoclast differentiation and activation.
PGC‐1β plays important roles in regulating energy metabolism and cytokine signaling pathways and is mainly recognized as a mitochondrial and energy regulatory protein. Earlier studies of PGC‐1β focused mainly on metabolic diseases such as hyperlipidemia and diabetes mellitus 37, 38. We previously found that elevated PGC‐1β levels in RA fibroblast‐like synoviocytes promoted their proinflammatory effect and RANKL secretion 24. We then proposed that PGC‐1β might play important roles in osteoclastogenesis in RA. In the present study, we found elevated nuclear expression of PGC‐1β protein in peripheral blood CD14+ monocytes from RA patients, especially those patients with erosive disease. This expression was positively correlated with radiographic scores. Further studies showed that elevated PGC‐1β in RA monocytes promoted osteoclast differentiation and their bone resorption activity. These results implied that PGC‐1β in circulating osteoclast precursors might be involved in RA osteoclastogenesis.
The canonical RANKL signaling pathway inducing osteoclasts involves TRAF6. In the microenvironment of a local joint in RA, large quantities of RANKL bind to RANK on the surface of osteoclast precursors, leading to the activation of adaptor molecules such as TRAF6, which is critical for osteoclast differentiation and activation 39. Downstream signaling pathways from TRAF6 finally activate NFATc1, the master regulator of osteoclastogenesis. Deficiency of Nfatc1 results in complete loss of osteoclastic bone resorption 40, 41. NFATc1 induces its target genes to regulate differentiation, cell fusion, and function of osteoclasts 39. In this study, knockdown or overexpression of PGC‐1β in peripheral blood CD14+ monocytes resulted in decreased or increased expression of NFATc1, and of TRAP, cathepsin K and MMP‐9, but not of TRAF6. Further inhibition of NFATc1 activation limited the role of PGC‐1β in the expression of these genes. These results indicate that PGC‐1β might act as an upstream regulator of NFATc1, but not TRAF6.
PGC‐1β positively regulates both mitochondrial biogenesis and differentiation in osteoclasts. PGC‐1β alone, or NFATc1 co‐overexpression with PGC‐1β in RelB−/− cells, allowed osteoclast differentiation but did not rescue mitochondrial biogenesis (42), suggesting that PGC‐1β/NFATc1 regulation of osteoclast differentiation may occur through a mechanism other than the mitochondrial function of PGC‐1β. The role of PGC‐1β in regulating osteoclastogenesis was confirmed by global deletion of the PGC‐1β gene in mice, leading to increased bone mass and compromised mitochondrial biogenesis in osteoclasts 43. In Tie2‐Cre mice with conditionally deleted PGC‐1β in myeloid lineage cells, the number of osteoclasts was decreased 12. Consistent with these findings, our results clearly showed that, in RA monocytes, PGC‐1β directly binds to the promotor of NFATc1 and regulates its transcription.
In conclusion, our findings provide the first evidence that PGC‐1β in circulating osteoclast precursors regulates osteoclastogenesis in RA, through mechanisms involving interactions in the PGC‐1β/NFATc‐1 pathway. These results indicate that PGC‐1β in peripheral blood CD14+ monocytes might be a promising therapeutic target for RA and other diseases associated with osteoclast activation, ranging from arthritis to bone metastasis (Figure 6E).
Author Contributions
All authors were involved in drafting the article or revising it critically for important intellectual content, and all authors approved the final version to be submitted for publication. Drs. Shao and Dai had full access to all of the data in the study and take responsibility for the integrity of the data and the accuracy of the data analysis.
Study conception and design
Ma, Jing, Shao, Miossec, Dai.
Acquisition of data
Ma, Jing, Wang, Mo, Li, Chen, Shao, Dai.
Analysis and interpretation of data
Ma, Jing, Lin, Shao, Miossec, Dai.
Supporting information
Acknowledgments
We thank all patients and medical staff who generously contributed to this study. We also thank Professor Liwei Lu (University of Hong Kong) and Professor Frank Pessler (TWINCORE Center for Experimental and Clinical Infection Research and Helmholtz Center for Infection Research, Braunschweig, Germany), who kindly provided valuable suggestions for this study.
Supported by the National Natural Science Foundation of China (grants 81471597, 81671612, and 81801606), Guangdong Natural Science Foundation (grants 2017A030313576, 2017A030310236, and 2018A030313541), Guangdong Medical Scientific Research Foundation (grant A2017109), Fundamental Research Funds for the Central Universities (17ykjc12), and the Scientific Program of Traditional Chinese Medicine Bureau of Guangdong Province (grant 20161058).
Drs. Ma and Jing contributed equally to this work.
No potential conflicts of interest relevant to this article were reported.
Contributor Information
Lan Shao, Email: shaolan@mail.sysu.edu.cn.
Lie Dai, Email: dailie@mail.sysu.edu.cn.
References
- 1. Smolen JS, Aletaha D, McInnes IB. Rheumatoid arthritis. Lancet 2016;388:2023–38. [DOI] [PubMed] [Google Scholar]
- 2. Adamopoulos IE, Mellins ED. Alternative pathways of osteoclastogenesis in inflammatory arthritis. Nat Rev Rheumatol 2015;11:189–94. [DOI] [PMC free article] [PubMed] [Google Scholar]
- 3. Okamoto K, Nakashima T, Shinohara M, Negishi‐Koga T, Komatsu N, Terashima A, et al. Osteoimmunology: the conceptual framework unifying the immune and skeletal systems. Physiol Rev 2017;97:1295–349. [DOI] [PubMed] [Google Scholar]
- 4. Komano Y, Nanki T, Hayashida K, Taniguchi K, Miyasaka N. Identification of a human peripheral blood monocyte subset that differentiates into osteoclasts. Arthritis Res Ther 2006;8:R152. [DOI] [PMC free article] [PubMed] [Google Scholar]
- 5. Durand M, Boire G, Komarova SV, Dixon SJ, Sims SM, Harrison RE, et al. The increased in vitro osteoclastogenesis in patients with rheumatoid arthritis is due to increased percentage of precursors and decreased apoptosis: the In Vitro Osteoclast Differentiation in Arthritis (IODA) study. Bone 2011;48:588–96. [DOI] [PubMed] [Google Scholar]
- 6. Rana AK, Li Y, Dang Q, Yang F. Monocytes in rheumatoid arthritis: circulating precursors of macrophages and osteoclasts and their heterogeneity and plasticity role in RA pathogenesis. Int Immunopharmacol 2018;65:348–59. [DOI] [PubMed] [Google Scholar]
- 7. O'Neill LA, Kishton RJ, Rathmell J. A guide to immunometabolism for immunologists. Nat Rev Immunol 2016;16:553–65. [DOI] [PMC free article] [PubMed] [Google Scholar]
- 8. Weyand CM, Goronzy JJ. Immunometabolism in early and late stages of rheumatoid arthritis. Nat Rev Rheumatol 2017;13:291–301. [DOI] [PMC free article] [PubMed] [Google Scholar]
- 9. Murata K, Fang C, Terao C, Giannopoulou EG, Lee YJ, Lee MJ, et al. Hypoxia‐sensitive COMMD1 integrates signaling and cellular metabolism in human macrophages and suppresses osteoclastogenesis. Immunity 2017;47:66–79. [DOI] [PMC free article] [PubMed] [Google Scholar]
- 10. Zeisbrich M, Yanes RE, Zhang H, Watanabe R, Li Y, Brosig L, et al. Hypermetabolic macrophages in rheumatoid arthritis and coronary artery disease due to glycogen synthase kinase 3β inactivation. Ann Rheum Dis 2018;77:1053–62. [DOI] [PMC free article] [PubMed] [Google Scholar]
- 11. Villena JA. New insights into PGC‐1 coactivators: redefining their role in the regulation of mitochondrial function and beyond. FEBS J 2015;282:647–72. [DOI] [PubMed] [Google Scholar]
- 12. Wei W, Wang X, Yang M, Smith LC, Dechow PC, Sonoda J, et al. PGC1β mediates PPARγ activation of osteoclastogenesis and rosiglitazone‐induced bone loss. Cell Metab 2010;11:503–16. [DOI] [PMC free article] [PubMed] [Google Scholar]
- 13. Zhang Y, Rohatgi N, Veis DJ, Schilling J, Teitelbaum SL, Zou W. PGC1β organizes the osteoclast cytoskeleton by mitochondrial biogenesis and activation. J Bone Miner Res 2018;33:1114–25. [DOI] [PMC free article] [PubMed] [Google Scholar]
- 14. Sitara D, Aliprantis AO. Transcriptional regulation of bone and joint remodeling by NFAT. Immunol Rev 2010;233:286–300. [DOI] [PMC free article] [PubMed] [Google Scholar]
- 15. Arnett FC, Edworthy SM, Bloch DA, McShane DJ, Fries JF, Cooper NS, et al. The American Rheumatism Association 1987 revised criteria for the classification of rheumatoid arthritis. Arthritis Rheum 1988;31:315–24. [DOI] [PubMed] [Google Scholar]
- 16. Aletaha D, Neogi T, Silman AJ, Funovits J, Felson DT, Bingham CO III, et al. 2010 rheumatoid arthritis classification criteria: an American College of Rheumatology/European League Against Rheumatism collaborative initiative. Arthritis Rheum 2010;62:2569–81. [DOI] [PubMed] [Google Scholar]
- 17. Ma JD, Zhou JJ, Zheng DH, Chen LF, Mo YQ, Wei XN, et al. Serum matrix metalloproteinase‐3 as a noninvasive biomarker of histological synovitis for diagnosis of rheumatoid arthritis. Mediators Inflamm 2014;2014:179284. [DOI] [PMC free article] [PubMed] [Google Scholar]
- 18. Lin JZ, Liang JJ, Ma JD, Li QH, Mo YQ, Cheng WM, et al. Myopenia is associated with joint damage in rheumatoid arthritis: a cross‐sectional study. J Cachexia Sarcopenia Muscle 2019;10:355–67. [DOI] [PMC free article] [PubMed] [Google Scholar]
- 19. Prevoo ML, van ‘t Hof MA, Kuper HH, van Leeuwen MA, van de Putte LB, van Riel PL. Modified disease activity scores that include twenty‐eight–joint counts: development and validation in a prospective longitudinal study of patients with rheumatoid arthritis. Arthritis Rheum 1995;38:44–8. [DOI] [PubMed] [Google Scholar]
- 20. Van der Heijde DM. How to read radiographs according to the Sharp/van der Heijde method. J Rheumatol 1999;26:743–5. [PubMed] [Google Scholar]
- 21. Ma JD, Wei XN, Zheng DH, Mo YQ, Chen LF, Zhang X, et al. Continuously elevated serum matrix metalloproteinase‐3 for 3–6 months predict one year radiographic progression in rheumatoid arthritis: a prospective cohort study. Arthritis Res Ther 2015;17:289. [DOI] [PMC free article] [PubMed] [Google Scholar]
- 22. Van der Heijde D, van der Helm‐van MA, Aletaha D, Bingham CO, Burmester GR, Dougados M, et al. EULAR definition of erosive disease in light of the 2010 ACR/EULAR rheumatoid arthritis classification criteria. Ann Rheum Dis 2013;72:479–81. [DOI] [PubMed] [Google Scholar]
- 23. Gu P, Chen X, Xie R, Han J, Xie W, Wang B, et al. lncRNA HOXD‐AS1 regulates proliferation and chemo‐resistance of castration‐resistant prostate cancer via recruiting WDR5. Mol Ther 2017;25:1959–73. [DOI] [PMC free article] [PubMed] [Google Scholar]
- 24. Zhou JJ, Ma JD, Mo YQ, Zheng DH, Chen LF, Wei XN, et al. Down‐regulating peroxisome proliferator‐activated receptor‐γ coactivator‐1 β alleviates the proinflammatory effect of rheumatoid arthritis fibroblast‐like synoviocytes through inhibiting extracellular signal‐regulated kinase, p38 and nuclear factor‐κβ activation. Arthritis Res Ther 2014;16:472. [DOI] [PMC free article] [PubMed] [Google Scholar]
- 25. Chen X, Xie W, Gu P, Cai Q, Wang B, Xie Y, et al. Upregulated WDR5 promotes proliferation, self‐renewal and chemoresistance in bladder cancer via mediating H3K4 trimethylation. Sci Rep 2015;5:8293. [DOI] [PMC free article] [PubMed] [Google Scholar]
- 26. Chen X, Gu P, Xie R, Han J, Liu H, Wang B, et al. Heterogeneous nuclear ribonucleoprotein K is associated with poor prognosis and regulates proliferation and apoptosis in bladder cancer. J Cell Mol Med 2017;21:1266–79. [DOI] [PMC free article] [PubMed] [Google Scholar]
- 27. Metzelder SK, Michel C, von Bonin M, Rehberger M, Hessmann E, Inselmann S, et al. NFATc1 as a therapeutic target in FLT3‐ITD‐positive AML. Leukemia 2015;29:1470–7. [DOI] [PubMed] [Google Scholar]
- 28. Chen X, Xie R, Gu P, Huang M, Han J, Dong W, et al. Long noncoding RNA LBCS inhibits self‐renewal and chemoresistance of bladder cancer stem cells through epigenetic silencing of SOX2. Cancer Res 2019;25:1389–403. [DOI] [PubMed] [Google Scholar]
- 29. Noack M, Miossec P. Selected cytokine pathways in rheumatoid arthritis. Semin Immunopathol 2017;39:365–83. [DOI] [PubMed] [Google Scholar]
- 30. Osta B, Roux JP, Lavocat F, Pierre M, Ndongo‐Thiam N, Boivin G, et al. Differential effects of IL‐17A and TNF‐α on osteoblastic differentiation of isolated synoviocytes and on bone explants from arthritis patients. Front Immunol 2015;6:151. [DOI] [PMC free article] [PubMed] [Google Scholar]
- 31. Ndongo‐Thiam N, Clement A, Pin JJ, Razanajaona‐Doll D, Miossec P. Negative association between autoantibodies against IL‐17, IL‐17/anti‐IL‐17 antibody immune complexes and destruction in rheumatoid arthritis. Ann Rheum Dis 2016;75:1420–2. [DOI] [PubMed] [Google Scholar]
- 32. Walsh MC, Takegahara N, Kim H, Choi Y. Updating osteoimmunology: regulation of bone cells by innate and adaptive immunity. Nat Rev Rheumatol 2018;14:146–56. [DOI] [PMC free article] [PubMed] [Google Scholar]
- 33. Shim JH, Stavre Z, Gravallese EM. Bone loss in rheumatoid arthritis: basic mechanisms and clinical implications. Calcif Tissue Int 2018;102:533–46. [DOI] [PubMed] [Google Scholar]
- 34. Ikebuchi Y, Aoki S, Honma M, Hayashi M, Sugamori Y, Khan M, et al. Coupling of bone resorption and formation by RANKL reverse signalling. Nature 2018;561:195–200. [DOI] [PubMed] [Google Scholar]
- 35. Van Schaardenburg D, Nielen MM, Lems WF, Twisk JW, Reesink HW, van de Stadt RJ, et al. Bone metabolism is altered in preclinical rheumatoid arthritis [letter]. Ann Rheum Dis 2011;70:1173–4. [DOI] [PubMed] [Google Scholar]
- 36. Van Nies JA, van Steenbergen HW, Krabben A, Stomp W, Huizinga TW, Reijnierse M, et al. Evaluating processes underlying the predictive value of baseline erosions for future radiological damage in early rheumatoid arthritis. Ann Rheum Dis 2015;74:883–9. [DOI] [PubMed] [Google Scholar]
- 37. Chen S, Wen X, Zhang W, Wang C, Liu J, Liu C. Hypolipidemic effect of oleanolic acid is mediated by the miR‐98‐5p/PGC‐1β axis in high‐fat diet‐induced hyperlipidemic mice. FASEB J 2017;31:1085–96. [DOI] [PubMed] [Google Scholar]
- 38. Villegas R, Williams SM, Gao YT, Long J, Shi J, Cai H, et al. Genetic variation in the peroxisome proliferator‐activated receptor (PPAR) and peroxisome proliferator‐activated receptor γ co‐activator 1 (PGC1) gene families and type 2 diabetes. Ann Hum Genet 2014;78:23–32. [DOI] [PMC free article] [PubMed] [Google Scholar]
- 39. Park JH, Lee NK, Lee SY. Current understanding of RANK signaling in osteoclast differentiation and maturation. Mol Cells 2017;40:706–13. [DOI] [PMC free article] [PubMed] [Google Scholar]
- 40. Aliprantis AO, Ueki Y, Sulyanto R, Park A, Sigrist KS, Sharma SM, et al. NFATc1 in mice represses osteoprotegerin during osteoclastogenesis and dissociates systemic osteopenia from inflammation in cherubism. J Clin Invest 2008;118:3775–89. [DOI] [PMC free article] [PubMed] [Google Scholar]
- 41. Winslow MM, Pan M, Starbuck M, Gallo EM, Deng L, Karsenty G, et al. Calcineurin/NFAT signaling in osteoblasts regulates bone mass. Dev Cell 2006;10:771–82. [DOI] [PubMed] [Google Scholar]
- 42. Zeng R, Faccio R, Novack DV. Alternative NF‐κB regulates RANKL‐induced osteoclast differentiation and mitochondrial biogenesis via independent mechanisms. J Bone Miner Res 2015;30:2287–99. [DOI] [PMC free article] [PubMed] [Google Scholar]
- 43. Ishii KA, Fumoto T, Iwai K, Takeshita S, Ito M, Shimohata N, et al. Coordination of PGC‐1β and iron uptake in mitochondrial biogenesis and osteoclast activation. Nat Med 2009;15:259–66. [DOI] [PubMed] [Google Scholar]
Associated Data
This section collects any data citations, data availability statements, or supplementary materials included in this article.
Supplementary Materials