

Abstract
The real‐world evidence on the profiles of patients suffering from atopic dermatitis (AD) in Japan is sparse. A retrospective claim database analysis was conducted to estimate the health‐care resource use (HCRU) and current AD treatment. Data from October 2013 to September 2016 were extracted from the JMDC (Tokyo, Japan) claims database. HCRU was assessed by a comparison of AD patients and matched non‐AD controls. A multivariate analysis was performed to estimate HCRU attributable to AD. AD patients (n = 39 893) have more claims of certain diagnoses such as rhinitis, viral and fungal infections, sleep disorders and conjunctivitis as well as higher HCRU (outpatient visits, prescriptions of AD‐related and non‐AD‐related medications, phototherapy, laboratory tests) than matched non‐AD controls (n = 39 893). Treatment pattern analysis included treatment‐naive patients (n = 8478) and previously treated AD patients (n = 30 109). Approximately 20% of previously treated patients were on the continuous systemic treatment during 18‐month follow up. Systemic corticosteroids were the most frequently used systemic treatments. Oral cyclosporin was less frequently used in both groups, but for the longest duration. Almost half of previously treated patients with oral cyclosporin continued treatment for more than 3 months. In conclusion, HCRU was higher in AD patients than non‐AD controls, indicating a high burden of the disease imposed on AD patients. Continuous administration of systemic treatment, such as oral cyclosporin, systemic corticosteroids and phototherapy, observed in AD patients sheds light on the difficulties of managing AD in Japanese clinical practise.
Keywords: atopic dermatitis, claim database, Japan, health‐care resource use, treatment patterns
Introduction
Atopic dermatitis (AD) is a pruritic, eczematous dermatitis with symptoms chronically fluctuating with remissions and relapses.1 In 85% of AD patients, the first symptoms appear under the age of 5 years and precede the so‐called “atopic march”, which manifests itself as the development of other allergic diseases such as allergic rhinitis and asthma progressing with age.2 AD is characterized by the occurrence of a wide spectrum of symptoms. The three main diagnostic criteria provided by the Japanese Dermatological Association (JDA) include pruritus, eczema of typical morphology and distribution, and the recurrent course of the disease.1 However, notable differences have been reported depending on the age of onset and geographic region.3 Red or brownish patches of dry, cracked or scaly and itchy skin are a common complaint across all patient groups. The prevalences of AD characteristics differ across regions and it is reported that patients from East Asia (including Japan) experience erythroderma and involvement of the skin on the trunk, scalp, ears and extensor area of joints more frequently than patients from other regions.3
The point prevalence of adult AD is high and is estimated to range 2.1–4.9% across countries.4 Barbarot et al.4 applied strict inclusion criteria and as a result their survey conducted among patients aged 18–65 years old revealed the prevalence of treated AD to be 3.9% in the USA, 2.6% in Canada, 3.5% in the EU and 1.5% in Japan. It is worth noting that a considerable increase in the prevalence of AD among young adult patients was reported as well. In 20–29‐year‐old patients, the percentage of those affected by AD increased from 3.1% in 1967 to 38.7% in 1996.5 The course of AD among adults is characterized by slower remissions and different disease phenotypes, especially when compared with early childhood onset of AD.6
The JDA guidelines define the goal of AD treatment as the possibility to reach and maintain a state with no or mild symptoms, which does not disturb daily activities while the patient is not on active treatment.1 Currently, a wide range of options are available for AD patients with treatment based on the three fundamental pillars of identification and avoidance of contact with exacerbating factors, correction of skin dysfunctions and pharmacotherapy.7 The aim of skin care treatment, predominantly with emollients, is to restore the skin barrier function by increasing moisture retention, decreasing susceptibility to infections and lowering itch. Ointments with corticosteroids, calcineurin inhibitors and rarely non‐steroidal anti‐inflammatory drugs help to reduce inflammatory responses of the skin. Oral antihistamines are used to reduce itch and itch‐related scratching which contribute to the aggravation of symptoms, infections and ocular complications. Cyclosporin is used to treat adult patients with severe AD who are resistant to other medications. Oral corticosteroids are used to induce remission and to alleviate symptoms in the most severe cases; however, their use is burdened with serious systemic adverse reactions.1 Phototherapy is recommended in severe refractory disease in combination therapy.1, 8
There is little evidence in the published work regarding patient profile, treatment patterns and the economic burden of AD on patients in Japan. Additionally, real‐world evidence studies on a large number of patients suffering from AD in Japan are sparse. To address this absence, this observational retrospective longitudinal analysis was conducted to provide reliable insight on the burden of AD in the Japanese population. Here, we aimed to depict profiles of patients suffering from AD, to estimate health‐care resource use (HCRU) attributable to AD in patients (objective A) and to describe available treatment options for AD in Japan (objective B).
Methods
An observational retrospective longitudinal analysis was conducted.
Data source
The data for the analyses were taken from JMDC (Tokyo, Japan), which owns data on claims sourced from the health insurance system in Japan. The database contains both medical and pharmacy claims representing approximately 3 million people insured by several private health insurance plans in Japan through a panel of 1.2 million individuals to date and covers up to 9 years of historical data. In this study, data from October 2013 to September 2016 were extracted.
Study period
The first date with AD claim during the patient selection period was defined as index date. Patients were observed for 6 months before the index date in order to examine their medical history and main comorbidities. A period of 12 months after the index date was used to assess the annual HCRU attributable to AD (Fig. 1). A period of 18 months after the index date was used to determine treatment patterns in AD.
Figure 1.
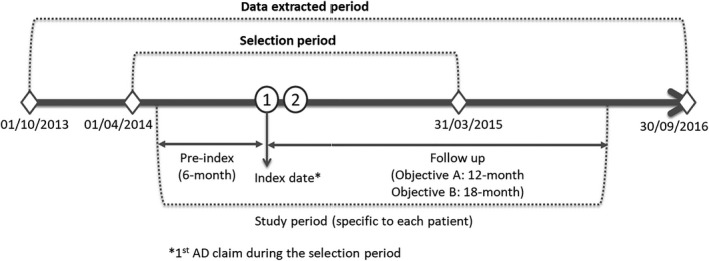
Study period. AD, atopic dermatitis.
Population
Patients qualified for the analysis if they fulfilled the following criteria:
They had at least two medical claims (inpatient, outpatient or combination of both) carrying an International Classification of Diseases, 10th Revision (ICD‐10) code for AD (atopic dermatitis [L20] and other specified disorders of the skin and subcutaneous tissue [L988]) within the selection period (12 months between 1 April 2014 and 31 March 2015 with an index date defined as the first of the two claims) (Fig. 1).
They were continuously registered in the JMDC database for at least 6 months before the index date (exclusive of the index date) and 12 months after the index date (including index date) (Fig. 1).
They were between 15 and 60 years of age at the index date.
To avoid inclusion of patients who were treated with systemic medications for other comorbid autoimmune diseases than AD, several exclusion criteria were applied. Patients were excluded if they had two or more medical claims related to other autoimmune diseases treated with systemic therapy at any time during the study period, including inflammatory bowel disease (along with ulcerative colitis and Crohn's disease [K50–K52]), lupus erythematosus (L93, M32), rheumatoid arthritis (M06, M05, M08.0), psoriatic arthritis (M07.0, M07.1, M07.2, M07.3, L40.5, M09.0), psoriasis (L40), ankylosing spondylitis and non‐infectious uveitis (M45, M08.1, H20). Patients who had undergone organ transplantation (Z94, Y83.0, T86) were also excluded.
To determine treatment patterns in AD patients, a subpopulation with continuous enrollment in the JMDC database for at least 18 months after the index date (inclusive of the index date) was identified.
Subcohorts
For the determination of treatment patterns for AD, patients were divided into two subcohorts based on the pre‐index treatment history:
Treatment‐naive patients, defined as patients without any prescription treatments related to AD therapy during the pre‐index period.
Previously treated patients, defined as patients with at least one prescription related to AD therapy during the pre‐index period.
Prescriptions for AD‐related therapy included emollients, topical corticosteroids (TCS), topical calcineurin inhibitors (TCI), oral cyclosporin A, systemic corticosteroids (SCS) and phototherapy identified using Anatomical Therapeutic Chemical codes and general names.
Matching analysis
To estimate the HCRU attributable to AD, an exact matching was performed. This method enabled the study of HCRU in AD patients and non‐AD controls, which became comparable otherwise based on paired key variables.
Individuals were included in the control group if they fulfilled the following criteria:
They had no claims carrying an ICD‐10 code for AD (L20, L988) within the selection period (12 months between 1 April 2014 and 31 March 2015 with an index date defined as the first of the two claims).
They were continuously registered in the JMDC database for at least 6 months before the index date (excluding the index date) and 12 months after the index date (including the index date).
They were between 15 and 60 years of age at the index date.
Exclusion criteria were the same as those applied for AD patients.
Atopic dermatitis patients and non‐AD controls were matched 1:1 for sex and age at the index date (±5 years), the month of index date, the presence of asthma diagnosis‐related claims and the Charlson Comorbidity Index (CCI) (±2 scores) during the 6‐month pre‐index period. To calculate CCI, the presence of two or more medical claims with a claim diagnosis was required.9 By employing CCI as one of the factors, it was possible to normalize the severity levels of the patients’ comorbidities in both cohorts. If more than one matched control was available, only one patient was randomly selected. If no matched control was available, then the case was not included. CCI serves as a measure of the severity of illness and a determination of the presence of relevant comorbid illness. CCI considers the following 19 diagnoses: myocardial infarction, congestive heart failure, peripheral vascular disease, dementia, diabetes mellitus, cerebrovascular disease, chronic pulmonary disease, connective tissue disease, ulcer, mild liver disease, hemiplegia, diabetes with end organ disease, moderate or severe renal disease, any tumor, leukemia and lymphoma.9
Outcome measures
Characteristics of AD population
The following data on the characteristics of the AD population were extracted at the index date and analyzed: age, sex (male or female), insurance type (insured or dependent) and treatment setting (public hospital, university hospital, other hospital, clinic and unknown). Data on claims related to comorbidities were extracted in the 6‐month pre‐index period and included the following comorbidities: asthma, allergic rhinitis, food allergy, bacterial infection, viral infection, fungal infection, attention deficit hyperactivity disorder, anxiety, depression, sleep disorders, chronic pulmonary disease, conjunctivitis, chronic rhinosinusitis, nasal polyps, allergic urticarial, esophagitis, autoimmune disorders, obesity, myocardial infarction, congestive heart failure, peripheral vascular disease, dementia, diabetes mellitus, cerebrovascular disease, chronic pulmonary disease, connective tissue disease, peptic disease, mild liver disease, hemiplegia, diabetes with end organ disease, moderate or severe renal disease, any tumor, leukemia and lymphoma.10, 11
Health‐care resource use
All‐cause HCRU, defined as HCRU which occurred for any reasons not necessarily for AD, included the following components: outpatient physician visits, hospitalizations (including any procedures), emergency room visits (including any procedures), outpatient phototherapy, outpatient prescriptions for AD‐related and non‐AD related medications, and outpatient laboratory tests. The average number of claims and percentages of patients with and without claims in each of the HCRU domains by AD diagnosis were calculated for the overall follow‐up period of 1 year.
Treatment patterns
The first set of analyses evaluated treatment patterns using the following treatment categories:
Systemic treatment including oral cyclosporin A, SCS and phototherapy.
Topical treatment (high potency) including TCS (the strongest and very strong class defined according to the JDA 2016 guidelines).1
Topical treatment (low‐to‐medium potency) including TCS (strong, medium and weak class defined according to the JDA 2016 guidelines).1
Only skin care including emollients.
Not treated by studied treatments.
Several rules were used to study treatment patterns retrieved from the database as treatment lines defined in the study: (i) treatment lines were constructed at the treatment class level, namely without differentiating drugs within the same class level; (ii) a treatment sequence was defined as a group of consecutive prescriptions of the same treatment class or combination of treatment class, without discontinuation of more than 60 days between the theoretical end date of a prescription and the following prescription; (iii) 60 days were applied considering the average visiting frequency of patients to request a refill of medications; (iv) any combination of treatments from different treatment classes was classified into a higher grade (i.e. only skin care < topical treatment low–medium < topical treatment high < systemic treatment); and (v) the index treatment line was defined as the first treatment line recorded during the 18‐month follow‐up period (Fig. 2).
Figure 2.
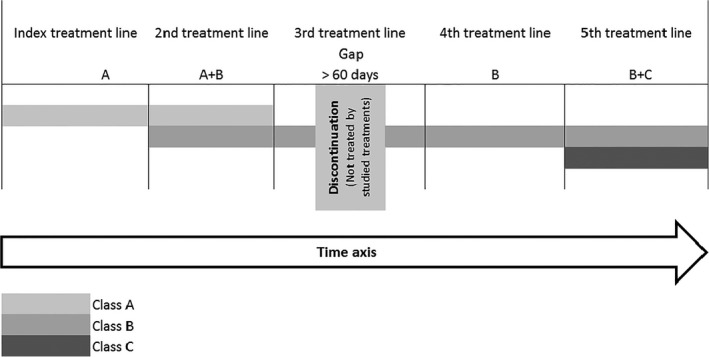
Treatment lines defined in the study.
The following variables were calculated for treatment lines: (i) the number of treatment lines during the 18‐month follow up; (ii) the distribution and duration of index treatment line; and (iii) the distribution of index treatment lines in patients being on the same treatment during the 18‐month follow‐up period.
The second set of analyses evaluated systemic treatments using the following treatment categories: oral cyclosporin, SCS and phototherapy. Each treatment line was analyzed separately through treatment line generation, and combinations of treatments were not considered. The total duration of treatment lines during the 18‐month follow‐up period and the duration of the first use after the index date were calculated.
Statistical analysis
Descriptive statistics were used to describe patient characteristics and their comorbidities in groups analyzed in the study (AD patients vs matched non‐AD controls and naive patients vs previously treated patients). Categorical variables were compared with the χ2‐test or Fisher's exact test, while continuous variables were compared with Student's t‐test or the Wilcoxon test. A multivariate analysis was performed to estimate HCRU attributable to AD. Multivariate regression methods were used with an adjustment on the potential confounding factors, including baseline characteristics such as sex, age, insurance type, the setting of claim, CCI and comorbidities in the 6‐month pre‐index period, month of the index date and HCRU in the 6‐month pre‐index period. A P‐value of 0.05 was considered statistically significant. Akaike Information Criterion was used to compare the fit of estimated models.12 The model with the smaller statistic was preferred.
In the case of a large proportion of zeros in HCRU variables (i.e. a high number of patients without HCRU), two‐part models were developed to estimate HCRU attributable to AD, unless a lack of convergence was identified in the logistic model. In the case of lack of convergence in the logistic model, only the second part was conducted on patients both with and without events. Analyses were performed using SAS version 9.3 software (SAS Institute, Cary, NC, USA).
Results
Patient profiles and HCRU in patients with AD (objective A)
To depict the profile and HCRU in Japanese AD patients, we first identified the patient cohorts of AD and their control (Table 1, Fig. 3). The exact matching resulted in the inclusion of 39 893 patients with AD and 39 893 non‐AD matched controls satisfying the inclusion and exclusion criteria. The mean age of AD patients was approximately 34 years old. Of the study group, 55% were male, CCI was 0.10 and more than 57% were self‐insured. The age difference between two groups was significant despite matching nature, due to the small confidence interval with large numbers of patients with ±5 years allowance for matching strategy. Regarding comorbidities in AD patients and non‐AD controls, rhinitis and conjunctivitis were the two most prevalent coexisting diseases in AD patients. The highest prevalence in AD patients, over 4%, was observed for rhinitis, viral infection, fungal infection, sleep disorder and conjunctivitis. There were significant differences in these comorbidities between AD patients and non‐AD controls.
Table 1.
Patient characteristics at index date and during 6 months before the index date by study groups
| Characteristics | Assessment of HCRU (Objective A) | Assessment of treatment patterns (Objective B) | |||||
|---|---|---|---|---|---|---|---|
| AD patients (n = 39 893) | Matched non‐AD controls (n = 39 893) | P | Naive (n = 8478) | Previously treated (n = 30 109) | P | ||
| Sex | Male | 21 928 (54.97%) | 21 928 (54.97%) | 1.00 | 4401 (51.91%) | 16 941 (56.27%) | <0.0001 |
| Female | 17 965 (45.03%) | 17 965 (45.03%) | 4077 (48.09%) | 13 168 (43.73%) | |||
| Age, years | Mean (SD) | 34.15 (11.62) | 34.55 (11.58) | <0.0001 | 33.78 (11.97) | 34.36 (11.52) | <0.0001 |
| 95% CI | (34.04–34.27) | (34.44–34.67) | (33.53–34.03) | (34.23–34.49) | |||
| Insurance type | Insured | 23 129 (57.98%) | 23 059 (57.80%) | 0.62 | 4630 (54.61%) | 17 891 (59.42%) | <0.0001 |
| Dependent | 16 764 (42.02%) | 16 834 (42.20%) | 3848 (45.39%) | 12 218 (40.58%) | |||
| CCI in the 6‐month pre‐index period | Mean (SD) | 0.10 (0.46) | 0.10 (0.45) | 0.06 | 0.09 (0.43) | 0.11 (0.47) | 0.001 |
| 95% CI | (0.10–0.11) | (0.09–0.10) | (0.08–0.10) | (0.10–0.11) | |||
AD, atopic dermatitis; CCI, Charlson Comorbidity Index; CI, confidence interval; HCRU, health‐care resource use; SD, standard deviation.
Figure 3.
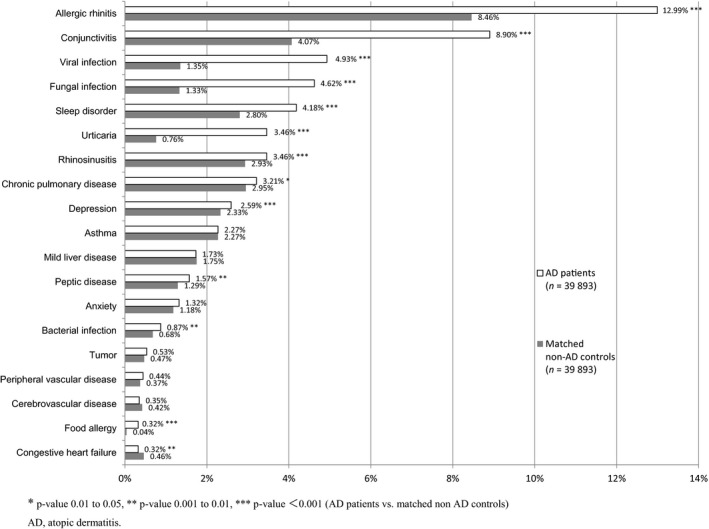
Patient comorbidities in the 6‐month pre‐index period (incidence >0.3%). AD, atopic dermatitis.
No remarkable differences (of <0.01%) were observed for dementia, renal disease, diabetes with or without complications, nasal polyps and metastatic solid tumors between AD patients and non‐AD controls. The differential prevalence of asthma could not be estimated as it was a matching criterion (2.27% in both groups). The baseline demographic characteristics are shown in Table 1 and Figure 3.
The descriptive analysis showed a higher frequency of the use of at least one HCRU claim in AD patients in comparison with non‐AD controls for outpatient visits, prescriptions of AD‐related and non‐AD related medication, and phototherapy (P < 0.0001 for all; Table 2). Conversely to AD patients, the occurrence of at least one hospitalization was higher in non‐AD controls (P < 0.0001). Differences were also observed regarding the average number of HCRU claims, which took place during the study period. The mean number of outpatient visits, laboratory tests, prescriptions of AD‐related and non‐AD related medication, and phototherapy were significantly higher in AD patients in comparison with controls (P < 0.0001), whereas the difference in hospitalization rates was insignificant (P = 0.24). No emergency visits were observed during the study period.
Table 2.
Health‐care resource use
| AD patients (n = 39 893) | Non‐AD controls (n = 39 893) | P | |
|---|---|---|---|
| Outpatient visits | |||
| No. of patients | 39 884 (99.98%) | 38 946 (97.63%) | <0.0001 |
| Times, mean (SD) | 14.36 (13.18) | 7.64 (10.00) | <0.0001 |
| Hospitalizations | |||
| No. of patients | 1808 (4.53%) | 1921 (4.82%) | 0.06 |
| Days, mean (SD) | 10.64 (27.47) | 11.78 (31.65) | 0.24 |
| Laboratory tests | |||
| No. of patients | 29 664 (74.36%) | 30 226 (75.77%) | <0.0001 |
| Items, mean (SD) | 13.72 (13.76) | 11.58 (12.91) | <0.0001 |
| Prescription of AD medication | |||
| No. of patients | 37 829 (94.83%) | 10 768 (26.99%) | <0.0001 |
| Times, mean (SD) | 5.97 (4.81) | 2.38 (3.52) | <0.0001 |
| Phototherapy | |||
| No. of patients | 2266 (5.68%) | 479 (1.20%) | <0.0001 |
| Times, mean (SD) | 6.35 (8.10) | 3.22 (4.99) | <0.0001 |
| Prescription of non‐AD medication | |||
| No. of patients | 39 116 (98.05%) | 35 558 (89.13%) | <0.0001 |
| Times, mean (SD) | 10.19 (8.84) | 5.62 (6.87) | <0.0001 |
AD, atopic dermatitis; SD, standard deviation.
The multivariate analysis was conducted to avoid potential confounding factors (Table 3). The results consistently showed higher HCRU in AD patients compared with non‐AD controls for the following components: outpatient visits (attributable HCRU to AD/year, 6.324), laboratory tests (attributable HCRU to AD/year, 1.669), the number of prescriptions for AD‐related medication (attributable HCRU to AD/year, 5.198), the number of prescriptions for non‐AD‐related medication (attributable HCRU to AD/year, 5.823) and phototherapy (attributable HCRU to AD/year, 0.326). A slightly lower HCRU in AD patients in comparison with non‐AD controls was revealed for hospitalizations (attributable HCRU to AD/year, −0.002). The results of multivariate analysis for HCRU are shown in Table 3.
Table 3.
Health‐care resource use (multivariate analysis)
| Mean times*/year | Attributable value to AD/year | ||
|---|---|---|---|
| AD case (n = 39 893) | Non‐AD controls (n = 39 893) | ||
| Outpatient visits | 13.893 | 7.569 | 6.324 |
| Hospitalizations | 0.053 | 0.055 | −0.002 |
| Laboratory tests | 10.398 | 8.729 | 1.669 |
| Prescription of AD medication | 5.829 | 0.631 | 5.198 |
| Phototherapy | 0.382 | 0.056 | 0.326 |
| Prescription of non‐AD medication | 10.695 | 4.872 | 5.823 |
*Prescription: average number of days prescription was given/year; Laboratory tests: average number of items/year. AD, atopic dermatitis.
Treatment patterns of patients with AD (objective B)
The assessment of treatment patterns was conducted in two groups of patients: naive patients (n = 8478) and previously treated patients (n = 30 109; Table 1). The mean age of patients was approximately 34 years old in both groups. In naive patients, a smaller percentage of patients were male in comparison with previously treated patients (51% vs 56%, P < 0.0001). CCI was significantly lower in the treatment of the naive group compared with previously treated patients (0.09 vs 0.11, P < 0.0001). Self‐insured dominated in previously treated patients (54% in naive vs 59% in previously treated, P < 0.0001).
The number of treatment lines during the 18‐month follow up is summarized in Table 4. Almost half of patients had 5–10 treatment lines during the 18‐month follow‐up period in both naive and previously treated patients (46% vs 57%). A greater percentage of patients of the naive group had only one treatment line during the 18‐month follow up in comparison with the previously treated group (14.7% vs 6.7%).
Table 4.
Number of treatment lines during the 18‐month follow up
| No. of treatment lines | Naive patients (n = 8478) | Previously treated patients (n = 30 109) |
|---|---|---|
| 1 | 1245 (14.7%) | 2014 (6.7%) |
| 2 | 1120 (13.2%) | 3515 (11.7%) |
| 3 | 919 (10.8%) | 2101 (7%) |
| 4 | 1167 (13.8%) | 4263 (14.2%) |
| 5–10 | 3899 (46%) | 17 160 (57%) |
| 11–20 | 128 (1.5%) | 1056 (3.5%) |
| 20< | 0 (0%) | 0 (0%) |
Of the naive patients without any treatment line change during the follow up (n = 1245), 62.2% were not treated by the studied treatment during the follow up. Topical treatment (high potency) was the most frequently administrated medication (17.3%), followed by topical treatment (low to medium potency) (9.6%) and systemic treatment (8.4%).
In previously treated patients without any treatment line change during the follow up (n = 2014), more patients were continuously treated with topical treatment (high potency) (30.2%) and systemic treatment (20.7%) compared with naive patients. Fewer patients were not treated by the studied treatment during the follow up compared with naive patients (34%). The distribution of patients without any changes in treatment during 18‐month follow up is shown in Figure 4.
Figure 4.
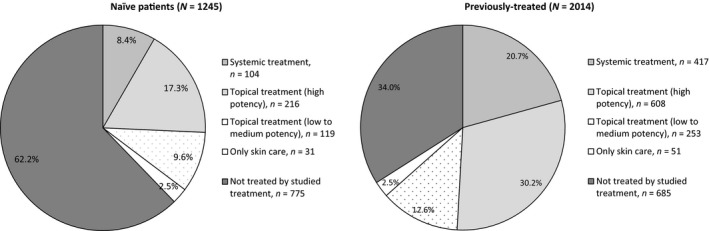
Patients without any treatment line change during the 18‐month follow up.
Among 8478 naive patients, the majority were not treated with the studied treatment at the index date (59.2%). Topical treatment (high potency) was the most administrated treatment at the index date (21.4%) followed by topical treatment (low to medium potency) (10.7%), systemic treatment (6.4%) and only skin care (2.3%).
Despite the slightly higher number of patients not treated with the studied treatment in previously treated patients (70.0%), the trend revealed that in previously treated patients 15.5% received topical treatment (high potency), 6.9% topical treatment (low to medium potency), 5.9% systemic treatment and 1.7% for only skin care. The distribution of the index treatment line is depicted in Table 5.
Table 5.
Distribution and duration of the index treatment line
| Systemic treatment | Topical treatment (high potency) | Topical treatment (low to medium potency) | Only skin care | Not treated by studied treatment | |
|---|---|---|---|---|---|
| Naive patients (n = 8478) | |||||
| Distribution by the ID line | 542 (6.4%) | 1814 (21.4%) | 904 (10.7%) | 198 (2.3%) | 5020 (59.2%) |
| Duration of the ID line, days (SD) | 68.20 (110.94) | 47.79 (73.49) | 41.96 (58.58) | 39.45 (45.37) | 138.97 (205.11) |
| Previously treated patients (n = 30 109) | |||||
| Distribution by the ID line | 1787 (5.9%) | 4653 (15.5%) | 2074 (6.9%) | 509 (1.7%) | 21 086 (70%) |
| Duration of the ID line, days (SD) | 171.63 (195.91) | 118.57 (162.22) | 96.89 (141.92) | 71.34 (113.69) | 72.92 (118.76) |
ID, index date; SD, standard deviation.
Regarding the mean duration of the index treatment line (Table 5), mean duration was the longest for systemic treatment among active medications (i.e. systemic treatment, topical treatments, only skin care). The mean duration of systemic treatment was 68.20 ± 110.94 days in naive patients and 171.63 ± 195.91 days for previously treated patients. A shorter duration without any studied treatment was observed in previously treated patients (almost twice as short) compared with naive patients.
Regarding the analyses focusing on systemic treatment (Table 6), SCS were the most frequently used in both naive and previously treated patients (28% and 34.2%, respectively). Comparing the total duration of treatment lines during the 18‐month follow‐up period, SCS were administrated in the shortest manner (38.84 ± 77.47 days in naive and 79.48 ± 133.37 in previously treated patients) compared with oral cyclosporin (77.04 ± 104.32 and 195.12 ± 193.40 days, respectively) and phototherapy (111.55 ± 113.55 and 176.72 ± 170.02 days, respectively). Longer treatment times were consistently observed in previously treated patients compared with naive patients in all systemic treatments (almost twice as long). Oral cyclosporin was administrated in the longest manner in previously treated patients for approximately 6 months. When observing the distribution of duration of the first use of oral cyclosporin after the index date, almost half of previously treated patients were treated with oral cyclosporin for more than 3 months (48.08%). Conversely, more than 80% of naive patients were treated for less than 3 months.
Table 6.
Treatment patterns in systemic treatment during the 18‐month follow up
| No. of patients with prescription | Total duration of lines | Duration of the first use after the index date | |||||
|---|---|---|---|---|---|---|---|
| Mean, SD (days) | Mean, SD (days) | 0–0.5 months, n; % | 0.5–1 months, n; % | 1–3 months, n; % | >3 months, n; % | ||
| Oral cyclosporin | |||||||
| Naive (n = 8478) | 24 (0.2%) | 77.04 (104.32) | 68.46 (103.22) | 4 (16.67%) | 6 (25.00%) | 10 (41.67%) | 4 (16.67%) |
| Previously treated (n = 30 109) | 339 (1.1%) | 195.12 (193.40) | 175.29 (191.56) | 63 (18.58%) | 38 (11.21%) | 75 (22.12%) | 163 (48.08%) |
| SCS | |||||||
| Naive (n = 8478) | 2377 (28.0%) | 38.84 (77.47) | 25.84 (63.23) | 1716 (72.19%) | 199 (8.37%) | 303 (12.75%) | 159 (6.69%) |
| Previously treated (n = 30 109) | 10 303 (34.2%) | 79.48 (133.37) | 56.81 (119.80) | 6381 (61.93%) | 853 (8.28%) | 1471 (14.28%) | 1598 (15.51%) |
| Phototherapy | |||||||
| Naive (n = 8478) | 463 (5.4%) | 111.55 (113.75) | 83.85 (103.48) | 4 (0.86%) | 192 (41.47%) | 149 (32.18%) | 118 (25.49%) |
| Previously treated (n = 30 109) | 1999 (6.6%) | 176.72 (170.02) | 146.69 (166.62) | 20 (1.00%) | 700 (35.02%) | 444 (22.21%) | 835 (41.77%) |
SCS, systemic corticosteroids; SD, standard deviation.
Discussion
It was found that AD poses an increased burden on patients and health‐care systems. Patients with AD suffer from a significantly greater number of comorbidities than patients without AD. Diseases such as rhinitis, viral and fungal infections, sleep disorders and conjunctivitis were prevalent in more than 4% of AD patients. HCRU was high in AD patients in comparison with non‐AD controls in components’ analyses, such as outpatient visits, laboratory tests, drug prescriptions and phototherapy.
Comorbidity burden in patients with AD is well studied in the published work. Reports from both international and Asian cohorts showed that AD is a disease with a substantial comorbidity burden.13, 14 The JDA guidelines from 2018 highlighted the importance of the management of some coexisting diseases, such as bacterial, fungal and viral infections, and ophthalmological diseases.1 It has previously been revealed that the self‐reported prevalence of sleep disorders was significantly higher in AD patients compared with matched non‐AD controls, which had an important impact on quality of life impairment in AD patients.14 These diseases were identified as highly prevalent comorbidities of AD patients in our study during the 6‐month pre‐index period. Therefore, the increased rate of the occurrence of comorbidities found in AD patients from this study is in line with previous findings.
The present analysis showed a higher HCRU in AD patients compared with non‐AD controls. This finding is consistent with other reports from the published work.15, 16 In this study, one of the resources, which showed a high attributable value to AD, was outpatient visits (attributable visits to AD/year, 6.324). A previous study also showed the highest difference between AD and non‐AD patients in health‐care provider visits.14 In addition, not only prescription of AD‐related medication but also prescription of non‐AD‐related medication is high in AD patients (attributable numbers to AD/year, 5.823), suggesting some treatment costs associated with multiple comorbidities. A Japanese governmental study pointed out a big economic impact due to AD in terms of direct health‐care costs with approximately ¥62 billion/year of direct health‐care costs incurred in Japan due to AD.17
This study showed a slightly lower number of hospitalizations in AD patients compared with non‐AD patients (attributable hospitalizations to AD/year, −0.002). A previous study showed a higher number of hospitalizations in the past 6 months in AD patients in comparison with non‐AD controls (0.59 vs 0.39), although the difference was not statistically significant.14 A previous study included older patients with a mean age of 38 years old in comparison with patients in the current study with a mean age of approximately 34 years old. Considering that the probability of hospitalization increases with age of patients, the difference in study population age may explain the minor discrepancy between the results obtained in those two studies. No emergency visits were observed during the study period, which may be because our health system allows free access and emergency room visits are not necessary even for urgent AD patients.
The management of AD is challenging. The JDA guidelines provide rules for AD management after the diagnosis through different phases: remission introduction phase (using TCS and TCI), remission maintenance phase (using topical anti‐inflammatory treatments, intermittent TCS and TCI) and refractory phase (TCS with higher potency, oral cyclosporin, phototherapy and psychotherapy).1 Surprisingly, our study showed that systemic treatment (including SCS, oral cyclosporin and phototherapy), which is recommended in guidelines as the treatment in the refractory phase, was administrated in a certain number of patients. In addition, systemic treatment was used long term in a continuous way. For example, almost half of previously treated patients who were treated with oral cyclosporin continued treatment for over 3 months. The Japanese package insert of oral cyclosporin recommends the shortest duration of utilization; otherwise, it recommends the following intermittent administration schedule: administration of 8–12 weeks followed by the discontinuation of the treatment. In the case of symptom recurrence, the treatment can be restarted.18 However, it should be simultaneously considered that systemic treatment such as SCS might have been prescribed for comorbid allergic diseases other than AD such as rhinitis in the study patients because of the lack of information related to drug indication in the database.
Continuous administration of systemic treatment observed in a certain number of AD patients indicates difficulties in AD management in Japanese clinical practise. A survey conducted by the Ministry of Health, Labor and Welfare showed that moderate to severe AD occurred in more than 20% of AD patients in their 30s.17 This may indicate that there is an important unmet need for an effective AD therapy among the patients.
The study showed that many patients were not treated by any studied treatment at the index date (59.2% in naive and 70% in previously treated). It may be because patients have been under good disease control or simply not visiting during the 18‐month follow‐up period.
The present study shows unique findings supported by methodological strengths. This is the first retrospective claim data analysis in Japan assessing outcomes on HCRU and treatment patterns of a large number of patients. The real‐world data reflects real‐life patient scenarios in comparison with the tightly controlled clinical environment in clinical trials. A long‐term follow‐up period long enough to fully capture HCRU and treatment patterns in AD patients was selected and employed. An exact matching analysis conducted in the present study enabled the examination of resource use in comparable populations on some key characteristics other than AD. This study assessed the attributable costs of AD patients compared with non‐AD controls. Future research comparing attributable costs of other diseases such as diabetes and hypertension may be worth investigating.
Despite the study presenting evidence of high quality, results should be cautiously interpreted due to limitations. The JMDC claim database does not include some details on information relevant for further inclusion and analysis. The occurrence of missing data required assumptions to be established in terms of dates of prescriptions, dates of diagnoses, and duration of topical and injection treatments.
In conclusion, HCRU is higher in patients suffering from AD in comparison with non‐AD controls, indicating a high burden of the disease imposed on AD patients. Continuous administration of systemic treatment such as oral cyclosporin, SCS and phototherapy observed in AD patients sheds light on difficulties in AD management in Japanese clinical practise, and suggests a high unmet need for a safe and effective AD therapy. The results of the present study provide dermatologists opportunities to consider the burden of patients when selecting the optimal care and particularly the importance of long‐term disease control with safe and effective therapy.
Conflict of Interest
This study was sponsored by Sanofi K.K. Creativ‐Ceutical was paid to conduct the study. A. I. received consultancy fees from AbbVie Inc., Eli Lilly Japan K.K., Novartis Pharma K.K., Maruho Co. Ltd, Torii Pharmaceutical Co. Ltd., Japan Tobacco Inc. and Sanofi K.K., including fees for this study. H. F., K. A., T. I. and Y. T. are employees of Sanofi K.K. J. D. and A. F. are employees of Creativ‐Ceutical. The authors were responsible for all content and editorial decisions, and received no honoraria related to the development of this publication.
Supporting information
Table S1. Patient comorbidities in the 6‐month pre‐index period (incidence <0.3%)
Acknowledgments
Advice in the study planning was received by Bruno Rossi of Satoru G.K., data analysis support was provided by Maki Ueyama, Ikbel Amri and Wafa Khabteni of Creativ‐Ceutical, and medical writing support was provided by Malgorzata Biernikiewicz of Creativ‐Ceutical.
References
- 1. Katoh N, Ohya Y, Ikeda M et al Clinical practice guidelines for the management of atopic dermatitis. Jpn J Dermatol 2018; 128(12): 2431–2502. [DOI] [PubMed] [Google Scholar]
- 2. Nutten S. Atopic dermatitis: global epidemiology and risk factors. Ann Nutr Metab 2015; 66(Suppl 1): 8–16. [DOI] [PubMed] [Google Scholar]
- 3. Yew YW, Thyssen JP, Silverberg JI. A systematic review and meta‐analysis of the regional and age‐related differences in atopic dermatitis clinical characteristics. J Am Acad Dermatol 2019; 80(2): 390–401. [DOI] [PubMed] [Google Scholar]
- 4. Barbarot S, Auziere S, Gadkari A et al Epidemiology of atopic dermatitis in adults: results from an international survey. Allergy 2018; 73(6): 1284–1293. [DOI] [PubMed] [Google Scholar]
- 5. Takeuchi S, Esaki H, Furue M. Epidemiology of atopic dermatitis in Japan. J Dermatol 2014; 41(3): 200–204. [DOI] [PubMed] [Google Scholar]
- 6. Silverberg JI. Adult‐onset atopic dermatitis. J Allergy Clin Immunol Pract 2019; 7(1): 28–33. [DOI] [PubMed] [Google Scholar]
- 7. Katayama I, Aihara M, Ohya Y et al Japanese guidelines for atopic dermatitis 2017. Allergol Int 2017; 66(2): 230–247. [DOI] [PubMed] [Google Scholar]
- 8. Sidbury R, Davis DM, Cohen DE et al Guidelines of care for the management of atopic dermatitis: section 3. Management and treatment with phototherapy and systemic agents. J Am Acad Dermatol 2014; 71(2): 327–349. [DOI] [PMC free article] [PubMed] [Google Scholar]
- 9. Charlson ME, Pompei P, Ales KL et al A new method of classifying prognostic comorbidity in longitudinal studies: development and validation. J Chronic Dis 1987; 40(5): 373–383. [DOI] [PubMed] [Google Scholar]
- 10. Quan H, Sundararajan V, Halfon P et al Coding algorithms for defining comorbidities in ICD‐9‐CM and ICD‐10 administrative data. Med Care 2005; 43(11): 1130–1139. [DOI] [PubMed] [Google Scholar]
- 11. Paller A, Jaworski JC, Simpson EL et al Major comorbidities of atopic dermatitis: beyond allergic disorders. Am J Clin Dermatol 2018; 19(6): 821–838. [DOI] [PubMed] [Google Scholar]
- 12. Pan W. Akaike's information criterion in generalized estimating equations. Biometrics 2001; 57(1): 120–125. [DOI] [PubMed] [Google Scholar]
- 13. Nijsten T. Atopic dermatitis and comorbidities: added value of comprehensive dermatoepidemiology. J Invest Dermatol 2017; 137(5): 1009–1011. [DOI] [PubMed] [Google Scholar]
- 14. Arima K, Gupta S, Gadkari A et al Burden of atopic dermatitis in Japanese adults: analysis of data from the 2013 National Health and Wellness Survey. J Dermatol 2018; 45(4): 390–396. [DOI] [PMC free article] [PubMed] [Google Scholar]
- 15. Shrestha S, Miao R, Wang L et al Burden of atopic dermatitis in the United States: analysis of healthcare claims data in the commercial, medicare, and medi‐cal databases. Adv Ther 2017; 34(8): 1989–2006. [DOI] [PMC free article] [PubMed] [Google Scholar]
- 16. Fowler JF, Duh MS, Rovba L et al The direct and indirect cost burden of atopic dermatitis: an employer‐payer perspective. Manag Care Interface 2007; 20(10): 26–32. [PubMed] [Google Scholar]
- 17. Kawahara K. Study on socio‐economic benefits and loss of allergic diseases (H23‐H25 MHLW study), 2013.
- 18. PMDA . Neoral package insert. Secondary Neoral package insert 2018. https://www.pmda.go.jp/PmdaSearch/iyakuDetail/ResultDataSetPDF/300242_3999004M3021_2_28.
Associated Data
This section collects any data citations, data availability statements, or supplementary materials included in this article.
Supplementary Materials
Table S1. Patient comorbidities in the 6‐month pre‐index period (incidence <0.3%)