

Summary
Transfusion‐dependent thalassaemia (TDT) requires red blood cell concentrates (RBCC) to prevent complications of anaemia, but carries risk of infection. Pathogen reduction of RBCC offers potential to reduce infectious risk. We evaluated the efficacy and safety of pathogen‐reduced (PR) Amustaline‐Glutathione (A‐GSH) RBCC for TDT. Patients were randomized to a blinded 2‐period crossover treatment sequence for six transfusions over 8–10 months with Control and A‐GSH‐RBCC. The efficacy outcome utilized non‐inferiority analysis with 90% power to detect a 15% difference in transfused haemoglobin (Hb), and the safety outcome was the incidence of antibodies to A‐GSH‐PR‐RBCC. By intent to treat (80 patients), 12·5 ± 1·9 RBCC were transfused in each period. Storage durations of A‐GSH and C‐RBCC were similar (8·9 days). Mean A‐GSH‐RBCC transfused Hb (g/kg/day) was not inferior to Control (0·113 ± 0·04 vs. 0·111 ± 0·04, P = 0·373, paired t‐test). The upper bound of the one‐sided 95% confidence interval for the treatment difference from the mixed effects model was 0·005 g/kg/day, within a non‐inferiority margin of 0·017 g/kg/day. A‐GSH‐RBCC mean pre‐transfusion Hb levels declined by 6·0 g/l. No antibodies to A‐GSH‐RBCC were detected, and there were no differences in adverse events. A‐GSH‐RBCCs offer potential to reduce infectious risk in TDT with a tolerable safety profile.
Keywords: thalassaemia, transfusion, infection, RBC, iron
Transfusion‐dependent thalassaemia (TDT) requires regular transfusion to prevent complications of anaemia and excessive erythroid expansion (Cappellini & Motta, 2017). However, utilization of red blood cell concentrates (RBCC) in TDT must be managed to minimize transfusion iron (Fe) burden within the limits of chelation therapy (Cazzola et al, 1997; Cohen et al, 2008; Porter & Garbowski, 2018). Transfusion is associated with the risk of transfusion‐transmitted infection (TTI) due to undetected known pathogens (Candotti et al, 2019), emerging pathogens (Stramer et al, 2013) and unrecognized bacterial contamination (Damgaard et al, 2015). Despite improved donor testing, long‐term transfusion support has a substantial cumulative life‐time residual risk of TTI (Kleinman & Stassinopoulos, 2015) and splenectomized TDT patients, in particular, may have increased TTI morbidity (Teawtrakul et al, 2015). Pathogen reduction of RBCC offers potential to reduce the risk of TTI.
Nucleic acid targeted pathogen reduction of RBCC using amustaline‐glutathione (A‐GSH) to inactivate viruses, bacteria, protozoa and leucocytes has been evaluated in healthy subjects demonstrating post‐transfusion RBC recovery and life‐span suitable for transfusion, and for support of acute anaemia during cardiovascular surgery (Cancelas et al, 2017; Brixner et al, 2018). A prior study with the original pathogen‐reduced (PR)‐RBCC process in TDT patients was halted due to the unexpected finding of antibodies to treated RBCC without evidence of clinical haemolysis (Benjamin et al, 2005; North et al, 2007; Geisen et al, 2018). A modified process was developed to reduce the risk of A‐GSH RBCC immune responses. The present Phase 3 clinical trial was designed to evaluate the efficacy and safety for TDT using A‐GSH RBCC (Test) prepared with this modified process. The study utilized repeated transfusion exposure to compare haemoglobin (Hb) use of A‐GSH and conventional RBCC (Control), and to assess the incidence of antibodies to A‐GSH RBCC within the range of RBC alloimmune responses (4–20%) reported for patients with congenital anaemia disorders (Chou et al, 2013).
Methods
Study design
The study (EUDRA: number 2012‐002920‐33) was conducted at 3 clinical centres in 2 countries (Italy and Turkey) with good clinical practice compliance in conformity with the International Conference on Harmonization (ISO 14155:2011) and the Helsinki Declaration. The research protocol was approved by the respective institutional human research review boards at each clinical site. All participants gave informed consent. A Data and Safety Monitoring Board provided oversight and the following prospectively defined stopping rules: if 3 subjects developed antibody with defined specificity to A‐GSH RBCC, enrolment would be halted until the antibody haemolytic potential was defined, but subjects on study were continued as long as crossmatch‐compatible RBCC were available. The study would be stopped if 2 subjects experienced a haemolytic transfusion reaction with accelerated RBC clearance and defined specificity to A‐GSH RBCC.
Randomization and masking
Randomization to study treatment sequence was conducted by clinical site personnel using the electronic data capture system. Test and Control RBCC were prepared in identical containers. All clinical trial personnel were blinded to the randomized treatment sequence. Only the blood centre personnel that prepared the RBCC were not blinded: they did not have access to clinical trial data.
The trial utilized a randomized, double‐blind, active‐controlled 2‐treatment period cross‐over design to evaluate A‐GSH RBCC (Test) in comparison to conventional (Control) RBCC (Fig 1). TDT patients receiving chronic transfusion support without confounding clinical issues were offered enrolment. Inclusion criteria were: diagnosis of TDT in a chronic transfusion programme for at least 1 year, age ≥11 years, non‐child bearing female or non‐pregnant female with childbearing potential using birth control, 1‐year history of stable RBCC transfusion support, history of at least 14‐day intervals between RBCC transfusions, RBCC transfusion administered on a single day for each episode, and signed informed consent or paediatric assent as required. Use of stable Fe chelation therapy was allowable. Exclusion criteria were: baseline antibody reactivity specific to A‐GSH RBCC, splenic hyper‐function defined by transfusion requirement >180 ml RBCC/kg/year, palpable spleen >4 cm below costal margin or ≥18 cm longitudinal dimension by ultrasound, anticipated change in RBCC transfusion requirements or anticipated splenectomy in the next 12 months, risk of cardiac decompensation with ejection fraction <56% or multi‐slice T2* < 10 ms, allo‐immunization to RBC antigens limiting provision of compatible RBCC, requirement for frozen or washed RBCC, requirement for gamma‐irradiated RBCC, history of glucose‐6‐phosphate dehydrogenase deficiency, positive direct anti‐globulin test (DAT) > 2+ with poly‐specificity or indirect anti‐globulin test (IAT) with pan‐reactivity precluding definition of allogenic or auto antibody specificity, documented human immunodeficiency virus or hepatitis C virus infection, breast feeding, current cancer chemotherapy, other chronic medical disorder precluding study participation to completion, history of poor study compliance and participation in another study concurrently or in the preceding 28 days. Study withdrawal and stopping rules were pre‐specified.
Figure 1.

Study design. The study design for 2 wash‐in transfusions (TXNS) followed by 4 efficacy evaluation transfusions (TXNS) is indicated.
Study treatments: preparation of RBCC
Blood centre personnel, blinded to clinical data, prepared all components. Both A‐GSH RBCC (Test) and Control RBCC were prepared from CPD whole blood with leucocyte reduction and suspension in Saline‐Adenine‐Glucose‐Mannitol (SAG‐M) solution. The total haemoglobin Hb content (g) and volume (ml) were measured for each Test and Control RBCC prior to storage at 4–6°C for up to 35 days after collection. Pathogen reduction was performed in a functionally closed system of plastic containers within 24 h of collection using final concentrations of Amustaline (0·2 mmol/L) and Glutathione (20 mmol/L) as described. (Cancelas et al, 2017; Brixner et al, 2018) Process validation studies of Test RBCC at each production site were conducted prior to initiating clinical transfusions. Post‐production and quality control studies were performed on a subset of Test RBCC on day 35 of storage (Erickson et al, 2018). Control RBCCs were processed in compliance with each centre's standard operating procedures and respective national regulations.
Clinical study procedures
Patients were screened up to 30 days prior to randomization, stratified by country, and randomized to a transfusion sequence of Test‐Control (T‐C) or Control‐Test (C‐T) for six transfusion episodes in each treatment period over approximately 8–10 months with follow‐up for 45 days after the last transfusion of the second period. Baseline clinical data included subject medical history, pre‐transfusion haemoglobin (Hb) levels and target Hb threshold for the 6 months prior to enrolment, concomitant medications, pregnancy test for females, ABO and Rh, a blood sample reserved for RBC antigen genotype, and gel‐card antibody screen to A‐GSH treated and untreated RBC panel antigens to detect pre‐existing native antibodies to A‐GSH red cells (Data S1). Withdrawal was permitted for: patient request, pregnancy, medication associated with haemolysis, antibody to A‐GSH RBCC preventing transfusion, antibody to A‐GSH RBCC with haemolysis, antibody to RBC antigens limiting available phenotype matched RBC and grade ≥3 allergic transfusion reactions. Randomized subjects who withdrew from the study before receiving any study RBC transfusions for the first efficacy evaluation period were replaced; and subjects withdrawn in the first treatment period could be replaced.
Patients were managed with compatible RBCC with a target pre‐transfusion Hb threshold of approximately 90–100 g/l, or as designated by treating physicians blinded to treatment and Hb content of RBCC. Each treatment period commenced with 2 wash‐in transfusion episodes followed by 4 efficacy evaluation transfusion episodes (Fig 1). Within 72 h prior to each transfusion episode, subjects were evaluated for: serological crossmatch to the assigned RBCC, antibodies to A‐GSH RBC, haematology full blood count panel, clinical chemistry panel. Direct anti‐globulin tests (DAT) and indirect anti‐globulin tests (IAT) were performed within 3–7 days before scheduled transfusion. Treating physicians, blinded to treatment assignment and Hb content of Test and Control RBCC, prescribed the number of RBCC required at each episode, and regulated the RBCC dose and interval between transfusion episodes to achieve physician‐defined Hb levels. The transfused volume of RBCC was recorded for each transfusion episode. Patients were contacted 14 ± 2 days after each transfusion to assess adverse events (AE), serious AE (SAE) and delayed haemolytic transfusion reactions (DHTR). After completion of the last transfusion episode of the second treatment period, patients reverted to non‐study conventional RBCC and were followed for two additional transfusions or at least 45 days for AE and SAE, antibodies to A‐GSH and untreated RBCC, and evidence of haemolysis (haematology and chemistry panels). Fe chelation therapy was maintained as prior to study entry, and could be adjusted per standard of care.
Outcome measures
The primary efficacy outcome was average Hb use expressed as Hb mass (g) transfused per kg body weight per day in transfusion episodes 3–6 after 2 wash‐in transfusions for each treatment period. Average Hb use over all 6 transfusion episodes in each treatment period also was summarized. The primary safety outcome was the incidence of treatment‐emergent antibodies to A‐GSH RBCC during all transfusion episodes in each period and through the 45 day post‐study surveillance. Secondary safety outcomes included the incidence of AE, SAE, antibodies to RBC alloantigens and acute transfusion reactions.
Statistical analyses
The primary efficacy analysis was conducted on the intent‐to‐treat (ITT) patients using a non‐inferiority test with a pre‐determined non‐inferiority margin ≤15% of the Control mean value for average Hb transfused. Non‐inferiority was assessed by comparing the upper bound of a one‐sided 95% confidence interval (CI) for the treatment difference (Test‐Control) of average Hb use of the observed Control mean. The study was designed with 90% power with 70 patients completing both treatment periods. For the primary efficacy analysis, the least squares (LS) means treatment difference (Test‐Control) and a one sided 95% CI were estimated using a mixed effects model, where treatment, period, and treatment sequence were fitted as fixed effects, and patient as a random effect. A sensitivity analysis was conducted using a similar mixed effects model as specified for the primary efficacy analysis, with patient pre‐transfusion Hb level included as an additional fixed effect. Continuous variables were summarized descriptively by mean, median and treatment difference (Test‐Control), and compared by paired t test. For the primary safety endpoint, the 95% Clopper‐Pearson CI was computed for the incidence of treatment‐emergent antibodies. Proportions of patients with treatment‐emergent AEs were compared between treatment periods using the Fisher's exact test.
Results
Patient demographics
Eighty‐six patients were randomized (45 to Test‐Control and 41 to Control‐Test, Fig 2). No screened patients were excluded due to pre‐existing antibodies to A‐GSH red cells. Eighty‐one patients received at least one study RBCC (safety population). Eighty patients received RBCC evaluable for efficacy (transfusion episodes 3–6), and constituted the ITT population. Nine patients either: withdrew voluntarily (n = 1), received off‐protocol RBCC (n = 6) or incorrectly assigned RBCC (n = 2). Thus, 71 patients received all RBCC per randomization assignment, and were summarized as per‐protocol only (PPO). Baseline demographics demonstrated differences between countries in the proportional distribution of ABO groups, splenectomy status (Italy 1 of 13; Turkey 39 of 67), and prior transfusion management with phenotype matched RBCC (Table 1). Haemoglobin mutations and clinical phenotypes were consistent with TDT (Table SI). Among the total ITT population, 11·1% of patients had a history of alloantibodies to red cell antigens at entry to the study, and no patients were withdrawn due to unavailability of compatible RBCC. All patients were maintained on iron chelation therapy.
Figure 2.

Disposition of patients. The disposition of patients from eligibility screening (n = 86), to randomization (n = 86) and exclusion (n = 5) is indicated. The randomization sequence assigned (Test to Control or Control to Test) is indicated with the first period assigned. The safety population (n = 81), the intent to treat (ITT) population (n = 80), and the per‐protocol only (PPO) population (n = 71) are shown. One patient withdrew after a single study transfusion and was only assessed for safety. In the ITT population, 6 patients received off‐protocol red blood cell concentrates (RBCC), 2 patients received incorrectly assigned study RBCC for a single transfusion episode, and 1 patient received all of the assigned transfusions in the Control period and only 3 of 6 transfusions in the Test period, thus was included in the ITT analysis but not the PPO analysis.
Table 1.
Baseline demographic characteristics for the ITT population
| Parameter* | Italy (n = 13) | Turkey (n = 67) | Non‐splenectomized (n = 40) | Splenectomized (n = 40) | Total ITT (n = 80) |
|---|---|---|---|---|---|
| Age (years) | 28·5 (9·2) | 25·6 (7·9) | 22·2 (8·5) | 30·0(5·4) | 26·1 (8·1) |
| Patients aged ≤18 years (%) | 23·1 | 17·9 | 37·5 | 0 | 18·8 |
| Male gender (%) | 38·5 | 46·3 | 32·5 | 57·5 | 45·0 |
| Body weight (kg) | 56·7 (15·1) | 59·3 (13·2) | 52·5 (12·4) | 65·3 (11·5) | 58·9 (13·5) |
| A/B/AB/O blood group (%) | 23·1/15·4/0/61·5 | 38·8/26·9/7·5/26·9 | 35·0/27·5/2·5/35·0 | 37·5/22·5/10·0/30·0 | 36·3/25·0/6·3/32·5 |
| Rh+ (%) | 100 | 95·5 | 97·5 | 95·0 | 96·3 |
| RBC alloantibodies (%)† | 7·1 | 11·9 | 5·0 | 17·5 | 11·1 |
| Phenotype matched (%)‡ | 100 | 17·9 | 40·0 | 25·0 | 32·1 |
Mean (standard deviation) are presented for continuous variables, and proportions (%) are presented for categorical variables. ITT, intent to treat; RBC, red blood cells; RBCC, red blood cell concentrate.
Baseline characteristics of the study population prior to the first study transfusion.
Proportion of patients with a documented history of alloantibodies to RBC prior to study enrollment.
Proportion of patients managed with phenotype matched RBCC. All patients were matched for A, B, O and Rh D. For patients requiring phenotype‐matched blood in Italy and Turkey, antibodies to the following Rh antigens were routinely included: C, c, E, e, K. Antibodies to specific antigens were evaluated for selected patients including: Fya, Fyb, M, N, S, s, Lea, Leb, Lu(a), Lu(b), Kp(a), Kp(b), and C(w).
Baseline clinical characteristics
For the total ITT population, baseline clinical laboratory characteristics at entry to the first treatment period were not different between randomization sequences (Table 2). ITT patient baseline haemoglobin levels were lower in Turkey than in Italy; and lower for splenectomized patients, who were primarily enrolled in Turkey. In both countries, baseline mean corpuscular haemoglobin (MCH) values were within the normal range (27–31 pg), consistent with predominantly circulating donor RBC indicative of effective erythropoiesis suppression. Mean baseline platelet and leucocyte counts were higher in Turkey due to the inclusion of more splenectomized patients. Mean baseline LDH and total bilirubin levels were similar between regions, and between splenectomized and non‐splenectomized patients (Table 2).
Table 2.
Baseline clinical laboratory characteristics of the ITT population at entry to first assigned treatment sequence.*
| Italy | Turkey | Non‐splenectomized | Splenectomized | ITT Population‡ | P ‡ | ||||||
|---|---|---|---|---|---|---|---|---|---|---|---|
| Sequence | T to C | C to T | T to C | C to T | T to C | C to T | T to C | C to T | T to C | C to T | |
| Patients (n) | 7 | 6 | 34 | 33 | 21 | 19 | 20 | 20 | 41 | 39 | |
| Hb (g/l)† | 100 (6·0) | 104 (8·0) | 93 (9·0) | 92 (8·0) | 97 (9·0) | 96 (10) | 92 (8·0) | 92 (8·0) | 94 (9·0) | 94 (10) | 0·787 |
| RBC (1012/l)† | 3·6 (0·2) | 3·7 (0·2) | 3·3 (0·4) | 3·2 (0·4) | 3·5 (0·4) | 3·4 (0·4) | 3·2 (0·3) | 3·2 (0·3) | 3·3 (0·4) | 3·3 (0·4) | 0·593 |
| MCH (pg)† | 27·6 (1·0) | 27·9 (1·2) | 28·6 (1·5) | 28·9 (2·0) | 28·1 (1·6) | 28·1 (2·2) | 28·9 (1·3) | 29·3 (1·5) | 28·5 (1·5) | 28·7 (2·0) | 0·466 |
| WBC (109/l)† | 8·1 (2·1) | 7·6 (1·9) | 12·9 (6·1) | 12·3 (6·2) | 7·2 (1·8) | 7·2 (2·1) | 17·2 (3·9) | 15·4 (5·6) | 12·1 (5·9) | 11·5 (6·0) | 0·684 |
| PLT (109/l)† | 247 (71) | 311 (221) | 521 (213) | 530 (234) | 306 (99) | 326 (141) | 651 (169) | 647 (214) | 474 (221) | 495 (43) | 0·690 |
| LDH (u/l)† | 249 (118) | 237 (85) | 179 (80) | 178 (110) | 208 (97) | 188 (116) | 174 (81) | 188 (102) | 192 (90) | 188 (107) | 0·683 |
| Bilirubin (μmol/l)† | 46 (29) | 43 (29) | 38 (19) | 43 (29) | 46 (22) | 38 (26) | 33 (15) | 50 (31) | 39 (30) | 43 (27) | 0·478 |
Data by country and spleen status are presented for informational purposes.
Data are presented for the ITT population by randomization sequence (T‐C and C‐T), study site and by spleen status.
Mean (standard deviation) are presented for pre‐transfusion haemoglobin (Hb), red blood cell count (RBC), mean corpuscular haemoglobin (MCH), white blood cell (WBC) count, platelet (PLT) count, lactate dehydrogenase (LDH), and total bilirubin at study entry prior to first transfusion in either the Test (T) or Control (C) treatment periods.
The P‐value is based on the ITT population for mean treatment differences of the first treatment period (T‐C) using a two‐sample t‐test.
RBCC haemoglobin content and transfusion exposure
During the study, 1024 Test and 1008 Control RBCC units were transfused. Post‐production Test and Control RBCC demonstrated small differences in volume and mean Hb content due to expected average PR processing Hb losses of ~1 g (Table 3). Total Hb content (g) of Test RBCC ranged from 39 to 73 g; and for Control RBCC from 35 to 74 g (Fig 3).
Table 3.
Post‐production characteristics of clinical inventory test and control RBCC.*
| Parameter | Test (n = 1024) | Control (n = 1008) | Difference (CI)† | P ‡ |
|---|---|---|---|---|
| RBCC volume (ml) | 271·4 (19·0) | 278·9 (22·2) | −7·5 (−9·3, 5·7) | <0·001 |
| RBCC Hct (%) | 60·5 (2·4) | 59·0 (2·8) | 1·5 (1·7, 1·7) | <0·001 |
| RBCC Hb content (g) | 54·6 (5·9) | 55·6 (5·9) | −1·0 (−1·5, −0·5) | <0·001 |
Hb, haemoglobin; Hct, haematocrit.
The mean (standard deviation) for the characteristics of Test (T) and Control (C) red blood cell concentrate (RBCC) transfused.
The mean treatment differences (T‐C) and the two‐sided 95% confidence interval (CI) for the observed treatment differences.
P values based on ANOVA controlling for treatment and site.
Figure 3.

Haemoglobin content of test and control RBCC. The proportional (%) distributions of total haemoglobin (Hb) content (g) for 1024 Test (dots) and 1008 Control (diagonal) red blood cell concentrates (RBCC) are shown.
For the ITT population for all transfusion episodes, a mean of 12·5 ± 1·9 Test and Control RBCC were transfused per patient; however, the total Hb mass (g) of Test RBCC (683 ± 98) transfused was slightly less than Control RBCC (697 ± 109), but not statistically different (Table 4). The mean volume of Test RBCC transfused was statistically lower (P = 0·021). The mean storage age of RBCC was slightly shorter in Italy than Turkey, but overall similar for Test and Control RBCC (Table 4). The mean total Hb mass transfused per patient over all transfusion episodes was larger in Italy than Turkey. However, patient exposures to Test and Control RBCC components were similar within the non‐splenectomized and splenectomized patient sub‐groups; although splenectomized patients received less total Test Hb than non‐splenectomized patients (Table 4). Only 11 (0·5%) of 2043 RBCC units transfused were off‐protocol, primarily due to unavailable study RBCC (Table SII).
Table 4.
ITT population exposure to test and control RBCC by country and spleen status (transfusion episodes 1–12)
| Italy | Turkey | Non‐splenectomized | Splenectomized | Total | P | ||||||
|---|---|---|---|---|---|---|---|---|---|---|---|
| Test | Control | Test | Control | Test | Control | Test | Control | Test | Control | ||
| Patients* | 13 | 13 | 67 | 67 | 40 | 40 | 40 | 40 | 80 | 80 | |
| RBCC† | 14·4 (3·0) | 13·9 (3·8) | 12·1 (0·8) | 12·3 (1·1) | 12·8 (2·0) | 12·7 (2·3) | 12·2 (1·0) | 12·4 (1·3) | 12·5 (1·9) | 12·5 (1·9) | 0·804 |
| RBCC age‡ | 6·3 (2·2) | 5·7 (1·9) | 9·4 (1·5) | 9·4 (1·5) | 8·5 (2·2) | 8·3 (2·2) | 9·4 (1·7) | 9·3 (1·8) | 8·9 (2·0) | 8·8 (2·1) | 0·573 |
| Volume§ | 3·83 (0·8) | 3·89 (1·0) | 3·31 (0·3) | 3·42 (0·3) | 3·45 (0·5) | 3·53 (0·6) | 3·30 (0·3) | 3·46 (0·4) | 3·39 (0·4) | 3·50 (0·5) | 0·021 |
| Total Hb¶ | 765 (200) | 743 (230) | 667 (51) | 688 (65) | 693 (119) | 697 (131) | 673 (72) | 696 (85) | 683 (98) | 697 (109) | 0·117 |
Mean (SD) are presented and P‐values for the treatment difference are derived from paired t‐test. Hb, haemoglobin; ITT, intent to treat; RBCC, red blood cell concentrate; SD, standard deviation.
Number of patients transfused in the ITT population.
Average (SD) number of RBCC transfused in Test and Control treatment periods.
Average (SD) days of storage of RBCC prior to transfusion in Test and Control treatment periods.
Average (SD) RBCC volume (l) transfused in Test and Control treatment periods.
Average (SD) total Hb transfused (g) in Test and Control treatment periods.
Efficacy outcome
By ITT, efficacy evaluable transfusion episodes (n = 3–6) demonstrated a mean treatment difference (Test‐Control) in Hb use of 0·002 g/kg/day (1·8% of Control mean), which was not significantly different (95% CI = −0·002 to 0·005, P = 0·373, paired t test) (Table 5). Non‐inferiority was observed with an upper bound of the 1‐sided 95% CI of 0·005 g/kg/day (4·5% of Control) below the 15% inferiority margin (0·017 g/kg/day) based on the Control mean (0·111 g/kg/day). Additionally, the 2‐sided 95% CI for the LS‐mean treatment difference was −0·002 to 0·005 g/kg/day, within the pre‐defined inferiority margin. Consistent results were observed with sensitivity analyses utilizing a paired t‐test (2‐sided 95% CI for the mean treatment difference = −0·002 to 0·005 g/kg/day), and a mixed effects model similar to the primary efficacy analysis with the addition of pre‐transfusion Hb level included in the model (2‐sided 95% CI for the mean treatment difference = −0·003 to 0·006 g/kg/day) confirming non‐inferiority. From the primary mixed effects model, a significant period effect was observed (P = 0·007) where the LS mean of Hb use in Period 2 was 0·005 g/kg/day higher than Period 1, probably due to the increased Hb dose observed with the sequence of Period 1 Test to Period 2 Control RBCC (Fig 4D). When only Period 1 data were summarized, mean Hb use values were 0·115 and 0·104 g/kg/day for Test and Control RBCC, respectively, and a wider CI for the treatment difference (2‐sided 95% CI = −0·004 to 0·026 g/kg/day, P = 0·155 by 2‐sample t‐test) was observed due to reduced statistical power. Analyses for the PPO population demonstrated a mean treatment difference (T‐C = 0·003 g/kg/day, 95% CI = −0·001 to 0·006, P = 0·162 by paired t‐test (Table SIII). Additional analyses by ITT and PPO for all transfusion episodes indicated no difference in Hb use between Test and Control RBCC (Table 6 and SIV).
Table 5.
Haemoglobin use (g/kg/day) for the ITT populations in the efficacy evaluation period (transfusions 3, 4, 5 and 6).*
| Italy | Turkey | Non‐splenectomized | Splenectomized | ITT population‡ | P | ||||||
|---|---|---|---|---|---|---|---|---|---|---|---|
| Test | Control | Test | Control | Test | Control | Test | Control | Test | Control | ||
| ITT (n) | 13 | 13 | 67 | 67 | 40 | 40 | 40 | 40 | 80 | 80 | |
| Dose† | 509 (133) | 485 (169) | 451 (40) | 456 (45) | 471 (81) | 461 (96) | 451 (47) | 461 (59) | 461 (67) | 461 (79) | 0·950 |
| Interval† | 17·0 (3·7) | 18·0 (5·6) | 19·7 (3·4) | 20·0 (3·1) | 17·8 (3·0) | 18·4 (3·4) | 20·7 (3·5) | 21·0 (3·5) | 19·2 (3·6) | 19·7 (3·6) | 0·032 |
| Hb use† | 0·140 (0·03) | 0·139 (0·04) | 0·108 (0·03) | 0·106 (0·03) | 0·135 (0·03) | 0·130 (0·03) | 0·091 (0·03) | 0·092 (0·03) | 0·113 (0·04) | 0·111 (0·04) | 0·373 |
Mean (SD) are presented. Data are presented by country and by spleen status for informational purposes. C, Control; Hb, haemoglobin; ITT, intent to treat; SD, standard deviation.
Data are presented for the ITT population (n = number of patients) by country, by spleen status and for the total ITT population.
Mean (SD) are presented for total Hb dose (g), transfusion interval (days), haemoglobin use (g/kg/day).
P‐values for the treatment difference (T‐C) for ITT population are derived from the paired t‐test.
Figure 4.
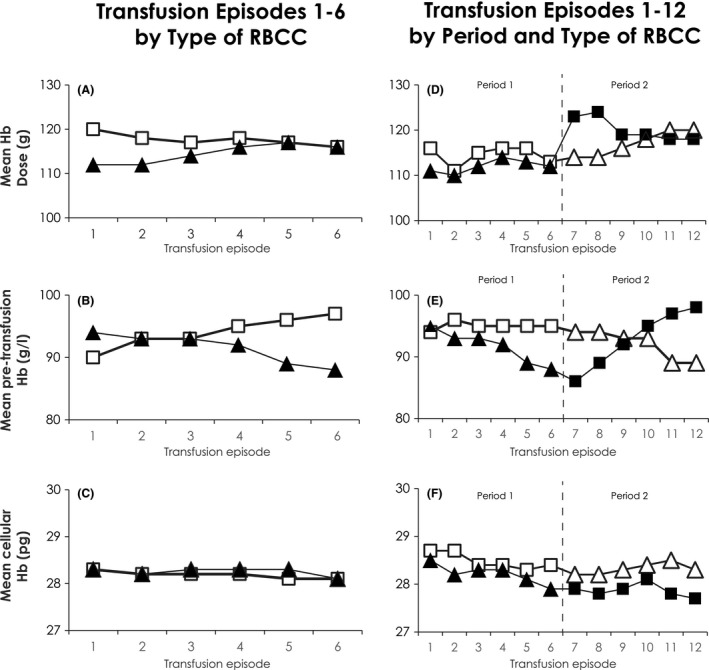
Transfused haemoglobin dose, pre‐transfusion haemoglobin and patient mean corpuscular haemoglobin. (A–C) Test and Control Transfusion Episodes by Type of RBCC. (A) Mean haemoglobin (Hb) dose (g) transfused per episode; (B) Mean pre‐transfusion patient Hb (g/l) per episode; (C) Pre‐transfusion patient mean corpuscular haemoglobin (MCH, pg) are indicated for all Test (▲) and Control ( ) red blood cell concentrate (RBCC) transfusion episodes. (D–F) Test and Control Transfusion Episodes by Sequence and Type of RBCC: For 41 patients, Test were transfused in Period 1 (▲) for episodes 1–6 followed by Control RBCC in Period 2 (
 ) for episodes 7–12. For 39 patients, Control RBCC (
 ) were transfused in Period 1 for episodes 1–6 followed by Test RBCC (
 ) in Period 2 for episodes 7–12. (D) Mean Hb dose (g) transfused per episode; (E) Mean pre‐transfusion patient Hb (g/l) per episode; (F) Pre‐transfusion patient MCH (pg) are indicated for Test and Control RBCC by randomized treatment sequence for all transfusion episodes.
Table 6.
Haemoglobin use (g/kg/day) for the ITT population for all RBCC transfusions in each treatment period (transfusions 1–6).*
| Italy | Turkey | Non‐splenectomized | Splenectomized | Total population | P ‡ | ||||||
|---|---|---|---|---|---|---|---|---|---|---|---|
| Test | Control | Test | Control | Test | Control | Test | Control | Test | Control | ||
| ITT (n) | 13 | 13 | 67 | 67 | 40 | 40 | 40 | 40 | 80 | 80 | |
| Hb dose† | 765 (200) | 743 (230) | 667 (51) | 688 (65) | 693 (119) | 697 (131) | 673 (72) | 696 (85) | 683 (98) | 697 (109) | 0·117 |
| Interval† | 17·4 (4·0) | 17·7 (5·2) | 19·7 (3·4) | 19·8 (3·1) | 18·0 (3·0) | 18·2 (3·3) | 20·7 (3·6) | 20·8 (3·3) | 19·4 (3·5) | 19·5 (3·6) | 0·354 |
| Hb use† | 0·137 (0·03) | 0·139 (0·03) | 0·105 (0·03) | 0·107 (0·03) | 0·131 (0·03) | 0·132 (0·03) | 0·090 (0·03) | 0·093 (0·03) | 0·110 (0·03) | 0·112 (0·03) | 0·255 |
C, control; Hb, haemoglobin; ITT, intent to treat; PPO, per‐protocol only; SD, standard deviation.
Data are presented for the ITT and PPO populations (n = number of patients) by country, by spleen status and for the total ITT population.
Mean (SD) are presented for total Hb dose (g), transfusion interval (days), Hb use (g/kg/day).
P‐values for the treatment difference (T‐C) for ITT and PPO populations are derived from the paired t‐test. Data are presented by country and by spleen status for informational purposes.
Half of the patient population was splenectomized prior to study entry; these patients received significantly less (P = 0·019) Test RBCC Hb (673 ± 24 g) than Control RBCC (696 ± 85 g) (Table 4). Splenectomized patients were older, had higher body weight (Table 1) and longer transfusion intervals, and used approximately 30% less Hb with both Test and Control RBCC (Tables 5 and 6). However, within the respective sub‐groups of splenectomized and non‐splenectomized patients, Hb use of Test RBCC and Control RBCC was not markedly different (Tables 5, 6, SIV, SV).
The mean Hb dose was similar for ITT and PPO patients during Test and Control efficacy episodes 3–6 (Table 5). However, during wash‐in transfusions 1 and 2 (Fig 4A), the Hb dose was significantly less for Test RBCC (222 ± 37 g vs. Control 236 ± 38 g, P < 0·001). Mean pre‐transfusion Hb levels with A‐GSH RBCC declined over 6 transfusion episodes during Test periods by 6·0 g/l Fig 4B), although average mean pre‐transfusion Hb levels (g/l) for Test (92 ± 7·0) and Control (94 ± 7·0) remained within the targeted range (90–100 g/l), but were statistically different (P = 0·002, paired t‐test). Despite changes in pre‐transfusion Hb levels, patient average MCH values (Fig 4C) remained within the normal range (27–31 pg). The impact of transfusion sequence on pre‐transfusion Hb levels was evaluated (Fig 4D, E). Mean Hb doses in Period 2 Control increased following Period 1 Test in response to consistently lower Test RBCC Hb doses and declining pre‐transfusion Hb levels in Period 1 Test (Fig 4D, E). With larger Control Hb doses in Period 1 followed by adequate Test RBCC Hb doses in Period 2 (Fig 4D), pre‐transfusion Hb levels in Period 2 with Test RBCC declined less (Fig 4E). Across both periods with Test and Control RBCC, regardless of treatment sequence, patient MCH remained consistently >27 pg (Fig 4F).
Safety outcomes
No patients developed antibodies specific to A‐GSH RBCC. No patients developed emergent antibodies against RBC antigens during either the treatment period or post‐transfusion surveillance, and no patients had clinical or laboratory evidence of immune haemolysis. Total bilirubin values were slightly elevated above the reference range at all times, but not different between Test and Control; and serum LDH levels remained within normal reference ranges. The incidence of all grades of treatment‐emergent AE was comparable between treatment periods (Table SV). The majority of AE were of Grade 1 and 2 severity, and there was no difference in the distribution of clinical severity between Test and Control RBCC (P = 0·857). Within the System Organ Class of Metabolism Disorders there was an increase in the AE of Diabetes Mellitus attributable to an increased incidence of higher fasting blood glucose levels during Control periods.
The AE of “symptomatic anaemia”, defined by a pre‐transfusion Hb level substantially below 90–100 g/l requiring an unscheduled transfusion, was reported for 6 Test period and 3 Control period patients, and one patient had “symptomatic anaemia” reported in both the Test and Control periods. The pre‐transfusion Hb levels for these patients ranged from 60 to 78 g/l (Table SVI; Figure S1). Each of these patients had received RBCC doses below the study average Hb dose for Test and Control RBCC over successive transfusion episodes; and 2 patients had concurrent inflammatory AEs.
Discussion
Pathogen reduction of platelet and plasma components has been introduced into routine practice in a number of countries as a prospective measure to reduce the risk of TTI. (U.S. Department of Health and Human Services Food and Drug Administration 2017) The current study is part of the clinical development programme for PR A‐GSH RBCC to complete licensure of pathogen reduction for all blood components. This study was designed to assess the impact of A‐GSH RBCC on Hb utilization, a direct measure of efficacy in TDT which requires long‐term RBC support. By ITT and PPO analyses, haemoglobin use of A‐GSH RBCC was not inferior to conventional RBCC. The calculated daily transfusion Fe burden associated with Test RBCC for all patients was 0·38 mg/kg/day, in agreement with the range of 0·33–0·43 mg/kg/day reported for conventional RBCC and, as previously described, we confirmed a lower transfusion Fe burden in splenectomized (0·31 mg/kg/day) compared to non‐splenectomized patients (0·45 mg/kg/day) (Cohen et al, 2008; Porter & Garbowski, 2018). No patients had immune responses specific to PR RBCC or alloantibodies to RBC antigens despite limited RBC phenotype matching in a majority of patients. There were no substantial differences in the safety profiles between Test and Control RBCC.
The distribution of Hb content for Test and Control RBCC was broad. We believe this was due to variable donor Hb levels and blood collection volumes. On average, A‐GSH RBCC contained 1 g less of total Hb, and this resulted in a lower mean Hb dose during the Test treatment period, but did not generally result in adjustments to transfusion RBCC dosing or transfusion intervals. In routine practice, the Hb content of RBCC is not measured; and RBCC are ordered without knowledge of Hb content of each RBCC. In our study, exacerbation of anaemia in 10% of patients correlated with repeated lower Hb doses in randomly selected RBCC.
This study was conducted under routine practice conditions in Italy and Turkey with differences in targeted pre‐transfusion Hb thresholds (100 vs. 90 g/l, respectively. The majority of splenectomized patients were enrolled in Turkey. The clinical centres in both countries used accepted target pre‐transfusion Hb levels (Cappellini & Motta, 2017). Inclusion of splenectomized and non‐splenectomized patients confirmed that splenectomized patients have lower overall Hb requirements, but Hb use was similar for Test and Control RBCC (Cazzola et al, 1997; Cohen et al, 2008). Although we observed a trend of decreasing pre‐transfusion Hb levels with Test RBCC, average pre‐transfusion Hb levels remained within targeted ranges. The decline in pre‐transfusion Hb may indicate decreased viability of A‐GSH RBCC. To explore the hypothesis if reduced RBC viability impacted patient Hb levels, we examined the effects of treatment sequence and Hb doses during the wash‐in transfusions (Fig 4A, D). This analysis suggested that reduced Hb doses during the wash‐in phase exerted an effect on subsequent pre‐transfusion Hb levels. Over all 6 transfusion episodes of Test RBCC the decrease in pre‐transfusion Hb levels appeared less than would be expected if the viability of Test RBCC had been substantially reduced. Management of transfusion doses with knowledge of Hb content may facilitate management of patient Hb levels, transfused Fe, level of erythropoiesis suppression, and tissue Fe burden (Porter & Garbowski, 2018).
A potential limitation of this study was the duration of transfusion support. The duration of the treatment periods was selected to provide a feasible time to characterize Hb use within the crossover design which was used to minimize inter‐patient variability. Although a period effect was detected, it was small, and appeared largely attributable to the increased Hb dose in the treatment sequence of Period 1 Test RBCC to Period 2 Control RBCC in response to modestly decreasing pre‐transfusion Hb levels with Period 1 Test, due to lower Hb doses with wash‐in RBCC. Despite these data regarding the impact of Test RBCC Hb content, a small effect of A‐GSH PR on Test RBC viability may not be excluded definitively. The duration of transfusion support may have impacted our ability to detect immune responses to A‐GSH RBCC. Multiple studies have indicated that the number of RBCC transfused is an important determinant of alloimmunization; and that splenectomized patients have an increased rate of alloimmunization (Thompson et al, 2011; Vichinsky et al, 2014; Franchini et al, 2019). Al‐Riyami et al (2018) estimated that the rate of alloimmunization per 100 units transfused was 0·56. Thus, within the limited duration of our study, we may have expected to observe approximately 5 new alloantibodies and, despite the inclusion of a substantial number of higher risk splenectomized patients and a transfusion policy of ABO‐D matched RBCC in a majority of patients, no treatment emergent alloantibodies were observed. Studies of longer duration with A‐GSH RBCC will be required to confirm our observations.
Within the scope of this study, the experience with A‐GSH RBCC may be generalizable to other types of chronic anaemia to reduce TTI risk without impacting Hb use and Fe transfusion burden, but further studies are required to support this opinion. This study showed that there is large variability (35–75 g) in the Hb content of donor RBCC. This is likely to impact both Fe loading rates and secondary Fe distribution (Porter & Garbowski, 2018). Active management of Hb dose over extended periods of transfusion support should be carefully evaluated further in routine use to determine if selection of RBCC with knowledge of Hb content can result in more consistent pre‐transfusion Hb levels and further reduce transfusion Fe burden. In conclusion, this study showed that A‐GSH pathogen reduction of RBCC did not significantly increase RBCC utilization in TDT patients, and appeared to be well‐tolerated and logistically feasible for chronic transfusion therapy within each country's economic resources.
Authorship Contributions
Yesim Aydinok, Antonio Piga and Raffaella Origa conducted the clinical trial at the respective clinical trial sites. Nina Mufti, Anna Erickson, Anne North and Katie Waldhaus conducted the development, validation and transfer of the pathogen reduction process to the respective clinical blood transfusion services. Christine Ernst served as the sponsor medical monitor and coordinated study activities with the contract clinical research organization. Jin‐Sying Lin and Norman Huang wrote the statistical analysis plan and analysed the data. Richard J Benjamin supervised clinical conduct of the study, and wrote amended versions of the protocol. Laurence Corash designed the study protocol, wrote the initial study protocol and oversaw clinical conduct of the study. Richard Benjamin and Laurence Corash wrote the manuscript. The data and the manuscript were reviewed and edited by Yesim Aydinok, Antonio Piga, Raffaella Origa, Nina Mufti, Christine Ernst, Jin‐Sying Lin, Nortman Huang, Richard J Benjamin and Laurence Corash. Anna Erikson, Nina Mufti and Anne North reviewed the RBCC production and RBCC quality control data.
Disclosure of Conflicts of Interest
Yesim Aydinok, Antonio Piga, and Rafaella Origa received institutional research support from Cerus for conduct of the study. Nina Mufti, Anna Erickson, Anne North, Katie Waldhaus, Christine Ernst, Jin‐Sying Lin, Norman Huang, Richard J. Benjamin, and Laurence Corash were employees of Cerus Corporation and beneficial owners of Cerus stock and/or stock options during the conduct of the study and the preparation of the manuscript. The INTERCEPT Blood System for Red Blood Cells and Amustaline‐Glutathione RBCC are not FDA licensed.
Supporting information
Data S1. Supplemental methods.
Table SI. Thalassemia mutations, clinical phenotype, and clinical severity by mutation.
Table SII. Off‐protocol transfusion exposure by patient.
Table SIII. Hemoglobin use (g/kg/day) for the PPO population in the efficacy evaluation period.
Table SIV. Hemoglobin use (g/kg/day) for the PPO population for all RBCC transfusions in each treatment period.
Table SV. Treatment emergent adverse events in test and control RBCC treatment periods by system order class (SOC).
Table SVI. Evaluation of patients with the adverse event of anemia.
Fig S1. Sequential hemoglobin doses for patients with the adverse event of anemia.
Acknowledgements
The Data and Safety Monitoring Board (Alan Cohen, MD – Children's Hospital of Philadelphia, Philadelphia, PA; Luca Pierelli, MD – San Camillo Forlanini, Rome, Italy; and Connie Westhoff, PhD – New York Blood Center, New York, NY) reviewed the study data during the study and after study completion. The Data and Safety Monitoring Board members received an honorarium for service and reimbursement of travel expenses to meetings. Mohandas Narla, PhD (NY Blood Center) provided guidance on data interpretation and use of MCH as an index of endogenous erythroid suppression. He received reimbursement for travel expenses to attend data review meetings. John Porter, MD – University College London Hospital (London, UK) served as an external reviewer of the study data and the manuscript. Dr. Porter did not receive compensation, but did receive reimbursement for travel expenses to a DSMB meeting. Maria Bonaria Tronci, Centre for Immunology and Transfusion Medicine, Cagliari, Italy, and Anna Maria Bordiga, Emocomponent Production Centre OIRM Sant'Anna Hospital, Torino, Italy, oversaw the production of blood components at their respective centres. Cigdem Sonar and Alime Unuvar Sozer provided technical support for the production of blood components at the Ege University Hospital Blood Centre, Izmir, Turkey.
References
- Al‐Riyami, A.Z. , Al‐Muqbali, A. , Al‐Sudiri, S. , Murthi Panchatcharam, S. , Zacharia, M. , Al‐Mahrooqi, S. , Al‐Hosni, S. , Al‐Marhoobi, A. & Daar, S. (2018) Risks of red blood cell alloimmunization in transfusion‐dependent beta‐thalassemia in Oman: a 25‐year experience of a University Tertiary Care Reference Center and a literature review. Transfusion, 58, 871–878. [DOI] [PubMed] [Google Scholar]
- Benjamin, R.J. , McCullough, J. , Mintz, P.D. , Snyder, E. , Spotnitz, W.D. , Rizzo, R.J. , Wages, D. , Lin, J.S. , Wood, L. , Corash, L. & Conlan, M.G. (2005) Therapeutic efficacy and safety of red blood cells treated with a chemical process (S‐303) for pathogen inactivation: a phase III clinical trial in cardiac surgery patients. Transfusion, 45, 1739–1749. [DOI] [PubMed] [Google Scholar]
- Brixner, V. , Kiessling, A.H. , Madlener, K. , Muller, M.M. , Leibacher, J. , Dombos, S. , Weber, I. , Pfeiffer, H.U. , Geisen, C. , Schmidt, M. , Henschler, R. , North, A. , Huang, N. , Mufti, N. , Erickson, A. , Ernst, C. , Rico, S. , Benjamin, R.J. , Corash, L.M. & Seifried, E. (2018) Red blood cells treated with the amustaline (S‐303) pathogen reduction system: a transfusion study in cardiac surgery. Transfusion, 58, 905–916. [DOI] [PubMed] [Google Scholar]
- Cancelas, J.A. , Gottschall, J.L. , Rugg, N. , Graminske, S. , Schott, M.A. , North, A. , Huang, N. , Mufti, N. , Erickson, A. , Rico, S. & Corash, L. (2017) Red blood cell concentrates treated with the amustaline (S‐303) pathogen reduction system and stored for 35 days retain post‐transfusion viability: results of a two‐centre study. Vox Sanguinis, 112, 210–218. [DOI] [PubMed] [Google Scholar]
- Candotti, D. , Assennato, S.M. , Laperche, S. , Allain, J.P. & Levicnik‐Stezinar, S. (2019) Multiple HBV transfusion transmissions from undetected occult infections: revising the minimal infectious dose. Gut, 68, 313–321. [DOI] [PubMed] [Google Scholar]
- Cappellini, M.D. & Motta, I. (2017) New therapeutic targets in transfusion‐dependent and ‐independent thalassemia. Hematology/the Education Program of the American Society of Hematology, 2017, 278–283. [DOI] [PMC free article] [PubMed] [Google Scholar]
- Cazzola, M. , Borgna‐Pignatti, C. , Locatelli, F. , Ponchio, L. , Beguin, Y. & De Stefano, P. (1997) A moderate transfusion regimen may reduce iron loading in beta thalassemia major without producing excessive expansion of erythropoiesis. Transfusion, 37, 135–140. [DOI] [PubMed] [Google Scholar]
- Chou, S.T. , Jackson, T. , Vege, S. , Smith‐Whitley, K. , Friedman, D.F. & Westhoff, C.M. (2013) High prevalence of red blood cell alloimmunization in sickle cell disease despite transfusion from Rh‐matched minority donors. Blood, 122, 1062–1071. [DOI] [PubMed] [Google Scholar]
- Cohen, A.R. , Glimm, E. & Porter, J.B. (2008) Effect of transfusional iron intake on response to chelation therapy in beta‐thalassemia major. Blood, 111, 583–587. [DOI] [PubMed] [Google Scholar]
- Damgaard, C. , Magnussen, K. , Enevold, C. , Nilsson, M. , Tolker‐Nielsen, T. , Holmstrup, P. & Nielsen, C.H. (2015) Viable bacteria associated with red blood cells and plasma in freshly drawn blood donations. PLoS ONE, 10, e0120826. [DOI] [PMC free article] [PubMed] [Google Scholar]
- Erickson, A. , Aydinok, Y. , Sonar, C. , Bordiga, A. , Labanca, L. , Pani, M. , Tronci, M. , Waldhaus, K. & Mufti, N. (2018) Characterization of S‐303/GSH pathogen inactivated red blood cells and conventional red blood cells in a chronic transfusion clinical trial of thalassemia major patients. Vox Sanguinis, 113, 177.29044588 [Google Scholar]
- Franchini, M. , Forni, G.L. , Marano, G. , Cruciani, M. , Mengoli, C. , Pinto, V. , De Franceschi, L. , Venturelli, D. , Casale, M. , Amerini, M. , Capuzo, M. , Grazzini, G. , Masiello, F. , Pati, I. , Veropalumbo, E. , Vaglio, S. , Pupella, S. & Liumbruno, G.M. (2019) Red blood cell alloimmunisation in transfusion‐dependent thalassemia: a systematic review. Blood Transfusion, 17, 4–15. [DOI] [PMC free article] [PubMed] [Google Scholar]
- Geisen, C. , Aydinok, Y. , Origa, R. , Piga, A. , Brixner, V. , Mufti, N. , Erickson, A. , Ernst, C. , North, A. , Corash, L. & Benjamin, R. (2018) No INTERCEPT (S‐303/Glutathione)‐specific antibodies detected in A phase III, randomized, controlled study to evaluate pathogen‐inactivated red blood cells in thalassemia major patients (SPARC). Vox Sanguinis, 113, 34. [Google Scholar]
- Kleinman, S. & Stassinopoulos, A. (2015) Risks associated with red blood cell transfusions: potential benefits from application of pathogen inactivation. Transfusion, 55, 2983–3000. [DOI] [PMC free article] [PubMed] [Google Scholar]
- North, A. , Castro, G. , Erickson, A. , Cook, D. & Corash, L. (2007) Characterization of antibodies to red cells prepared with S‐303 pathogen inactivation treatment. Vox Sanguinis, 93(Suppl 1), 167–168. [Google Scholar]
- Porter, J.B. & Garbowski, M.W. (2018) Interaction of transfusion and iron chelation in thalassemias. Hematology/Oncology Clinics of North America, 32, 247–259. [DOI] [PubMed] [Google Scholar]
- Stramer, S.L. , Dodd, R.Y. ; AABB Transfusion‐Transmitted Diseases Emerging Infectious Diseases Subgroup . (2013) Transfusion‐transmitted emerging infectious diseases: 30 years of challenges and progress. Transfusion, 53, 2375–2383. [DOI] [PMC free article] [PubMed] [Google Scholar]
- Teawtrakul, N. , Jetsrisuparb, A. , Sirijerachai, C. , Chansung, K. & Wanitpongpun, C. (2015) Severe bacterial infections in patients with non‐transfusion‐dependent thalassemia: prevalence and clinical risk factors. International Journal of Infectious Diseases, 39, 53–56. [DOI] [PubMed] [Google Scholar]
- Thompson, A.A. , Cunningham, M.J. , Singer, S.T. , Neufeld, E.J. , Vichinsky, E. , Yamashita, R. , Giardina, P. , Kim, H.Y. , Trachtenberg, F. & Kwiatkowski, J.L. ; Thalassemia Clinical Research Network Investigators . (2011) Red cell alloimmunization in a diverse population of transfused patients with thalassaemia. British Journal of Haematology, 153, 121–128. [DOI] [PMC free article] [PubMed] [Google Scholar]
- U.S. Department of Health and Human Services Food and Drug Administration . (2017) Implementation of Pathogen Reduction Technology in the Manufacture of Blood Components in Blood Establishments: Questions and Answers. Center for Biologics Evaluation and Research, Silver Springs, MD. [Google Scholar]
- Vichinsky, E. , Neumayr, L. , Trimble, S. , Giardina, P.J. , Cohen, A.R. , Coates, T. , Boudreaux, J. , Neufeld, E.J. , Kenney, K. , Grant, A. & Thompson, A.A. (2014) Transfusion complications in thalassemia patients: a report from the Centers for Disease Control and Prevention (CME). Transfusion, 54, 972–981; quiz 971. [DOI] [PMC free article] [PubMed] [Google Scholar]
Associated Data
This section collects any data citations, data availability statements, or supplementary materials included in this article.
Supplementary Materials
Data S1. Supplemental methods.
Table SI. Thalassemia mutations, clinical phenotype, and clinical severity by mutation.
Table SII. Off‐protocol transfusion exposure by patient.
Table SIII. Hemoglobin use (g/kg/day) for the PPO population in the efficacy evaluation period.
Table SIV. Hemoglobin use (g/kg/day) for the PPO population for all RBCC transfusions in each treatment period.
Table SV. Treatment emergent adverse events in test and control RBCC treatment periods by system order class (SOC).
Table SVI. Evaluation of patients with the adverse event of anemia.
Fig S1. Sequential hemoglobin doses for patients with the adverse event of anemia.