

ABSTRACT
Objectives
To review systematically current literature on kidney function changes during pregnancy, in order to estimate the extent of adaptation over the course of both healthy physiological and complicated singleton pregnancies, and to determine healthy pregnancy reference values.
Methods
PubMed (NCBI) and EMBASE (Ovid) electronic databases were searched, from inception to July 2017, for studies on kidney function during uncomplicated and complicated pregnancies. Included studies were required to report a non‐pregnant reference value of kidney function (either in a non‐pregnant control group or as a prepregnancy or postpartum measurement) and a pregnancy measurement at a predetermined and reported gestational age. Kidney function measures assessed were glomerular filtration rate (GFR) measured by inulin clearance, GFR measured by creatinine clearance and serum creatinine level. Pooled mean differences between pregnancy measurements and reference values were calculated for predefined intervals of gestational age in uncomplicated and complicated pregnancies using a random‐effects model described by DerSimonian and Laird.
Results
Twenty‐nine studies met the inclusion criteria and were included in the analysis. As early as the first trimester, GFR was increased by up to 40–50% in physiological pregnancy when compared with non‐pregnant values. Inulin clearance in uncomplicated pregnancy was highest at 36–41 weeks, with a 55.6% (53.7; 95% CI, 44.7–62.6 mL/min) increase when compared with non‐pregnant values, and creatinine clearance was highest at 15–21 weeks' gestation, with a 37.6% (36.6; 95% CI, 26.2–46.9 mL/min) increase. Decrease in serum creatinine level in uncomplicated pregnancy was most prominent at 15–21 weeks, with a 23.2% (−0.19; 95% CI, −0.23 to −0.15 mg/dL) decrease when compared with non‐pregnant values. Eight studies reported on pregnancies complicated by a hypertensive disorder. Meta‐regression analysis showed a significant difference in all kidney function parameters when comparing uncomplicated and hypertensive complicated pregnancies.
Conclusions
In healthy pregnancy, GFR is increased as early as the first trimester, as compared with non‐pregnant values, and the kidneys continue to function at a higher rate throughout gestation. In contrast, kidney function is decreased in hypertensive pregnancy. © 2018 The Authors. Ultrasound in Obstetrics & Gynecology published by John Wiley & Sons Ltd on behalf of the International Society of Ultrasound in Obstetrics and Gynecology.
Keywords: estimated glomerular filtration rate, GFR, gestational hypertensive disease, kidney function, physiology, placental syndrome, pre‐eclampsia, pregnancy, serum creatinine
INTRODUCTION
Decreased vascular resistance is thought to induce adaptations that occur during normal physiological pregnancy and are sustained by increased nitric oxide production1, 2. Decrease in resistance initiates a chain of events that results in a rise in cardiac output and abets the expansion of plasma volume by stimulating renal sodium and water retention, sodium appetite and thirst3. Both increased renal blood flow and decreased oncotic pressure due to plasma volume expansion contribute to higher glomerular filtration rate (GFR)4, 5.
In humans, this increase in GFR is reported as early as the first weeks after conception and is usually sustained until the end of gestation, but reported data show considerable individual variation6. Pregnancy complicated by hypertensive disease shows decreased kidney function. Despite this knowledge, reference curves of kidney function in pregnancy are lacking in the literature7, 8. This meta‐analysis therefore aimed to review and quantify systematically current literature on kidney function, as assessed by GFR or serum creatinine (SC), during pregnancy in order to estimate the extent of adaptation over the course of both physiological and complicated singleton pregnancy. We also aimed to construct references curves for GFR and SC level in healthy pregnancy, defining the 5th, 50th and 95th percentiles.
METHODS
Literature search
PubMed (NCBI) and EMBASE (Ovid) were searched, from inception to July 2017, for studies evaluating kidney function in physiological uncomplicated and hypertensive complicated pregnancies. The search strategy focused on pregnancy, both uncomplicated and complicated, and kidney function (Table S1). Complicated pregnancy was subdivided into pregnancy‐induced hypertension, fetal growth restriction (FGR), pre‐eclampsia (PE) and gestational diabetes mellitus (GDM). All components consisted of free search terms in titles and abstracts and MeSH and Emtree terms for PubMed and EMBASE databases, respectively. Reference lists of all included studies were searched manually for additional studies.
Selection of studies
Studies were assessed for inclusion following a two‐phased selection process (Figure 1). First, all obtained articles were screened independently for eligibility by two investigators (V.L.vB., T.vG.) based on title and abstract only. Discrepancies were resolved by mutual agreement. Subsequently, the full‐text version of articles that passed the first selection phase were read and screened, based on the inclusion and exclusion criteria, by the same investigators.
Figure 1.
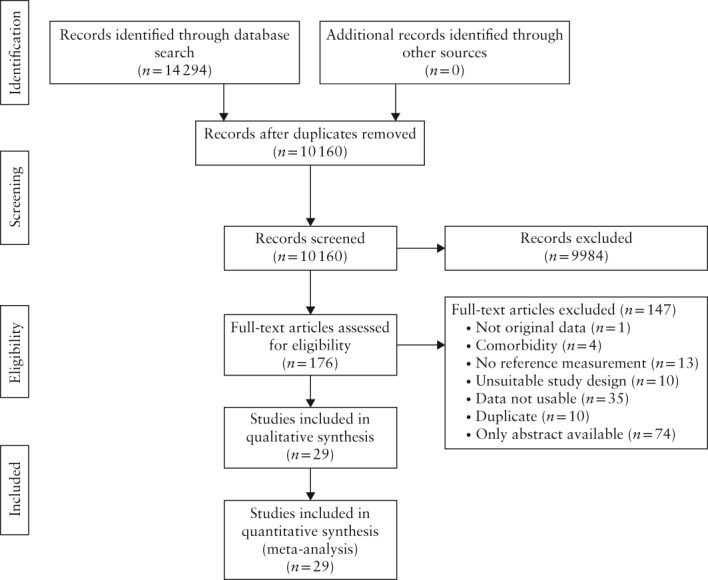
Flowchart summarizing selection, inclusion and exclusion in systematic review of studies on kidney function in pregnancy.
Studies were eligible for inclusion if they reported original data, including mean GFR, estimated GFR (eGFR) or SC in human singleton pregnancy, with either SD, standard error (SE) or 95% CI. We assumed that values were normally distributed. Studies were required to include a reference value from non‐pregnant controls or from the study women themselves, either prepregnancy or postpartum (> 6 weeks). This was relevant in order to be able to calculate differences between pregnancy and reference measurements within each study. Additionally, there were no restrictions on age, weight, height, ethnicity or parity. Exclusion criteria were: assessment of women with comorbidity (such as pre‐existing cardiovascular history, diabetes mellitus, kidney disease and immunological disease) and language other than English, Dutch, Spanish, Italian, Portuguese, French or German. Case reports and reviews were also excluded. Measurements obtained following an intervention were not used, but baseline measurements in an intervention study were9, 10, 11, 12.
Data extraction
Data regarding study characteristics, anthropometric measures and methods used to measure (e)GFR and SC were extracted from the selected studies. Regarding study characteristics, the following were obtained: authors, year of publication, study design, sample size, population description, inclusion and exclusion criteria and key conclusions.
Extracted patient and pregnancy characteristics consisted of age, non‐pregnant weight and body mass index, height, parity, gravidity, body surface area, gestational age at (e)GFR or SC measurement, birth weight and gestational age at delivery. For women with a gestational hypertensive disease, gestational age at onset of the hypertensive disorder was documented. Effect measures included eGFR, GFR and SC as primary outcomes, and heart rate, systolic blood pressure, diastolic blood pressure and mean arterial pressure as secondary outcomes. We defined GFR as kidney function measured by either inulin or creatinine clearance (mL/min) and eGFR as kidney function measured by any formula based on SC (mL/min/1.73m2 or mL/min). Data on GFR measurement protocol, eGFR formulae and SC analysis were also extracted. If a study contained more than one measurement during the predefined gestational age intervals, the mean value was calculated13, 14. Additional information from the authors of the included articles was requested if data were unclear or incomplete.
Quality assessment
The quality and risk of bias of included studies were assessed independently by two investigators (V.A.L.v.B., T.A.G.v.G.) according to a modified set of items reported in the Quality in Prognosis Study (QUIPS) tool15. This modification was made to suit the purposes of this review.
A plus, minus or question mark (which counts as a minus and was used when follow‐up was not applicable) was allocated for each study in each of the five risk of bias domains, including study participation, study attrition, variable measurement, data reporting and study design. All domains were deemed of equal importance and thus weighted accordingly in the total score. Studies with a positive score of ≥ 60% were defined as high quality (HQ), those scoring ≥ 30% and < 60% as moderate quality (MQ) and those scoring < 30% as low quality (LQ).
Data and statistical analysis
(e)GFR and SC were categorized into five different intervals of gestational age (7–14, 15–21, 22–28, 29–35 and 36–41 weeks). These intervals were adapted from Abudu et al.16. SD was obtained from SE or 95% CI and calculated for combined groups according to the Cochrane Handbook for Systematic Review of Interventions, when necessary17. Change in (e)GFR and SC was calculated according to these predefined intervals using a random‐effects model, as described by DerSimonian and Laird18. The random‐effects model allows for interstudy variation and was chosen by design as observational data on different pregnant populations were used. The primary outcome of each study was mean difference in (e)GFR and SC between pregnancy and reference values, reported with 95% CI. The relative increase or decrease from reference was reported as percentage (95% CI). Reference values in healthy pregnancy were constructed by plotting the mean of the reference (non‐pregnant) measurements in each study, at each gestational age and time postpartum. Because different laboratory methods were used to measure serum creatinine, we evaluated the effect of measurement type in regression analysis.
The 5th and 95th percentiles were calculated from intrastudy variance as 95% prediction intervals. Each point estimate was indexed as a value from a LQ, MQ or HQ study, as determined during quality assessment. The meta‐analyses and meta‐regression analyses were performed in R version 3.2.3 using the meta package V4.8‐419, 20. The results of the meta‐analysis are presented in forest plots.
The ratio between total heterogeneity and total variability (I‐squared statistic; I 2) was computed as a measure of heterogeneity. I 2 can distinguish true heterogeneity from sampling variance and is expressed as a percentage21. Sources of heterogeneity were investigated by meta‐regression analyses using a mixed‐effects model. Egger's regression test for funnel plot asymmetry was performed to test for the presence of publication bias22.
RESULTS
Study and data selection
The literature search identified 10 160 potentially eligible articles in PubMed and EMBASE after removal of duplicates (Figure 1). No additional articles were found in the manual search of reference lists. Of these studies, 176 were eligible for full‐text assessment after screening based on title and abstract. We excluded 147 full text articles for several reasons, a large number of which were due to unobtainable data (n = 74; Figure 1 and Appendix S1). No studies were excluded based on language. Contacting authors did not result in any additional information. Finally, 29 studies were included, constituting 20 preconception, 376 non‐pregnant, 1037 healthy pregnant, 204 hypertensive complicated pregnancies and 246 postpartum kidney function values.
Three studies, two of which are included in this review and analysis, contained eGFR values23, 24, 25; all other studies reported GFR measured by either inulin (GFR‐IC) or creatinine (GFR‐CC) clearance. We were therefore unable to perform a meta‐analysis of eGFR. Three studies contained values of inulin clearance expressed as mL/min/1.73m2, which we were unable to process in this meta‐analysis due to body surface area data not being provided26, 27, 28.
Two studies13, 29 reported repeat measurements during the predefined intervals; mean and SD were calculated for these studies, ignoring potential clustering. In a study containing 398 healthy pregnant participants, a total of six women developed PE in late pregnancy; these women were not excluded from statistical analysis in the study, or from the current meta‐analysis, due to the marginal effect it may be expected to have on the results30. Because our meta‐analysis showed a significant difference between GFR measured by inulin and GFR measured by creatinine clearance (P < 0.001), these were analyzed separately.
Data extraction
Eight studies included women with hypertensive complicated pregnancy, namely gestational hypertension31 and PE31, 32, 33, 34, 35, 36, 37, 38. We found no studies describing women with GDM. Study characteristics and anthropometric measures are illustrated in Tables 1 and 2 for uncomplicated pregnancies and those complicated by a hypertensive disease, respectively. For most studies, the overall characteristics are detailed. Anthropometric data were reported infrequently and incompletely. It was therefore not possible to analyze the contribution of these variables to the observed heterogeneity. Tables S2–S4 illustrate for each study the measurement methods used for GFR‐IC, GFR‐CC and SC.
Table 1.
Characteristics of included studies on kidney function in uncomplicated pregnancy
| Study | Subjects (n) | Age (years) | Non‐pregnant | Parity (n) | Ref | GA (w) | Methods | ||||||||||
|---|---|---|---|---|---|---|---|---|---|---|---|---|---|---|---|---|---|
| Weight (kg) | Height (cm) | Nulli‐ | Primi‐ | Multi‐ | |||||||||||||
| R | P | R | P | R | P | R | P | R | P | R | P | R | P | ||||
| Abdul‐Karim (1978)52 | 20 | 91 | — | — | — | — | — | — | — | — | — | — | — | — | NP | 16, 26, 33, 37 | SC |
| Ahmed (2009)23 | 12 | 12 | — | — | 65 | 65 | 164 | 164 | — | — | — | — | — | — | PP (15 w) | 21, 34 | GFR (IC and 24h CC), SC |
| Akram (1982)53 | 30 | 29 | 28.5 | 29.7 | — | — | — | — | — | — | — | — | — | — | NP | 39, 10 PP | GFR (24h CC), SC |
| Barden (1996)32 | 24 | 28 | 27.3 | 26.8 | — | — | — | — | — | — | — | 13 | — | 15 | NP | 30 | GFR (24h CC) |
| Barron (1995)54 | 22 | 22 | 28.7 | 28.7 | — | — | — | — | — | — | — | — | — | — | PP (44 w) | 30 | GFR (IC and 24h CC) |
| Buttermann (1958)33 | 11 | 72 | — | — | — | — | — | — | — | — | — | — | — | — | NP | 11, 23, 35 | GFR (IC and 24h CC) |
| Chapman (1998)13 | 11 | 10 | 30.9 | 30.9 | 61.5 | — | — | — | 9 | — | — | — | — | — | PC | 12, 24, 36 | SC |
| Davison (1974)12 | 10 | 10 | 28.7 | 28.7 | 56.1 | 56.1 | 160 | 160 | — | — | 3 | 3 | 7 | 7 | PP (10 w) | 17, 27, 37 | GFR (IC and 24h CC) |
| Davison (1981)29 | 9 | 9 | 26.4 | 26.4 | 58.6 | 58.6 | 162 | 162 | 2 | 2 | 7 | 7 | — | — | PC | 14, 16 | GFR (24h CC), SC |
| Davison (1980)55 | 10 | 10 | — | — | 61.8 | 61.8 | 164 | 164 | — | — | 3 | 3 | 7 | 7 | PP (10 w) | 26 | GFR (24h CC) |
| Dunlop (1975)56 | 18 | 18 | — | — | — | — | — | — | — | — | — | — | — | — | PP (8 w) | 37 | GFR (IC) |
| Dunlop (1981)57 | 25 | 25 | 28.6 | 28.6 | 62.8 | 62.8 | 163 | 163 | — | — | 10 | 10 | 15 | 15 | PP (8 w) | 16, 26, 36 | GFR (IC) |
| Gibson (1973)58 | 9 | 9 | 28.1 | 28.1 | 56.4 | 56.4 | 157 | 157 | — | — | 7 | 7 | 2 | 2 | PP (12 w) | 20, 28 | GFR (IC) |
| Irons (1996)9 | 12 | 12 | — | — | — | — | — | — | — | — | 12 | 12 | — | — | PP (16 w) | 32 | GFR (IC) |
| Kristensen (2007)30 | 58 | 398 | 25.0 | 32.0 | — | — | — | — | 49 | 177 | — | — | — | — | NP | 10, 25, 35, 40 | SC |
| Lohsiriwat (2008)59 | 26 | 26 | 25.1 | 25.1 | 63.1 | 63.1 | — | — | — | — | — | — | — | — | PP (9 w) | 34 | GFR (24h CC), SC |
| Milne (2002)10 | 11 | 11 | 27.1 | 27.1 | — | — | — | — | — | — | — | — | — | — | PP (16 w) | 37 | GFR (IC), SC |
| Moran (2003)34 | 13 | 13 | — | — | — | — | — | — | — | — | — | — | — | — | PP (20 w) | 37 | GFR (IC) |
| Mozdzien (1995)60 | 11 | 15 | 23.0 | 23.0 | — | — | 164 | 164 | — | — | 6 | 6 | 9 | 9 | PP (8 w) | 10, 24, 33 | GFR (24h CC), SC |
| Roberts (1996)61 | 11 | 11 | 31.0 | 31.0 | — | — | 164 | 164 | 6 | 6 | — | — | — | — | PP (16 w) | 16, 36 | GFR (IC), SC |
| Saxena (2012)62 | 12 | 12 | 28.7 | 28.7 | — | — | 163 | 164 | — | — | — | — | — | — | PP (16 w) | 22, 34 | GFR (IC and 24h CC), SC |
| Schneider (1996)35 | 6 | 16 | 23.5 | 28.5 | — | — | — | — | — | — | 0 | 11 | — | — | NP | 33 | GFR (24h CC) |
| Smith (2008)25 | 23 | 24 | — | — | — | — | — | — | — | — | — | — | — | — | PP (8 w) | 13, 36 | GFR (IC) |
| Strevens (2002)31 | 12 | 14 | 27.0 | 30.0 | 58.8 | — | 168 | 163 | — | — | — | — | — | — | NP | 33 | SC |
| Sturgiss (1996)11 | 7 | 7 | 31.0 | 31.0 | 63.3 | 63.3 | 159 | 159 | — | — | — | — | — | — | PP (22 w) | 18, 35 | GFR (IC) |
| Vural (1998)36 | 15 | 20 | — | — | — | — | — | — | — | 20 | — | — | — | — | NP | 32 | GFR (24h CC), SC |
| Wang (1994)37 | 26 | 42 | 27.0 | 29.0 | — | — | — | — | — | — | — | — | — | — | NP | 34 | GFR (24h CC) |
| Wright (1987)63 | 9 | 31 | — | — | — | — | — | — | — | — | 17 | 17 | — | — | PP (6 w) | 14, 28, 36 | GFR (2h CC) |
| Yilmaz (2017)38 | 40 | 40 | 27.6 | 26.0 | — | — | — | — | — | — | — | — | — | — | NP | 34 | GFR (24h CC), SC |
First author only given for each study.
Continuous variables are given as means.
CC, creatinine clearance; GA, gestational age at measurement; GFR, glomerular filtration rate; IC, inulin clearance; NP, non‐pregnant control; P, physiological pregnancies; PC, prepregnancy; PP, postpartum; R, reference pregnancies; Ref, reference measurement; SC, serum creatinine; w, weeks.
Table 2.
Characteristics of included studies on kidney function in pregnancy complicated by hypertensive disorder
| Study | Subjects (n) | Age (years) | Non‐pregnant | Parity (n) | Ref | GA (w) | Methods | ||||||||||
|---|---|---|---|---|---|---|---|---|---|---|---|---|---|---|---|---|---|
| Weight (kg) | Height (cm) | Nulli‐ | Primi‐ | Multi‐ | |||||||||||||
| R | CP | R | CP | R | CP | R | CP | R | CP | R | CP | R | CP | ||||
| Barden (1996)32 | 24 | 20 | 27.3 | 27.4 | — | — | — | — | — | — | — | 9 | — | 11 | NP | 30 | GFR (24h CC) |
| Buttermann (1958)33 | 11 | 33 | — | — | — | — | — | — | — | — | — | — | — | — | NP | 35 | GFR (IC and 24h CC) |
| Moran (2003)34 | 5 | 10 | — | — | — | — | — | — | — | — | — | — | — | — | PP (20 w) | 37 | GFR (IC) |
| Schneider (1996)35 | 6 | 16 | 23.5 | 28.6 | — | — | — | — | — | — | 0 | 11 | — | — | NP | 33 | GFR (CC*) |
| Strevens (2002)31 | 12 | 24 | 27.0 | 31.0 | 58.8 | — | 168 | 164 | — | — | — | — | — | — | NP | 36 | SC |
| Vural (1998)36 | 15 | 24 | — | — | — | — | — | — | — | 24 | — | — | — | — | NP | 33 | GFR (24h CC), SC |
| Wang (1994)37 | 26 | 37 | 27.0 | 27.0 | — | — | — | — | — | — | — | — | — | — | NP | 36 | GFR (24h CC) |
| Yilmaz (2017)38 | 40 | 40 | 27.6 | 27.9 | — | — | — | — | — | — | — | — | — | — | NP | 35 | GFR (24h CC), SC |
First author only given for each study.
Continuous variables are given as means.
Hours not reported.
CC, creatinine clearance; CP, hypertensive complicated pregnancies; GA, gestational age at measurement; GFR, glomerular filtration rate; IC, inulin clearance; NP, non‐pregnant control; PP, postpartum; R, reference pregnancies; Ref, reference measurement; SC, serum creatinine; w, weeks.
Quality assessment
Quality assessment of the included studies is detailed in Table S5. Most (n = 15) studies were of MQ, whilst the remainder were of HQ (n = 9) or LQ (n = 5). Quality scores varied between 12% and 82% (median 53%; interquartile range 41–65%).
The modified QUIPS criterion, ‘the methods and setting are the same for all study participants and throughout follow‐up’ was met by all studies, while the items with the fewest studies scoring positively were ‘baseline value was a prepregnant measurement of the variable’ (n = 2), ‘multiple (> 2) longitudinal measurements during pregnancy of the variable’ (n = 5) and ‘adequate description of participant's ethnicity characteristics' (n = 7).
Glomerular filtration rate: inulin clearance
Forest plots illustrating mean difference in GFR‐IC in uncomplicated pregnancies compared with reference values, according to gestational age, are shown in Figure S1. GFR‐IC, when compared to reference values, was increased during uncomplicated pregnancy at all gestational age intervals, with a mean difference (95% CI) of 40.7 (14.1–67.3) mL/min and relative increase (95% CI) of 37.7% (13.1–62.4%) at < 14 weeks, 47.8 (35.1–60.6) mL/min and 46.6% (34.2–59.1%) at 15–21 weeks, 44.8 (29.2–60.4) mL/min and 40.2% (26.2–54.1%) at 22–28 weeks, 39.6 (27.1–52.1) mL/min and 35.6% (24.4–46.8%) at 29–35 weeks and 53.7 (44.7–62.6) mL/min and 55.6% (46.3–64.9%) at 36–41 weeks. Meta‐regression analysis showed no significant effect of gestational age on GFR‐IC (P = 0.789).
In terms of study‐level covariates, to interpret heterogeneity a significant statistical association between GFR‐IC and the type of reference measurement (postpartum vs non‐pregnant, P = 0.001; there were no prepregnancy measurements) and between GFR‐IC and study quality (MQ vs HQ, P = 0.036; there was only one LQ study and its effect could therefore not be calculated) was found. Eggers's funnel plot asymmetry could not be calculated for < 14 weeks due to a lack of studies but was not statistically significant at any other interval (0.254 < P < 0.721).
Two included studies reported data on GFR‐IC in pregnancies complicated by a hypertensive disorder at 29–35 weeks and at 36–41 weeks (Figure S2). In contrast to uncomplicated pregnancies, a significant mean decrease (95% CI) in GFR‐IC of −62.4 (−75.9 to −48.9) mL/min and relative decrease (95% CI) of −51.2% (−62.3 to −40.2%) was seen at 29–35 weeks and no effect was seen at 36–41 weeks (−3.0 (−8.7 to 2.7) mL/min and −3.3% (−9.5 to 3.0%)), as compared with reference values. These results differed significantly from those in uncomplicated pregnancies (P < 0.001).
Reference values for GFR‐IC in physiological uncomplicated pregnancy are presented in Figure 2; there was an overall increase during pregnancy and a slight decrease after 28 weeks of gestation.
Figure 2.
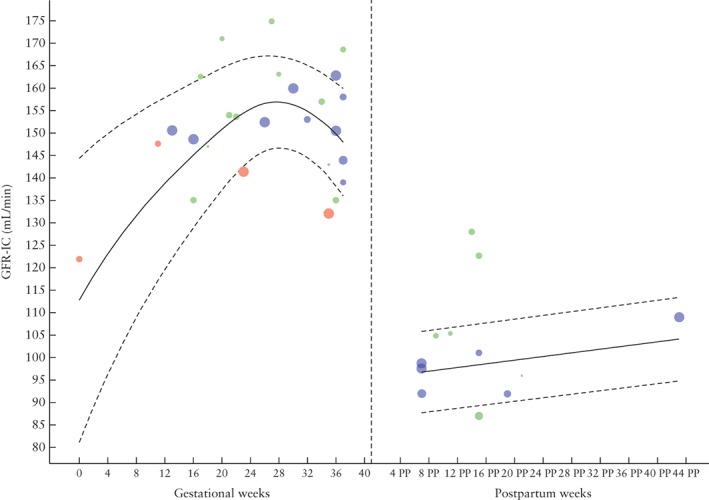
Glomerular filtration rate (GFR), measured by inulin clearance (IC), during and after physiological pregnancy. Circle size indicates sample size of point estimate. Color refers to quality assigned to study: red, low quality; green, moderate quality; blue, high quality. Curve fit is weighted by inverse variance and plotted with 5th and 95th percentiles (dashed lines); 50th percentile is represented by solid line. PP, postpartum.
Glomerular filtration rate: creatinine clearance
Forest plots of mean difference in GFR‐CC in uncomplicated pregnancies compared with reference values, according to gestational age, is illustrated in Figure S3. When compared with reference values, GFR‐CC was increased significantly throughout uncomplicated pregnancy. GFR‐CC increased progressively until 15–21 weeks of gestation, with a mean difference (95% CI) of 22.0 (9.9–34.0) mL/min and relative increase of 23.7% (10.7–36.7%) at < 14 weeks and 36.6 (26.2–46.9) mL/min and 37.6% (26.9–48.2%) at 15–21 weeks. At 22–28 weeks of gestation, GFR‐CC was still increased by 28.7 (16.8–40.6) mL/min and 26.9% (15.7–38.0%), and by 16.0 (9.1–22.9) mL/min and 15.1% (8.6–21.7%) at 29–35 weeks, but this was to a lesser extent than at previous gestational age intervals. GFR‐CC was decreased at 36–41 weeks of gestation (−8.8 (−54.4 to 36.8) mL/min and −8.0% (−49.6 to 33.5%)), but this was not significant.
Meta‐regression analysis showed a significant association between GFR‐CC and gestational age (P = 0.007), however, in contrast to GFR‐IC, no significant effect was seen according to the type of reference measurement (pre‐pregnant vs non‐pregnant, P = 0.227; postpartum vs non‐pregnant, P = 0.811). There was an effect of MQ vs HQ studies (P = 0.01) but no effect of LQ vs HQ studies (P = 0.07) on GFR‐CC. Egger's test for funnel plot asymmetry found no indication of publication bias at any gestational age interval (0.344 < P < 0.697).
Six included studies reported data on GFR‐CC in pregnancies complicated by hypertension (Figure S4). In these pregnancies, GFR‐CC showed a significant decrease of −14.7 (95% CI, −22.1 to −7.3) mL/min and a relative decrease of −14.1% (95% CI, −21.2 to −7.1%) at 29–35 weeks of gestation when compared to reference measurements. This value was significantly different when compared to healthy pregnancy values at the same gestational age interval (P = 0.008).
Figure 3 shows reference values for GFR‐CC throughout physiological uncomplicated pregnancy. There is an increase in GFR‐CC until around 16 weeks of gestation and a decrease thereafter. After 24 weeks, the heterogeneity between studies increased, as can be seen by the number of studies outside the reference curves estimated using aggregated data.
Figure 3.
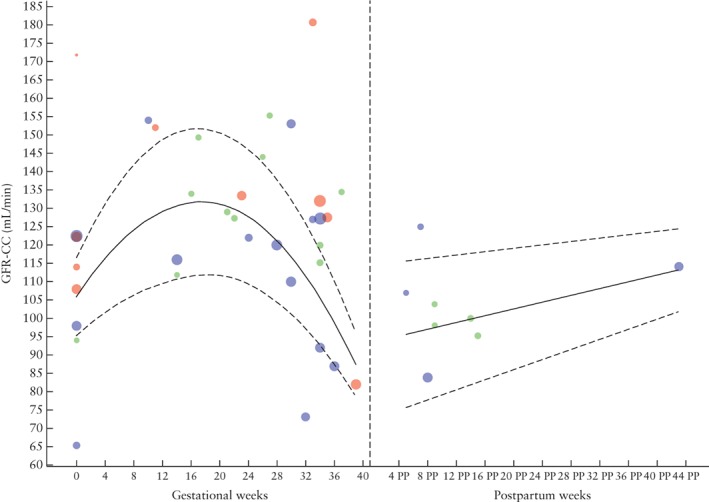
Glomerular filtration rate (GFR), measured by creatinine clearance (CC), during and after physiological pregnancy. Circle size indicates sample size of point estimate. Color refers to quality assigned to study: red, low quality; green, moderate quality; blue, high quality. Curve fit is weighted by inverse variance and plotted with 5th and 95th percentiles (dashed lines); 50th percentile is represented by solid line. PP, postpartum.
Serum creatinine
Forest plots of mean difference in SC in uncomplicated pregnancies compared with reference values, according to gestational age, is illustrated in Figure S5. Throughout uncomplicated pregnancy, SC is decreased in comparison to non‐pregnant reference conditions. At < 14 weeks' gestation, SC was decreased slightly, with a mean difference (95% CI) of −0.12 (−0.15 to −0.08) mg/dL and a relative difference (95% CI) of −16.5% (−20.4 to −14.0%) and was decreased further at 15–21 weeks, with a mean difference of −0.19 (−0.23 to −0.15) mg/dL and relative difference of −23.2% (−28.1 to −18.3%), only to reach a plateau at 22–28 weeks with −0.18 (−0.22 to −0.15) mg/dL and −22.6% (−27.7 to −18.9%). At 29–35 weeks, SC reached its lowest difference compared to reference values, at −0.12 (−0.15 to −0.10) mg/dL and −15.5% (−19.4 to −13.0%), which then increased almost to non‐significance with a mean difference of −0.14 (−0.27 to −0.02) mg/dL and relative difference of −17.7% (−34.2 to −2.5%) at the end of pregnancy.
The meta‐regression analysis showed that there was no effect of gestational age on SC (P = 0.687) or of the type of reference measurement (pre‐pregnant vs non‐pregnant, P = 0.553; postpartum vs non‐pregnant, P = 0.641) or study quality (LQ vs HQ, P = 0.578; MQ vs HQ, P = 0.157). There was also no effect of the laboratory measurement method on the regression curve. Egger's regression test for funnel plot asymmetry was not statistically significant (0.108 < P < 0.919).
Studies with data on SC in pregnancies complicated by hypertension (Figure S6) reported measurements at 29–35 and 36–41 weeks' gestation. In contrast to uncomplicated pregnancies, there was no change in SC in women with a complicated pregnancy, as compared to non‐pregnant values. Mean difference (95% CI) was 0.15 (−0.03 to 0.32) mg/dL and relative difference (95% CI) was 21.2% (−4.2 to 45.2%) at 29–35 weeks' gestation, with −0.01 (−0.16 to 0.15) mg/dL and −1.4% (−23.2 to 21.7%) at 36–41 weeks. These values were, however, significantly different from those in uncomplicated pregnancy (P = 0.009).
Reference values for SC throughout physiological uncomplicated pregnancy are shown in Figure 4 and demonstrate a decrease during pregnancy until around 24 weeks' gestation, after which it increases almost back to non‐pregnant values. The upper range of the reference curve changes throughout gestation, but a cut‐off can be set at 0.75 mg/dL (66 µmol/L) based on the upper limit for the gestational age at which SC is at its highest during pregnancy. In Figures S7–S9, forest plots and reference curves for SC are available in µmol/L.
Figure 4.
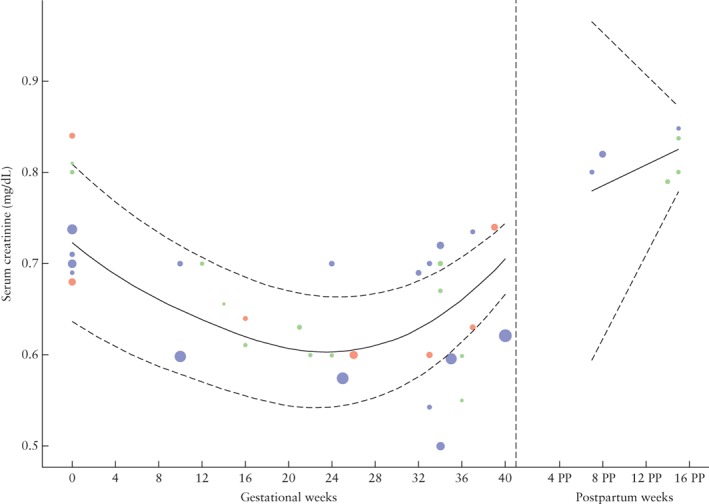
Serum creatinine during and after physiological pregnancy. Circle size indicates sample size of point estimate. Color refers to quality assigned to study: red, low quality; green, moderate quality; blue, high quality. Curve fit is weighted by inverse variance and plotted with 5th and 95th percentiles (dashed lines); 50th percentile is represented by solid line. PP, postpartum.
DISCUSSION
Kidney function, quantified by GFR measured either by inulin clearance or creatinine clearance, was increased during healthy uncomplicated pregnancy as compared with non‐pregnant values. The physiological change in kidney function was not observed in women with a gestational hypertensive disease. Interestingly, the GFR increase seemed slightly less than that reported previously39. We found the largest increase during pregnancy to be 40–50%, depending on the method of GFR measurement. SC values were decreased during healthy uncomplicated pregnancy as compared with non‐pregnant values. Although the upper limit of the reference curve changes throughout gestation, from a clinical perspective, SC above 0.75 mg/dL (66 µmol/L) should be considered abnormal at all gestational ages.
GFR can be measured by the renal clearance of different substances. The ideal marker is a solute that is non‐toxic, freely filtered and neither secreted nor reabsorbed by the kidney tubules. Despite the clinical importance of GFR, quantifying it is not without its difficulties. Multiple endogenous and exogenous filtration markers have been used to evaluate kidney function40. Inulin is the most commonly used exogenous marker and is considered the gold standard, while creatinine is the most clinically used endogenous marker. Measuring GFR through inulin has the disadvantages of being a time‐consuming and complex procedure. Infusion protocols that use dextrose may be valid but usually overestimate GFR values due to hyperglycemia. This may be particularly relevant during pregnancy as maternal insulin resistance increases glucose availability41. The use of extra volume by infusion of saline, which is sometimes done when measuring GFR with inulin, can also positively affect GFR due to volume expansion. Because of the disadvantages of inulin, creatinine has become widely accepted for measuring GFR, even though it is less accurate. It is usually measured in a 24‐h urine collection in combination with serum creatinine to assess creatinine clearance. Inaccuracy of creatinine clearance is caused predominantly by the necessity to collect complete 24‐h urine and the bioavailability of creatinine quantities fluctuating as a function of dietary intake and exercise induced muscle strain42, 43. The aggregated data used to build the GFR‐CC curve show large heterogeneity between studies, making it unfit to serve as a reference curve. Fitting curves using flexible regression techniques instead of a locally weighted curve, as we did to visualize reference ranges, could result in a better fit of all studies; it does, however, not result in a more reliable reference curve.
eGFR is calculated by SC using different formulae that can take several factors into account (weight, age and ethnicity). The more commonly used formulae are Cockcroft–Gault, Modification of Diet in Renal Disease and the more recent Chronic Kidney Disease Epidemiology Collaboration (CKD‐EPI), but they can vary in accuracy during pregnancy23, 25, 44. Noteworthy is that all of these formulae are based on large cohorts of non‐pregnant patients with at least mild renal insufficiency45, 46, 47.
Estimated GFR is used frequently in daily practice but our search did not identify enough studies to include in our meta‐analysis to be able to provide an estimated difference during pregnancy. eGFR should be calculated using the CKD‐EPI equation, the more reliable estimation outside of pregnancy48, before, during and after pregnancy in order to establish reference values relevant to clinicians in daily practice.
We found differences in GFR, both in inulin and creatinine clearance, between women with an uncomplicated pregnancy and those with a hypertensive complication in the second half of pregnancy; this is in agreement with the literature. The different changes in kidney function in pregnancies destined to be complicated by gestational hypertensive disease could not be investigated because there were not enough studies for each gestational age interval. When assuming comparable body composition and glucose metabolism, lower GFR and higher serum creatinine in gestational hypertensive pregnancy may originate from several mechanisms. First, hypertension results in an increase in arterial tone as a result of an excess of vasoconstrictor over vasodilator influences in the systemic circulation49, 50. Increased vascular tone in turn causes higher renal vascular resistance which is responsible for a decrease in blood flow through the kidneys, and therefore a decrease in GFR51. Morphological changes in the kidney caused by pre‐eclampsia, namely endotheliosis, can also result in decreased GFR. Second, it could be that some women, because of pre‐existing vulnerability (namely fewer nephrons), women with diabetes mellitus or those with immunological disorders are susceptible to damage to the kidneys and, as a result, a decrease in GFR. As measuring GFR‐IC during pregnancy is cumbersome and complex, GFR‐CC is considered to be clinically more appropriate to evaluate kidney function. However, SC seems a reliable and stable measure with a low margin of error when compared with GFR‐CC, which is also more discommodious for women. As SC is measured frequently during pregnancy, it is also a more practical parameter.
The following limitations of this study should be acknowledged. First, our meta‐analysis was based on a relatively limited number of studies, due mostly to the necessity of a non‐pregnant reference within the studied population sample. While this could have resulted in lower statistical power than if studies without reference samples had also been included, it is thought to increase validity because of the use of identical measurement techniques. Second, participant's anthropometric data were often reported incompletely, making it impossible to analyze the contribution of these variables to the heterogeneity observed. Third, methodological shortcomings within and disparities between studies resulted in limited data interpretation, which is reflected in our meta‐regression analysis that demonstrated a significant effect on the regression when study quality was taken into account. In MQ studies, GFR‐IC was on average 10 mL/min higher than in HQ studies and, average GFR‐CC was 22 mL/min lower compared to in HQ studies. A significant statistical association between GFR‐IC and type of reference measurement was also found. This association was not found for GFR‐CC and is possibly the effect of a single study that is relatively old and of a different methodological quality than other included articles33. Also, according to Egger, the capacity to ascertain publication bias is restricted when meta‐analysis consists solely of limited and/or small studies, both of which were the case in the current systematic review.
In conclusion, in healthy uncomplicated pregnancy, kidney function was increased throughout gestation, reflected by increased GFR, measured by either inulin or creatinine clearance, and a decrease in SC. In contrast, kidney function was decreased in hypertensive pregnancy.
Supporting information
Appendix S1 Full‐text articles excluded and reasons for exclusion
Figures S1 and S2 Forest plot of mean difference (MD) in glomerular filtration rate (GFR), measured by inulin clearance in mL/min, in physiological uncomplicated pregnancies (Figure S1) or hypertensive complicated pregnancies (Figure S2), as compared with non‐pregnant reference value, according to gestational age.
Figures S3 and S4 Forest plot of mean difference (MD) in glomerular filtration rate, measured by creatinine clearance, in mL/min, in physiological uncomplicated pregnancies (Figure S3) or hypertensive complicated pregnancies at 29–35 weeks of gestation (Figure S4), as compared with non‐pregnant reference value, according to gestational age.
Figures S5 and S6 Forest plot of mean difference (MD) in serum creatinine, in mg/dL in physiological uncomplicated pregnancies (Figure S5) or in hypertensive complicated pregnancies (Figure S6), as compared with non‐pregnant reference values, according to gestational age.
Figures S7 and S8 Forest plot of mean difference in serum creatinine, in µmol/L, in physiological pregnancies (Figure S7) or in hypertensive complicated pregnancies (Figure S8), as compared with non‐pregnant reference value, according to gestational age.
Figure S9 Serum creatinine, in µmol/L, during physiologic pregnancy. Circle size indicates the sample size of the point estimate. Color of shape refers to quality assigned to study: red, low quality study; green, moderate quality study; blue, high quality study. Curve fit is weighted by inverse variance and plotted with 5th and 95th percentiles. 50th percentile is represented by a solid line.
Table S1 Search strategy for PubMed (NCBI) and EMBASE (Ovid) databases
Table S2 Measurement methods used in studies reporting glomerular filtration rate measured by inulin clearance
Table S3 Measurement methods used in studies reporting glomerular filtration rate measured by creatinine clearance
Table S4 Measurement methods used in studies reporting serum creatinine
Table S5 Quality assessment of 29 included studies based on QUIPS criteria
REFERENCES
- 1. Bosio PM, McKenna PJ, Conroy R, O'Herlihy C. Maternal central hemodynamics in hypertensive disorders of pregnancy. Obstet Gynecol 1999; 94: 978–984. [DOI] [PubMed] [Google Scholar]
- 2. Morris NH, Eaton BM, Dekker G. Nitric oxide, the endothelium, pregnancy and pre‐eclampsia. Br J Obstet Gynaecol 1996; 103: 4–15. [DOI] [PubMed] [Google Scholar]
- 3. Conrad KP, Novak J, Danielson LA, Kerchner LJ, Jeyabalan A. Mechanisms of renal vasodilatation and hyperfiltration during pregnancy: current perspectives and potential implications for pre‐eclampsia. Endothelium 2005; 12: 57–62. [DOI] [PubMed] [Google Scholar]
- 4. Odutayo A, Hladunewich M. Obstetric nephrology: renal hemodynamic and metabolic physiology in normal pregnancy. Clin J Am Soc Nephrol 2012; 7: 2073–2080. [DOI] [PubMed] [Google Scholar]
- 5. Cheung KL, Lafayette RA. Renal physiology of pregnancy. Adv Chronic Kidney Dis 2013; 20: 209–214. [DOI] [PMC free article] [PubMed] [Google Scholar]
- 6. Davison JM, Dunlop W. Renal hemodynamics and tubular function in normal human pregnancy. Kidney Int 1980; 18: 152–161. [DOI] [PubMed] [Google Scholar]
- 7. Cornelis T, Odutayo A, Keunen J, Hladunewich M. The kidney in normal pregnancy and pre‐eclampsia. Semin Nephrol 2011; 31: 4–14. [DOI] [PubMed] [Google Scholar]
- 8. Lafayette RA, Druzin M, Dibley R, Derby G, Tahiramalik, Huie P, Pelhemus C, Deen WM, Myers BD. Nature of glomerular dysfunction in pre‐eclampsia. Kidney Int 1998; 54: 1240–1249. [DOI] [PubMed] [Google Scholar]
- 9. Irons DW, Baylis PH, Davison JM. Effect of atrial natriuretic peptide on renal hemodynamics and sodium excretion during human pregnancy. Am J Physiol 1996; 271: F239–242. [DOI] [PubMed] [Google Scholar]
- 10. Milne JE, Lindheimer MD, Davison JM. Glomerular heteroporous membrane modeling in third trimester and postpartum before and during amino acid infusion. Am J Physiol Renal Physiol 2002; 282: F170–175. [DOI] [PubMed] [Google Scholar]
- 11. Sturgiss SN, Wilkinson R, Davison JM. Renal reserve during human pregnancy. Am J Physiol 1996; 271: 16–20. [DOI] [PubMed] [Google Scholar]
- 12. Davison JM, Hytten FE. Glomerular filtration during and after pregnancy. Br J Obstet Gynaecol 1974; 81: 588–595. [DOI] [PubMed] [Google Scholar]
- 13. Chapman AB, Abraham WT, Zamudio S, Coffin C, Merouani A, Young D, Johnson A, Osorio F, Goldberg C, Moore LG, Dahms T, Schrier RW. Temporal relationships between hormonal and hemodynamic changes in early human pregnancy. Kidney Int 1998; 54: 2056–2063. [DOI] [PubMed] [Google Scholar]
- 14. Davison JM, MC. N. Serial changes in 24 hour creatinine clearance during normal menstrual cycles and the first trimester of pregnancy. Br J Obstet Gynaecol 1981; 88: 10–17. [DOI] [PubMed] [Google Scholar]
- 15. Hayden JA, Cartwright L. DAvdWJ, Cote P , Bombardier C. Assessing bias in studies of prognostic factors. Ann Intern Med 2013; 158: 280–286. [DOI] [PubMed] [Google Scholar]
- 16. Abudu OO, Sofola OA. Plasma volume in normal pregnant Nigerian primigravidae. Int J Gynaecol Obstet 1985; 23: 137–142. [DOI] [PubMed] [Google Scholar]
- 17. Higgins J, Green S. (eds). Cochrane Handbook for Systematic Reviews of Interventions Version 5.1.0 (updated March 2011). The Cochrane Collaboration, 2011. http://handbook.cochrane.org.
- 18. DerSimonian R, Laird N. Meta‐analysis in clinical trials. Control Clin Trials 1986; 7: 177–188. [DOI] [PubMed] [Google Scholar]
- 19. R Core Team . R: A language and environment for statistical computing. R Foundation for Statistical Computing, Vienna, Austria: 2015. https://www.R‐project.org/. [Google Scholar]
- 20. Schwarzer G. Meta: general package for meta‐analysis. R package version 4.3‐2, 2015.
- 21. Higgins J, Thompson SG, Deeks JJ, Altman DG. Measuring inconsistency in meta‐analyses. Br Med J 2003; 327: 557–560. [DOI] [PMC free article] [PubMed] [Google Scholar]
- 22. Egger M, Smith GD, Schneider M, Minder C. Bias in meta‐analysis detected by a simple, graphical test. Br Med J 1997; 316: 629–634. [DOI] [PMC free article] [PubMed] [Google Scholar]
- 23. Ahmed SB, Bentley‐Lewis R, Hollenberg NK, Graves SW, Seely EW. A comparison of prediction equations for estimating glomerular filtration rate in pregnancy. Hypertens Pregnancy 2009; 28: 243–255. [DOI] [PMC free article] [PubMed] [Google Scholar]
- 24. Platts JK, Meadows P, Jones R, Harvey JN. The relation between tissue kallikrein excretion rate, aldosterone and glomerular filtration rate in human pregnancy. BJOG 2000; 107: 278–281. [DOI] [PubMed] [Google Scholar]
- 25. Smith MC, Moran P, Ward MK, Davison JM. Assessment of glomerular filtration rate during pregnancy using the MDRD formula. BJOG 2008; 115: 109–112. [DOI] [PubMed] [Google Scholar]
- 26. Brandstetter F, Schuller E. [Studies on liver and kidney function in late toxemia]. Arch Gynakol 1955; 186: 189–192. [DOI] [PubMed] [Google Scholar]
- 27. de Alvarez RR. Glomerular filtration rates, renal plasma flow and sodium and water retention in pregnancy toxemia. Am J Obstet Gynecol 1950; 60: 1051–1067. [DOI] [PubMed] [Google Scholar]
- 28. Varga I, Rigó J, Somos P, Joó JG, B N. Analysis of maternal circulation and renal function in physiologic pregnancies; parallel examinations of the changes in the cardiac output and the glomerular filtration rate. J Matern Fetal Med 2000; 9: 97–104. [DOI] [PubMed] [Google Scholar]
- 29. Davison JM, Noble MCB. Serial changes in 24 hour creatinine clearance during normal menstrual cycles and the first trimester of pregnancy. Br J Obstet Gynaecol 1981; 88: 10–17. [DOI] [PubMed] [Google Scholar]
- 30. Kristensen K, Lindstrom V, Schmidt C, Blirup‐Jensen S, Grubb A, Wide‐Swensson D, Strevens H. Temporal changes of the plasma levels of cystatin C, beta‐trace protein, beta2‐microglobulin, urate and creatinine during pregnancy indicate continuous alterations in the renal filtration process. Scand J Clin Lab Invest 2007; 67: 612–618. [DOI] [PubMed] [Google Scholar]
- 31. Strevens H, Wide‐Swensson D, Torffvit O, Grubb A. Serum cystatin C for assessment of glomerular filtration rate in pregnant and non‐pregnant women. Indications of altered filtration process in pregnancy. Scand J Clin Lab Invest 2002; 62: 141–148. [DOI] [PubMed] [Google Scholar]
- 32. Barden A, Beilin LJ, Burke V, Ritchie J, Michael CA, Walters BN. Relationships between plasma endothelin 1 and prostacyclin in normal and preeclamptic pregnancy. Hypertens Pregnancy 1996; 15: 25–38. [Google Scholar]
- 33. Buttermann K. [Clearance studies in normal and pathological pregnancy, with a critical evaluation of the method]. Arch Gynakol 1958; 190: 448–492. [DOI] [PubMed] [Google Scholar]
- 34. Moran P, Baylis PH, Lindheimer MD, Davison JM. Glomerular ultrafiltration in normal and pre‐eclamptic pregnancy. J Am Soc Nephrol 2003; 14: 648–652. [DOI] [PubMed] [Google Scholar]
- 35. Schneider F, Lutun P, Baldauf J‐J, Quirin L, Dreyfus M, Ritter J, Tempe J‐D. Plasma cyclic GMP concentrations and their relationship with changes of blood pressure levels in pre‐eclampsia. Acta Obstet Gynecol Scand 1996; 75: 40–44. [DOI] [PubMed] [Google Scholar]
- 36. Vural P, Akgül C, Canbaz M. Urinary PGE2 and PGF2 levels and renal functions in pre‐eclampsia. Gynecol Obstet Invest 1998; 45: 237–241. [DOI] [PubMed] [Google Scholar]
- 37. Wang MX, Brown MA, Buddle ML, Carlton MA, Cario GM, Whitworth JA. Endothelin excretion in hypertensive pregnancy. Relationship to glomerular filtration rate, blood pressure, and sodium excretion. Am J Hypertens 1994; 7: 308–313. [DOI] [PubMed] [Google Scholar]
- 38. Yilmaz ZV, Akkas E, Yildirim T, Yilmaz R, Erdem Y. A novel marker in pregnant with pre‐eclampsia: renalase. J Matern Fetal Neonatal Med 2017; 30: 808–813. [Epub 2016 May 26]. [DOI] [PubMed] [Google Scholar]
- 39. Lindheimer MD, Davison JM, Katz AI. The kidney and hypertension in pregnancy: twenty exciting years. Semin Nephrol 2001; 21: 173–189. [DOI] [PubMed] [Google Scholar]
- 40. Lamb EJ, Stevens PE. Estimating and measuring glomerular filtration rate: methods of measurement and markers for estimation. Curr Opin Nephrol Hypertens 2014; 23: 258–266. [DOI] [PubMed] [Google Scholar]
- 41. Sonagra AD, Biradar SM, K D, Murthy DSJ. Normal pregnancy: a state of insulin resistance. J Clin Diagn Res 2014; 8: CC01–03. [DOI] [PMC free article] [PubMed] [Google Scholar]
- 42. Stevens LA, Levey AS. Measurement of kidney function. Med Clin North Am 2005; 89: 457–473. [DOI] [PubMed] [Google Scholar]
- 43. Stevens LA, Coresh J, Greene T, Levey AS. Assessing kidney function: measured and estimated glomerular filtration rate. N Engl J Med 2006; 354: 2473–2483. [DOI] [PubMed] [Google Scholar]
- 44. Koetje PM, Spaan JJ, Kooman JP, Spaanderman MEA, Peeters LLH. Pregnancy reduces the accuracy of the estimated glomerular filtration rate based on Cockroft‐Gault and MDRD formulas. Reprod Sci 2011; 18: 456–462. [DOI] [PubMed] [Google Scholar]
- 45. Levey AS, Stevens LA, Schmid CH, Zhang YL, Castro AF 3rd, Feldman HI, Kusek JW, Eggers P, Van Lente F, Greene T, Coresh J. A new equation to estimate glomerular filtration rate. Ann Intern Med 2009; 150: 604–612. [DOI] [PMC free article] [PubMed] [Google Scholar]
- 46. Levey AS, Bosch JP, Lewis JB, Greene T, Rogers N, Roth D. A more accurate method to estimate glomerular filtration rate from serum creatinine: a new prediction equation. Ann Intern Med 1999; 130: 461–470. [DOI] [PubMed] [Google Scholar]
- 47. Cockcroft DW, Gault MH. Prediction of creatinine clearance from serum creatinine. Nephron 1976; 16: 31–41. [DOI] [PubMed] [Google Scholar]
- 48. Inker LA, Shaffi K, Levey AS. Estimating glomerular filtration rate using the chronic kidney disease‐epidemiology collaboration creatinine equation: better risk predictions. Circ Heart Fail 2012; 5: 303–306. [DOI] [PMC free article] [PubMed] [Google Scholar]
- 49. Thadhani RI, Maynard SE. Renal and urinary tract physiology in normal pregnancy. Glassock RJ, Sterns RH, Eckler K. (eds). 2016. https://www.uptodate.com/contents/maternal‐adaptations‐to‐pregnancy‐renal‐and‐urinary‐tract‐physiology. [Google Scholar]
- 50. Lafayette R. The kidney in pre‐eclampsia. Kidney Int 2005; 67: 1194–1203. [DOI] [PubMed] [Google Scholar]
- 51. Karumanchi SA, Maynard SE, Stillman IE, Epstein FH, Sukhatme VP. Pre‐eclampsia: a renal perspective. Kidney Int 2005; 67: 2101–2113. [DOI] [PubMed] [Google Scholar]
- 52. Abdul‐Karim RW, Harris JE, Beydoun SN, Cuenca VG. Endogenous creatinine clearance during pregnancy. II. Variations in normal standards based on methodology. Obstet Gynecol 1978; 51: 431–432. [PubMed] [Google Scholar]
- 53. Akram M, Akhtar MS, Waqar N. Glomerular filtration rate and levels of serum and urinary proteins in nonpregnant, pregnant and post puerperal Pakistani women. J Pak Med Assoc 1982; 32: 257–262. [PubMed] [Google Scholar]
- 54. Barron WM, Lindheimer MD. Effect of oral protein loading on renal hemodynamics in human pregnancy. Am J Physiol 1995; 369: 888–895. [DOI] [PubMed] [Google Scholar]
- 55. Davison JM, Dunlop W, Ezimokhai M. 24‐h creatinine clearance during the third trimester of normal pregnancy. Br J Obstet Gynaecol 1980; 87: 106–109. [DOI] [PubMed] [Google Scholar]
- 56. Dunlop W. Investigations into the influence of posture on renal plasma flow during late pregnancy. Br J Obstet Gynaecol 1975; 82: 588–590. [PubMed] [Google Scholar]
- 57. Dunlop W. Serial changes in renal haemodynamics during normal human pregnancy. Br J Obstet Gynaecol 1981; 88: 1–9. [DOI] [PubMed] [Google Scholar]
- 58. Gibson HM. Plasma volume and glomerular filtration rate in pregnancy and their relation to differences in fetal growth. Br J Obstet Gynaecol 1973; 80: 1067–1074. [DOI] [PubMed] [Google Scholar]
- 59. Lohsiriwat S, Imrittha N. Effect of posture on creatinine clearance in late pregnancy and after pregnancy. J Obstet Gynaecol Res 2008; 34: 337–342. [DOI] [PubMed] [Google Scholar]
- 60. Mozdzien G, Schinninger M, Zazgornik J. (Kidney function and electrolyte metabolism in healthy pregnant women). Wien Med Wochenschr 1995; 145: 12–17. [PubMed] [Google Scholar]
- 61. Roberts M, Lindheumer MD, Davison JM. Altered glomerular permselectivity to neutral dextrans and heteroporous membrane modeling in human pregnancy. Am J Physiol 1996; 270: F338–343. [DOI] [PubMed] [Google Scholar]
- 62. Saxena AR, Ananth Karumanchi S, Fan SL, Horowitz GL, Hollenberg NK, Graves SW, Seely EW. Correlation of cystatin‐C with glomerular filtration rate by inulin clearance in pregnancy. Hypertens Pregnancy 2012; 31: 22–30. [DOI] [PMC free article] [PubMed] [Google Scholar]
- 63. Wright A, Steele P, Bennett JR, Watts G, Polak A. The urinary excretion of albumin in normal pregnancy. Br J Obstet Gynaecol 1987; 94: 408–442. [DOI] [PubMed] [Google Scholar]
Associated Data
This section collects any data citations, data availability statements, or supplementary materials included in this article.
Supplementary Materials
Appendix S1 Full‐text articles excluded and reasons for exclusion
Figures S1 and S2 Forest plot of mean difference (MD) in glomerular filtration rate (GFR), measured by inulin clearance in mL/min, in physiological uncomplicated pregnancies (Figure S1) or hypertensive complicated pregnancies (Figure S2), as compared with non‐pregnant reference value, according to gestational age.
Figures S3 and S4 Forest plot of mean difference (MD) in glomerular filtration rate, measured by creatinine clearance, in mL/min, in physiological uncomplicated pregnancies (Figure S3) or hypertensive complicated pregnancies at 29–35 weeks of gestation (Figure S4), as compared with non‐pregnant reference value, according to gestational age.
Figures S5 and S6 Forest plot of mean difference (MD) in serum creatinine, in mg/dL in physiological uncomplicated pregnancies (Figure S5) or in hypertensive complicated pregnancies (Figure S6), as compared with non‐pregnant reference values, according to gestational age.
Figures S7 and S8 Forest plot of mean difference in serum creatinine, in µmol/L, in physiological pregnancies (Figure S7) or in hypertensive complicated pregnancies (Figure S8), as compared with non‐pregnant reference value, according to gestational age.
Figure S9 Serum creatinine, in µmol/L, during physiologic pregnancy. Circle size indicates the sample size of the point estimate. Color of shape refers to quality assigned to study: red, low quality study; green, moderate quality study; blue, high quality study. Curve fit is weighted by inverse variance and plotted with 5th and 95th percentiles. 50th percentile is represented by a solid line.
Table S1 Search strategy for PubMed (NCBI) and EMBASE (Ovid) databases
Table S2 Measurement methods used in studies reporting glomerular filtration rate measured by inulin clearance
Table S3 Measurement methods used in studies reporting glomerular filtration rate measured by creatinine clearance
Table S4 Measurement methods used in studies reporting serum creatinine
Table S5 Quality assessment of 29 included studies based on QUIPS criteria