

Abstract
Objective
Aging is the highest risk factor for Parkinson disease (PD). Under physiological conditions, spermidine and spermine experimentally enhance longevity via autophagy induction. Accordingly, we evaluated the ability of each polyamine metabolite to act as an age‐related, diagnostic, and severity‐associated PD biomarker.
Methods
Comprehensive metabolome analysis of plasma was performed in Cohort A (controls, n = 45; PD, n = 145), followed by analysis of 7 polyamine metabolites in Cohort B (controls, n = 49; PD, n = 186; progressive supranuclear palsy, n = 19; Alzheimer disease, n = 23). Furthermore, 20 patients with PD who were successively examined within Cohort B were studied using diffusion tensor imaging (DTI). Association of each polyamine metabolite with disease severity was assessed according to Hoehn and Yahr stage (H&Y) and Unified Parkinson's Disease Rating Scale motor section (UPDRS‐III). Additionally, the autophagy induction ability of each polyamine metabolite was examined in vitro in various cell lines.
Results
In Cohort A, N8‐acetylspermidine and N‐acetylputrescine levels were significantly and mildly elevated in PD, respectively. In Cohort B, spermine levels and spermine/spermidine ratio were significantly reduced in PD, concomitant with hyperacetylation. Furthermore, N1,N8‐diacetylspermidine levels had the highest diagnostic value, and correlated with H&Y, UPDRS‐III, and axonal degeneration quantified by DTI. The spermine/spermidine ratio in controls declined with age, but was consistently suppressed in PD. Among polyamine metabolites, spermine was the strongest autophagy inducer, especially in SH‐SY5Y cells. No significant genetic variations in 5 genes encoding enzymes associated with spermine/spermidine metabolism were detected compared with controls.
Interpretation
Spermine synthesis and N1,N8‐diacetylspermidine may respectively be useful diagnostic and severity‐associated biomarkers for PD. ANN NEUROL 2019;86:251–263
Aging is the major risk factor for many chronic disorders, including diabetes mellitus, cancer, cardiovascular diseases, and neurodegenerative diseases including Parkinson disease (PD), whose current treatment is limited to symptomatic relief.1, 2, 3 Because PD prevalence increases with age, the number of PD patients is estimated to double from 6.9 million in 2015 to 14.2 million in 2040.4 Although age‐related molecular mechanisms of PD (eg, dopamine metabolism, iron accumulation, mitochondrial DNA changes, and decreased protein‐degradation efficiency) have been proposed,5 no corresponding blood biomarkers have been validated for widespread clinical use. Blood‐based biomarkers associated with aging‐related risk for PD would enable efficient monitoring of the disease process and could be used for development of therapies.
Polyamines are ubiquitous small polycations that ionically bind to various negatively charged molecules and have many functions, mostly linked to cell growth, survival, and proliferation.6 Prime examples of polyamines are putrescine, spermidine (Spd) and spermine (Spm), whose levels are strictly controlled. Putrescine is sequentially converted into Spd and Spm by S‐adenosyl‐L‐methionine decarboxylase and Spd/Spm synthase. Consecutively, Spd is converted to Spm by Spm synthase, and vice versa by Spm oxidase (Fig 1). N1‐acetylspermine (N1‐AcSpm) and N1‐acetylspermidine (N1‐AcSpd) are synthesized by the transfer of an acetyl group from acetyl‐coenzyme A to the N1‐position of either Spd or Spm, respectively, which is catalyzed by Spd/Spm acetyltransferase 1 or 2 (SAT1/2). In addition, N8‐acetylspermidine (N8‐AcSpd), N1,N8‐diacetylspermidine (DiAcSpd), and N1,N12‐diacetylspermine (DiAcSpm) are produced by acetylation of Spd, N1‐AcSpd, N8‐AcSpd, and N1‐AcSpm, respectively.7
Figure 1.
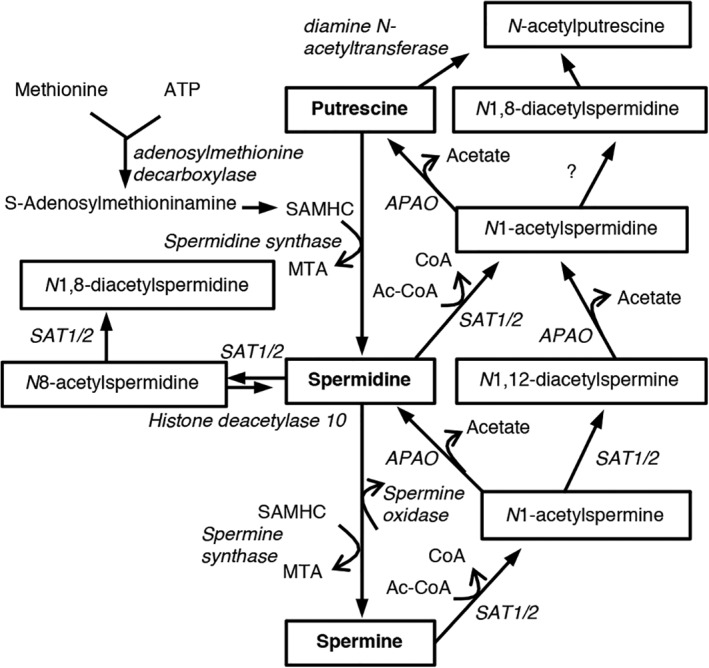
Polyamine metabolism in humans. Schematic shows polyamines (putrescine, spermidine, and spermine), and their acetylated metabolites and converting enzymes. Ac‐CoA = acetyl‐coenzyme A; APAO = N1‐acetylpolyamine oxidase; ATP = adenosine triphosphate; CoA = coenzyme A; MTA = 5′‐deoxy‐5′‐methylthioadenosine; SAMHC = S‐adenosylmethyl homocysteamine; SAT1/2 = spermidine/spermine acetyltransferase 1/2.
Spd and Spm have been shown to increase the lifespan of different species and improve neural functions via enhancement of autophagy in Caenorhabditis elegans, Drosophila, and mice.6, 8 Autophagy is an evolutionarily conserved lysosomal degradation pathway associated with the pathogenesis of aging‐related neurodegeneration as it loses efficiency in aging organisms.2, 6
Human whole blood concentrations of Spd and Spm are kept strictly within the 4 to 40μM range.9, 10, 11 Levels of Spd and Spm are lower in 60‐ to 80‐year‐olds than in 31‐ to 56‐year‐olds.12 In the rat cerebral cortex and human basal ganglia, the levels of Spd and Spm decrease with age.13 Although it is not fully understood how brain polyamine levels are associated with levels in peripheral blood, levels in both the brain and blood decrease with age. In PD patients, levels of putrescine and N1‐AcSpd significantly increase in cerebrospinal fluid (CSF), whereas concentration of Spd is reduced.14 In addition, serum N8‐AcSpd levels are increased in PD patients with a malignant phenotype.15 Based on partial polyamine data in PD using a previously reported cohort,16 we investigated polyamine metabolic changes in a novel PD cohort by comparing tauopathies, specifically, progressive supranuclear palsy (PSP) and Alzheimer disease (AD) as disease controls.
Subjects and Methods
Ethics Statement
This study protocol complied with the Declaration of Helsinki and was approved by the ethics committee of Juntendo University (#2012157). Written informed consent was obtained from all participants.
Participants
All participants were recruited at the Juntendo University Hospital and examined by board‐certified neurologists. Cohort A (previously reported as “2nd cohort” in our report16) and Cohort B were independently recruited from December 2014 to February 2015 and from December 2016 to January 2017, respectively. PD, PSP, and AD were diagnosed according to the well‐established criteria for each disease.17, 18, 19 We excluded PD patients with possible dementia (Mini‐Mental State Examination score < 24) to avoid substantial overlap between PD with possible dementia and AD. Neither patients nor controls had a history of tumors, cancer, aspiration pneumonia, or inflammatory diseases including collagen vascular diseases. Participants suffering from acute infectious diseases or acute/chronic renal or hepatic failure at the time of sample collection were also excluded. Disease duration means the time since initial motor symptoms of PD. Hoehn and Yahr stages (H&Y) and Unified Parkinson's Disease Rating Scale motor section (UPDRS‐III) scores were defined during the “on phase” for practical and ethical reasons. UPDRS‐III score in Cohort B may be at a lower level because of the preserved general physical status without any critical illness. L‐dopa equivalent dose (LED) was calculated based on a previous report.20
Sample Collection
Sample collection was performed from December 2014 to February 2015 and from December 2016 to January 2017 for Cohorts A and B, respectively. Plasma and serum were extracted as described previously.16 Each 500μl of plasma or serum aliquot was stored in a −80°C freezer until use. Sample preparation followed by immediate mass spectrometry analysis of Cohorts A and B were performed in February 2015 and April 2017, respectively.
Sample Preparation
Polyamine metabolites were extracted as described previously.21 Briefly, 200μl of serum was immediately added to 200μl of 10% trichloroacetic acid containing 10pmol of N1‐AcSpd–d6 (Toronto Research Chemical, Toronto, Ontario, Canada) as an internal standard. The solution was centrifuged at 15,000 rpm for 15 minutes at 4°C, and the upper aqueous layer was collected. The sample was dissolved in 50μl of Milli‐Q water after lyophilizing, and 10μl was used for liquid chromatography–mass spectrometry (LC‐MS). The concentration of each compound was estimated by its peak area of selected reaction monitoring (SRM) relative to that of the internal standard (N1‐AcSpd‐d6).
Metabolome Analysis
Capillary Electrophoresis Time‐of‐Flight MS and LC Time‐of‐Flight MS
Using capillary electrophoresis time‐of‐flight MS and LC time‐of‐flight MS with Advanced Scan Plus (Human Metabolome Technologies, Yamagata, Japan), comprehensive metabolome analysis was conducted based on methods described previously.16
LC‐MS of Detailed Polyamine Metabolites
Spd, Spm, and their acetylated metabolites were separated by high‐performance LC (HPLC; Gilson, Middleton, WI) using a Develosil ODS UG3 column (150 × 2.0mm, 3μm particle; Nomura Chemical Co, Aichi, Japan). LC conditions were modified from a method reported previously.22 Briefly, we used 0.1% HCOOH/0.05% heptafluorobutyric acid (HFBA)/H2O as mobile phase A and 0.1% HCOOH/0.05% HFBA/80% acetonitrile as mobile phase B, with a flow rate of 150μl/min. The HPLC system was connected to a TSQ Quantum Ultra AM mass spectrometer (Thermo Fisher Scientific, Waltham, MA). Target compounds were analyzed in the SRM positive‐ionization mode.
Diffusion Tensor Imaging
Diffusion tensor images were acquired from 20 PD patients successively examined (3.06 ± 0.822 months after blood sampling) within Cohort B on a 3.0T system (Achieva; Philips Healthcare, Best, the Netherlands) with an 8‐channel phased‐array head coil for sensitivity encoding parallel imaging. Whole brain images were obtained using spin‐echo echo planar imaging (EPI) with (1) 32 uniformly distributed direction diffusion‐encoding (b = 1,000 s/mm2 for each direction), and (2) no diffusion weighting (b = 0 s/mm2) in an anterior–posterior phase‐encoding direction. Standard‐ and reverse‐phase encoded blipped images with no diffusion weighting were also acquired to correct for magnetic susceptibility‐induced distortions related to EPI acquisitions.23 The scanning parameters were repetition time = 9,810 milliseconds, echo time = 100 milliseconds, field of view = 256 × 256mm, matrix size = 128 × 128, slice thickness = 2mm, number of slices = 75, orientation = axial, and scanning time = 6.50 minutes. Diffusion tensor imaging (DTI) datasets were checked visually in all 3 orthogonal views. No dataset had severe artifacts related to gross geometric distortions, bulk motion, or signal dropout. Data were corrected for susceptibility‐induced geometric distortions, eddy current distortions, and intervolume subject motion using the EDDY and TOPUP toolboxes.23 Tensors were computed at each voxel by fitting a tensor model to diffusion‐weighted images with b = 0 and 1,000 s/mm2. Once the tensor was estimated, fractional anisotropy (FA), mean diffusivity (MD), axial diffusivity (AD), and radial diffusivity (RD) were estimated based on standard formulae.24
DTI Image Processing Using Tract‐Based Spatial Statistics Analysis
Whole‐brain voxelwise analysis of all diffusion tensor–derived measurements was performed using tract‐based spatial statistics (TBSS) implemented with FMRIB Software Library 5.0.9 (FSL, Oxford Centre for Functional MRI of the Brain, Oxford, UK; www.fmrib.ox.ac.uk/fsl).25 Briefly, FA images of all subjects were registered into FMRIB58_FA standard‐space images with the nonlinear registration tool FNIRT, followed by visual inspection to ensure registration quality. Then, mean FA images were created by averaging registered FA images. Furthermore, mean FA images were thinned to generate a mean FA skeleton representing the centers of all tracts of groups. Aligned FA images from each subject were projected onto the mean FA skeleton using a lower threshold of FA = 0.2 to exclude peripheral tracts and gray matter. By applying the original nonlinear registration warping field of each subject's FA to the standard space, MD, AD, and RD were also projected onto the mean FA skeleton. Furthermore, MD, AD, and RD data were also used to calculate voxelwise statistics. Anatomical locations of regions with significant correlations in the white‐matter skeleton were identified by the Johns Hopkins University DTI white matter atlas within FSL.26 In addition, average diffusion metrics of clusters that showed significant correlation by TBSS analysis were measured.
Genomic DNA Analysis
DNA was extracted from peripheral blood using a Qiagen Kit (Qiagen, Venlo, the Netherlands). To rule out the possibility that Spd and/or Spm metabolism is changed by SAT2 or histone deacetylase 10 (HDAC10),27, 28 genetic screening of SAT1, SAT2, and HDAC10 were performed. Eighteen single‐nucleotide variants (SNVs) present in >1% of the Japanese population were chosen based on the Integrative Japanese Genome Variation Database (iJGVD). Of these, 16 SNVs (rs13894, rs858521, rs858520, and rs139435483 of the SAT2 gene; rs75596977, rs5771271, rs76578729, rs77096954, rs4838866, rs35820251, rs41283469, rs738334, rs1555048, rs150016700, rs77003572, and rs76662439 of the HDAC10 gene) were examined using the QuantStudio 7 Flex Real‐Time PCR System (Thermo Fisher Scientific) with TaqMan genotyping assays (Thermo Fisher Scientific). The final volume was 10μl, consisting of 5μl TaqMan GTXpress Master Mix, 0.5μl TaqMan genotyping assay, 2.5μl nuclease‐free water, and 2μl genomic DNA in each well of a 96‐well plate. Real‐time polymerase chain reaction (PCR) steps included an initial enzyme activation step at 95°C for 20 seconds, followed by 40 cycles of a denaturation step at 95°C for 1 second and an annealing/extension step at 60°C for 3 seconds. The other SNVs (rs11553697 and rs2294404 of the HDAC10 gene29) and all cording exons and exon‐intron boundaries of SAT1, spermine synthase (SMS), and spermine oxidase (SMOX) genes were sequenced using the Sanger method with BigDye Terminators v3.1 Cycle Sequencing Kit and 3130 Genetic Analyzer (Life Technologies, Foster City, CA) PCR, and sequencing primers were designed by Primer 3. Frequencies of analyzed SNVs were referred to gnomAD (https://gnomad.broadinstitute.org/) and compared with iJGVD for the Japanese population (https://ijgvd.megabank.tohoku.ac.jp). Pathogenicity of identified missense variants was determined using the sorting‐intolerant‐from‐tolerant method.30 Frequencies of each variant were evaluated using the Exome Aggregation Consortium database (http://exac.broadinstitute.org/).
Materials
Spd, Spm, N1‐AcSpd, N8‐AcSpd, putrescine, and bafilomycin A1 were purchased from Sigma‐Aldrich (St Louis, MO). N1‐AcSpm, DiAcSpm, and DiAcSpd were purchased from Wako Pure Chemical Industries (Osaka, Japan).
Cell Culture
Human neuroblastoma SH‐SY5Y cells were cultured in Dulbecco modified Eagle medium (DMEM) medium supplemented with 10% fetal bovine serum (FBS), 100U/ml penicillin/streptomycin (Nakarai Tesque, Kyoto, Japan), MEM Non‐Essential Amino Acids Solution (Thermo Fisher Scientific), 1mM sodium pyruvate, and 2mM L‐glutamine, at 37°C in 5% CO2 and 95% atmospheric air. Human adenocarcinoma HeLa cells, human colon cancer LoVo cells, human hepatocyte carcinoma HepG2 cells, and human embryo kidney HEK293T cells were cultured in DMEM supplemented with 10% FBS and 100U/ml penicillin/streptomycin. Human umbilical vein endothelial cells were cultured in HuMedia‐EG2 (Kurabo, Osaka, Japan), and human osteosarcoma U2OS cells were cultured in McCoy's 5A (Modified) Medium (Thermo Fisher Scientific) supplemented with 10% FBS and 100U/ml penicillin/streptomycin.
Western Blotting
Western blot analysis was performed as previously described,31 with slight modifications. Cells were lysed in buffer (25mM Tris‐HCl pH 7.6, 150 mM NaCl, 1% NP‐40, 1% sodium deoxycholate, 0.1% sodium dodecyl sulfate [SDS], and protease inhibitor cocktail) for 15 minutes on ice and centrifuged at 15,000 rpm for 15 minutes to yield soluble cell lysates. For immunoblotting, 20μg of cell lysate proteins were subjected to 10 to 20% gradient SDS–polyacrylamide gel electrophoresis. Proteins were transferred onto polyvinylidene fluoride membranes and probed with specific antibodies. This was followed by detection using West Dura Extended Duration Substrate (Thermo Fisher Scientific) and the LAS‐4000 Mini (GE Healthcare UK, Little Chalfont, UK). The primary antibodies used were anti–microtubule‐associated protein light chain 3 (LC3B; Cell Signaling Technology, Danvers, MA), and anti–β‐actin (EMD Millipore Co, Billerica, MA).
Statistical Analysis
When a value was below the limit of detection, it was assigned half the minimum value of its compound. Wilcoxon tests were used to compare all individual analyses between controls and PD patients. Steel test is a nonparametric, multiple‐comparison test, and was used to compare patients stratified by H&Y (I, II, III, and IV) and controls, or by PD, de novo PD, PSP, or AD and controls. Receiver operating characteristic (ROC) curve analysis was performed using JMP13 (SAS Institute, Tokyo, Japan). Optimal cutoff values and area under the curve (AUC) were calculated using Youden index maxima (sensitivity + specificity − 1).32 Pearson correlation coefficients were used to examine relationships between serum metabolite levels and LED or UPDRS‐III in PD using JMP13. Conditional logistic regression analyses were used to calculate odds ratios and 95% confidence intervals for allelic and genotypic correlations with PD risk. Allele frequencies were analyzed with Pearson chi‐squared test. Probability of p < 0.05 was considered statistically significant.
The Randomize tool (https://fsl.fmrib.ox.ac.uk/fsl/fslwiki/Randomise) was used to examine relationships between diffusion metrics and blood metabolites (DiAcSpd, N8‐AcSpd, DiAcSpm, and Spm/Spd ratio) by multiple linear regression analysis. A general linear model was created for analysis of covariance (ANCOVA), with age and LED as nuisance covariates to adjust for their potential confounding influence on DTI measurements. To avoid selection of an arbitrary cluster‐forming threshold, the threshold free cluster enhancement option was used in Randomize. In total, 5,000 permutations were generated to provide an empirical null distribution of maximal cluster size.33 For free water elimination, p < 0.05 was considered significant for TBSS. In addition, mean diffusion tensor–derived measurements of significant clusters were correlated with blood metabolites using Spearman rank correlation test, with significance defined at p < 0.05.
Results
Two Acetylation Forms, N8‐AcSpd and N‐Acetylputrescine, Correlated with PD Severity in Cohort A
Comprehensive metabolome analysis using Cohort A (named “2nd cohort” in our previous report16) showed elevated N8‐AcSpd (ratio of PD to control = 1.44, p = 0.0036) and N‐acetylputrescine (N‐AcPut; ratio of PD to control = 1.20, p = 0.126) in PD relative to healthy controls. Levels of the other polyamine metabolites were below the detection limit.16 Both N8‐AcSpd and N‐AcPut positively correlated with H&Y (N8‐AcSpd, p < 0.0001; N‐AcPut, p = 0.0002), UPDRS‐III (N8‐AcSpd, p < 0.0001; N‐AcPut, p = 0.0002), age at sampling (hereafter simply referred to as “age”; N8‐AcSpd, p = 0.0007; N‐AcPut, p < 0.0001), and LED (N8‐AcSpd, p = 0.0018; N‐AcPut, p < 0.0001). Age and LED strongly correlated with H&Y (age, p = 0.0053; LED, p < 0.0001). Thus, to exclude interactions of LED or age with both acetylated polyamines, we performed multiple regression analyses and found that N8‐AcSpd significantly correlated with H&Y (LED, p < 0.0001) and mildly with UPDRS‐III (LED, p = 0.0517). Meanwhile, N‐AcPut mildly correlated with H&Y (LED, p = 0.0667) and UPDRS‐III (LED, p = 0.0932). However, N8‐AcSpd and N‐AcPut significantly correlated with H&Y (age, p < 0.0001 and p = 0.0036, respectively) and UPDRS‐III (age, p = 0.0004 and p = 0.0042, respectively).
DiAcSpd Correlates with Severity of PD
Further exploration of polyamine metabolic changes in PD incorporated a larger validation cohort (Cohort B), including tauopathy disease controls (PSP and AD; Table 1, Cohort B). In Cohort B, we performed serum analysis, as it enabled us to perform more sensitive analysis of Spm and Spd with similar sensitivity to their acetylated forms compared with plasma analysis (data not shown). As expected, most acetylated polyamine forms were significantly elevated in PD (Table 2). Importantly, Spd was significantly higher in PD than controls, whereas Spm was significantly lower in PD. A similar tendency in levels of each polyamine metabolite was also detected in 4 de novo PD patients.
Table 1.
Demographic Characteristics of Participants in Both Cohorts
| Characteristic | Cohort A | Cohort B | p (control vs PD)a | De Novo PD | PSP | AD | ||
|---|---|---|---|---|---|---|---|---|
| Control | PD | Control | PD | |||||
| n | 45 | 145 | 49 | 186 | — | 4 | 19 | 23 |
| Sex, M:F | 23:22 | 70:75 | 24:25 | 80:106 | 0.455b | 1:3 | 13:6 | 7:16 |
| Age, mean yr (SD) | 63.8 (15.3) | 67.5 (10.2) | 63.0 (14.7) | 67.6 (9.56) | 0.105 | 68.5 (5.45) | 71.0 (6.86) | 75.2 (8.96) |
| Duration, mean yr (SD)c | — | 7.04 (5.61) | — | 7.27 (5.36) | — | 1.75 (0.957) | 4.89 (2.26) | 3.61 (2.21) |
| H&Y stage, mean (SD) | — | 2.09 (0.897) | — | 2.05 (0.907) | — | 2.00 (0.00) | 3.76 (1.15) | — |
| H&Y stage (cases, n) | — | I (41), II (60), III (35), IV (8), V (1) | — | 0 (1), I (54), II (81), III (35), IV (15), V (0) | — | II (4) | I (1), II (2), III (3), IV (9), V (4) | — |
| UPDRS‐III, mean (range) | — | 14.8 (1–57) | — | 13.5 (0–54) | — | 10.0 (8–12) | — | — |
| MMSE, mean (SD) | 28.9 (2.09) | 27.8 (3.14) | 28.8 (2.24) | 27.8 (3.10) | 0.021 | 27.0 (0.00) | 20.3 (9.54) | 18.2 (6.45) |
| BMI, mean kg/m2 (SD) | 23.2 (3.59) | 22.4 (3.29) | 23.2 (3.69) | 22.6 (3.37) | 0.184 | 21.1 (0.518) | — | — |
| L‐dopa, mg | — | 386 (214) | — | 399 (239) | — | 0 | 371 (302) | — |
| L‐dopa, equivalent dose | — | 618 (342) | — | 606 (357) | — | 0 | 494 (343) | — |
Cohort A corresponds to 2nd cohort in our previous report.16
Probability values obtained by Wilcoxon test between controls and PD within Cohort B.
Probability value obtained by chi‐squared test between controls and PD within Cohort B.
Duration was defined as time since onset of initial motor symptoms.
AD = Alzheimer disease; BMI = body mass index; F = female; H&Y = Hoehn and Yahr stage; M = male; MMSE = Mini‐Mental State Examination; PD = Parkinson disease; PSP = progressive supranuclear palsy; SD = standard deviation; UPDRS‐III = Unified Parkinson's Disease Rating Scale motor section.
Table 2.
Polyamine Metabolites in Cohort B Patients
| Compound Name | Comparative Analysis | |||||||
|---|---|---|---|---|---|---|---|---|
| PD/Control | De Novo PD/Control | PSP/Control | AD/Control | |||||
| Ratio | p | Ratio | p | Ratio | p | Ratio | p | |
| DiAcSpd | 2.77 | <0.0001 | 1.95 | 0.134 | 1.93 | <0.0001 | 1.51 | 0.0811 |
| N1‐AcSpd | 1.46 | <0.0001 | 0.850 | 0.661 | 1.74 | 0.0002 | 1.11 | 0.237 |
| N8‐AcSpd | 1.55 | <0.0001 | 1.09 | 0.968 | 1.89 | <0.0001 | 1.53 | 0.0006 |
| DiAcSpm | 1.59 | <0.0001 | 0.892 | 1.00 | 1.65 | 0.0001 | 2.11 | 0.0763 |
| Spd | 1.80 | <0.0001 | 1.57 | 0.0764 | 1.05 | 1.00 | 1.02 | 0.886 |
| N1‐AcSpm | 0.945 | 0.302 | 0.770 | 0.404 | 1.43 | 0.0012 | 1.05 | 0.999 |
| Spm | 0.762 | 0.0468 | 0.776 | 0.951 | 1.21 | 0.223 | 0.563 | 0.0013 |
| Spm/Spd ratio | 0.459 | <0.0001 | 0.515 | 0.106 | 1.43 | 0.154 | 0.544 | <0.0001 |
Probability values were obtained by Steel test between healthy controls and each disease.
AD = Alzheimer disease; DiAcSpd = N1,N8‐diacetylspermidine; DiAcSpm = N1,N12‐diacetylspermine; N1‐AcSpd = N1‐acetylspermidine; N1‐AcSpm = N1‐acetylspermine; N8‐AcSpd = N8‐acetylspermidine; PD = Parkinson disease; PSP = progressive supranuclear palsy; Spd = spermidine; Spm = spermine.
As shown in Figure 2A–G, DiAcSpd, N8‐AcSpd, and DiAcSpm positively correlated with H&Y, UPDRS‐III (DiAcSpd, p = 0.0023; N8‐AcSpd, p = 0.0046; DiAcSpm, p = 0.0103), and LED (DiAcSpd, p = 0.0043; N8‐AcSpd, p = 0.0029; DiAcSpm, p = 0.00223). ROC curve analysis with these 7 metabolites showed a high diagnostic value (see Fig 2H) similar to DiAcSpd (AUC = 0.946, cutoff value = 0.821). Furthermore, these polyamine metabolites had robust diagnostic power for differentiating PD from PSP (AUC = 0.931, cutoff value = 0.805) and AD (AUC = 0.938, cutoff value = 0.801). As in Cohort A, age, disease duration and LED positively correlated with H&Y stage (age, p < 0.0001; disease duration, p < 0.0001; LED, p < 0.0001); therefore, logistic regression and multiple regression analyses were performed to exclude their influence for accurate assessment of the relationship between acetylated polyamines and disease severity. Positive correlations of disease severity with DiAcSpd were detected under normalization of both LED (Table 3) and age (Table 4). Likewise, ANCOVA showed that the levels of 3 acetylated polyamines were significantly elevated in association with age in PD relative to controls (DiAcSpd, p = 0.0056; N8‐AcSpd, p = 0.0468; DiAcSpm, p = 0.0018), which was partially consistent with a previous report.12
Figure 2.
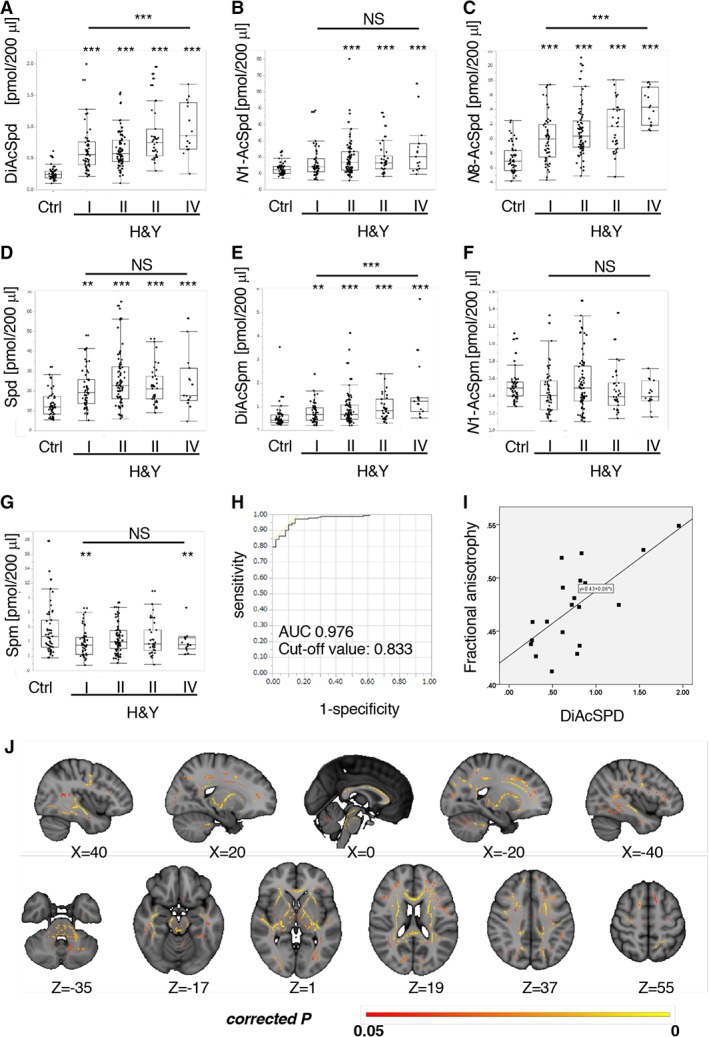
Acetylated spermidine (Spd)/spermine (Spm) positively correlates with Parkinson disease severity. (A–F) Levels of N1,N8‐diacetylspermidine (DiAcSpd), N8‐acetylspermidine (N8‐AcSpd), and N1,N12‐diacetylspermine (DiAcSpm) positively correlated with Parkinson disease severity assessed by Hoehn and Yahr stages (H&Y), whereas other polyamine metabolites did not. Values indicate the amount of each metabolite (pmol) in 200μl serum. (G) Levels of Spm were significantly decreased in Parkinson disease, at H&Y stages I and IV. Values indicate the amount of each metabolite (pmol) in 200μl serum. (H) Receiver operating characteristic curves for all serum polyamine metabolites and corresponding area under the curve (AUC) statistics for the true positive rate of Parkinson disease diagnosis in Cohort B. (I) Scatterplots showing positive relationships between DiAcSpd and fractional anisotropy (FA) in Parkinson disease. (J) Significant positive correlation between N1,N8‐diacetylspermidine and FA, adjusted for age and L‐dopa equivalent dose (p < 0.05, familywise error corrected) in Parkinson disease patients. Significant clusters were overlaid onto a Montreal Neurological Institute (MNI) ICBM152 standard brain T1‐weighted image. Slices in MNI coordinates x, y, z are shown in millimeters. Colored bar represents p value. **p < 0.01, ***p < 0.001 (Steel test or analysis of variance). N1‐AcSpd = N1‐acetylspermidine; N1‐AcSpm: N1‐acetylspermine; NS = not significant.
Table 3.
Correlation Analysis with Logistic Regression or Multiple Regression Model of Each Polyamine Metabolite, Disease Severity (H&Y or UPDRS‐III), and LED
| Compound Name | H&Y (normalized to LED) | UPDRS‐III (normalized to LED) | ||
|---|---|---|---|---|
| F a | p a | F b | p b | |
| DiAcSpd | 3.45 | 0.0096 | 4.28 | 0.04 |
| N1‐AcSpd | 0.77 | 0.546 | 0.169 | 0.681 |
| N8‐AcSpd | 3.08 | 0.0176 | 3.08 | 0.0808 |
| DiAcSpm | 3.73 | 0.0061 | 3.2 | 0.0755 |
| Spd | 1.31 | 0.27 | 1.46 | 0.229 |
| N1‐AcSpm | 1.22 | 0.303 | 0.576 | 0.449 |
| Spm | 1.62 | 0.172 | 0.0022 | 0.962 |
| Spm/Spd ratio | 0.156 | 0.96 | 1.15 | 0.285 |
Obtained by logistic regression analysis.
Obtained by multiple regression analysis.
DiAcSpd = N1,N8‐diacetylspermidine; DiAcSpm = N1,N12‐diacetylspermine; H&Y = Hoehn and Yahr stage; LED = L‐dopa equivalent dose; N1‐AcSpd = N1‐acetylspermidine; N1‐AcSpm = N1‐acetylspermine; N8‐AcSpd = N8‐acetylspermidine; Spd = spermidine; Spm = spermine; UPDRS‐III = Unified Parkinson's Disease Rating Scale motor section.
Table 4.
Correlation Analysis with Logistic Regression or Multiple Regression Model of Each Polyamine Metabolite, Disease Severity (H&Y or UPDRS‐III), and Age at Sampling
| Compound Name | H&Y (normalized by age at sampling) | UPDRS‐III (normalized by age at sampling) | ||
|---|---|---|---|---|
| F a | p a | F b | p b | |
| DiAcSpd | 3.18 | 0.015 | 5.85 | 0.0165 |
| N1‐AcSpd | 1.32 | 0.263 | 0.146 | 0.228 |
| N8‐AcSpd | 3.22 | 0.014 | 4.58 | 0.0337 |
| DiAcSpm | 2.94 | 0.0301 | 3.26 | 0.0725 |
| Spd | 1.45 | 0.219 | 1.37 | 0.244 |
| N1‐AcSpm | 1.41 | 0.233 | 0.258 | 0.612 |
| Spm | 1.79 | 0.132 | 0.730 | 0.394 |
| Spm/Spd ratio | 0.185 | 0.946 | 0.0407 | 0.840 |
Obtained by logistic regression analysis.
Obtained by multiple regression analysis.
DiAcSpd = N1,N8‐diacetylspermidine; DiAcSpm = N1,N12‐diacetylspermine; H&Y = Hoehn and Yahr stage; N1‐AcSpd = N1‐acetylspermidine; N1‐AcSpm = N1‐acetylspermine; N8‐AcSpd = N8‐acetylspermidine; Spd = spermidine; Spm = spermine; UPDRS‐III = Unified Parkinson's Disease Rating Scale motor section.
To confirm that these polyamine metabolites reflect disease severity of PD, we performed DTI on 20 patients with PD who were successively examined within Cohort B. As shown in Table 5, no significant differences were observed for any clinical characteristics and polyamine metabolite levels between PD patients and PD patients with DTI. Using DTI, we investigated association between levels of the 3 acetylated polyamines and axonal changes detected in PD.34 Accordingly, TBSS analysis detected a significant positive correlation between DiAcSpd and FA in an extensive white matter area in the brain of PD patients after normalization of LED and age (see Fig 2I, J; p < 0.05, familywise error‐corrected; Peak Montreal Neurological Institute method x, y, z: 77, 90, 110; tmax = 7.06; rmax = 0.70; voxels = 45,836).35 Spearman rank correlation test also revealed that mean FA values for significant clusters in PD patients correlated positively with DiAcSpd (r = 0.63, p = 0.003).
Table 5.
Patients’ Characteristics of PD with or without Diffusion Tensor Imaging
| Characteristic | PD | PD with Diffusion Tensor Imaging | p a |
|---|---|---|---|
| Age, mean yr (SD) | 67.6 (9.56) | 69.5 (10.0) | 0.406 |
| H&Y, mean (SD) | 2.05(0.907) | 2.15 (0.745) | 0.649 |
| UPDRS‐III, mean (SD) | 13.5 (9.89) | 11.4 (7.60) | 0.357 |
| L‐dopa, mean mg (SD) | 399 (239) | 413 (210) | 0.807 |
| MMSE, mean (SD) | 27.8 (3.10) | 26.7 (3.37) | 0.164 |
| L‐dopa equivalent dose, mean (SD) | 606 (357) | 607 (279) | 0.990 |
| DiAcSpd, mean (SD) | 0.704 (0.365) | 0.751 (0.430) | 0.590 |
| N1‐AcSpd, mean (SD) | 18.9 (10.8) | 21.9 (11.8) | 0.245 |
| N8‐AcSpd, mean (SD) | 11.2 (3.42) | 11.8 (3.03) | 0.451 |
| DiAcSpm, mean (SD) | 0.916 (0.689) | 0.861 (0.431) | 0.728 |
| Spd, mean (SD) | 23.6 (11.9) | 24.7 (14.9) | 0.726 |
| N1‐AcSpm, mean (SD) | 0.496 (0.280) | 0.549 (0.346) | 0.434 |
| Spm, mean (SD) | 4.24 (2.00) | 4.47 (2.09) | 0.621 |
| Spm/Spd ratio, mean (SD) | 0.208 (0.118) | 0.220 (0.115) | 0.666 |
Probability values were obtained by Wilcoxon test between PD and PD with diffusion tensor imaging.
DiAcSpd = N1,N8‐diacetylspermidine; DiAcSpm = N1,N12‐diacetylspermine; H&Y = Hoehn and Yahr stage; MMSE = Mini‐Mental State Examination; N1‐AcSpd = N1‐acetylspermidine; N1‐AcSpm = N1‐acetylspermine; N8‐AcSpd = N8‐acetylspermidine; PD = Parkinson disease; SD = standard deviation; Spd = spermidine; Spm = spermine; UPDRS‐III = Unified Parkinson's Disease Rating Scale motor section.
Analysis of Polyamine Metabolism‐Associated Genes
Next, we genotyped 19 SNVs to investigate whether variants of 3 genes (SAT1, SAT2, and HDAC10) that encode enzymes associated with synthesis or acetylation/deacetylation of Spd and Spm affect polyamine metabolism in patients with PD. In addition, Sanger sequencing for mutation detection in the SAT1, SMS, and SMOX genes was performed. We did not detect any variants with statistically different frequencies between patients with PD and controls (Supplementary Table).29
Spm/Spd Ratio Is Consistently Suppressed in PD Independent of Age
The Spm/Spd ratio, indicating Spm conversion from Spd, significantly decreased in the PD group compared with the healthy control group, as a whole (ratio to control = 0.459) and in each of the H&Y stages as assessed by Steel test (ratio to control: I = 0.451, II = 0.470, III = 0.466, IV = 0.447; Fig 3). The Spm/Spd ratio enabled us to distinguish patients with PD from healthy controls. However, more distinct classification was provided using both Spm/Spd ratio and DiAcSpd. Interestingly, PD patients showed significantly lower Spm/Spd ratios at any age (p = 0.0007), whereas healthy controls showed higher ratios especially from 40 to 60 years old. This negative correlation with age is compatible with reports showing age‐dependent decreases in Spm levels.10 Altogether, these data suggest that decreased Spm effects with aging might be associated with onset risk of PD.
Figure 3.
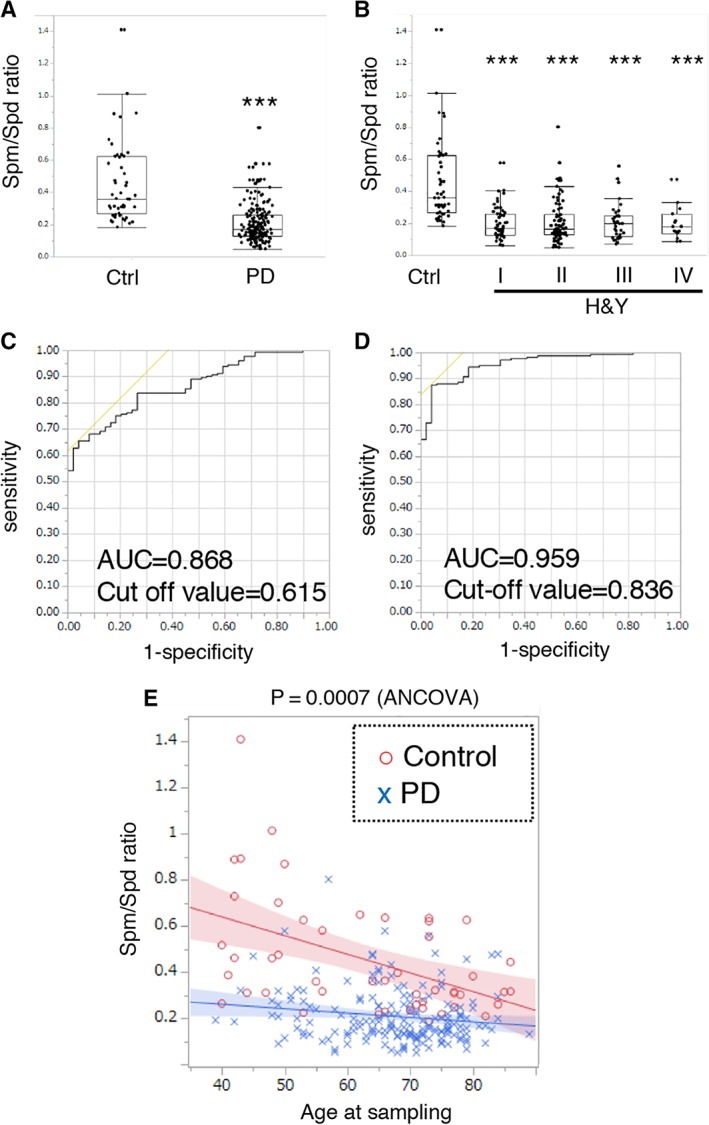
Conversion of spermidine (Spd) to spermine (Spm) is suppressed in Parkinson disease (PD), without association with disease severity. (A) Spm/Spd ratio was significantly decreased in PD patients. ***p < 0.001 (Wilcoxon test). (B) Multiple comparisons of the Spm/Spd ratios showed significant decreases in each Hoehn and Yahr stage (H&Y) relative to the controls. ***p < 0.001 (Steel test). (C) Receiver operating characteristic (ROC) curve analysis of Spm/Spd ratio. (D) ROC curve analysis of Spm/Spd ratio and N1,N8‐diacetylspermidine. (E) Spm/Spd ratios of all controls and PD patients shown on the same graph. Interaction was assessed by analysis of covariance (ANCOVA) between control and PD groups. AUC = area under the curve.
Spm at 5 to 10μM, and 10 to 50μM Spd or N1‐AcSpm Induce Autophagy in SH‐SY5Y Cells
Because both Spm and the Spm/Spd ratio were significantly decreased in PD, we speculated that autophagic activity, an aging‐modulating system, may be influenced by polyamine metabolic changes in PD. Thus, we investigated Spm effects on various cell lines using the LC3‐II/β‐actin ratio. Spm upregulated the LC3‐II/β‐actin ratio drastically in human neuroblastoma SH‐SY5Y cells, and moderately in human osteosarcoma U2OS cells (Fig 4A). Next, the effects of 3 polyamines and 5 acetylated forms on autophagy in SH‐SY5Y cells were examined. Of these 8 molecules, Spm, N1‐AcSpm, and Spd significantly upregulated LC3‐II levels (Fig 4B). Quantitative analysis of LC3‐II levels in 3 independent samples showed that Spm upregulated at 5μM, whereas N1‐AcSpm and Spd modulated at 25μM (Fig 4C).
Figure 4.
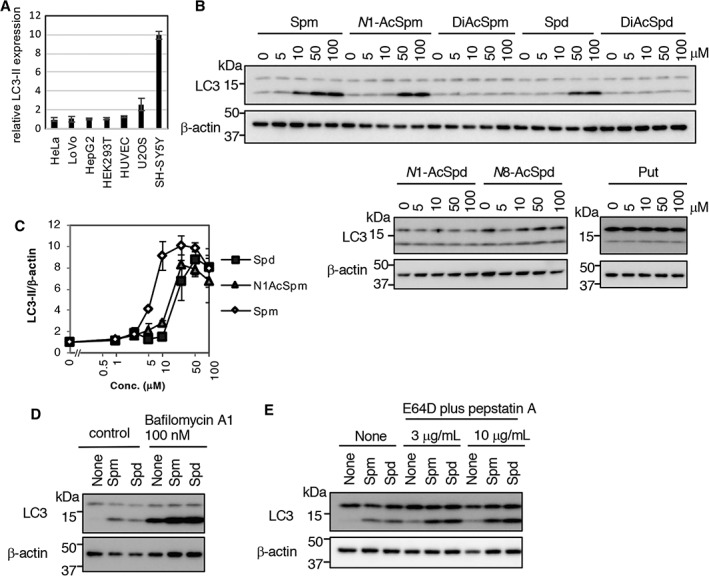
Specific polyamines induced autophagy in SH‐SY5Y cells. (A) Cells were treated with 50μM spermine (Spm) for 4 hours. Cell lysates were immunoblotted with anti‐LC3 and β‐actin antibodies, and then signal intensities of LC3‐II/β‐actin level in Spm‐treated cells (normalized to control cells) were quantified using ImageJ software (https://imagej.nih.gov/ij/index.html). Results are presented as mean ± standard deviation (SD) of 3 samples. (B) SH‐SY5Y cells were treated with the indicated chemicals for 4 hours. Cell lysates were immunoblotted with anti‐LC3 and β‐actin antibodies. (C) SH‐SY5Y cells were treated with spermidine (Spd), N1‐acetylspermine (N1‐AcSpm), and Spm at 1, 2.5, 5, 10, 25, 50, or 100μM for 4 hours. Cell lysates were immunoblotted with anti‐LC3 and β‐actin antibodies, and then signal intensities of LC3‐II (normalized to β‐actin) were quantified using ImageJ software. Results are presented as mean ± SD of 3 samples. (D, E) SH‐SY5Y cells were treated with 50μM Spm or Spd, with or without lysosomal inhibitors (D, 100nM bafilomycin A1; E, E64D plus pepstatin A) for 4 hours. Cell lysates were immunoblotted with anti‐LC3 and β‐actin antibodies. DiAcSpd = N1,N8‐acetylspermidine; DiAcSpm = N1,N12‐acetylspermine; N1‐AcSpd = N1‐acetylspermidine; N1‐AcSpm = N1‐acetylspermine; N8‐AcSpd = N8‐acetylspermidine; Put = putrescine.
LC3‐II upregulation is induced by autophagosome formation or impairment of autophagosome maturation. In the presence of bafilomycin A1, an inhibitor of lysosomal acidification and of autophagosome–lysosome fusion, Spm and Spd increased LC3‐II levels compared with controls (see Fig 4D). Similar results were obtained when cells were cotreated with the lysosomal protease inhibitors pepstatin A and E64D (see Fig 4E), indicating that Spm and Spd induce autophagy, and that Spm is a more potent autophagy inducer. These data imply that decreased levels of Spm/Spd may affect autophagic activity in PD patients.
Discussion
In the current study, we identified DiAcSpd as a diagnostic, severity‐associated, medication‐independent biomarker of PD, although gender distribution differences between controls and PD may affect polyamine metabolism. Notably, even using a multivariate model, DiAcSpd remained significantly correlated with disease severity. In addition, decreases in Spm and the Spm/Spd ratio were detected in PD and AD, but not control or PSP groups. In particular, the Spm/Spd ratio was consistently decreased across ages in PD, unlike the ratio in controls, which showed gradual decrements, suggesting a PD‐associated aging tendency. Levels of Spd were only mildly increased in de novo PD and under medication‐normalized conditions. Finally, we confirmed that among the polyamine metabolites tested, Spm enhanced autophagy most intensely in SH‐SY5Y cells, which were used as a neuronal model for PD and AD, implying a decrement in autophagic activity in PD and AD.
We and others have reported serum/plasma metabolite biomarkers for early diagnosis of PD. However, surrogate biomarkers reflecting age‐related pathogeneses have not been established.16, 36, 37, 38 DiAcSpd levels clearly correlated with both H&Y and UPDRS‐III under age‐ or medication‐normalized conditions, and significantly correlated with FA (an index of white matter integrity alterations), in diffuse white matter, similar to our previous report.34, 39 Likewise, higher diagnostic power of DiAcSpd levels was confirmed. Taken together, serum DiAcSpd measurements could be a potential diagnostic biomarker correlating with disease severity.
Several lines of evidences have shown changes in CSF polyamine levels in patients with various diseases including brain tumors, inflammation, and neurodegeneration.7 In PD compared with controls, Spd decreases in CSF, whereas putrescine increases in CSF and decreases in red blood cells, and no significant changes in Spd and Spm in the basal ganglia have been reported.13, 14, 40 Concentrations of Spd and Spm in the basal ganglia gradually decrease in normal aging.13 Experimentally, Spm clearance from the brain parenchyma mainly occurs via the blood–CSF (BCSFB) rather than the blood–brain barrier.41 Taken together, decreased serum Spm detected in PD in the current study may indicate that brain Spm decreases via the BCSFB.
Compared with PD, YKL‐40 levels in CSF are increased in PSP, which is often difficult to diagnose accurately, particularly in the early stages.42 No serum/plasma differential biomarkers have been established. In the current study, serum polyamine metabolite profile appears to be a potential diagnostic tool for differentiating PD from PSP and AD. Moreover, aging is the most important causative risk factor for PD, PSP, and AD.43 Mean age at onset of neurological symptoms of PSP is 66.4 ± 12 years, similar to PD, but disease prevalence of PSP does not correlate with aging.18, 44 This is consistent with our finding that Spm and the Spm/Spd ratio are suppressed in PD and AD, but that the ratio in PSP is not significantly different from controls.
Autophagy deficiency causes neurodegeneration along with aggregated protein accumulation in the cytoplasm.45, 46 Notably, in PD, α‐synuclein included in Lewy bodies is an autophagy substrate and targeted by disease‐modifying therapy with autophagy‐inducing chemicals.47 In addition, α‐synuclein itself inhibits autophagic flux in cellular models.48 Growing evidence implies that Spd is involved in antiaging through induction of autophagy.6 Furthermore, oral Spd administration protects flies against neurodegenerationlike age‐induced memory impairment and α‐synuclein–induced motor dysfunction through autophagy enhancement, indicating that Spd‐induced autophagy is indispensable for lifespan‐extension/neuroprotection.6 Antiaging effects of Spm have also been reported in mice.49 Because our data showed that Spm was 3 to 4 times more effective in autophagy induction than Spd at 5 to 20μM, which is within physiological blood concentrations, and considering decreased levels of Spm and Spm/Spd ratios in PD and AD, conversion from Spd to Spm may be crucial for the maintenance of homeostasis in neuronal cell lines.
This study has some limitations. First, it was conducted at a single university hospital. Second, not all enrolled patients underwent DTI scans. Finally, medications or cancers may affect polyamine metabolism. Although antiparkinsonian medications may influence polyamine metabolism, which concomitantly occurs in various tissues, the hyperacetylation status was confirmed under normalized condition of antiparkinsonian medications in our cohorts. Polyamine metabolism is upregulated in patients with urogenital or colorectal cancers; thus, we excluded patients with any known cancer in both cohorts.50 Future studies should test all polyamine‐associated metabolites, including ornithine and putrescine, in larger cohorts. In addition, longitudinal observation in the same cases should be included in future research.
Herein, DiAcSpd is shown to be a potential, peripheral, noninvasive, diagnostic biomarker of PD that correlates with disease severity. In addition, we demonstrate that dysfunction in conversion from Spd to Spm is an age‐related risk for PD. Our study provides new insight into the association between aging risk for PD and autophagic activity regulated by Spm synthesis from Spd.
Author Contributions
Study concept and design: S.Sa., Y.S., N.H. Data acquisition and analysis: all authors. Drafting text: S.Sa., Y.S., N.H.
Potential Conflicts of Interest
Nothing to report.
Supporting information
Supporting Table S1
Acknowledgment
This work was supported by a Grant‐in‐Aid for Scientific Research on Priority Areas (S.Sa., 25111001), Grants‐in‐Aid for Scientific Research (B; S.Sa., 15H04843, 18H02744, 18KT0027, 18KK0242), a Grant‐in‐Aid for Japan Society for the Promotion of Science Research Fellow (Y.S., 16J40133), a Grant‐in‐Aid for Early‐Career Scientists (Y.S., 18K15464) from Japan Society for the Promotion of Science, GSK Japan Research Grant 2016 (Y.S.), and grants from the Japan Agency for Medical Research and Development (CREST, program for Brain Mapping by Integrated Neurotechnologies for Disease Studies [Brain/MINDS]).
We thank Drs M. Imoto and V. Korolchuk for critical comments, and Dr C. Barnes from Edanz Group (www.edanzediting.com/ac) for editing a draft of the manuscript.
The copyright line for this article was changed on 26 July 2019 after original online publication.
Contributor Information
Shinji Saiki, Email: ssaiki@juntendo.ac.jp.
Nobutaka Hattori, Email: nhattori@juntendo.ac.jp.
References
- 1. Niccoli T, Partridge L. Ageing as a risk factor for disease. Curr Biol 2012;22:R741–R752. [DOI] [PubMed] [Google Scholar]
- 2. Rubinsztein DC, Marino G, Kroemer G. Autophagy and aging. Cell 2011;146:682–695. [DOI] [PubMed] [Google Scholar]
- 3. Jankovic J, Poewe W. Therapies in Parkinson's disease. Curr Opin Neurol 2012;25:433–447. [DOI] [PubMed] [Google Scholar]
- 4. Dorsey ER, Bloem BR. The Parkinson pandemic—a call to action. JAMA Neurol 2018;75:9–10. [DOI] [PubMed] [Google Scholar]
- 5. Reeve A, Simcox E, Turnbull D. Ageing and Parkinson's disease: why is advancing age the biggest risk factor? Ageing Res Rev 2014;14:19–30. [DOI] [PMC free article] [PubMed] [Google Scholar]
- 6. Madeo F, Eisenberg T, Pietrocola F, Kroemer G. Spermidine in health and disease. Science 2018;359(6374). [DOI] [PubMed] [Google Scholar]
- 7. Minois N, Carmona‐Gutierrez D, Madeo F. Polyamines in aging and disease. Aging (Albany NY) 2011;3:716–732. [DOI] [PMC free article] [PubMed] [Google Scholar]
- 8. Eisenberg T, Abdellatif M, Schroeder S, et al. Cardioprotection and lifespan extension by the natural polyamine spermidine. Nat Med 2016;22:1428–1438. [DOI] [PMC free article] [PubMed] [Google Scholar]
- 9. Kibe R, Kurihara S, Sakai Y, et al. Upregulation of colonic luminal polyamines produced by intestinal microbiota delays senescence in mice. Sci Rep 2014;4:4548. [DOI] [PMC free article] [PubMed] [Google Scholar]
- 10. Soda K, Kano Y, Sakuragi M, et al. Long‐term oral polyamine intake increases blood polyamine concentrations. J Nutr Sci Vitaminol (Tokyo) 2009;55:361–366. [DOI] [PubMed] [Google Scholar]
- 11. Schwarz C, Stekovic S, Wirth M, et al. Safety and tolerability of spermidine supplementation in mice and older adults with subjective cognitive decline. Aging (Albany NY) 2018;10:19–33. [DOI] [PMC free article] [PubMed] [Google Scholar]
- 12. Pucciarelli S, Moreschini B, Micozzi D, et al. Spermidine and spermine are enriched in whole blood of nona/centenarians. Rejuvenation Res 2012;15:590–595. [DOI] [PubMed] [Google Scholar]
- 13. Vivo M, de Vera N, Cortes R, et al. Polyamines in the basal ganglia of human brain. Influence of aging and degenerative movement disorders. Neurosci Lett 2001;304:107–111. [DOI] [PubMed] [Google Scholar]
- 14. Paik MJ, Ahn YH, Lee PH, et al. Polyamine patterns in the cerebrospinal fluid of patients with Parkinson's disease and multiple system atrophy. Clin Chim Acta 2010;411:1532–1535. [DOI] [PubMed] [Google Scholar]
- 15. Roede JR, Uppal K, Park Y, et al. Serum metabolomics of slow vs. rapid motor progression Parkinson's disease: a pilot study. PLoS One 2013;8:e77629. [DOI] [PMC free article] [PubMed] [Google Scholar]
- 16. Saiki S, Hatano T, Fujimaki M, et al. Decreased long‐chain acylcarnitines from insufficient beta‐oxidation as potential early diagnostic markers for Parkinson's disease. Sci Rep 2017;7:7328. [DOI] [PMC free article] [PubMed] [Google Scholar]
- 17. Postuma RB, Berg D, Stern M, et al. MDS clinical diagnostic criteria for Parkinson's disease. Mov Disord 2015;30:1591–1601. [DOI] [PubMed] [Google Scholar]
- 18. Hoglinger GU, Respondek G, Stamelou M, et al. Clinical diagnosis of progressive supranuclear palsy: the movement disorder society criteria. Mov Disord 2017;32:853–864. [DOI] [PMC free article] [PubMed] [Google Scholar]
- 19. McKhann GM, Knopman DS, Chertkow H, et al. The diagnosis of dementia due to Alzheimer's disease: recommendations from the National Institute on Aging‐Alzheimer's Association workgroups on diagnostic guidelines for Alzheimer's disease. Alzheimers Dement 2011;7:263–269. [DOI] [PMC free article] [PubMed] [Google Scholar]
- 20. Tomlinson CL, Stowe R, Patel S, et al. Systematic review of levodopa dose equivalency reporting in Parkinson's disease. Mov Disord 2010;25:2649–2653. [DOI] [PubMed] [Google Scholar]
- 21. Magnes C, Fauland A, Gander E, et al. Polyamines in biological samples: rapid and robust quantification by solid‐phase extraction online‐coupled to liquid chromatography‐tandem mass spectrometry. J Chromatogr A 2014;1331:44–51. [DOI] [PMC free article] [PubMed] [Google Scholar]
- 22. Purwaha P, Lorenzi PL, Silva LP, et al. Targeted metabolomic analysis of amino acid response to L‐asparaginase in adherent cells. Metabolomics 2014;10:909–919. [DOI] [PMC free article] [PubMed] [Google Scholar]
- 23. Andersson JL, Sotiropoulos SN. An integrated approach to correction for off‐resonance effects and subject movement in diffusion MR imaging. Neuroimage 2016;125:1063–1078. [DOI] [PMC free article] [PubMed] [Google Scholar]
- 24. Basser PJ, Mattiello J, LeBihan D. MR diffusion tensor spectroscopy and imaging. Biophys J 1994;66:259–267. [DOI] [PMC free article] [PubMed] [Google Scholar]
- 25. Smith SM, Jenkinson M, Johansen‐Berg H, et al. Tract‐based spatial statistics: voxelwise analysis of multi‐subject diffusion data. Neuroimage 2006;31:1487–1505. [DOI] [PubMed] [Google Scholar]
- 26. Oishi K, Zilles K, Amunts K, et al. Human brain white matter atlas: identification and assignment of common anatomical structures in superficial white matter. Neuroimage 2008;43:447–457. [DOI] [PMC free article] [PubMed] [Google Scholar]
- 27. Hai Y, Shinsky SA, Porter NJ, Christianson DW. Histone deacetylase 10 structure and molecular function as a polyamine deacetylase. Nat Commun 2017;8:15368. [DOI] [PMC free article] [PubMed] [Google Scholar]
- 28. Pietrocola F, Lachkar S, Enot DP, et al. Spermidine induces autophagy by inhibiting the acetyltransferase EP300. Cell Death Differ 2015;22:509–516. [DOI] [PMC free article] [PubMed] [Google Scholar]
- 29. Lewandowski NM, Ju S, Verbitsky M, et al. Polyamine pathway contributes to the pathogenesis of Parkinson disease. Proc Natl Acad Sci U S A 2010;107:16970–16975. [DOI] [PMC free article] [PubMed] [Google Scholar]
- 30. Kumar P, Henikoff S, Ng PC. Predicting the effects of coding non‐synonymous variants on protein function using the SIFT algorithm. Nat Protoc 2009;4:1073–1081. [DOI] [PubMed] [Google Scholar]
- 31. Sasazawa Y, Kanagaki S, Tashiro E, et al. Xanthohumol impairs autophagosome maturation through direct inhibition of valosin‐containing protein. ACS Chem Biol 2012;7:892–900. [DOI] [PubMed] [Google Scholar]
- 32. Hajian‐Tilaki K. Receiver operating characteristic (ROC) curve analysis for medical diagnostic test evaluation. Caspian J Intern Med 2013;4:627–635. [PMC free article] [PubMed] [Google Scholar]
- 33. Smith SM, Nichols TE. Threshold‐free cluster enhancement: addressing problems of smoothing, threshold dependence and localisation in cluster inference. Neuroimage 2009;44:83–98. [DOI] [PubMed] [Google Scholar]
- 34. Kamagata K, Zalesky A, Hatano T, et al. Connectome analysis with diffusion MRI in idiopathic Parkinson's disease: evaluation using multi‐shell, multi‐tissue, constrained spherical deconvolution. Neuroimage Clin 2018;17:518–529. [DOI] [PMC free article] [PubMed] [Google Scholar]
- 35. Atkinson‐Clement C, Pinto S, Eusebio A, Coulon O. Diffusion tensor imaging in Parkinson's disease: review and meta‐analysis. Neuroimage Clin 2017;16:98–110. [DOI] [PMC free article] [PubMed] [Google Scholar]
- 36. Fujimaki M, Saiki S, Li Y, et al. Serum caffeine and metabolites are reliable biomarkers of early Parkinson disease. Neurology 2018;90:e404–e411. [DOI] [PMC free article] [PubMed] [Google Scholar]
- 37. Hatano T, Saiki S, Okuzumi A, et al. Identification of novel biomarkers for Parkinson's disease by metabolomic technologies. J Neurol Neurosurg Psychiatry 2016;87:295–301. [DOI] [PubMed] [Google Scholar]
- 38. Havelund JF, Heegaard NHH, Faergeman NJK, Gramsbergen JB. Biomarker research in Parkinson's disease using metabolite profiling. Metabolites 2017;7(3). [DOI] [PMC free article] [PubMed] [Google Scholar]
- 39. Kamagata K, Motoi Y, Tomiyama H, et al. Relationship between cognitive impairment and white‐matter alteration in Parkinson's disease with dementia: tract‐based spatial statistics and tract‐specific analysis. Eur Radiol 2013;23:1946–1955. [DOI] [PMC free article] [PubMed] [Google Scholar]
- 40. Gomes‐Trolin C, Nygren I, Aquilonius SM, Askmark H. Increased red blood cell polyamines in ALS and Parkinson's disease. Exp Neurol 2002;177:515–520. [DOI] [PubMed] [Google Scholar]
- 41. Akanuma SI, Shimada H, Kubo Y, Hosoya KI. Involvement of carrier‐mediated transport at the blood‐cerebrospinal fluid barrier in spermine clearance from rat brain. Biol Pharm Bull 2017;40:1599–1603. [DOI] [PubMed] [Google Scholar]
- 42. Olsson B, Constantinescu R, Holmberg B, et al. The glial marker YKL‐40 is decreased in synucleinopathies. Mov Disord 2013;28:1882–1885. [DOI] [PubMed] [Google Scholar]
- 43. Ascherio A, Schwarzschild MA. The epidemiology of Parkinson's disease: risk factors and prevention. Lancet Neurol 2016;15:1257–1272. [DOI] [PubMed] [Google Scholar]
- 44. Williams DR, de Silva R, Paviour DC, et al. Characteristics of two distinct clinical phenotypes in pathologically proven progressive supranuclear palsy: Richardson's syndrome and PSP‐parkinsonism. Brain 2005;128(pt 6):1247–1258. [DOI] [PubMed] [Google Scholar]
- 45. Komatsu M, Waguri S, Chiba T, et al. Loss of autophagy in the central nervous system causes neurodegeneration in mice. Nature 2006;441:880–884. [DOI] [PubMed] [Google Scholar]
- 46. Hara T, Nakamura K, Matsui M, et al. Suppression of basal autophagy in neural cells causes neurodegenerative disease in mice. Nature 2006;441:885–889. [DOI] [PubMed] [Google Scholar]
- 47. Hebron ML, Lonskaya I, Moussa CE. Nilotinib reverses loss of dopamine neurons and improves motor behavior via autophagic degradation of alpha‐synuclein in Parkinson's disease models. Hum Mol Genet 2013;22:3315–3328. [DOI] [PMC free article] [PubMed] [Google Scholar]
- 48. Winslow AR, Chen CW, Corrochano S, et al. alpha‐Synuclein impairs macroautophagy: implications for Parkinson's disease. J Cell Biol 2010;190:1023–1037. [DOI] [PMC free article] [PubMed] [Google Scholar]
- 49. Matsumoto M. Polyamines and longevity in mammals In: Kusano T, Suzuki H, eds. Polyamines. Tokyo, Japan: Springer, 2015:257–266. [Google Scholar]
- 50. Kawakita M, Hiramatsu K. Diacetylated derivatives of spermine and spermidine as novel promising tumor markers. J Biochem 2006;139:315–322. [DOI] [PubMed] [Google Scholar]
Associated Data
This section collects any data citations, data availability statements, or supplementary materials included in this article.
Supplementary Materials
Supporting Table S1