

Abstract
Because injury of the CNS causes an astrogliosis, characterized by cell swelling and proliferation, similar to the effects of the serine protease thrombin on astrocytes, we hypothesized that a high level of thrombin at the site of injury might initially induce an astrocyte reaction and later increase the expression of its specific inhibitor, thrombomodulin. Thrombomodulin could then stabilize the astroglial scar through its adhesive properties.
Here, we studied the in vivo injury response of astrocytes in the anterior medullary velum of adult rat by immunostaining and in situ hybridization of thrombomodulin. Thrombomodulin was poorly expressed on astrocytes in normal tissue, increased up to 2 d after injury, and was still highly expressed at 6 d.
To check that thrombin had a direct effect on thrombomodulin expression by astrocytes, we used brain cortical astrocyte primary cultures treated with either thrombin or the agonist peptide thrombin receptor-activating peptide-6, known to activate directly the thrombin G-protein-coupled receptor (GPCR) protease-activated receptor-1 (PAR-1). Modification of thrombomodulin expression was studied by Western blotting and quantitative reverse transcription-PCR. There was a dose-dependent increase in thrombomodulin after 48 hr of treatment, with gene expression peaking at 24 hr but falling to control levels by 48 hr.
Together, these results show the following: (1) injury increases astrocyte thrombomodulin expression; (2) thrombin might mediate thrombomodulin expression via the specific receptor PAR-1; and (3) serine proteases, their inhibitors, and the new family of GPCR, PARs, are active on astrogliosis.
Keywords: astrocyte, glial scar, rat, serine protease, lesion, thrombomodulin
Astrocytes are implicated in several CNS processes throughout development and in aging. During adult life, astrocytes play a role in the homeostasis of brain extracellular ion balance achieved primarily through astrocytic potassium ionic buffering (Walz, 1989). Trauma and other pathological events in the CNS induce astrocytic scar reactions (Mathewson and Berry, 1985;Eng, 1988), characterized by hypertrophy, hyperplasia, and the accumulation of gliofilaments. Because we and others have shown previously that thrombin induced the same effects on cultured astrocytes (Beecher et al., 1994; Grabham and Cunningham, 1995; Pindon et al., 1998), we have studied the effects of this serine protease, generated in great amount at the site of a lesion, on astrocyte behavior in vivo.
Thrombin is a multifunctional serine protease, first described as cleaving fibrinogen into fibrin in the blood-clotting cascade (Stone and Le Bonniec, 1998). Thrombin has three specific G-protein-coupled receptors (GPCRs), protease-activated receptor-1, -3, and -4 (PAR-1, PAR-3, and PAR-4) (Vu et al., 1991; Ishihara et al., 1997; Xu et al., 1998) through which it activates a wide range of cells, including macrophages, bone cells, and neurons (Gustafson and Lerner, 1983; Bar-Shavit et al., 1986; Gurwitz and Cunningham, 1988), inducing cell differentiation or growth, so that some authors view thrombin as a growth factor (Grand et al., 1996). What could be its influence on CNS lesions?
Thrombin is able to protect neurons and astrocytes from cell death (Vaughan et al., 1995; Donovan and Cunningham, 1998). Its action on astrocytes in vitro is concentration-dependent. In the nanomolar range, thrombin has a mitogenic effect (Perraud et al., 1987;Cavanaugh et al., 1990) and induces synthesis and release of NGF and endothelin (Ehrenreich et al., 1993; Neveu et al., 1993). In the picomolar range, thrombin induces morphological changes, reversing astrocyte stellation through the specific activation of PKC β1 by PAR-1 (Pindon et al., 1998) but also through the activation of the small GTP-binding protein Rho (Suidan et al., 1997). Thus, because thrombin induces both astrocyte proliferation and shape changes similar to those characteristic of astrogliosis, it is possible that thrombin might be involved in the latter process.
Astrocyte and neuron behavior is governed by a delicate equilibrium between thrombin and its inhibitors. Until now, most of the studies on the thrombin inhibition in the CNS have been done on protease nexin 1 (PN1) (Monard, 1993). There is another thrombin inhibitor, thrombomodulin, which we have shown previously to be present and functionally active on primary astrocyte cultures (Pindon et al., 1997). Thrombomodulin is a transmembrane glycoprotein able to form a complex with the protease (Esmon, 1987). The lectin-like domain of thrombomodulin might involve the molecule in a new type of cell–cell adhesion (Imada et al., 1990).
We wanted to know whether thrombomodulin was involved in astrogliosisin vivo and whether thrombin was able to modulate its expression. We are the first to demonstrate that thrombomodulin is a new marker of astrogliosis in vivo after injury and that it is upregulated in astrocyte primary cultures after thrombin administration.
MATERIALS AND METHODS
Materials
DMEM, fetal calf serum, and trypsin were from Life Technologies (Grand Island, NY). Human α-thrombin was obtained from Enzyme Research Laboratories (Bloomington, IN), and thrombin receptor-activating peptide-6 (TRAP-6) (SFLLRN) was obtained from Bachem AG (Bubendorf, Switzerland). The anti-thrombomodulin 3E2 monoclonal antibody against human thrombomodulin was purchased from Serbio (Gennevilliers, France). The rat monoclonal and rabbit polyclonal antibodies against mouse thrombomodulin were a generous gift from Prof. Imada (Meiji Institute of Health Science, Odawara, Japan). The horseradish peroxidase-conjugated polyclonal antibodies against rabbit or rat immunoglobulin were from Dako (Glostrup, Denmark). The tetramethylrhodamine (TMR)-conjugated goat anti-rabbit IgG and fluorescein isothiocyanate (FITC)-conjugated goat anti-mouse IgG were from Jackson ImmunoResearch (West Grove, PA). The following items were supplied by Boehringer Mannheim (Mannheim, Germany): digoxigenin detection kit, sheep anti-digoxigenin-alkaline phosphatase Fab fragments, blocking reagent, digoxigenin in vitro transcription kit, EcoRI and HindIII enzymes, and proteinase K. The sodium lauryl sarcosinate (Sarkosyl) was from Fluka Chemie AG (Buchs, Switzerland). The reverse transcription (RT)-PCR kit was purchased from Promega (Paris, France); Taqpolymerase from Eurobio (Les Ulis, France); RT-PCR MIMIC construction kit from Clontech (Palo Alto, CA); and the enhanced chemiluminescence (ECL) kit from Amersham (Buckinghamshire, UK). The following were purchased from Sigma (St. Louis, MO): protease inhibitors (leupeptin, aprotinin, and pepstatin), nitro blue tetrazolium (NBT), and 5-bromo-4-chloro-3-indolyl phosphate (BCIP). All other chemicals were of reagent grade.
Methods
Astrocyte cell culture
All animal studies were approved by animal use procedures adopted by the Institut National de la Santé et de la Recherche Médicale. Neonatal (1- to 3-d-old) OF1 mice (IFFA CREDO, L'Arbresle, France) were anesthetized on ice and decapitated, and their brains were removed. After careful removal of the meninges, the cortex were passed through a 100 μm mesh filter in DMEM containing 20% fetal calf serum. The cells were seeded from a half cortex/25 cm2 flask. Astrocytes were isolated from cortex following a protocol designed for newborn rats (McCarthy and Vellis, 1980), as modified previously for mice (Beecher et al., 1994). After 24 hr, the medium was removed, and cells were washed by pipetting PBS (in mm: 137 NaCl, 2.7 KCl, 6.7 Na2HPO4, 1.5 KH2PO4, 0.7 CaCl2, and 0.5 MgCl2, pH 7.4) to remove loosely adherent cells, and, at day 3, the medium was replaced by DMEM containing 10% fetal calf serum. When confluent, cells were washed twice with PBS and subsequently washed with 0.2 gm/l EDTA and 0.5 gm/l trypsin to remove oligodendrocytes. After trypsinization at 37°C for 5 min, the cells were grown in DMEM containing 10% fetal calf serum. This culture contains >90% astrocytes recognized by the presence of an astrocyte-specific protein, glial fibrillary acidic protein (GFAP).
Cell treatment
Cells were incubated in serum-free (thus thrombin-free) medium for at least 12 hr before treatment. Cells were undergoing a single treatment with 2 nm α-thrombin, TRAP-6 at different concentrations from 1.5 nm to 150 μm, or, as a control, the vehicle (PBS), all at 37°C (5% CO2). Cells were left in the same medium and were collected 9, 24, 36, and 48 hr after treatment was initiated.
Anterior medullary velum lesion
Lesions were placed in the anterior medullary velum (AMV) (Berry et al., 1995) of Avertin-anesthetized, adult Wistar rats using a retractable, curved needle, guarded by a trochar, devised specifically for this purpose. With the needle withdrawn into the trochar, the instrument was introduced through the posterior atlanto-occipital membrane into the IVth ventricle until the tip of the instrument lay in the most rostral portion of the ventricle. Protrusion of the enclosed needle, at this point, brought its superiorly curving tip into contact with the AMV in the ventricular roof. Withdrawal of the instrument, with the needle protruded, thus produced a midsagittal lesion of the AMV, sometimes accompanied by a corresponding lesion of the overlying cerebellar vermis. Groups of five lesioned animals, of either sex, were killed 9 hr postlesioning (hpl) and 1, 2, and 6 d postlesioning (dpl). Animals were perfused with 4% paraformaldehyde (PAF) in PBS. The entire AMV, with trochlear nerves attached, was then dissected free from the inferior colliculi and rostroinferior surface of the cerebellum (Fig. 1) and transferred to distilled water.
Fig. 1.

Schematic representation of whole mounts of rat AMV. A, Intact; B, transected by a midsagittal penetrant lesion. In the intact specimen, trochlear fibers from the ipsilateral IVth nucleus (IV) in the midbrain invade the AMV at the entry point (*); the majority decussate and exit in the contralateral IVth nerve rootlet (A). Midsagittal transection of the crossing axons precipitates degeneration of all severed distal segments coursing contralaterally from the midline into each rootlet (B). From the severed proximal stumps of IVth nerve fibers, regenerating sprouts grow into the ipsilateral halves of each velum, specifically directed into each ipsilateral IVth nerve rootlet, represented as dashed lines. Modified fromBerry et al. (1998).
Immunohistochemistry on AMV
Free-floating AMV were fixed again in 4% PAF for 15 min, washed with PBS, permeabilized with 0.1% Triton X-100 overnight, and then washed twice in PBS. Saturation was performed for 2 hr in PBS containing 0.1% BSA (PBS–BSA) and 1% normal goat serum at 4°C. Double-staining was performed by incubating monoclonal 3E2 anti-thrombomodulin and polyclonal anti-GFAP antibodies with a dilution of 1:100 in PBS–BSA, overnight at 4°C. AMV were washed twice for 5 min and once for 10 min in PBS and then incubated for 1 hr at 4°C with secondary antibodies, TMR-conjugated goat anti-rabbit IgG, and FITC-conjugated goat anti-mouse IgG diluted in PBS–BSA at 1:250 and 1:200, respectively. AMV were washed twice for 5 min and once for 10 min in PBS, then fixated in 4% PAF for 10 min before mounting and viewing with a Zeiss (Oberkochen, Germany) Axiophot fluorescence microscope or a Leica (Nussloch, Germany) TCS 4D confocal microscope.
Synthesis of digoxigenin-labeled riboprobes
Sense and antisense riboprobes were synthesized. Five micrograms of plasmid containing the thrombomodulin cDNA fragment of 418 bp (described by Pindon et al., 1997) were opened by incubating eitherEcoRI or HindIII for 1 hr at 37°C, precipitated in 0.15 m sodium acetate, pH 5, and 50% of phenol-chloroform, and centrifuged for 5 min at 12,000 ×g. The pellet was washed with 70% ethanol and resuspended in 4 μl of H2O. Riboprobes were synthesized with 1 μl of this suspension using an in vitrotranscription SP6/T7 digoxigenin labeling kit. The reaction was performed with T3 polymerase for the sense probe and T7 polymerase for the antisense probe, using the digoxigenin-UTP nucleotides mix, in the presence of RNase, for 2 hr at 37°C and then for 10 min with 2 μl of DNase. RNA were precipitated by incubating overnight at −20°C in the presence of 100 μl of TE buffer (10 mmTris-HCl and 0.1 mm EDTA, pH 7.5).
In situ hybridization
Free-floating AMV were washed twice for 5 min in PBS–0.1% Tween 20 (PBST), dipped successively in 50% methanol–PBST and 75% methanol–PBST for 2 min, quickly dipped in 50% methanol–PBST and 25% methanol–PBST, and given two 5 min washes in PBST. AMV were treated with 10 μg/ml proteinase K for 10 min, fixed with 4% PAF in PBS containing 4 μl/ml 25% glutaraldehyde for 15 min, washed once with PBST for 5 min, and put in a solution of 50% PBST and 50% hybridization mix (50% formamide, 1.3× SSC, 5 mm EDTA, 100 μg/ml heparin, 50 μg/ml yeast RNA, 0.2% Tween 20, and 0.5% CHAPS). After washing three times for 5 min with hybridization mix, AMV were incubated overnight at 65°C in the mix containing the probe at a concentration of 10 μl/ml, washed twice for 30 min in hybridization mix at 65°C and then for 20 min at 65°C in 50% hybridization mix–50% MABT solution (100 mm maleic acid, 1150 mm NaCl, and 0.1% Tween 20, pH 7.5), rinsed three times in MABT at room temperature, and finally incubated for 30 min with 300 ml of MABT, 100 ml of blocking reagent (from the kit), and 100 ml of normal goat serum. The immunodetection of the probe was performed overnight at 4°C in the same solution as above containing the antibody anti-digoxigenin-alkaline phosphatase at 1:2000. AMV were given three 5 min and three 1 hr washes with MABT, incubated twice for 10 min in the NTMT solution (0.1 m NaCl, 0.1 mTris-HCl, pH 9.5, 0.05 m MgCl2, and 1% Tween 20), and incubated at room temperature in the dark in NTMT containing 4.5 μl/ml NBT and 3.5 μl/ml BCIP (X-phosphate). The reaction was stopped by washing with PBST. AMV were then processed as whole mounts as above for microscopy.
Cell fractionation
Cells were washed twice with PBS, placed into ice-cold 0.02m Tris-HCl buffer, pH 7.5, containing a cocktail of protease inhibitors (0.5 μg/ml leupeptin, 1.25 μg/ml aprotinin, and 0.5 μg/ml pepstatin), disrupted with a glass homogenizer at 4°C, and ultracentrifuged at 105,000 × g for 30 min at 4°C in an ultracentrifuge (Beckman, Palo Alto, CA). The supernatant consisted of the cytosolic fraction. The pellet was resuspended in ice-cold 0.01 m Tris-HCl, pH 6.8, containing 1% Triton X-100, for 20 min at 4°C, and again centrifuged at 105,000 × g for 30 min. The supernatant of this final centrifugation consisted of the solubilized membrane protein fraction.
Western immunoblotting
After cell fractionation, membrane fraction protein extracts (10 μg/well) were resolved on 10% SDS-PAGE (Laemmli, 1970) and subsequently transferred to a nitrocellulose membrane (Towbin et al., 1979) in 0.025 m Tris, 0.192 m glycine, and 10% isopropanol, pH 8.3, buffer. Membranes were incubated for 2 hr at 25°C with PBS containing 10% instant nonfat dry milk. They were subsequently incubated overnight in PBS containing 5% instant nonfat dry milk, along with either a polyclonal or monoclonal antibody against mouse thrombomodulin, washed once for 5 min and three times for 15 min in PBS–0.05% Tween 20. They were then incubated for 1 hr at room temperature with either a peroxidase-conjugated polyclonal goat anti-rabbit IgG antibody or a mouse IgG antibody and washed again as above. Finally, immunoreactive bands were revealed using ECL reagents (Amersham) and visualized on Kodak (Eastman Kodak, Rochester, NY) X-OMAT AR film. Western blots were quantified using the MCID-M4 software (Imaging Research Inc., St Catharines, Ontario, Canada).
RNA extraction
Total RNA was prepared according to Chomczynski and Sacchi (1987). Cells were washed with PBS at 4°C and lysed in 4m guanidium thiocyanate, 25 mm sodium citrate, pH 7.5, 0.5% Sarkosyl, and 0.1 m β-2 mercaptoethanol. The total amount of RNA was determined by measuring its absorbance at 260 nm in a Beckman DU-70 spectrophotometer.
Competitive RT-PCR mimic
This method uses a PCR mimic DNA that contains complementary sequences of primers identical to the sequences found on the thrombomodulin cDNA used in conventional thrombomodulin PCR. Known amounts of mimic DNA were mixed with the thrombomodulin cDNA and competed together for the PCR. When the intensity of PCR products were equal for mimic DNA and thrombomodulin cDNA, we estimated that titers of both were equal.
PCR mimic construction. Construction of the PCR mimic was performed using the RT-PCR MIMIC kit from Clontech. A primary PCR amplification of 2 ng of a 554 bp neutral DNA fragment (BamHI/EcoRI of v-erbB) was performed using the PCR kit from Promega. The composite primers were 5′ TGGTGTGGTCAATGTCCGCAAGTGAAATCTCCTCCG 3′ and 5′ AGTGTCGGTGGTAAGATTGAGTCCATGGGGAGCTTT 3′. The PCR was performed in a total volume of 50 ml with 1.5 mmMgCl2, 2.5 U Taq polymerase, and 0.4 μm composite primers. The reaction cycles were 1 cycle at 95°C for 5 min and 30 cycles of three segments: 45 sec at 94°C, 45 sec at 50°C, and 90 sec at 72°C. The PCR product was diluted at 1:100 and ran for a second PCR amplification using 1 mm MgCl2, 2.5 UTaq polymerase, and 0.4 μm primers as described by Pindon et al. (1997).
PCR mimic purification and estimation. PCR products were loaded on chroma spin TE-100 columns and then centrifuged at 700 × g for 5 min. The product and different concentrations of fX174 DNA were resolved on a 1% agarose gel electrophoresis. Comparison of band intensities gave the mimic concentration in nanograms per milliliter. We calculated the mimic DNA concentration in attomoles per milliliter because the molecular weight of the mimic was 604 × 600 = 398,640 gm/mol. We diluted the mimic DNA to 100 amol/ml in TE buffer.
Preliminary competitive PCR amplification. Thrombomodulin cDNA was obtained by performing retrotranscription with 3 μg of astrocyte total RNA using the Promega kit; RNA was heated for 3 min at 65°C, added to the reaction medium from the Promega kit, and incubated for 40 min at 42°C. Serial dilution of mimic DNA was performed in TE buffer to obtain nine concentrations from 100 amol/ml to 10−6 amol/ml. Competitive PCR were run in 96-well plates with serial dilutions of PCR mimic competing with a constant amount of thrombomodulin cDNA. PCR were performed with 2 μl of a mimic DNA concentration, 2 μl of the retrotranscription product, and 46 μl of PCR reaction buffer (1 mmMgCl2, 2.5 U Taq polymerase, and 0.4 μm of thrombomodulin primers). PCR was run as described by Pindon et al. (1997). PCR products were resolved on a 1% agarose gel, size markers used were Boehringer markers IV, mimic DNA is 604 bp, and thrombomodulin cDNA fragment is 418 bp. Comparison of the intensity of the two bands, mimic DNA and thrombomodulin cDNA, in each independent well gave an estimation of the cDNA amount and determined the dilution range to be used in the fine-tuned competitive PCR amplification.
Fine-tuned competitive PCR amplification. A twofold dilution series was made with mimic DNA (i.e., from 10−2 to 0.312 10−3 amol), and PCR was run in 96-well plates with 2 μl of a mimic DNA, 2 μl of the astrocyte total RNA retrotranscription product, and 46 μl of PCR reaction buffer, as described above. PCR products were resolved on a 1% agarose gel, and the amount of thrombomodulin fragment cDNA was determined by comparing the intensity of the two bands in each independent PCR. The concentration of cDNA was equal to the one of mimic DNA when the two bands had the same intensity.
RESULTS
Thrombomodulin expression in the lesioned AMV
Protein expression: immunohistochemistry
The protein expression of thrombomodulin was studied by immunohistochemistry on permeabilized AMV at different times after lesion: 0 and 9 hpl and 1, 2, and 6 dpl. To visualize astrocytes and thrombomodulin, double-staining was performed. Cells were labeled with anti-GFAP antibody specific for astrocytes and a marker of astrogliosis (Bignami et al., 1972) and anti-human thrombomodulin monoclonal antibody. Immunohistochemistry was visualized in the z plan of the tissue that contained astrocytes using a confocal microscope.
Immediately after lesion, thrombomodulin was weakly expressed in the AMV up to 9 hpl but increased after 1 dpl (Fig.2A,D,G). Thrombomodulin protein expression was maximal at 2 dpl but decreased at 6 dpl (Fig. 2J,M). However, thrombomodulin expression was more intense at 6 dpl than in controls. GFAP was present at all times after lesion, compatible with the astrogliosis (Fig.2B,E,H,K). Thrombomodulin and GFAP were colocalized (Fig.2I,L,O), showing that thrombomodulin coated reactive astrocytes after lesioning.
Fig. 2.
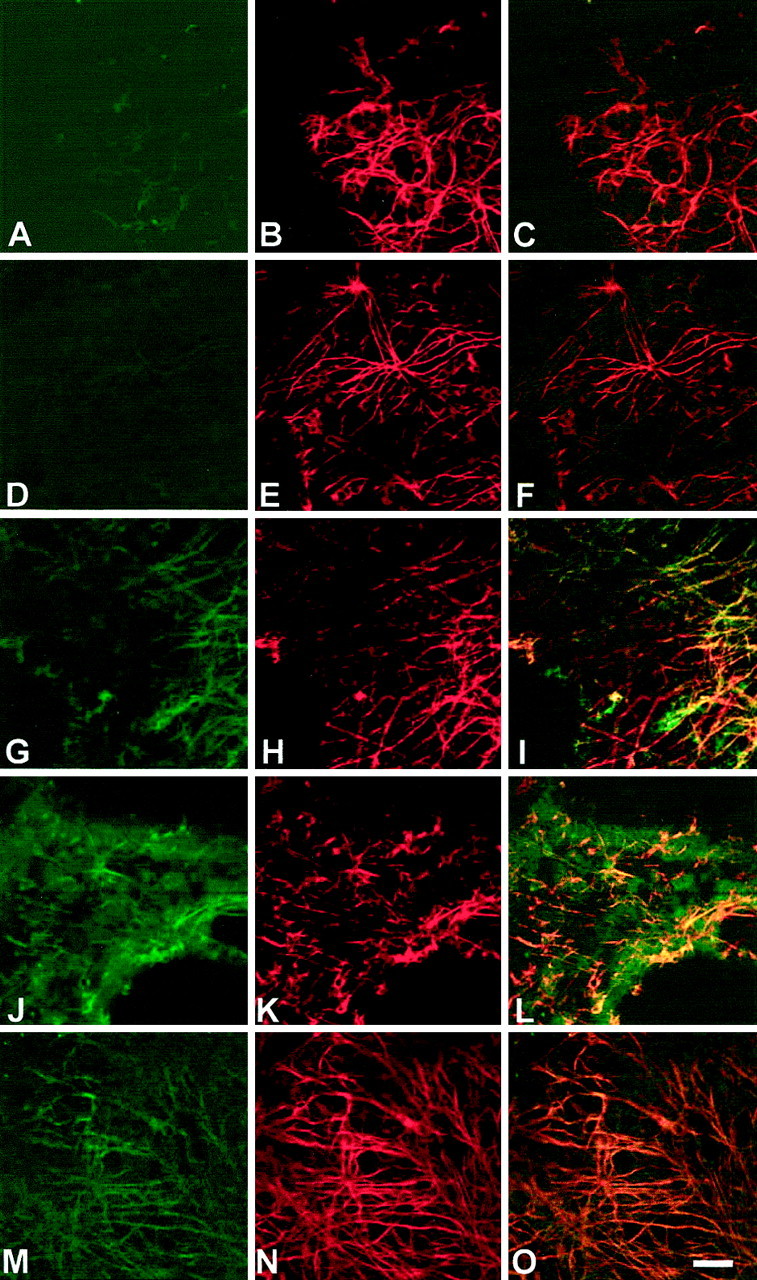
Thrombomodulin protein increases on astrocytes after lesion of the AMV. Double-immunolabeling by thrombomodulin (left) and GFAP (middle) of astrocytes of whole mounts of AMV at different times after lesioning as observed by confocal microscopy. Times after lesion are as follows: 0 hpl (A–C); 9 hpl (D–F); 1 dpl (G–I); 2 dpl (J–L); and 6 dpl (M–O). Immunohistochemistry was performed with monoclonal 3E2 anti-thrombomodulin and polyclonal anti-GFAP antibodies, which were revealed by fluorescein isothiocyanate-conjugated (green) and tetra-methylrhodamine-conjugated (red) secondary antibodies, respectively. Colocalization of thrombomodulin and GFAP on astrocytes is shown by yellow (right), maximal at 2 dpl. Pictures represent a representative sample of five experiments. Scale bar, 50 μm.
mRNA expression: in situ hybridization
Thrombomodulin mRNA was revealed by in situhybridization with a riboprobe in which uracil bases were coupled with digoxigenin. Phosphatase alkaline-coupled antibodies against digoxigenin were used and revealed by precipitation of diformazan.
Thrombomodulin mRNA was not detected in AMV at 0 hpl (Fig.3A) but first appeared at 9 hpl, and the level of expression increased to become maximal by 1–2 dpl (Fig. 3B–D). At 2 dpl, the expression of thrombomodulin mRNA was localized within a limited area around the site of the lesion delineating a clear boundary outside of which no staining was detected (Fig. 3F). Thrombomodulin mRNA was still expressed around the lesion at 6 dpl but with a weaker intensity (Fig.3E). Controls, performed with sense probe, did not show any specific staining in the AMV. The staining seen on the border of the tissue (Fig. 3A–E) is a nonspecific edge effect also observed in negative control sense riboprobe.
Fig. 3.
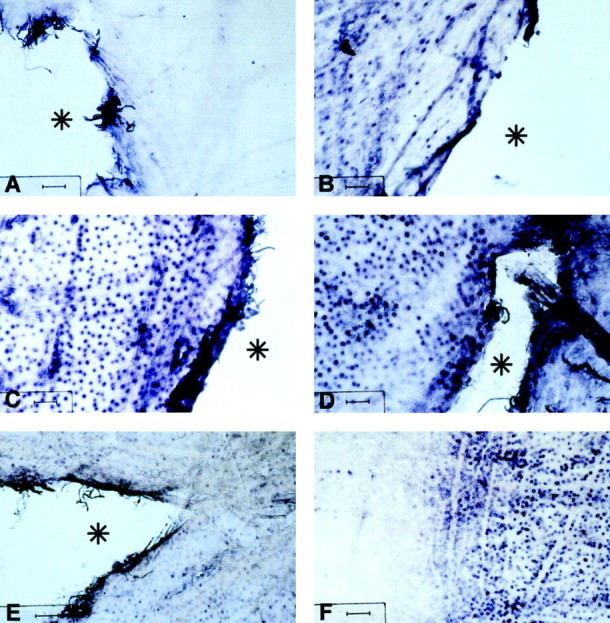
Thrombomodulin mRNA is upregulated after lesion of AMV. In situ hybridization of thrombomodulin mRNA after lesion of the AMV. AMV were taken at different times after lesioning and hybridized with a digoxigenin-labeled riboprobe, followed by immunodetection with an anti-digoxigenin-alkaline phosphatase antibody revealed by a diformazan precipitate. Times after lesion:A, 0 hpl; B, 9 hpl; C, 1 dpl; D, F, 2 dpl; E, 6 dpl. The lesion is marked by asterisks inA–E, except in F in which it is out of the field on the right. Note that, at 2 dpl inF, there is a clear limit between thrombomodulin mRNA-positive (right) and mRNA-negative (left) cells, which might mark the limit of a front of astrocytosis (see Discussion). Scale bars, 100 μm.
To show that thrombomodulin mRNA expression was localized on astrocytes, we performed immunohistochemistry revealing GFAP on AMV already processed for thrombomodulin mRNA in situhybridization. We visualized the staining with confocal microscopy to be in the precise z plan of the astrocytes. Because of technical limitation of confocal microscopy, it is not possible to visualize the diformazan precipitate under visible light. Nevertheless, it was possible to see the mRNA in an indirect way; the presence of the diformazan precipitate quenches the fluorescent immunostaining and shows instead a negative dark surface. The GFAP immunohistochemistry performed alone on AMV shows staining of astrocyte cell bodies (Fig.4A). However, when performed after in situ hybridization, only astrocyte processes were stained, whereas astrocyte cell bodies were dark (Fig.4B). We concluded that thrombomodulin mRNA was colocalized within astrocytes.
Fig. 4.

Astrocytes express thrombomodulin in AMV after lesioning. Immunohistochemistry of GFAP was performed after thein situ hybridization of thrombomodulin mRNA. Confocal immunolocalization of GFAP (A) and of GFAP followed by thrombomodulin in situ hybridization (B) in astrocytes in the AMV at 2 dpl. Note that the astrocyte somata (arrows), clearly visible inA, appear as black negative circles inB after in situ hybridization because of the diformazan precipitate. This shows that astrocytes are the cells expressing thrombomodulin in the AMV. Scale bar, 50 μm.
Thrombomodulin expression was modulated by thrombin treatment
Thrombomodulin protein expression after thrombin treatment
Astrocyte primary cultures were grown in serum-free conditions for at least 12 hr and treated with a single dose of α-thrombin at 2 nm. Cells were harvested 9, 24, 36, and 48 hr after the treatment. The membrane fraction was resolved by Western blot analysis. We have shown previously that mouse thrombomodulin is present in astrocytes (Pindon et al., 1997) and appears in Western blots with a molecular mass of 70 and 140 kDa as described previously (Imada et al., 1987). Because this was the expected molecular mass of thrombomodulin, we focused the quantification on the 70 kDa band. We show here that, 9 hr after thrombin treatment, thrombomodulin localized in the membrane fraction disappeared (Fig.5A). The protein appeared 24 hr after treatment, at the same level of expression as in controls (Fig. 5A,C). Then, thrombomodulin levels increased and more than doubled 48 hr after thrombin treatment (Fig. 5A,C). No significant modification of thrombomodulin levels were observed (Fig.5B) after repeating the above experiments with 2 nm α-thrombin previously incubated for 5 min at 37°C with 10 U/ml hirudin, a thrombin inhibitor.
Fig. 5.
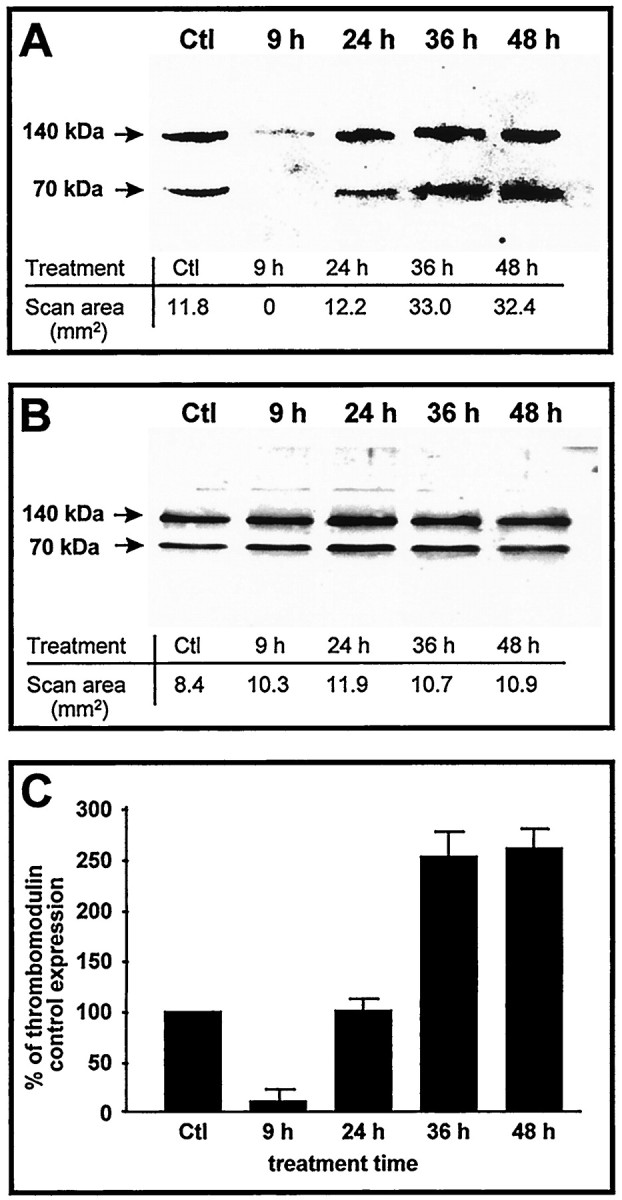
Time course of thrombin-induced modulation of thrombomodulin protein expression by astrocytes in culture; Western blot of thrombomodulin expression after thrombin treatment on rat primary astrocyte cultures. A, Cells were treated with 2 nm α-thrombin for 9, 24, 36, and 48 hr. Control (Ctl) were vehicle-treated astrocytes. Bands have been quantified using MCID program. B, As a control, we used the same time treatments with 2 nm α-thrombin plus 10 U/ml hirudin. Bands have been quantified using MCID software. Membrane fractions were obtained by cell fractionation, and 10 μg of proteins were loaded on 10% SDS-PAGE and then transferred on a nitrocellulose membrane. Monoclonal antibody against mouse thrombomodulin was used, and horseradish-peroxidase-conjugated secondary antibody was revealed by enhanced chemiluminescence.C, Quantification of thrombomodulin in membrane fraction. Data are expressed as the percentage of the control sample scan area. Results are mean of three independent experiments performed on three different astrocyte primary cultures. Error bars are SD.
Protein expression after PAR-1-specific activation
To determine whether a thrombomodulin increase induced by thrombin was dependent on PAR-1 activation, we performed a dose–response curve with TRAP-6, a specific activator of PAR-1 (Fig.6). Astrocytes were incubated for 48 hr because thrombomodulin expression was found to be doubled at this time (see above). We found that the thrombomodulin 70 kDa band, which is the predicted molecular mass of the protein, was upregulated by PAR-1 activation. The effect of PAR-1 activation on thrombomodulin levels started from 1.5 μm TRAP-6.
Fig. 6.

Upregulation of thrombomodulin protein expression by astrocytes in culture is attributable to the activation of PAR-1. Western blot of thrombomodulin after a dose–response treatment of TRAP-6. Primary astrocyte cultures were treated for 48 hr with TRAP-6 (SFLLRN): untreated, C; 150 μm,1; 1.5 μm,2; 150 nm,3; and 1.5 nm,4. Membrane fractions were obtained by cell fractionation, and 10 μg of proteins were loaded on 10% SDS-PAGE and then transferred on a nitrocellulose membrane. Polyclonal antibody against mouse thrombomodulin was used, and horseradish-peroxidase-conjugated secondary antibody was revealed by enhanced chemiluminescence.
Thrombomodulin mRNA expression after thrombin treatment
The amount of thrombomodulin mRNA in astrocyte primary cultures treated once with 2 nm α-thrombin was studied at different times using a quantitative RT-PCR mimic technique. Retrotranscription was performed with 3 μg of total RNA extract. The competitive PCR was performed with the whole amount of cDNA and an increasing amount of mimic DNA. Fine-tuning of the competitive PCR amplification was performed with a twofold dilution series from 10−2 to 3.10−4 amol of mimic DNA (Fig.7). Thrombomodulin cDNA, reflecting the amount of thrombomodulin mRNA in astrocytes, was upregulated by thrombin. The increase in thrombomodulin mRNA levels was transient because it was doubled 9 hr after treatment and increased by fivefold after 24 hr (Fig. 7). The amount dropped to control levels by 48 hr after treatment.
Fig. 7.
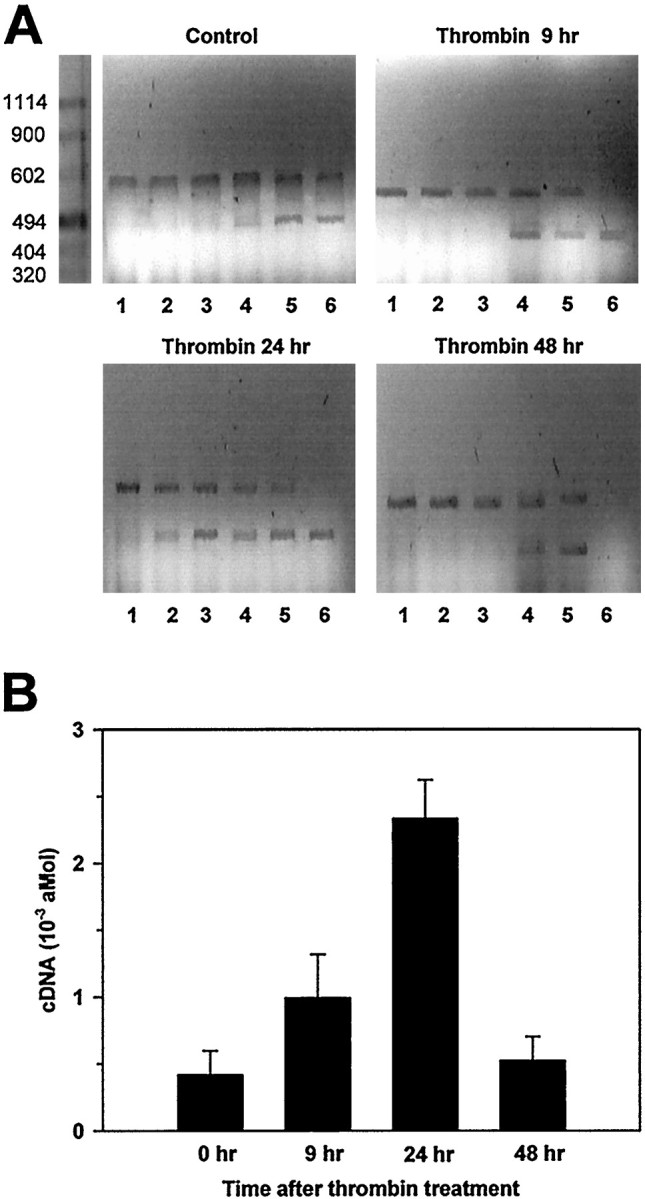
Thrombin upregulates thrombomodulin mRNA expression in cultured astrocytes; quantitative thrombomodulin mRNA expression at different times after thrombin treatment as measured by RT-PCR mimic. Astrocytes were treated with either 2 nmα-thrombin for 9, 24, or 48 hr or vehicle (Control). A, Reverse transcription was made with 3 μg of astrocyte total RNA. PCR was performed with the whole product of the reverse transcription to which various concentrations of mimic were added: 10−2 amol (1); 5 × 10⁻³ amol (2); 2.5 × 10⁻³ amol (3); 1.25 × 10⁻³ amol (4); 0.625 × 10⁻³ amol (5); and 0.312 × 10⁻³ amol (6). The PCR amplimers were separated by electrophoresis on 1% agarose gels. The gel represents a typical experiment of three independent experiments from three independent astrocyte primary cultures. B, Thrombomodulin mRNA quantification performed by competitive RT-PCR mimic. Results are mean of three independent experiments from three different astrocyte primary cultures. Errors bars are SD.
DISCUSSION
The transition of astrocytes from resting to reactive cells correlated with the expression of a wide range of new molecules (for review, see Ridet et al., 1997). Nevertheless, little is known about the mechanisms triggering astrogliosis. To the list of cytokines and growth factors implicated in the reaction of the CNS to injury, we can now add a new family of compounds, the serine proteases, signaling via one of the novel GPCR family, the PARs (for review, see Dery et al., 1998) and their inhibitors. Recently, gene expression of PAR-1 and the thrombin inhibitor PN1 was shown to be modulated in neurons after axotomy (Niclou et al., 1998).
Injury of the AMV induces a reactive astrogliosis (Berry et al., 1998) for which thrombomodulin is a transient marker. Thrombomodulin expression in vivo was very weak but increased after trauma, with a maximal expression at 2 dpl corresponding to the approximate time needed to initiate astrogliosis (O'Brien et al., 1994; Hou et al., 1995). Thrombomodulin expression decreased later but always stayed elevated compared with controls. As we have shown previously (Pindon et al., 1997), thrombomodulin was expressed over the surface of the astrocyte plasma membrane, whereas GFAP stained only intermediate filaments; thus, thrombomodulin staining revealed the entire surface of astrocytes.
Variations in immunostaining of thrombomodulin reflect changes in thrombomodulin gene expression. However, we could not reject the hypothesis that the regulation of thrombomodulin expression over the astrocyte cell surface was by proteins released from vesicles in the vicinity of the plasma membrane (Maruyama and Majerus, 1985). There was no detectable thrombomodulin expression in normal conditions (Fig.2A), but mRNA transcription occurred after lesioning (Fig. 3B–E). The kinetics of the gene expression were delayed compared with protein expression of thrombomodulin, because mRNA was detectable from 9 hpl with a maximum at 1 dpl.
We observed here that astrocytes expressing thrombomodulin mRNA spread from the lesion site into a restricted area of the surrounding tissue (Fig. 3F). This phenomenon might be linked to the observation that the response to a CNS lesion is characterized by a wave of reactive gliosis propagating outward from the lesion site (Mathewson and Berry, 1985; Logan and Berry, 1993). Here, we found that, because thrombomodulin is a transient marker of astrogliosis, it may mark the wave front of astrocyte reactivity. Thrombomodulin is not only a thrombin inhibitor but could also increase the cell-to-cell adhesion via its lectin homolog domain (Patthy, 1988; Petersen, 1988) and might stabilize the astrocyte processes forming the scar. The N terminus of thrombomodulin, like that of E selectin (another adhesion molecule that is also induced by thrombin on endothelial cells (Kaplanski et al., 1997), has been shown to belong to the C-type lectin family (Graves et al., 1994). Moreover, structure–function analysis of the C-type lectin indicates a defined region containing specific amino acid side chains that may be involved in ligand binding (Graves et al., 1994; Villoutreix and Dalbäck, 1998). It has been suggested that an unknown ligand binds to the thrombomodulin lectin domain and triggers signal transduction pathways (Zhang et al., 1998).
Thrombin regulates thrombomodulin expression in vitro in hemangioma cells and smooth muscle cells (Dittman et al., 1989;Bartha et al., 1993; Ma et al., 1997). We wanted to know whether thrombin could induce similar regulation in astrocytes based on a model used to define the biochemical activity of thrombomodulin on newborn mouse cortical astrocyte primary cultures mediated by the formation of a thrombin–thrombomodulin complex (Pindon et al., 1997). The observation of Maruyama and Majerus (1985), that the thrombin–thrombomodulin complex is internalized and degraded, could explain our finding of thrombomodulin levels falling 9 hr after a single thrombin treatment of astrocytes. Subsequently, thrombin induced a time-dependent increase of thrombomodulin expression in astrocytes doubling the amount 2 d after a single thrombin treatment. Two days was the time we chose to study the effect of TRAP-6, a specific activator of the GPCR PAR-1, on PAR-1 activation. This study demonstrated that responses induced in the brain are not attributable to a general proteolytic effect but involve an intracellular signaling mechanism in response to thrombin.
The increase of thrombomodulin expression induced by thrombin was mediated by the specific receptor PAR-1 (Fig. 5). TRAP-6-induced thrombomodulin increased in a dose-dependent way. The efficient concentrations of TRAP-6-inducing thrombomodulin were similar to those found by Grabham and Cunningham (1995) to induce tyrosine phosphorylation in astrocytes. For lower concentrations, which did not induce tyrosine phosphorylation, we did not find thrombomodulin modulation. The PAR-1 activation on neurons induces neurite retraction, dependent on tyrosine kinase and phosphatase activities (Jalink and Moolenaar, 1992; Suidan et al., 1992). It will be interesting to know whether thrombomodulin variations are also dependent on tyrosine phosphorylations. These modulations are regulated at the transcriptional level because our quantitative RT-PCR showed that mRNA levels were increased fivefold 1 d after a single treatment (Figs.6, 7); their subsequent decrease could be explained by the half-life of thrombomodulin (8.9 hr) (Dittman et al., 1988), underlying the weak stability of this mRNA. The kinetics of the modulation of thrombomodulin mRNA levels are different from the protein; the bell-shaped increase in expression of mRNA occurred earlier after the treatments compared with that of the protein. At earlier stages after trauma, the appearance of new thrombomodulin could have been hidden by the internalization of the thrombin–thrombomodulin complex bound to free thrombin (Maruyama and Majerus, 1985).
The upregulation of thrombomodulin induced by PAR-1 activation supports the idea that thrombin acts in the first hour after trauma. Niclou and colleagues (1998) could not find any PAR-1 mRNA in astrocytes of the facial nerve by in situ hybridization 4 d after transection, but because 4 dpl is already late for triggering astrogliosis, PAR-1 gene expression could have already been activated. In fact, the astroglial response takes place quite soon because GFAP gene expression can be detected 1 hr after a mechanical lesion in transgenic mice bearing a GFAP-lacZ gene construct (Mucke et al., 1991). Moreover, thrombin infusion in the brain induces an infiltration of inflammatory cells, proliferation of mesenchymatous cells, angiogenesis, and increased astrocyte reactivity (Nishino et al., 1993). The availability of a specific PAR-1 antagonist would be useful to block thrombomodulin upregulation in vivo.
Together, these results support a strong correlation between the thrombin–thrombomodulin system and the initial induction of cellular and molecular astrogliosis events in reaction to CNS lesions.
Footnotes
This work was supported by Institut National de la Santé et de la Recherche Médicale, the Association Française contre les Myopathies, and the French Institute on Spinal Cord Research.
Correspondence should be addressed to Dr. Armelle Pindon, Institut National de la Santé et de la Recherche Médicale Unité 523, Institut de Myologie, Groupe Hospitalier Pitié-Salpêtrière, 47, Boulevard de l'Hôpital, 75651 Paris Cedex 13, France. E-mail:inserm523@myologie.chups.jussieu.fr.
REFERENCES
- 1.Bar-Shavit R, Kahn AJ, Mann KG, Wilner GD. Growth-promoting effects of esterolytically inactive thrombin on macrophages. J Cell Biochem. 1986;32:261–272. doi: 10.1002/jcb.240320403. [DOI] [PubMed] [Google Scholar]
- 2.Bartha K, Brisson C, Archipoff G, de la Salle C, Lanza F, Cazenave JP, Beretz A. Thrombin regulates tissue factor and thrombomodulin mRNA levels and activities in human saphenous vein endothelial cells by distinct mechanisms. J Biol Chem. 1993;268:421–429. [PubMed] [Google Scholar]
- 3.Beecher KL, Andersen TT, Fenton JW, Festoff BW. Thrombin receptor peptides induce shape change in neonatal murine astrocytes in culture. J Neurosci Res. 1994;37:108–115. doi: 10.1002/jnr.490370115. [DOI] [PubMed] [Google Scholar]
- 4.Berry M, Ibrahim M, Carlile J, Ruge F, Duncan A, Butt AM. Axon–glial relationships in the anterior medullary velum of the adult rat. J Neurocytol. 1995;24:965–983. doi: 10.1007/BF01215646. [DOI] [PubMed] [Google Scholar]
- 5.Berry M, Hunter AS, Duncan A, Lordan J, Kirvell S, Tsang W-L, Butt A. Axon-glial relations during regeneration of axons in the adult rat anterior medullary velum. J Neurocytol. 1998;27:915–937. doi: 10.1023/a:1006953107636. [DOI] [PubMed] [Google Scholar]
- 6.Bignami A, Eng LF, Dahl D, Uyeda CT. Localization of the glial fibrillary acidic protein in astrocytes by immunofluorescence. Brain Res. 1972;43:429–435. doi: 10.1016/0006-8993(72)90398-8. [DOI] [PubMed] [Google Scholar]
- 7.Cavanaugh KP, Gurwitz D, Cunningham DD, Bradshaw RA. Reciprocal modulation of astrocyte stellation by thrombin and protease nexin-1. J Neurochem. 1990;54:1735–1743. doi: 10.1111/j.1471-4159.1990.tb01228.x. [DOI] [PubMed] [Google Scholar]
- 8.Chomczynski P, Sacchi N. Single-step method of RNA isolation by acid guanidinium thiocyanate-phenol-chloroform extraction. Anal Biochem. 1987;162:156–159. doi: 10.1006/abio.1987.9999. [DOI] [PubMed] [Google Scholar]
- 9.Dery O, Corvera CU, Steinhoff M, Bunnett NW. Proteinase-activated receptors: novel mechanisms of signaling by serine proteases. Am J Physiol. 1998;43:1429–1452. doi: 10.1152/ajpcell.1998.274.6.C1429. [DOI] [PubMed] [Google Scholar]
- 10.Dittman WA, Kumada T, Sadler JE, Majerus PW. The structure and function of mouse thrombomodulin. Phorbol myristate acetate stimulates degradation and synthesis of thrombomodulin without affecting mRNA levels in hemangioma cells. J Biol Chem. 1988;263:15815–15822. [PubMed] [Google Scholar]
- 11.Dittman WA, Kumada T, Majerus PW. Sequence of cDNA for mouse thrombomodulin and comparison of the predicted mouse and human amino acid sequences. Nucleic Acids Res. 1989;17:802. doi: 10.1093/nar/17.2.802. [DOI] [PMC free article] [PubMed] [Google Scholar]
- 12.Donovan FM, Cunningham DD. Signaling pathways involved in thrombin-induced cell protection. J Biol Chem. 1998;273:12746–12752. doi: 10.1074/jbc.273.21.12746. [DOI] [PubMed] [Google Scholar]
- 13.Ehrenreich H, Cosat T, Clouse KA, Pluta RM, Ogino Y, Coligan JE, Burd PR. Thrombin is a regulator of endothelin-1. Brain Res. 1993;600:201–207. doi: 10.1016/0006-8993(93)91374-2. [DOI] [PubMed] [Google Scholar]
- 14.Eng LF. Astrocytic response to injury. In: Reier P, Bunge R, Seil F, editors. Current issues in neuronal regeneration research. Liss; New York: 1988. pp. 247–255. [Google Scholar]
- 15.Esmon CT. The regulations of natural anticoagulant pathways. Science. 1987;235:1348–1352. doi: 10.1126/science.3029867. [DOI] [PubMed] [Google Scholar]
- 16.Grabham P, Cunningham DD. Thrombin receptor activation stimulates astrocyte proliferation and reversal of stellation by distinct pathways: involvement of tyrosine phosphorylation. J Neurochem. 1995;64:583–591. doi: 10.1046/j.1471-4159.1995.64020583.x. [DOI] [PubMed] [Google Scholar]
- 17.Grand RJA, Turnell AS, Grabham PW. Cellular consequences of thrombin-receptor activation. Biochem J. 1996;313:353–368. doi: 10.1042/bj3130353. [DOI] [PMC free article] [PubMed] [Google Scholar]
- 18.Graves BJ, Crowther RL, Chandran C, Rumberger JM, Li S, Huang KS, Presky DH, Familetti PC, Wolitzky BA, Burns DK. Insight into E-selectin/ligand interaction from the crystal structure and mutagenesis of the lec/EGF domains. Nature. 1994;367:532–538. doi: 10.1038/367532a0. [DOI] [PubMed] [Google Scholar]
- 19.Gurwitz D, Cunningham DD. Thrombin modulates and reverses neuroblastoma neurite outgrowth. Proc Natl Acad Sci USA. 1988;85:3440–3444. doi: 10.1073/pnas.85.10.3440. [DOI] [PMC free article] [PubMed] [Google Scholar]
- 20.Gustafson GT, Lerner U. Thrombin, a stimulator of bone resorption. Biosci Rep. 1983;3:255–261. doi: 10.1007/BF01122457. [DOI] [PubMed] [Google Scholar]
- 21.Hou YJ, Yu AC, Garcia JM, Aotaki-Keen A, Lee YL, Eng LF, Hjelmeland LJ, Menon VK. Astrogliosis in culture. IV. Effects of basic fibroblast growth factor. J Neurosci Res. 1995;15:359–370. doi: 10.1002/jnr.490400310. [DOI] [PubMed] [Google Scholar]
- 22.Imada M, Imada S, Iwasaki H, Kime A, Yamguchi H, Moore EE. Fetomodulin: marker surface protein of fetal development which is modulatable by cyclic AMP. Dev Biol. 1987;122:483–491. doi: 10.1016/0012-1606(87)90312-5. [DOI] [PubMed] [Google Scholar]
- 23.Imada S, Yamaguchi H, Nagumo M, Katayanagi S, Iwasaki H, Imada M. Identification of fetomodulin, a surface marker protein of fetal development, as thrombomodulin by gene cloning and functional assays. Dev Biol. 1990;140:113–122. doi: 10.1016/0012-1606(90)90058-q. [DOI] [PubMed] [Google Scholar]
- 24.Ishihara H, Connolly AJ, Zeng D, Khan ML, Zheng YW, Timmons C, Tram T, Coughlin SR. Protease-activated receptor 3 is a second thrombin receptor in humans. Nature. 1997;386:502–506. doi: 10.1038/386502a0. [DOI] [PubMed] [Google Scholar]
- 25.Jalink K, Moolenaar WH. Thrombin receptor activation causes rapid neural cell rounding and neurite retraction independent of classic second messengers. J Cell Biol. 1992;118:411–419. doi: 10.1083/jcb.118.2.411. [DOI] [PMC free article] [PubMed] [Google Scholar]
- 26.Kaplanski G, Fabrigoule M, Boulay V, Dinarello CA, Bongrand P, Kaplanski S, Farnarier C. Thrombin induces endothelial type II activation in vitro: IL1 and TNF-alpha-independent IL-8 secretion and E-selectin expression. J Immunol. 1997;158:5435–5441. [PubMed] [Google Scholar]
- 27.Laemmli UK. Cleavage of structural proteins during the assembly of the head of bacteriophage T4. Nature. 1970;227:680–685. doi: 10.1038/227680a0. [DOI] [PubMed] [Google Scholar]
- 28.Logan A, Berry M. Transforming growth factor-beta 1 and basic fibroblast growth factor in the injured CNS. Trends Pharmacol Sci. 1993;14:337–342. doi: 10.1016/0165-6147(93)90007-7. [DOI] [PubMed] [Google Scholar]
- 29.Ma SF, Garcia JG, Reuning U, Little SP, Bang NU, Dixon EP. Thrombin induces thrombomodulin mRNA expression via the proteolytically activated thrombin receptor in cultured bovine smooth muscle cells. J Lab Clin Med. 1997;129:611–619. doi: 10.1016/s0022-2143(97)90195-5. [DOI] [PubMed] [Google Scholar]
- 30.Maruyama I, Majerus PW. The turnover of thrombin-thrombomodulin complex in cultured human umbilical vein endothelial cells and A549 lung cancer cells. Endocytosis and degradation of thrombin. J Biol Chem. 1985;15:15432–15438. [PubMed] [Google Scholar]
- 31.Mathewson AJ, Berry M. Observation on the astrocyte response to a cerebral stab wound in adult rats. Brain Res. 1985;327:61–69. doi: 10.1016/0006-8993(85)91499-4. [DOI] [PubMed] [Google Scholar]
- 32.McCarthy K, Vellis JD. Preparation of astroglial and oligodendroglial cell cultures from rat cerebral tissue. J Cell Biol. 1980;85:890–902. doi: 10.1083/jcb.85.3.890. [DOI] [PMC free article] [PubMed] [Google Scholar]
- 33.Monard D. Tinkering with certain blood components can engender distinct functions in the nervous system. Perspect Dev Neurobiol. 1993;1:165–168. [PubMed] [Google Scholar]
- 34.Mucke L, Oldstone MBA, Morris JC, Nerenberg MI. Rapid activation of astrocyte specific expression of GFAP-lacZ transgene by focal injury. New Biol. 1991;3:465–474. [PubMed] [Google Scholar]
- 35.Neveu I, Jehan F, Jandrot-Perrus M, Wion D, Brachet P. Enhancement of the synthesis and secretion of nerve growth factor in primary cultures of glial cells by proteases: a possible involvement of thrombin. J Neurochem. 1993;60:858–867. doi: 10.1111/j.1471-4159.1993.tb03230.x. [DOI] [PubMed] [Google Scholar]
- 36.Niclou SP, Suidan HS, Pavlik A, Vjsada R, Monard D. Changes in the expression of protease-activated receptor 1 and protease nexin-1 mRNA during rat nervous system development and after nerve lesion. Eur J Neurosci. 1998;10:1590–1607. doi: 10.1046/j.1460-9568.1998.00183.x. [DOI] [PubMed] [Google Scholar]
- 37.Nishino A, Suzuki M, Ohtani H, Motohashi O, Umezawa K, Nagura H, Yoshimoto T. Thrombin may contribute to the pathophysiology of central nervous system injury. J Neurotrauma. 1993;10:167–179. doi: 10.1089/neu.1993.10.167. [DOI] [PubMed] [Google Scholar]
- 38.O'Brien MF, Lenke LG, Lou J, Bridwell KH, Joyce ME. Astrocyte response and transforming growth factor-beta localization in acute spinal cord injury. Spine. 1994;15:2321–2329. doi: 10.1097/00007632-199410150-00012. [DOI] [PubMed] [Google Scholar]
- 39.Patthy L. Detecting distant homologies of mosaic proteins. Analysis of the sequences of thrombomodulin, thrombospondin complement components C9, C8 alpha and C8 beta, vitronectin and plasma cell membrane glycoprotein PC-1. J Mol Biol. 1988;202:689–696. doi: 10.1016/0022-2836(88)90550-5. [DOI] [PubMed] [Google Scholar]
- 40.Perraud F, Besnard F, Sensenbrenner M, Labourdette G. Thrombin is a potent mitogen for rat astroblasts but not for oligodendrocytes and neuroblasts in primary culture. Int J Dev Neurosci. 1987;5:181–188. doi: 10.1016/0736-5748(87)90028-1. [DOI] [PubMed] [Google Scholar]
- 41.Petersen TE. The amino-terminal domain of thrombomodulin and pancreatic stone protein are homologous with lectins. FEBS Lett. 1988;231:51–53. doi: 10.1016/0014-5793(88)80700-2. [DOI] [PubMed] [Google Scholar]
- 42.Pindon A, Hantaï D, Jandrot-Perrus M, Festoff BW. Novel expression and localization of active thrombomodulin on the surface of mouse brain astrocytes. Glia. 1997;19:259–268. [PubMed] [Google Scholar]
- 43.Pindon A, Festoff BW, Hantaï D. Thrombin-induced reversal of astrocyte stellation is mediated by activation of protein kinase C β-1. Eur J Biochem. 1998;255:766–774. doi: 10.1046/j.1432-1327.1998.2550766.x. [DOI] [PubMed] [Google Scholar]
- 44. Ridet JL, Malhotra SK, Privat A, Gage FH. Reactive astrocytes: cellular and molecular cues to biological function. Trends Neurosci 21 1997. 80] 20:570–577 [Erratum (1998) . [DOI] [PubMed] [Google Scholar]
- 45.Stone SR, Le Bonniec BF. Thrombin. In: Barret AJ, Rawlings ND, Woessner JF, editors. Handbook of proteolytic enzymes. Academic; London: 1998. pp. 168–174. [Google Scholar]
- 46.Suidan HS, Stone SR, Hennings BA, Monard D. Thrombin causes neurite retraction in neuronal cells through activation of cell surface receptors. Neuron. 1992;8:363–375. doi: 10.1016/0896-6273(92)90302-t. [DOI] [PubMed] [Google Scholar]
- 47.Suidan HS, Nobes CD, Hall A, Monard D. Astrocyte spreading in response to thrombin and lysophosphatidic acid is dependent on the Rho GTPase. Glia. 1997;21:244–252. doi: 10.1002/(sici)1098-1136(199710)21:2<244::aid-glia7>3.0.co;2-6. [DOI] [PubMed] [Google Scholar]
- 48.Towbin H, Staehelin T, Gordon J. Electrophoretic transfer of proteins from polyacrylamide gels to nitrocellulose sheets: procedure and some applications. Proc Natl Acad Sci USA. 1979;76:4350–4354. doi: 10.1073/pnas.76.9.4350. [DOI] [PMC free article] [PubMed] [Google Scholar]
- 49.Vaughan PJ, Pike CJ, Cotman CW, Cunningham DD. Thrombin receptor activation protects neurons and astrocytes from cell death induced by environmental insults. J Neurosci. 1995;15:5389–5401. doi: 10.1523/JNEUROSCI.15-07-05389.1995. [DOI] [PMC free article] [PubMed] [Google Scholar]
- 50.Villoutreix BO, Dalbäck B. Molecular model for the C-type lectin domain of human thrombomodulin. J Mol Modeling. 1998;4:310–312. [Google Scholar]
- 51.Vu TK, Hung DT, Wheaton VI, Coughlin SR. Molecular cloning of a functional thrombin receptor reveals a novel proteolytic mechanism of receptor activation. Cell. 1991;64:1057–1068. doi: 10.1016/0092-8674(91)90261-v. [DOI] [PubMed] [Google Scholar]
- 52.Walz W. Role of glial cells in the regulation of the brain ion neuroenvironment. Prog Neurobiol. 1989;33:309–333. doi: 10.1016/0301-0082(89)90005-1. [DOI] [PubMed] [Google Scholar]
- 53.Xu WF, Andersen H, Whitmore TE, Presnell SR, Yee DP, Ching A, Gilbert T, Davie EW, Foster DC. Cloning and characterization of human protease-activated receptor 4. Proc Natl Acad Sci USA. 1998;95:6642–6646. doi: 10.1073/pnas.95.12.6642. [DOI] [PMC free article] [PubMed] [Google Scholar]
- 54.Zhang Y, Weiler-Guettler H, Chen J, Wilhelm O, Deng Y, Qiu F, Nakagawa K, Klevesath M, Wilhelm S, Bohrer H, Nakagawa M, Graeff H, Martin E, Stern DM, Rosenberg RD, Ziegler R, Nawroth PP. Thrombomodulin modulates growth of tumor cells independent of its anticoagulant activity. J Clin Invest. 1998;1017:1301–1309. doi: 10.1172/JCI925. [DOI] [PMC free article] [PubMed] [Google Scholar]