

Abstract
Ionotropic GABA receptors can mediate presynaptic and postsynaptic inhibition. We assessed the contributions of GABAA and GABAC receptors to inhibition at the dendrites and axon terminals of ferret retinal bipolar cells by recording currents evoked by focal application of GABA in the retinal slice. Currents elicited at the dendrites were mediated predominantly by GABAA receptors, whereas responses evoked at the terminals had GABAA and GABAC components. The ratio of GABAC to GABAA(GABAC:GABAA) was highest in rod bipolar cell terminals and variable among cone bipolars, but generally was lower in OFF than in ON classes. Our results also suggest that the GABAC:GABAA could influence the time course of responses. Currents evoked at the terminals decayed slowly in cell types for which the GABAC:GABAA was high, but decayed relatively rapidly in cells for which this ratio was low. Immunohistochemical studies corroborated our physiological results. GABAA β2/3 subunit immunoreactivity was intense in the outer and inner plexiform layers (OPL and IPL, respectively). GABAC ρ subunit labeling was weak in the OPL but strong in the IPL in which puncta colocalized with terminals of rod bipolars immunoreactive for protein kinase C and of cone bipolars immunoreactive for calbindin or recoverin. These data demonstrate that GABAA receptors mediate GABAergic inhibition on bipolar cell dendrites in the OPL, that GABAA and GABACreceptors mediate inhibition on axon terminals in the IPL, and that the GABAC:GABAA on the terminals may tune the response characteristics of the bipolar cell.
Keywords: GABA, ionotropic GABA receptors, GABAAreceptors, GABAC receptors, retinal bipolar cells, cone bipolar cells, rod bipolar cells, presynaptic inhibition, postsynaptic inhibition
Throughout the CNS, GABA is an abundant and important inhibitory neurotransmitter. There are two distinct ionotropic GABA receptors, GABAA and GABAC, which are physiologically, pharmacologically, and molecularly distinct (for review, seeBormann and Feigenspan, 1995; Lukasiewicz, 1996; Hevers and Lüddens, 1998). For example, GABA elicits currents that decay more slowly when mediated by GABAC receptors than by GABAA receptors (Qian and Dowling, 1993, 1995;Amin and Weiss, 1994; Lukasiewicz and Wong, 1997; Lukasiewicz and Shields, 1998a), and the affinity for GABA is greater at GABAC receptors than at GABAA receptors (Amin and Weiss, 1994; Feigenspan and Bormann, 1994). Understanding how GABA modulates neuronal excitation thus requires knowledge of how GABAAand GABAC receptors contribute to the overall GABAergic response of the neuron.
In the retina, in which there is an abundance of GABAA and GABAC receptors, there are distinct patterns of expression for these two receptor subtypes (for review, see Lukasiewicz and Shields, 1998b). Retinal neurons that possess both GABAA and GABAC receptors are thus good models for understanding how spatial localization of distinct receptors and their relative expression can shape synaptic responses. One such cell is the retinal bipolar cell, which has dendrites located in the outer plexiform layer (OPL) in which inhibition affects responses to photoreceptor input, and axon terminals located in the inner plexiform layer (IPL) in which inhibition modulates transmission from bipolar cells to ganglion cells. Although these cells have been demonstrated by both electrophysiology and immunocytochemistry to have GABAA and GABAC receptors, it is not yet fully understood how each receptor subtype contributes to inhibition at the dendrites and axon terminals of the cell.
To examine the contributions of GABAA and GABAC receptors to inhibition at the dendritic and axon arbors of bipolar cells, it is necessary to selectively activate GABA receptors in the OPL or IPL. In this study, bipolar cell responses to GABA were examined under whole-cell voltage clamp in slices of mature ferret retina using a brief, focal application of GABA (puff) at the OPL or IPL. The contribution of each receptor subtype to these currents was determined pharmacologically, and the time courses of the evoked responses were measured. We also compared the physiological ratio of GABAA and GABAC receptors on the terminals of different bipolar cell classes and examined the patterns of immunolabeling for these two receptors, because differences in their relative expression may allow functionally distinct cell classes to generate diverse inhibitory responses.
MATERIALS AND METHODS
Preparation of ferret retinal slices. Ferrets (postnatal day 28 to adult) were obtained from Marshall Farms (North Rose, NY). Housing, care, and use of ferrets are in accordance with the Washington University Animal Studies Committee and National Institutes of Health guidelines. Animals were deeply anesthetized with 4–5% halothane (Halocarbon Laboratories, River Edge, NJ), eyes were enucleated, and animals were killed with an overdose of halothane or with an intracardiac (or intraperitoneal) injection of sodium pentobarbital (The Butler Company, Columbus, OH).
Immediately after enucleation, the anterior portion of the eye (lens and cornea) and vitreous were removed. Retinae were dissected in cold, oxygenated extracellular medium (see Electrode and bath solutions) buffered with 20 mm HEPES to pH 7.4 and maintained in this medium at room temperature. Slices were prepared as described previously (Lukasiewicz and Wong, 1997).
Whole-cell patch recordings. Whole-cell patch recordings (Hamill et al., 1981) were obtained from rod and cone bipolar cells in ferret retinal slices. The microscope system and recording procedures have been described in detail previously (Lukasiewicz and Roeder, 1995). Electrodes were pulled from borosilicate glass (TW150F-4; World Precision Instruments, Sarasota, FL) with a Sachs-Flaming puller (Sutter Instruments, Novato, CA) and had measured resistances of <5 MΩ. Patchit software (White Perch Software, Somerville, MA) was used to generate voltage command outputs, acquire data, gate the drug perfusion valves, and trigger the Picospritzer (General Valve, Fairfield, NJ). The data were digitized and stored with a 486 personal computer using a Labmaster DMA data acquisition board (Scientific Solutions, Solon, OH). Responses were filtered at 1 kHz with the four-pole Bessel low-pass filter on the Axopatch 200B (Axon Instruments, Foster City, CA) and sampled at 0.3–2 kHz.
Data analysis. Tack software (White Perch Software) was used to average records and to determine the charge transfer. Leak-subtracted responses (n = 2–4) were averaged to obtain the current traces depicted in the figures. The decay of the current was not easily fit by exponentials. Thus, the decay was measured from peak to 37% of peak current amplitude (D37). Sigma Plot software (SPSS, Chicago, IL) was used to calculate theD37 and to determine the time from the GABA puff to peak current amplitude. Data in text and figure legends are expressed as mean ± SE. Levels of significance were determined using the Student's t test.
Electrode and bath solutions. The standard bathing medium [normal ferret ringer (NFR)] contained (in mm) 128 sodium chloride, 1 magnesium chloride, 5 potassium chloride, 2 calcium chloride, 10 glucose, and 20 HEPES. The standard intracellular electrode solution for puff experiments consisted of (in mm) 118 cesium chloride, 10 tetraethylammonium chloride (TEA), 0.4 magnesium chloride, 1 EGTA, and 10 sodium HEPES, adjusted to pH 7.3 with hydrochloric acid. Synaptic responses were recorded using a low-chloride electrode solution containing cesium gluconate (118 mm) in place of cesium chloride. Cesium and TEA were included in recording electrodes to block voltage-gated potassium channels (Lukasiewicz and Werblin, 1988). In some experiments, slight variations of the above electrode and bath solutions were used or the bathing solution was Ames medium (Ames and Nesbett, 1981). For experiments using Ames medium, the intracellular electrode solution differed from the standard in cesium concentration and contained (in mm) 105.3 cesium chloride or cesium gluconate. No differences were found between solutions. Unless otherwise indicated, all chemicals were obtained from Sigma (St. Louis, MO).
In NFR bathing solution, the calculatedECl was −2 mV (cesium chloride electrodes) or −58.5 mV (cesium gluconate electrodes). For experiments in which Ames medium was substituted for NFR,ECl was −2 mV (cesium chloride electrodes) or −65 mV (cesium gluconate electrodes). Membrane potential values given in this paper were corrected for junction potentials. Liquid junction potentials were calculated using Junction Potential Calculator (Cell MicroControls, Virginia Beach, VA) and were typically −5.2 and −14.5 mV in NFR for cesium chloride and cesium gluconate electrodes, respectively. When Ames medium was substituted for NFR, the liquid junction potentials were −3.5 mV (cesium chloride electrodes) and −13.5 mV (cesium gluconate electrodes).
The control bathing solution used in these slice experiments was formulated to pharmacologically isolate bipolar cell responses to GABA. In all experiments, glycine receptors were antagonized with strychnine (2 μm) (Belgum et al., 1984). For GABA puff experiments, AMPA/kainate (AMPA/KA) receptors were blocked with 6-cyano-7-nitroquinoxaline-2,3-dione (10 μm) (CNQX) [Research Biochemicals (RBI), Natick, MA] (Mittman et al., 1990). GABAA receptors were antagonized with bicuculline methbromide (200 μm; RBI), and GABAC receptors were blocked with 3-aminopropyl [methyl]-phosphinic acid (500 μm) (3-APMPA) (RBI or Precision Biochemicals, Inc., Vancouver, British Columbia, Canada) (Woodward et al., 1993; Pan and Lipton, 1995). Picrotoxin could not be used to selectively block GABAA receptors, because it is an antagonist at both GABAA and GABAC receptors in the ferret (Lukasiewicz and Wong, 1997). Antagonists were applied to a region of the slice under study (several millimeters in width) by a gravity-driven superfusion system as described previously (Lukasiewicz and Roeder, 1995).
Puffing agonist onto bipolar cell terminals or dendrites.GABA (200 μm) was puffed onto either the terminals or dendrites of bipolar cells in the slice preparation with a Picospritzer at 45 or 60 sec intervals. The puff pressure and/or duration (typically 10–30 msec) were adjusted to give no larger than a half-maximal response. The pipette was positioned to give the fastest possible response rise time. The location of the puff pipette in relation to the terminals or dendrites could be determined with Lucifer yellow included in the recording pipette. Because the slice was continuously superfused (diluting the puff) and puff duration and pressure were submaximal, the GABA concentration at the receptors was most likely much less than the pipette concentration. For most experiments in which GABA was puffed onto the terminals, the direction of superfusion flow was from photoreceptors to ganglion cells to prevent activation of dendritic GABA receptors by diffusion of the GABA puff. For experiments in which slices were in the opposite orientation, the puff pressure, duration, and position could be adjusted to focally activate GABA receptors. Cells were rejected when there was evidence of a double peak in the response, which indicated the activation of receptors on both the dendrites and axon terminals.
Evoking GABAergic IPSCs. GABAergic IPSCs were evoked in bipolar cells by puffing kainate (250 or 500 μm) in the IPL to depolarize amacrine cell processes. GABA receptors were pharmacologically isolated as described above by including strychnine (2 μm) in the bathing medium. IPSCs were recorded using cesium gluconate electrodes, and bipolar cells were voltage clamped to 0 mV, the reversal potential for nonspecific cation currents.
Identification and classification of bipolar cells. Bipolar cell class was determined with Lucifer yellow (0.015–0.02%) included in the recording electrode. Bipolar cells were documented by photographing and/or drawing by hand at the conclusion of each experiment. Rod bipolar cells (see Fig. 2A, cells1, 2) stratified close to the border of the inner plexiform and ganglion cell layers and had the morphology described for rat rod bipolar cells (Euler and Wässle, 1995). ON cone bipolar cells (see Fig. 2A, cells 3,4) stratified in the proximal two-thirds of the IPL, and OFF cone bipolar cells (see Fig. 2A, cells5–7) stratified in the distal one-third of the IPL, similar to the ON and OFF sublaminae in the cat IPL (Famiglietti and Kolb, 1976; Nelson et al., 1978; Peichl and Wässle, 1981).
Fig. 2.

Time course of GABAergic currents varies among distinct classes of bipolar cells. A, Line drawings from photomicrographs of cells included in the recorded rod (1, 2), ON cone (3,4), and OFF cone (5–7) bipolar cell populations. Scale bar, 20 μm. B, Currents evoked by puffing GABA (200 μm pipette concentration) onto the terminals of an OFF cone and a rod bipolar cell. The current recorded from the OFF cone bipolar had aD37 of 284 msec and a time-to-peak of 71 msec (thick trace, OFF). TheD37 and time-to-peak of the response measured in the rod bipolar were 1044 and 213 msec, respectively (thin trace, Rod). C, Average D37 and time-to-peak data for populations of rod, ON cone, and OFF cone bipolar cells. The averageD37 values (white bars) were 808 ± 92 msec (n = 18) for rod (Rod), 638 ± 77 msec (n = 18) for ON cone (ON), and 434 ± 44 msec (n = 18) for OFF cone (OFF) bipolar cells. There was a significant difference in the averageD37 between OFF and ON cone bipolars (p = 0.01) and between OFF and rod bipolars (p < 0.001), but not between ON cone and rod bipolar cells (p = 0.08). The average time-to-peak values (black bars) were 168 ± 20 msec (n = 18; Rod), 202 ± 25 msec (n = 18; ON), and 150 ± 20 msec (n = 18;OFF). No significant differences in the time-to-peak were found between classes of bipolar cells.
Immunolabeling. Eyecups were prepared as described above and fixed by immersion in 4% paraformaldehyde in 0.1m phosphate buffer, pH 7.4, for 25–30 min. The paraformaldehyde-fixed eyecups were rinsed (three times for 10 min each) in 0.1 m phosphate buffer, and the retinae were isolated carefully. The retinae were placed in warmed (37°C) 4% agarose for 30 min and then in 4% agar, which was then allowed to solidify. Vibratome sections (50 μm) were cut, washed (10 min) in a solution of 0.01 mPBS (145 mm NaCl, pH 7.35) and 0.5% Triton X-100 (T-X), and then incubated at room temperature for 1 hr in a blocking solution consisting of 10% normal goat serum (NGS) (Vector Laboratories, Burlingame, CA) and 0.5% T-X in 0.01m PBS. Sections were incubated overnight at room temperature in the following primary antibodies made up in the blocking solution at the specified dilutions: PKC [1:1000 (rabbit polyclonal antibody to α, β, and γ isozymes; Chemicon, Temecula, CA)], calbindin [1:1000 (mouse monoclonal anti-calbindin-D; Sigma)], recoverin [1:300 (rabbit polyclonal; gift of A. Dizhoor, Kresge Eye Institute, Wayne State University, Detroit, MI)], GABAA [1:10 (mouse monoclonal antibody to β2/3 (clone bd 17) subunit of the receptor; Boehringer Mannheim, Indianapolis, IN)], and GABAC [1:100 (rabbit polyclonal antibody to ρ1, ρ2, and, ρ3 subunits of the receptor; gift of Ralf Enz, Johns Hopkins University, Baltimore, MD)]. As a control, the primary antibodies were omitted from one section on each slide.
Before applying secondary antibodies, the sections were rinsed for 1 hr at room temperature with 0.5% T-X–0.01 m PBS. Nonspecific labeling was reduced by incubating the sections in a blocking solution consisting of 3% NGS and 0.5% T-X–0.01 m PBS. Immunofluorescent secondary antibodies Cy-2 (1:1000) or Cy-3 (1:1000) were diluted with the blocking solution and applied for 1 hr at room temperature. The sections were rinsed three times for 5–15 min with PBS and then were mounted in Immumount (Shandon Lipshaw, Pittsburgh, PA).
The protocols for triple and double labeling are similar (see above for details). Sections were first double labeled by incubating overnight in blocking solution (10% NGS–0.5% T-X–0.01 m PBS) containing two different primary antibodies from two species. The following day, sections were treated as described above, and the appropriate immunofluorescent secondary antibodies diluted in 3% NGS and 0.5% T-X–0.01 m PBS were applied for 1 hr. After thorough washing in PBS, sections were incubated overnight in blocking solution containing the third primary antibody. After incubation, sections were treated as described above, and the final secondary antibody was applied for 1 hr. After rinsing, sections were mounted in Immumount. We were unable to use this protocol with the β2/3 and calbindin mouse monoclonal antibodies because of interactions between the final secondary antibody and the first primary antibody (either anti-β2/3 or anti-calbindin). Another anti-calbindin antibody (anti-rabbit; Swant, Bellinzona, Switzerland) did not produce specific labeling of this population of ON bipolar cells.
Confocal imaging and image analysis. Confocal images were acquired using the Bio-Rad (Hercules, CA) 1024M microscope (krypton–argon laser). Images were captured using a 40× water or 60× oil objective (NA 1.4; Olympus Optical, Tokyo, Japan) at ax–y resolution of 512 × 512 or 728 × 512 pixels and a z-step appropriate for the magnification of the objective and zoom (typically ranging from 0.1–0.3 μm). Confocal stacks were analyzed using the Metamorph three-dimensional (3-D) analysis package (Universal Imaging Corp., West Chester, PA). Details of how each image in Results was obtained are given in the text and figure legends.
RESULTS
GABAA receptors predominate on the dendrites of bipolar cells
In the OPL, inhibition onto bipolar cell dendrites from GABAergic interneurons may modulate bipolar cell responses to photoreceptor input (Fisher and Boycott, 1974; Kolb and West, 1977; Chun and Wässle, 1989; Pourcho and Owczarzak, 1989). Because GABA receptor subtype influences the characteristics of inhibitory currents, we examined the types of ionotropic GABA receptors expressed on the dendrites of bipolar cells in the ferret retinal slice.
Currents were evoked by puffing GABA directly onto bipolar cell dendrites in the OPL after blocking glycine and AMPA/KA receptors (see Materials and Methods). The GABA receptor types mediating these responses were determined pharmacologically by selectively blocking with the GABAA receptor antagonist bicuculline or with bicuculline plus the GABAC antagonist 3-APMPA. Figure 1Ashows currents evoked by puffing GABA onto the dendrites of an OFF cone bipolar cell. The response reached peak amplitude in 128 msec and decayed to 37% of peak current amplitude (D37) in 226 msec. In a population of bipolar cells, the average D37and time-to-peak were 244 ± 24 msec (n = 16) and 100 ± 13 msec (n = 16), respectively (see Fig.3B,C). Bicuculline effectively blocked the GABA-evoked current depicted in Figure1A, reducing the charge transfer (measured by integrating the area under the current trace, see Materials and Methods) to 18% of control levels, and 3-APMPA abolished the small bicuculline-resistant component. Figure 1Billustrates that similar results were observed across a population of bipolar cells, consisting of rod, ON cone, and OFF cone bipolar cell classes. No differences between these bipolar cell types were found. These results suggest that GABAergic inhibition with a large GABAA component and a much smaller GABAC component may modulate bipolar cell responses to photoreceptor input.
Fig. 1.

GABAA receptors predominate on bipolar cell dendrites. A, Current responses evoked by puffing GABA (200 μm pipette concentration) onto bipolar cell dendrites. Horizontal bar above the current traces denotes the duration of the puff in this and all subsequent figures. The control current had a time-to-peak of 128 msec and a D37 of 226 msec. Bicuculline (200 μm) reduced the response charge transfer to 18% of control (Bic). 3-APMPA (300 μm) decreased the bicuculline-resistant component to 2% of control (Bic & 3A).B, Effects of bicuculline and 3-APMPA on a mixed population of bipolar cells. On average, bicuculline (Bic) reduced the charge transfer to 14 ± 2% (n = 15) of control. The bicuculline-resistant component was reduced to 2.3 ± 0.8% of control by the subsequent addition of 3-APMPA (Bic/3A;n = 12). Currents recovered to 82 ± 6% of control levels upon washout of antagonist (Wash;n = 15).
Fig. 3.

GABAA and GABACreceptor-mediated currents have distinct time courses.A, Current responses evoked by puffing GABA (200 μm pipette concentration) onto the axon terminals of a single rod bipolar cell in the presence of either bicuculline (200 μm) (thin trace,GABAC) or 3-APMPA (300 μm) (thick trace,GABAA). For comparison, thetrace marked GABAA has been scaled to the amplitude of the trace markedGABAC. Vertical calibration bar: GABAC, 50 pA; GABAA, 27 pA. In the presence of 3-APMPA, the GABAA receptor-mediated current had aD37 of 112 msec and a time-to-peak of 58 msec. The GABAC component, recorded in the presence of bicuculline, had a D37 of 1037 msec and a time-to-peak of 170 msec. B, C, Time course data for currents evoked at the dendrites or axon terminals in a mixed population of bipolar cells. B, The averageD37 of currents evoked at the dendrites (black bar) was 244 ± 24 msec (n = 16). For responses evoked at the terminals (white bars), the average D37of currents mediated by GABAA receptors (labeledA) was 225 ± 20 msec (n = 36) and by GABAC receptors (labeled C) was 677 ± 66 msec (n = 40). The averageD37 of GABAA receptors on the axon terminals was significantly different from GABACreceptors on the terminals (p < 0.001), but not from GABA receptors on the dendrites (p= 0.3). C, Currents evoked at the dendrites (black bar) reached peak amplitude in an average of 100 ± 13 msec (n = 16). For currents evoked at the axon terminals (white bars), the average time-to-peak of the GABAA component (labeledA) was 120 ± 12 msec (n = 36) and of the GABAC component (labeled C) was 192 ± 15 msec (n = 40). The average time-to-peak of GABAA receptors on the terminals was significantly different from GABAC receptors on the terminals (p < 0.001), but not from dendritic GABA receptors (p = 0.1).
The time course of GABA-evoked currents at axon terminals varies with bipolar cell class
Mammalian bipolar cell axon terminals in the IPL express both GABAA and GABAC receptors and receive input from GABAergic amacrine cells (Chun and Wässle, 1989; Pourcho and Owczarzak, 1989; Feigenspan et al., 1993; Lukasiewicz and Wong, 1997). Currents mediated by GABAC receptors decay slowly compared with responses mediated by GABAA receptors; however, it is unknown how each receptor subtype contributes to the overall time course of the GABAergic response of a bipolar cell. Therefore, we examined the characteristics of currents evoked by puffing GABA onto the axon terminals of rod, ON cone, and OFF cone bipolar cells. Typical examples of these cell types are illustrated in Figure 2A.
We found that distinct bipolar cell classes exhibited variations in the time course of GABA-elicited currents. The current traces in Figure2B illustrate the marked difference in the time courses of GABA-evoked currents in an OFF cone and a rod bipolar cell. The response of the OFF bipolar cell reached peak amplitude in 71 msec and decayed to 37% of peak amplitude in 284 msec. The time-to-peak andD37 of the rod bipolar cell response were 213 and 1044 msec, respectively. The averageD37 and time-to-peak data for three populations of bipolar cells are summarized in the bar graph in Figure2B. These data show a general trend for GABA-evoked currents to decay slowly in rod, somewhat faster in ON cone, and most rapidly in OFF cone bipolar cells, but do not reveal differences among these bipolar cells in the time required to reach peak current amplitude.
Consistent with previous studies in expression systems, isolated rod bipolar cells, and retinal slices, our current findings demonstrated that the kinetics of GABAA receptor-mediated responses were much faster than those of GABACreceptor-mediated currents (Qian and Dowling, 1993, 1995; Amin and Weiss, 1994; Lukasiewicz and Wong, 1997; Lukasiewicz and Shields, 1998a). We recorded responses evoked by puffing GABA onto the axon terminals in the presence of either the GABAAantagonist bicuculline or the GABAC antagonist 3-APMPA. Figure 3A shows pharmacologically isolated GABAA and GABAC receptor-mediated currents recorded from a rod bipolar cell. For comparison, the GABAAresponse is scaled to the amplitude of the GABACresponse. The GABAA receptor-mediated current reached its peak amplitude in 58 msec and had aD37 of 112 msec, whereas the GABAC component reached peak amplitude in 170 msec and had a D37 of 1037 msec. Figure 3, B and C, shows that, across all classes of bipolar cells, the average D37 and time-to-peak for responses evoked at the terminals were significantly faster for GABAA than for GABAC receptors. Note that the averageD37 and time-to-peak of currents mediated by GABAA receptors on the terminals were similar to those of responses evoked at the dendrites in which GABAA receptors predominate. Likewise, neither the peak amplitude nor the total charge transfer were significantly different between GABAA receptor-mediated currents elicited at the terminals and total currents evoked at the dendrites. In contrast, the peak amplitude was similar (p = 0.26) and the total charge transfer was greater (p < 0.001) in total currents evoked at the axon terminals compared with total responses elicited at the dendrites. This result is consistent with the idea that GABAC receptors are abundant at bipolar cell axon terminals but primarily absent from the dendrites.
The relative expression of GABAA and GABACreceptors varies with bipolar cell class
Because of the distinct kinetics of GABAA and GABAC receptors, their relative expression on bipolar cell terminals could underlie differences in the time course of GABAergic inhibition between cell classes. To determine whether the relative expression of GABAA and GABAC receptors on bipolar cell terminals could account for the differences in response time course, we recorded GABA-evoked currents in the presence and absence of specific GABA receptor antagonists.
Our pharmacological studies revealed differences among rod, ON cone, and OFF cone bipolar cells in the proportion of GABAA and GABAC receptors present on axon terminals. The current traces in Figure4 were recorded from a rod, an ON cone, and an OFF cone bipolar cell. Bicuculline and 3-APMPA differed in their ability to antagonize GABA-evoked currents in these three morphologically distinct bipolar cells. As shown in Figure4A–C (left column,Bicuculline), the GABAA antagonist bicuculline reduced GABA-evoked currents most effectively in the OFF cone, less in the ON cone, and least in the rod bipolar cell. The GABAC antagonist 3-APMPA (right column, 3-APMPA), however, was most effective in the rod bipolar cell and least effective in the OFF cone bipolar cell.
Fig. 4.

Effects of bicuculline and 3-APMPA on currents evoked in three morphologically distinct bipolar cells. Thin traces (Control in A) are currents elicited by puffing GABA (200 μm pipette concentration) onto the axon terminals in the absence of GABAergic antagonists. A–C, Compared with control levels, bicuculline (200 μm) (left column,thick traces, Bic) reduced the charge transfer to 82% in a rod (A), 53% in an ON cone (B), and 33% in an OFF cone bipolar cell (C). Relative to control, 3-APMPA (300 μm) (right column, thick traces, 3-A) decreased the charge transfer to 11% in the rod (A), 34% in the ON cone (B), and 57% in the OFF cone bipolar cell (C). The combination of bicuculline and 3-APMPA abolished responses in each of the three bipolar cells (0–6% of control levels; data not shown).
Figure 5A shows that bicuculline most effectively reduced the charge transfer of GABA-elicited responses in OFF cone bipolar cells, but was less effective in ON cone and least effective in rod bipolar cells. In contrast, Figure 5B shows that the effects of 3-APMPA were smallest in OFF cone, greater in ON cone, and greatest in rod bipolar cells. These results suggest that the ratio of GABAC to GABAA receptors expressed on axon terminals varies among cell types. The GABAC component was highest in rod bipolar cells, generally intermediate in ON cone bipolar cells, and lowest in OFF cone bipolar cells. Within the ON and OFF cone bipolar cell populations, however, there are exceptions to this trend that were not readily apparent in the population data.
Fig. 5.

Differential effects of GABAergic antagonists on currents evoked in distinct classes of bipolar cells. A, Effects of bicuculline on the charge transfer of currents evoked by puffing GABA (200 μm pipette concentration) onto the axon terminals. Relative to control, bicuculline (200 μm) reduced the charge transfer to 83 ± 4% (n = 12) in rod (Rod), 71 ± 4% (n = 11) in ON cone (ON), and 54 ± 6% (n = 15) in OFF cone (OFF) bipolar cells. The percent blockade by bicuculline was significantly different between rod and ON cone (p = 0.03), rod and OFF cone (p < 0.001), and ON cone and OFF cone (p = 0.01) bipolar cell populations. B, Relative to control levels, 3-APMPA (300 μm) reduced the charge transfer to 15 ± 3% (n = 9) in rod (Rod), 37 ± 6% (n = 10) in ON cone (ON), and 65 ± 6% (n = 12) in OFF cone (OFF) bipolar cells. The reduction by 3-APMPA was significantly different between populations of rod and ON (p = 0.005), rod and OFF (p < 0.001), and ON and OFF bipolar cells (p = 0.003). In all cells, the combination of bicuculline and 3-APMPA abolished GABA-evoked currents (2.4 ± 0.4% of control levels; n = 50; data not shown).
As shown in Figures 2 and 3, OFF cone bipolar cell responses were very brief compared with those of rod and ON cone bipolar cells, and currents mediated by GABAA receptors were very transient compared with those mediated by GABACreceptors. Together with the finding that the relative expression of GABAA and GABAC receptors on axon terminals varies with cell class, our time course data suggest that the relative expression of GABA receptor subtypes may influence response kinetics. That is, currents in cells with a high GABAC to GABAA ratio are longer lasting relative to currents in cells with a lower GABAC to GABAA ratio. Although there is a possibility for additional contributions from other factors, such as differences in GABA uptake mechanisms, receptor subunit composition, and barriers to diffusion, our data support a role for the relative expression of GABAA and GABAC receptors in determining the time course of GABAergic inhibition in mammalian retinal neurons.
GABAergic IPSCs in bipolar cells
The data reported above confirm that ferret bipolar cell terminals express functional GABAA and GABAC receptors but do not indicate whether both receptor classes participate in synaptic responses. To determine whether synaptic stimuli activate one or both receptor subtypes, we recorded GABAergic IPSCs evoked by puffing kainate (500 μm) in the IPL to depolarize amacrine cell processes. The IPSC depicted in Figure 6 was partially blocked by bicuculline (200 μm) and completely abolished with the addition of 3-APMPA (300 μm). In six bipolar cells, bicuculline reduced the charge transfer of the IPSC to 29 ± 12% of control. 3-APMPA decreased the charge transfer to 8.8 ± 2.3% (n = 8) of control values. In all cells, the combination of bicuculline and 3-APMPA blocked the response (1.8 ± 1.3% of control), and IPSCs recovered to 62 ± 5.8% of control (n = 10).
Fig. 6.

GABAA and GABAC receptors mediate GABAergic IPSCs. Current responses evoked in an ON cone bipolar cell by puffing kainate (500 μm) in the IPL. Bicuculline (200 μm) decreased the response charge transfer to 31% (Bic), and 3-APMPA (300 μm) reduced the bicuculline-resistant component to 4% of control (Bic & 3A). Upon washout of antagonist, the IPSC charge transfer recovered to 75% of control.
Immunolabeling for GABAA and GABACreceptors in the OPL and IPL
Our physiological recordings suggest that responses evoked by puffing GABA in the OPL are dominated by GABAAreceptors, whereas responses to puffing in the IPL comprised GABAA and GABAC components. To correlate this finding with the anatomical distribution of these receptor subtypes, we immunolabeled ferret retinal sections for the β2/3 subunit of the GABAA receptor and for the ρ subunit of the GABAC receptor (Fig.7). Immunoreactivity for the β2/3 subunit (Fig. 7A) was intense in both the IPL and OPL. In addition, some cell bodies in the inner nuclear layer (INL) and the dendritic processes of these cells also appeared labeled (Fig.7A). Strong, punctate immunolabeling for the ρ subunit was also clearly evident in the IPL (Fig. 7B). However, ρ subunit labeling differed from β2/3 subunit staining in two ways. Unlike β2/3 subunit labeling, ρ subunit immunoreactivity was strongly concentrated in two bands in the IPL, one band in the proximal (ON) and the other in the distal (OFF) sublamina. In addition, ρ subunit immunoreactivity in the OPL was relatively weak, if at all present (Fig. 7B). Together, these data suggest that the patterns of immunostaining in the ferret retina were distinct for the GABAA and GABAC subunits. In addition, the pattern of immunolabeling for GABAA and GABAC receptor subunits lends support to the physiological findings that GABA-evoked responses in the ferret OPL are mainly mediated by GABAA receptors and that responses in the IPL are mediated by both GABAA and GABAC receptors.
Fig. 7.

Confocal images of GABAA(A) and GABAC(B) receptor immunostaining in the adult ferret retina. Arrows in A point to two putative bipolar cells that showed dendritic labeling. C, Control section for GABAC staining in which the primary antibody was omitted. Images in B and C were acquired with the same objective (40×) and at the same laser intensity, gain, and black level.
Immunolabeling for GABAA and GABACreceptors on distinct bipolar cell classes
Our physiological recordings also suggest that the relative proportions of GABAA and GABAC receptors on the axons of bipolar cells varied with cell type. In particular, rod bipolar cells appeared to have responses mediated predominantly by GABACreceptors, whereas ON and OFF cone bipolar cells showed a variety of responses that could reflect differences in receptor complements. To relate the physiological results to the anatomical expression of the two ionotropic GABA receptor subtypes, we compared the patterns of immunolabeling for the GABAA receptor β2/3 subunit and the GABAC ρ subunit with immunolabeling for rod and cone (ON and OFF) bipolar cells.
Rod and cone bipolar cells can be distinguished in the ferret retina by immunolabeling for PKC, recoverin, and calbindin (Figs.8, 9, all shown in green) (Miller et al., 1999). Rod bipolar cells are immunoreactive for PKC, subpopulations of ON and OFF cone bipolar cells label for recoverin, and a subset of ON cone bipolars express calbindin. Figure 8 illustrates the spatial distribution of the axon terminals of ferret rod and cone bipolar cells relative to the distribution of GABAA (Fig. 8, blue) and GABAC subunits (Figs. 8, 9, red). Rod bipolar cells (PKC-positive) had axon terminals that stratified in the inner two-fifths of the IPL in a region that overlaps with the inner band of GABAC ρ subunit staining (Fig. 8A). Two major subsets of recoverin-positive bipolar cells could be identified; one population had axon terminals that stratified in the outer IPL, corresponding to the outer ρ subunit band, whereas the terminals of the other population stratified primarily in the sublamina of the IPL that had only weak or sparse GABAC staining (Fig. 8C). Calbindin-positive bipolar cells had axon terminals that also stratified primarily in the inner band strongly labeled for GABAC receptors (Fig. 8E).
Fig. 8.
Top. Confocal images (eachpanel represents the maximum intensity projection of a stack of 10–15 images) demonstrating patterns of immunostaining for bipolar cells, GABAA, and GABACreceptors in the adult ferret retina. GABAC receptor immunolabeling is encoded in red, whereas GABAA receptors are in shown in blue. PKC (A, B), recoverin (C,D), and calbindin (E) immunolabeling for bipolar cells are shown in green.
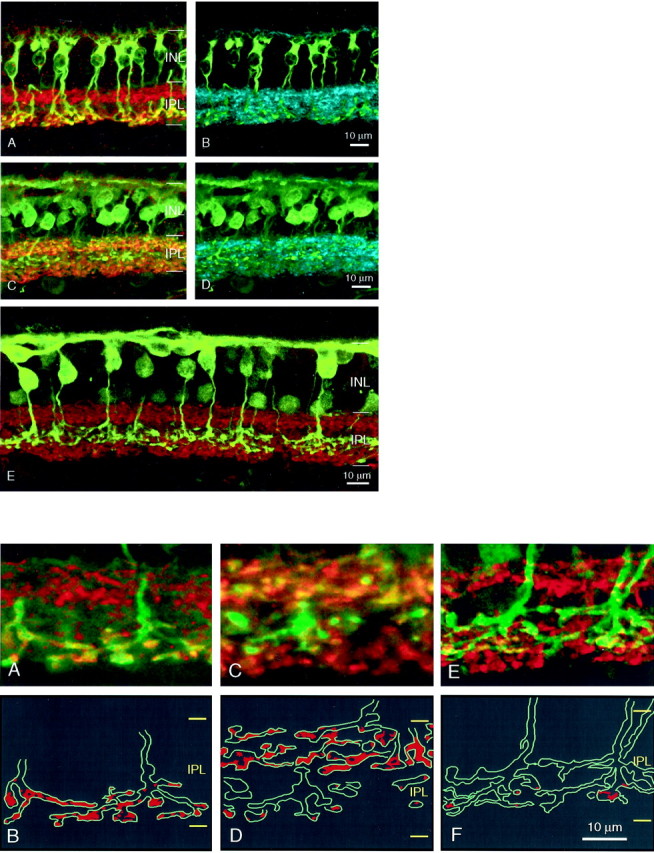
Fig. 9.
Bottom. High magnification of the maximum intensity projections of short z-stacks of 10–15 images of the IPL showing colabeling of GABAC receptors (red) with bipolar cell axon terminals (green). Bipolar cell terminals were labeled for PKC (A), recoverin (C), and calbindin (E). Silhouettes of the labeled bipolar terminals in A, C, and E are shown in B, D, and F, respectively. Colocalization with GABAC staining is represented by the red profiles, determined after 3-D rotation of the image stacks.
GABAA β2/3 subunit staining showed no unique spatial correspondence to the PKC- or recoverin-positive terminals (Fig. 8B,D). The spatial relationship between the location of the axon arbor and the distribution of GABAA β2/3 subunit could not be assessed for calbindin labeling (see Materials and Methods).
To more directly associate the spatial distribution of GABA receptors with the axon terminals of the bipolar cells, we obtained high-magnification 3-D reconstructions of the IPL in the immunolabeled sections. GABAA β2/3 subunit staining was extremely dense and the puncta small compared with ρ-subunit staining, rendering it difficult to observe colocalization of this receptor subunit with axonal profiles. We thus focused our analysis on the colocalization of ρ subunit staining with PKC-, recoverin-, and calbindin-labeled axon terminals. We first obtained a short stack of confocal images through the region of interest at fine z-steps (0.1 μm) and then reconstructed and rotated the images in 3-D. This enabled us to more confidently follow and confirm colocalization of receptor puncta with immunolabeling for the various bipolar cell markers. Only ρ subunit-positive staining or puncta that merged with an axonal profile in all 3-D views were considered to be colocalized with the process. These regions are shaded within anoutline of the axon terminals that were reconstructed and represented as a z-projection of the stack in Figure 8, B,D, and F.
There was clear and qualitatively extensive colocalization of ρ subunit staining with PKC-immunoreactive terminals in the IPL (Fig.9A,B), supporting the physiological finding that responses evoked by puffing at the axon terminals of these cells are primarily mediated by GABAC receptors. Recoverin-positive terminals showed two contrasting patterns of colocalization. Terminals in the outer IPL were heavily colocalized with ρ subunit immunostaining, whereas those in the inner IPL had relatively little GABAC staining (Fig.9C,D). Thus, some OFF cone bipolar cells with a relatively large GABAC-mediated component in their physiological response may correspond to recoverin-positive cells with terminals in the distal IPL. Finally, like ON recoverin-positive bipolar cells, the axon terminals of calbindin-labeled bipolar cells also bore little GABAC staining, despite their stratification within the inner band of GABACexpression (Fig. 9E,F).
DISCUSSION
Differential distribution of ionotropic GABA receptors on axons and dendrites
GABAA and GABACreceptors differ in their kinetics and affinity for GABA. In this study, we show that these subtypes of GABA receptors have a differential spatial distribution on ferret bipolar cells. Our physiological results demonstrated that bipolar cell dendrites primarily expressed GABAA receptors and the axon terminals possessed combinations of GABAA and GABAC receptors, which varied with bipolar cell type. Consistent with the different functional properties of GABAA and GABAC receptors, we found that GABA responses at the dendrites and axon terminals were temporally distinct. Our immunocytochemical staining for GABA receptor subunits corroborated our physiological data. Similar to results in other mammalian species, our immunolabeling for GABAA and GABAC subunits showed a differential spatial distribution in which label for the GABAA subunit was intense in the IPL and OPL, and staining for the GABAC subunit was strong in the IPL but weak in the OPL. (Greferath et al., 1993, 1994, 1995; Enz et al., 1996; Koulen et al., 1997).
GABAA receptors and postsynaptic inhibition
Postsynaptic inhibition mediated by dendritic GABAA receptors is a common feature of most CNS neurons and presumably functions to modulate neuronal responses to excitatory inputs. Our physiological and immunocytochemical data demonstrate that GABAA receptors play the major role in mediating dendritic GABA responses in all bipolar cell classes. In contrast, GABAC receptors contribute minimally to dendritic responses and exhibit only weak labeling in the OPL. Dendritic GABAA receptors most likely receive GABAergic input from interplexiform and horizontal cells (Fisher and Boycott, 1974; Kolb and West, 1977; Chun and Wässle, 1989;Pourcho and Owczarzak, 1989). The function of dendritic GABA receptors in information processing is unknown. A possible role for these GABA receptors would be to modulate the inhibitory surround of bipolar cells, but the results of recent studies in salamander conflict with this possibility (Hare and Owen, 1996; Cook and McReynolds, 1998). Although the precise function of GABA receptors on bipolar cell dendrites is unclear, they likely function in regulating responses to glutamatergic input, similar to other dendritic GABAA receptors in the CNS.
Relative roles of GABAA and GABAC receptors in presynaptic inhibition
In the CNS, the activation of ionotropic receptors on the axon terminal can modulate the release of neurotransmitters (for review, see MacDermott et al., 1999). Glutamate release from the axon terminals of salamander retinal bipolar cells is most likely modulated by two types of ionotropic GABA receptors (Lukasiewicz and Werblin, 1994; Dong and Werblin, 1998). These two receptor subtypes can be simultaneously activated by GABA puffed onto the terminals or by GABA released from presynaptic amacrine cells. Both our time course and pharmacological data reveal two components in the GABA-evoked response, indicating that both GABAAand GABAC receptors mediate these currents in ferret bipolar cell terminals. These observations are corroborated by our immunocytochemical staining for GABAA and GABAC receptor subunits.
Why are two ionotropic receptors for GABA necessary to modulate glutamate release from the bipolar terminals? Because of the distinct affinities and kinetics of the GABAA and GABAC receptors, a combination of these receptors on a single axon terminal offers a much larger dynamic range in the summed response to GABA than the expression of either subtype alone. For example, compared with GABAA, GABAC receptors can respond to much lower concentrations of GABA. Furthermore, activation of GABAC receptors yields a more sustained inhibition relative to that provided by GABAAreceptors. Because the release of glutamate from bipolar cells can be relatively slow and sustained compared with that from a spiking neuron, GABAC receptors can provide inhibition that is temporally matched to the kinetics of this release. In contrast, GABAA receptors, which mediate fast responses to GABA, offer the ability to rapidly and transiently suppress glutamate release. The idea that the temporal characteristics of inhibitory currents shape the timing of the suppression of bipolar cell activity was examined by Pan and Lipton (Pan and Lipton, 1995). They demonstrated that inhibitory currents mediated by GABAA receptors rapidly and transiently suppressed depolarization-induced Ca2+currents in dissociated rat bipolar cells. In contrast, GABAC receptor-mediated suppression of the Ca2+ current was slower in onset and more sustained. Furthermore, Dong and Werblin (1998) showed that GABAC (and not GABAA) receptors are responsible for the inhibition of maintained glutamate release from bipolar cells, which may underlie the generation of transient excitation in ganglion cells (Dong and Werblin, 1998).
Immunocytochemical staining suggests that GABAAand GABAC receptor subunits do not colocalize at the same synaptic sites (Koulen et al., 1998). Apart from the distinct properties of GABAA and GABAC receptors, differences in the spatial location of these receptor subtypes relative to synaptic sites may also contribute to the regulation of release from bipolar terminals. One possibility is that low-affinity GABAA receptors are located at GABAergic synapses, whereas higher-affinity GABAC receptors are distributed extrasynaptically in which they could respond to GABA spillover into extrasynaptic space. This arrangement exists in the rat cerebellum in which high-affinity extrasynaptic GABAA receptors with δ subunits mediate a sustained response, and lower-affinity synaptic GABAA receptors without δ subunits mediate transient responses (Nusser et al., 1998). Recent ultrastructural evidence, however, suggests that GABAC receptors cluster at synaptic sites in rat retina (Koulen et al., 1998). Furthermore, our study demonstrated that both GABAA and GABAC receptors mediate GABAergic IPSCs. These findings suggest that GABAC receptors can be activated synaptically but do not exclude the possibility of activation by spillover of GABA from distant release sites. If GABAA and GABAC receptors are located at distinct synapses, perhaps each receives input from different types of GABAergic amacrine cells. Such an arrangement has been observed in the hippocampus in which two kinetically distinct GABAA synaptic responses are mediated by different inhibitory circuits (Banks et al., 1998).
Differences in the relative expression of GABAA and GABAC receptors on distinct classes of bipolar cells
Results of experiments in both ferret and rat indicate that the GABAA to GABAC receptor ratio varied among different morphological classes of bipolar cells (Euler and Wässle, 1998). In our experiments, focal puffs of GABA onto either the dendritic or axonal arbors of ferret bipolar cells evoked responses that showed differences in the GABAA to GABAC receptor ratio specifically for currents elicited at the axon terminals. In the rat, responses were evoked by bath application of GABA, which presumably activated dendritic as well as axonal GABA receptors (Euler and Wässle, 1998). These responses showed differences in the GABAA to GABAC receptor ratio for currents mediated simultaneously by dendritic and axonal GABA receptors. Thus, differences in GABA application methodologies may explain any discrepancies between these two studies.
In both ferret and rat (Euler and Wässle, 1998), rod bipolar cells clearly possess the highest GABAC to GABAA ratio. This high ratio is confirmed by immunocytochemical localization of GABAC receptor staining to PKC-positive bipolar cells in retinae of the ferret and other species (Enz et al., 1996; Koulen et al., 1997). Our population data also suggest a general trend for the component of the response mediated by GABAC receptors to increase from OFF cone to ON cone to rod bipolar cells. However, there are some exceptions to this trend within ON and OFF cone populations. For example, a subpopulation of OFF bipolar cells showed a relatively large GABAC component compared with other OFF bipolar cells. From our immunocytochemical staining for GABAC receptors, this population may correspond to that which is immunopositive for recoverin. In contrast, some ON bipolar cells appear to have a small GABACcomponent. These cells may be the calbindin- and recoverin-positive ON bipolar cells identified in our immunocytochemistry.
Why do distinct classes of bipolar cells express different ratios of GABAC to GABAA receptors on their axon terminals? One possibility is to match the temporal characteristics of excitatory and inhibitory responses. The kinetic properties of responses in the rod and cone pathways are distinct. Rod light responses are 10 times slower than cone responses, and the kinetics of synaptic transfer are 10 times longer at rod synapses than at cone synapses (Schnapf and Copenhagen, 1982). Noise analysis indicates that cone-mediated synaptic events in ON bipolar cells were longer than those in OFF bipolar cells (Ashmore and Copenhagen, 1980), consistent with the notion of slower synaptic transfer in the ON cone pathway compared with the OFF cone pathway. These differences are most likely attributable to the presence of metabotropic glutamate receptors on ON bipolar cell dendrites (Slaughter and Miller, 1981; Nawy and Jahr, 1990) and kainate receptors on OFF bipolar cell dendrites (Devries and Schwartz, 1999). Our results show that the kinetics of inhibition at the bipolar cell terminals is matched to the kinetics of the excitatory responses in different classes of bipolar cells. Rod bipolar cells have the slowest excitatory responses and the largest complement of GABAC receptors, whereas OFF cone bipolar cells have the fastest excitatory responses and generally possess the largest complement of GABAAreceptors. This arrangement may ensure that inhibitory currents are sustained enough to prevent rebound excitation, yet brief enough to permit responses to subsequent stimuli.
Footnotes
This work was supported by National Institutes of Health Grants EY08922 (P.D.L.), EY07057 (C.R.S.), EY10699 (R.O.L.W.), and EY02687 (Department of Ophthalmology), and Research to Prevent Blindness. We thank Dr. Paul B. Cook, Dr. Carl Romano, and Matt Higgs for their insightful comments on this manuscript.
Correspondence should be addressed to Dr. Peter D. Lukasiewicz, Department of Ophthalmology and Visual Sciences, Campus Box 8096, Washington University School of Medicine, St. Louis, MO 63110-1093. E-mail: lukasiewicz@vision.wustl.edu.
REFERENCES
- 1.Ames A, Nesbett FB. In vitro retina as an experimental model of the central nervous system. J Neurochem. 1981;37:867–877. doi: 10.1111/j.1471-4159.1981.tb04473.x. [DOI] [PubMed] [Google Scholar]
- 2.Amin J, Weiss DS. Homomeric ρ1 GABA channels: activation properties and domains. Receptors Channels. 1994;2:227–236. [PubMed] [Google Scholar]
- 3.Ashmore JF, Copenhagen DR. Different postsynaptic events in two types of retinal bipolar cell. Nature. 1980;288:84–86. doi: 10.1038/288084a0. [DOI] [PubMed] [Google Scholar]
- 4.Banks MI, Li T-B, Pearce RA. The synaptic basis of GABAA,slow. J Neurosci. 1998;18:1305–1317. doi: 10.1523/JNEUROSCI.18-04-01305.1998. [DOI] [PMC free article] [PubMed] [Google Scholar]
- 5.Belgum JH, Dvorak DR, McReynolds JS. Strychnine blocks transient but not sustained inhibition in mudpuppy retinal ganglion cells. J Physiol (Lond) 1984;354:273–286. doi: 10.1113/jphysiol.1984.sp015375. [DOI] [PMC free article] [PubMed] [Google Scholar]
- 6.Bormann J, Feigenspan A. GABAC receptors. Trends Neurosci. 1995;18:515–519. doi: 10.1016/0166-2236(95)98370-e. [DOI] [PubMed] [Google Scholar]
- 7.Chun M, Wässle H. GABA-like immunoreactivity in the cat retina: electron microscopy. J Comp Neurol. 1989;279:55–67. doi: 10.1002/cne.902790106. [DOI] [PubMed] [Google Scholar]
- 8.Cook PB, McReynolds JS. Lateral inhibition in the inner retina is important for spatial tuning of ganglion cells. Nat Neurosci. 1998;1:714–719. doi: 10.1038/3714. [DOI] [PubMed] [Google Scholar]
- 9.Devries SH, Schwartz EA. Kainate receptors mediate synaptic transmission between cones and OFF bipolar cells in a mammalian retina. Nature. 1999;397:157–160. doi: 10.1038/16462. [DOI] [PubMed] [Google Scholar]
- 10.Dong C, Werblin FS. Temporal contrast enhancement via GABAC feedback at bipolar terminals in the tiger salamander retina. J Neurophysiol. 1998;79:2171–2180. doi: 10.1152/jn.1998.79.4.2171. [DOI] [PubMed] [Google Scholar]
- 11.Enz R, Brandstätter JH, Wässle H, Bormann J. Immunocytochemical localization of the GABAC receptor ρ subunits in the mammalian retina. J Neurosci. 1996;16:4479–4490. doi: 10.1523/JNEUROSCI.16-14-04479.1996. [DOI] [PMC free article] [PubMed] [Google Scholar]
- 12.Euler T, Wässle H. Immunocytochemical identification of cone bipolar cells in the rat retina. J Comp Neurol. 1995;361:461–478. doi: 10.1002/cne.903610310. [DOI] [PubMed] [Google Scholar]
- 13.Euler T, Wässle H. Different contributions of GABAA and GABAC receptors to rod and cone bipolar cells in a rat retinal slice preparation. J Neurophysiol. 1998;79:1384–1395. doi: 10.1152/jn.1998.79.3.1384. [DOI] [PubMed] [Google Scholar]
- 14.Famiglietti EV, Jr, Kolb H. Structural basis for ON- and OFF-center responses in retinal ganglion cells. Science. 1976;194:193–195. doi: 10.1126/science.959847. [DOI] [PubMed] [Google Scholar]
- 15.Feigenspan A, Bormann J. Differential pharmacology of GABAA and GABAC receptors on rat retinal bipolar cells. Eur J Pharmacol. 1994;288:97–104. doi: 10.1016/0922-4106(94)90014-0. [DOI] [PubMed] [Google Scholar]
- 16.Feigenspan A, Wässle H, Bormann J. Pharmacology of GABA receptor Cl− channels in rat retinal bipolar cells. Nature. 1993;361:159–162. doi: 10.1038/361159a0. [DOI] [PubMed] [Google Scholar]
- 17.Fisher SK, Boycott BB. Synaptic connexions made by horizontal cells within the outer plexiform layer of the retina of the cat and the rabbit. Proc R Soc Lond B Biol Sci. 1974;186:317–331. doi: 10.1098/rspb.1974.0052. [DOI] [PubMed] [Google Scholar]
- 18.Greferath U, Müller F, Wässle H, Shivers B, Seeburg P. Localization of GABAA receptors in the rat retina. Vis Neurosci. 1993;10:551–561. doi: 10.1017/s0952523800004764. [DOI] [PubMed] [Google Scholar]
- 19.Greferath U, Grünert U, Müller F, Wässle H. Localization of GABAA receptors in the rabbit retina. Cell Tissue Res. 1994;276:295–307. doi: 10.1007/BF00306115. [DOI] [PubMed] [Google Scholar]
- 20.Greferath U, Grünert U, Fritschy JM, Stephenson A, Mohler H, Wässle H. GABAA receptor subunits have differential distributions in the rat retina: in situ hybridization and immunohistochemistry. J Comp Neurol. 1995;353:553–571. doi: 10.1002/cne.903530407. [DOI] [PubMed] [Google Scholar]
- 21.Hamill OP, Marty A, Neher E, Sakmann B, Sigworth FJ. Improved patch clamp techniques for high resolution current recording from cells and cell-free patches. Pflügers Arch. 1981;391:85–100. doi: 10.1007/BF00656997. [DOI] [PubMed] [Google Scholar]
- 22.Hare WA, Owen G. Receptive field of the retinal bipolar cell: a pharmacological study in the tiger salamander. J Neurophysiol. 1996;76:2005–2019. doi: 10.1152/jn.1996.76.3.2005. [DOI] [PubMed] [Google Scholar]
- 23.Hevers W, Lüddens H. The diversity of GABAA receptors: pharmacological and electrophysiological properties of GABAA channel subtypes. Mol Neurobiol. 1998;18:35–86. doi: 10.1007/BF02741459. [DOI] [PubMed] [Google Scholar]
- 24.Kolb H, West RW. Synaptic connections of the interplexiform cell in the retina of the cat. J Neurocytol. 1977;6:155–170. doi: 10.1007/BF01261503. [DOI] [PubMed] [Google Scholar]
- 25.Koulen P, Brandstätter JH, Kroger S, Enz R, Bormann J, Wässle H. Immunocytochemical localization of the GABAC receptor ρ subunits in the cat, goldfish and chicken retina. J Comp Neurol. 1997;380:520–532. doi: 10.1002/(sici)1096-9861(19970421)380:4<520::aid-cne8>3.0.co;2-3. [DOI] [PubMed] [Google Scholar]
- 26.Koulen P, Brandstätter JH, Enz R, Bormann J, Wässle H. Synaptic clustering of GABAC receptor ρ-subunits in rat retina. Eur J Neurosci. 1998;10:115–127. doi: 10.1046/j.1460-9568.1998.00005.x. [DOI] [PubMed] [Google Scholar]
- 27.Lukasiewicz PD. GABAC receptors in the vertebrate retina. Mol Neurobiol. 1996;12:211–224. doi: 10.1007/BF02755587. [DOI] [PubMed] [Google Scholar]
- 28.Lukasiewicz PD, Roeder RC. Evidence for glycine modulation of excitatory synaptic inputs to retinal ganglion cells. J Neurosci. 1995;15:4592–4601. doi: 10.1523/JNEUROSCI.15-06-04592.1995. [DOI] [PMC free article] [PubMed] [Google Scholar]
- 29.Lukasiewicz P, Shields C. Different combinations of GABAA and GABAC receptors confer distinct temporal properties to retinal synaptic responses. J Neurophysiol. 1998a;79:3157–3167. doi: 10.1152/jn.1998.79.6.3157. [DOI] [PubMed] [Google Scholar]
- 30.Lukasiewicz PD, Shields CR. A diversity of GABA receptors in the retina. Semin Cell Dev Biol. 1998b;9:293–299. doi: 10.1006/scdb.1998.0238. [DOI] [PubMed] [Google Scholar]
- 31.Lukasiewicz P, Werblin F. A slowly inactivating potassium current truncates spike activity in ganglion cells of the tiger salamander retina. J Neurosci. 1988;8:4470–4481. doi: 10.1523/JNEUROSCI.08-12-04470.1988. [DOI] [PMC free article] [PubMed] [Google Scholar]
- 32.Lukasiewicz PD, Werblin FS. A novel GABA receptor modulates synaptic transmission from bipolar to ganglion and amacrine cells in the tiger salamander retina. J Neurosci. 1994;14:1213–1223. doi: 10.1523/JNEUROSCI.14-03-01213.1994. [DOI] [PMC free article] [PubMed] [Google Scholar]
- 33.Lukasiewicz PD, Wong ROL. GABAC receptors on ferret retinal bipolar cells; a diversity of subtypes in mammals? Vis Neurosci. 1997;14:989–994. doi: 10.1017/s095252380001169x. [DOI] [PubMed] [Google Scholar]
- 34.MacDermott AB, Role LW, Sieglbaum SA. Presynaptic ionotropic receptors and the control of transmitter release. Annu Rev Neurosci. 1999;22:443–485. doi: 10.1146/annurev.neuro.22.1.443. [DOI] [PubMed] [Google Scholar]
- 35.Miller ED, Tran MN, Wong GK, Oakley DM, Wong ROL. Morphological differentiation of bipolar cells in the ferret retina. Vis Neurosci. 1999;16:1133–1144. doi: 10.1017/s0952523899166136. [DOI] [PubMed] [Google Scholar]
- 36.Mittman S, Taylor WR, Copenhagen DR. Concomitant activation of two types of glutamate receptor mediates excitation of salamander retinal ganglion cells. J Physiol (Lond) 1990;428:175–197. doi: 10.1113/jphysiol.1990.sp018206. [DOI] [PMC free article] [PubMed] [Google Scholar]
- 37.Nawy S, Jahr CE. Suppression by glutamate of cGMP-activated conductance in retinal bipolar cells. Nature. 1990;346:269–271. doi: 10.1038/346269a0. [DOI] [PubMed] [Google Scholar]
- 38.Nelson R, Famiglietti EV, Jr, Kolb H. Intracellular staining reveals different levels of stratification for On- and Off-center ganglion cells in cat retina. J Neurophysiol. 1978;41:472–483. doi: 10.1152/jn.1978.41.2.472. [DOI] [PubMed] [Google Scholar]
- 39.Nusser Z, Sieghart W, Somogyi P. Segregation of different GABAA receptors to synaptic and extrasynaptic membranes of cerebellar granule cells. J Neurosci. 1998;18:1693–1703. doi: 10.1523/JNEUROSCI.18-05-01693.1998. [DOI] [PMC free article] [PubMed] [Google Scholar]
- 40.Pan Z-H, Lipton SA. Multiple GABA receptor subtypes mediate inhibition of calcium influx at rat retinal bipolar cell terminals. J Neurosci. 1995;15:2668–2679. doi: 10.1523/JNEUROSCI.15-04-02668.1995. [DOI] [PMC free article] [PubMed] [Google Scholar]
- 41.Peichl L, Wässle H. Morphological identification of On- and Off-centre brisk transient (Y) cells in the cat retina. Proc R Soc Lond B Biol Sci. 1981;212:139–156. doi: 10.1098/rspb.1981.0030. [DOI] [PubMed] [Google Scholar]
- 42.Pourcho R, Owczarzak M. Distribution of GABA immunoreactivity in the cat retina: a light- and electron-microscopic study. Vis Neurosci. 1989;2:425–435. doi: 10.1017/s0952523800012323. [DOI] [PubMed] [Google Scholar]
- 43.Qian H, Dowling JE. Novel GABA responses from rod-driven retinal horizontal cells. Nature. 1993;361:162–164. doi: 10.1038/361162a0. [DOI] [PubMed] [Google Scholar]
- 44.Qian H, Dowling JE. GABAA and GABAC receptors on hybrid bass retinal bipolar cells. J Neurophysiol. 1995;74:1920–1928. doi: 10.1152/jn.1995.74.5.1920. [DOI] [PubMed] [Google Scholar]
- 45.Schnapf JL, Copenhagen DR. Differences in the kinetics of rod and cone synaptic transmission. Nature. 1982;296:862–864. doi: 10.1038/296862a0. [DOI] [PubMed] [Google Scholar]
- 46.Slaughter MM, Miller RF. 2-Amino-4-phosphonobutyric acid: a new pharmacological tool for retina research. Science. 1981;211:182–185. doi: 10.1126/science.6255566. [DOI] [PubMed] [Google Scholar]
- 47.Woodward RM, Polenzani L, Miledi R. Characterization of bicuculline/baclofen-insensitive (ρ-like) gamma-aminobutyric acid receptors expressed in Xenopus oocytes. II. Pharmacology agonists and antagonists. Mol Pharmacol. 1993;43:609–625. [PubMed] [Google Scholar]