

Abstract
Biological rhythms such as cardiac and circadian rhythms arise from activity of multiple oscillators with dispersed intrinsic frequencies. It has been proposed that a stable population rhythm, fundamental to normal physiological processes, can be achieved in these systems by synchronization, through mutual entrainment, of individual oscillators. Mutual entrainment, however, is unlikely to be the mechanism underlying the generation of a stable rhythm in a population of multiple weakly coupled or uncoupled oscillators. We have recently identified such a population that is involved in the sympathetic regulation of vascular tone in a thermoregulatory circulation. In this paper, we investigate the stability of the output rhythm of these sympathetic oscillators by subjecting the system to a periodic driving force (the lung inflation cycle-related activity). We show that a population rhythm coupled to the drive can remain stable over a much wider driving frequency range compared with that of any one of its constituent oscillators. This population rhythmicity still exists despite the fact that the dominant frequencies of individual oscillators are not necessarily 1:1 frequency-locked to the drive. We provide evidence to show that this population metastability is achieved through linear and nonlinear dynamic interactions between the driving force and single sympathetic oscillators. Our study suggests that the generation of a stable population rhythm can exist even in the absence of mutual entrainment of its constituents, and this allows the population to generate a stable and flexible patterned response.
Keywords: postganglionic sympathetic neuron, neural oscillator, synchronization, entrainment, nonlinear dynamics, blood vessel, in vivo, Sprague Dawley rat
In vertebrates, the genesis of essential biological rhythms, such as cardiac (DeHaan and Hirakow, 1972; Sano et al., 1978) and circadian (Welsh et al., 1995; Herzog et al., 1998) rhythms, involves oscillatory activity generated by multiple oscillators. There is considerable demand for stability in these rhythms, yet the population is often composed of oscillators with dispersed intrinsic frequencies (fINTs). This raises the issue of how the constituent oscillators interact so that a stable population rhythm emerges. Mutual entrainment (i.e., frequency-lock) (Winfree, 1980) of individual oscillators, in the absence of an external driving force, has been proposed as a mechanism of synchronization to generate, for example, cardiac (Jalife, 1984;Michaels et al., 1986) and circadian (Liu et al., 1997) rhythms. An alternative organization has been established in a multiple oscillator population influencing vascular conductance (Johnson and Gilbey, 1994,1996; Chang et al., 1999b), where the individual oscillators are weakly coupled or uncoupled (Chang et al., 1999b). In this type of system, individual oscillators can still be entrained to a common periodic drive (Winfree, 1980; Chang et al., 1999b). However, such a mechanism is unlikely to be sufficient for producing a stable population rhythm, coupled to a driving force, over a very large frequency range, because for biological oscillators, 1:1 entrainment frequently operates only when the driving frequency is close to the intrinsic frequency of the driven oscillator (Glass and Mackey, 1988). The demand for stability of population rhythms across a wide driving frequency range may be particularly important for coordinating activity of the sympathetic nervous system and other rhythm-generating circuits such as the respiratory network (Gilbey and Spyer, 1997).
In this paper we investigated the underlying coupling dynamics that may contribute to stability and flexibility in a multiple oscillator network of this type. We did this by examining the frequency-dependent characteristics of the oscillator population in response to an external periodic input: lung inflation cycle (LIC)-related activity (Lipski et al., 1977). The oscillator activity can be conveniently monitored at single and population levels by recording the discharge behavior of postganglionic neurons (PGNs). Previous work has established that individual PGNs (sample size >100) exhibit a distinct intrinsic rhythm in their discharges that has a frequency (fINT) within a range of ∼0.4–1.2 Hz (Johnson and Gilbey, 1996; Chang et al., 1999b; and our unpublished observations). We provide evidence to show that, even outside the intrinsic frequency range of individual oscillators, a periodic input across a wide frequency range can produce a stable population rhythm. We demonstrate that a population rhythm emerged, even when individual oscillators did not exhibit 1:1 entrainment. Over a narrow LIC frequency range, near their intrinsic frequency, individual oscillators showed stable coupling and high coherence with LIC-related activity. Outside this range, coherence dropped precipitously at single oscillator level. In comparison, at the population level the 1:1 frequency response range was extended. We provide evidence to show that this feature arises from linear and nonlinear dynamic LIC–PGN interactions at the single oscillator level, which with their intrinsic frequency spread confers the population with metastability for rhythm genesis. In the sympathetic system, this metastability of synchronized neural activity is likely to be important for providing graded control of blood flow at the vascular end organ. In more general terms, complexity of single oscillator behavior may provide a mechanism for producing stable and flexible output in various rhythmic activities generated by multiple oscillators.
Part of this work has been published previously as an abstract (Chang et al., 1999a).
MATERIALS AND METHODS
General preparation and maintenance. All experiments were performed in accordance with the Animal (Scientific Procedures) Act, UK, 1986. Eighteen male Sprague Dawley rats (235–350 gm) were anesthetized with pentobarbitone (60 mg/kg, i.p.), supplemented with α-chloralose (5–10 mg, i.v.) when required. An adequate anesthetic level was indicated by the stability of blood pressure (BP) and respiratory activity, monitored by diaphragm EMG, and the absence of both corneal and paw-pinch withdrawal reflexes. The femoral artery and vein were cannulated for monitoring BP and infusing drugs, respectively. The urinary bladder was cannulated to ensure an unobstructed urinary flow. The esophageal temperature was monitored and maintained at 36.5–37°C using a heating blanket. LICs were recorded using tracheal pressure (TP) waves. Using hyperoxia induced by artificial ventilation with ∼95% oxygen, all experiments were performed during central apnea to minimize influence from central respiratory activity (Chang et al., 1999b). Quiescence of respiratory activity was indicated by the absence of diaphragm EMG activity. Samples of arterial blood (70 μl) were taken regularly (∼20–40 min) for gas and pH analyses.
Neural activity recording. The caudal ventral artery (CVA) of the tail was exposed, and the overlying connective tissue was removed. The CVA was then positioned in a bath filled with Krebs' solution. Using glass microelectrodes (internal diameter of the tip, 20–100 μm), single PGNs (n = 21 from 12 animals) were recorded focally from the surface of the CVA, and 10 of these were recorded in pairs (five pairs). PGN activity was monitored on a digital oscilloscope, and activity from single PGNs was identified by a consistent spike waveform and amplitude. For detail of the focal recording technique, see Johnson and Gilbey (1994, 1996) and Chang et al. (1999b). Population PGN activity (n = 6 from six animals) was recorded from the ventral collector nerve (VCN), which contains ∼80% of the PGN axons innervating the CVA (Sittiracha et al., 1987). The VCN was isolated from the tail, cut, desheathed, and immersed in a bath of paraffin oil. The distal end was crushed. Biplolar platinum hook electrodes were used to record nerve activity. In whole-nerve experiments, the cauda equina was cut at L5 level to remove contamination of somatic motor activity (Sittiracha et al., 1987; Smith et al., 1998). A previous study has established that using this preparation, activity recorded from the VCN is sympathetic in nature (Chang et al., 1999b).
Data collection. Neural activity was processed as described previously (Chang et al., 1999b). Briefly, PGN and diaphragm EMG activity were amplified and filtered (bandpass, 300–1000 Hz). VCN and diaphragm activity were rectified and smoothed (time constant, 100 msec). Data of 5 and 8 min length were recorded for single PGN and population PGN experiments under each ventilation condition (see Experimental protocols), respectively. Data were stored on tape for off-line analysis. In addition, BP, TP, single PGN activity, and smoothed VCN and diaphragm activity were converted to digital signals and sent to computer for analysis (sampling rate: 13.3 kHz for single PGN activity; 100 Hz for smoothed VCN and diaphragm activity). Using spike processors and a pulse-generating interface, transistor-to-transistor logic pulses were generated from the action potentials of single PGNs and the inflation phase of TP. These pulses were used to construct autocorrelograms and LIC→PGN cross-correlograms (Chang et al., 1999b).
Experimental protocols. fINTs in single and population PGN activity, was first determined during “free-run” using high LIC frequency (1.9–2.5 Hz) and low tidal volume (1–1.2 ml) to “unlock” LICs and PGN activity. The frequency-dependent responses were examined by varying LIC frequency (fLIC) while maintaining a constant high tidal volume (2–2.5 ml). Initially,fLIC was adjusted to nearfINT of PGN activity, and stable 1:1 entrainment was established. To demonstrate that this was not a chance phenomenon, fLIC was tested for two or three separate steps (0.1 Hz) away fromfINT to confirm that 1:1 entrainment did not occur just at one singlefLIC. After this,fLIC was increased in 0.2 or 0.3 Hz steps up to ∼1.5–1.8 Hz. Some single PGNs (n = 8) were not carried through the whole frequency range offLIC because of difficulties in maintaining stable recording conditions. To test whether hypocapnia affected the discharge patterns of PGN activity, while maintaining a central apneic state, CO2 (<5%) was given to the rats in half of the whole nerve experiments when hypocapnia developed during periods of high frequency and high tidal volume ventilation. The amount of CO2 given was adjusted to keep PaCO2 close to the normal physiological range (∼35–40 mmHg), and the discharge behavior of VCN activity from experiments in which Paco2was and was not clamped was compared.
Data analysis. Spectral analysis was used to determine the frequencies of rhythmical components in neural activity and LIC. For single unit experiments, spike trains of PGN activity were first transformed to event count time series (counts every 10 msec) before spectral analysis (Rosenberg et al., 1989). The time series of PGN event counts, VCN activity, and TP waves were divided into half-overlapping blocks (length, 20.48 sec). The linear trend in each block was removed and windowed by a Hanning taper, followed by 2048-point Fast Fourier Transformation (Bendat and Piersol, 1986). The overall autospectrum was generated by averaging the autospectrum from each block. In all the autospectra, maximal power density was normalized to 1 for a direct comparison of dominant frequencies across different activities. The spectral resolution was 0.049 Hz/bin. The dominant rhythm of single PGN frequency was first confirmed by the presence of rhythmicity in the self-triggered autocorrelogram (Perkel et al., 1967a), and the exact frequency was determined from the autospectrum. For population PGN activity, the dominant frequency was defined as the frequency of the spectral peak associated with highest power density.
The coupling strength at a particular frequency between paired activities (single PGN→single PGN, LIC→single PGN, LIC→population PGN) was evaluated by squared coherence (abbreviated as coherence) (Bendat and Piersol, 1986). The coherence is a bound parameter with 1 indicating perfect correlation and zero indicating no correlation. Data of frequency and coherence are displayed as median and first to approximately third interquartile range. The LIC→PGN cross correlogram (Perkel et al., 1967b), triggered by the inflation phase of TP waves, was used to measure the phase difference between them. The temporal stability of this phase difference was evaluated by LIC→PGN correlation raster plots (CRP) (Chang et al., 1999b). Similar to the cross-correlogram, the CRP demonstrates the phase relationship between the triggers (LICs) and the dependent event activity (PGN activity). The dependent events are plotted according to their peri-trigger lags. This process is reset every time another trigger is added. However, instead of accumulating events in bins over the analysis period (as for a cross-correlogram), for CRPs the relationship between triggers and dependent events is plotted for each trigger. This reveals temporal stability and provides an assessment of phase difference. The presence of dense vertical bands in the CRP would suggest that constancy of phase difference is a stationary feature across time. However, it does not necessarily indicate that only one single phase difference exists. For example, phase difference under conditions of 2:1 entrainment alternates between two stable values from cycle to cycle, and this would also produce vertical striations in the CRP. To evaluate the distribution of phase differences across a whole cycle of the PGN dominant rhythm, the CRP was reordered by the first post-LIC interevent intervals [termed reordered correlation raster plot (RCRP)]. This enables PGN events with distinct stable phase differences to LIC to cluster in different dense vertical bands. In addition, for uncorrelated LICs and single PGN activity, RCRP also provides information about the randomness of phase shift between them because in this case their phase difference will be any value in the cycle of the PGN rhythm and produce a slanted band covering the whole cycle in the RCRP. Complementary to CRP, RCRP provides further information regarding the temporal characteristics of phase difference (Chang et al., 1999b). The CRP and RCRP were divided into small quadrats (0.05 sec by 10 trigger events), and the PGN events in each quadrat were counted as a measure of the event density. The event density of these raster plots was displayed using a gray scale.
The changes of parameters across the range offLIC tested were evaluated by linear regression. A deviation of the slope of the regression line from zero was considered to be significant if p < 0.05 (Student's t test) (Glantz, 1996).
RESULTS
Condition of animals
The scatter plots in Figure 1summarize the changes of physiological parameters (BP, PaO2, PaCO2, pH) in response to fLIC variations. The significance of covariation between these parameters andfLIC was assessed by linear regression. There was no significant influence offLIC on BP (Fig. 1Ai, 1Bi), which is consistent with previous studies in rats (Marshall, 1994). No significant change of PaO2 was found in the whole-nerve experiments (Fig. 1Aii), although a borderline negative trend was observed in the single PGN experiments (t test for zero slope of the regression line,p = 0.048) (Fig. 1Bii). WhenfLIC was high, respiratory alkalosis developed as a result of pulmonary alveolar hyperventilation in experiments in which no CO2 was added. Under such conditions, PaCO2 dropped and pH increased (Fig. 1Aiii, Aiv, Biii,Biv, filled circles). Respiratory alkalosis was prevented in half the whole nerve experiments by adding CO2 (Fig. 1Aiii,Aiv, open circles). The discharge behavior of VCN activity was not different under the two conditions (see below).
Fig. 1.

Scatter plots of physiological parameters across different fLICs. Significant change of the parameters, evaluated by whether the slope of the regression line deviates from zero, is indicated by an asterisk(t test, p < 0.05).A, Whole nerve experiments. i, ii, No significant change across different fLICs is present in the mean arterial pressure (MAP) and PaO2 as fLIC varies.iii, iv, When fLIC is high and no CO2 is added (filled circles,solid line), respiratory alkalosis develops with low PaCO2 and high pH (t test for zero slope, p < 0.001 for both). The PaCO2 and pH do not change significantly across different fLICs in experiments in which CO2 is added (open circles, dotted line). B, Single PGN experiments.i, No significant change across differentfLICs is present in MAP asfLIC is changed. ii, A borderline negative trend (t test for zero slope,p = 0.048) in PaO2 is observed when fLIC is increased.iii, iv, Respiratory alkalosis develops with low PaCO2 and high pH (ttest for zero slope, p < 0.001 for both) during periods of high fLIC.
Behavior of single PGN or PGN pairs
Figure 2A shows a typical example of single PGN neurograms and TP waves (LICs) and their associated autospectra from an experiment in which two PGNs were recorded simultaneously. Under free-run conditions, each single PGN exhibited a dominant fINT in its discharges (median frequency, 0.69 Hz; interquartile range, 0.66–0.73 Hz). In the five pairs in which two PGNs were recorded simultaneously, the fINTs of the paired PGNs were never the same (fINT for PGN1: 0.78 Hz, PGN2: 0.69 Hz; fLIC, 2.00) (Fig. 2Ai). This is consistent with previous findings (Chang et al., 1999b) and provides good evidence that this is a multiple oscillator population, with each oscillator having a characteristic intrinsic dominant rhythm. The LIC→PGN coherence spectra for the same periods of data for the two units are shown in Figure 3. Under free-run conditions, coherence at fLIC between LIC–PGN and PGN–PGN was near zero as revealed in Figure 3Ai, and no fixed-phase relationship between LICs and PGN activity was observed as demonstrated in the cross-correlogram (Fig.4Ai; the unit is the same as PGN1 with the same period of data in Figs.2Ai, 3Ai). The PGN events distributed uniformly in the CRP (Fig. 4Aii) and spanned the whole cycle of the PGN dominant rhythm as revealed in the RCRP (Fig.4Aiii), suggesting that phase differences between LIC and PGN activity changed constantly, i.e., they were asynchronous. Moving fLIC intofINT range led to stable 1:1 entrainment with high LIC→PGN coherence atfLIC (0.60 Hz) (Figs.2Aii, 3Aii), and in cases in which two PGNs were recorded simultaneously, this resulted in high coherence between the two (Fig. 3Aii). The PGN activity was periodically synchronized to LICs as shown in the LIC→PGN cross-correlogram (Fig. 4Bi; the unit is the same asPGN1 with the same period of data in Figs.2Aii, 3Aii). The presence of a single LIC→PGN phase difference with high temporal stability was revealed by the dense vertical striations in the CRP and RCRP (Fig.4Bii, Biii). This demonstrates that the 1:1 coupling between LICs and PGN activity became a strong and steady feature across time. LIC–PGN 1:1 entrainment with high coherence was retained through a range of differentfLICs (e.g., 0.70 Hz) (Figs.2Aiii, 3Aiii) above which 1:1 entrainment probability started to decline. The exact 1:1 frequency-lock range of different PGNs was rarely the same, presumably reflecting the spread offINTs within the population. The phenomenon of differential frequency-lock is exemplified in Figure2Aiv. When fLIC was increased to 0.81 Hz, although the PGN with higher,fINT (PGN1) was still 1:1 entrained to LICs; the other with lower fINT (PGN2) was not. When fLIC was increased further, single PGNs could not maintain 1:1 entrainment to LICs [fLIC: 0.97 Hz (Fig.2Av) and 1.41 Hz (Fig. 2Avi)]. However, it should be emphasized that the deviation of the dominant PGN frequency from fLIC did not exclude the possibility of the existence of a minor LIC-related component. This occurred especially when fLIC was just above the 1:1 entrainment frequency zone (Fig. 2Aiv,PGN2, arrowhead; Fig. 2Av,PGN1, arrowhead). This provides an explanation for those cases in which high LIC→PGN coherence atfLIC was still preserved despite a different dominant PGN rhythm (e.g., coherence, 0.67 forPGN2 in Fig. 3Aiv and 0.36 for PGN1 in Fig. 3Av). This nondominant LIC-related activity arose from intermittent “attraction” of the PGN oscillator to the LICs, a phenomenon reminiscent of relative coordination (von Holst, 1939; Ayers and Selverston, 1979; Rosenblum and Turvey, 1988). In the LIC→PGN cross-correlogram, it manifested itself as periodic LIC-related peaks standing out of a non-LIC modulated level [(Fig. 4Ci) the unit is the same as PGN1 with the same period of data in Figs.2Av, 3Av]. This dynamic feature of LIC–PGN interaction is clearly shown in the CRP where vertical bands with varied event density across time were present in a phase-drift background (Fig. 4Cii), suggesting that PGN activity was intermittently and transiently locked to LICs. This was further supported by the RCRP in which short vertical bands (arrows) were superimposed on the cycle-spanned PGN event striations (Fig.4Ciii). When fLIC was moved further away from the fINT range of PGNs, LIC→PGN and PGN→PGN coherence dropped sharply (Fig.3Av, 3Avi), and the probability of LIC–PGN lock decreased as suggested in the-cross correlogram [(Fig.4Di) the period of data and the unit (PGN1) are the same as in Figs. 2Avi, 3Avi], with CRP and RCRP (Fig. 4Dii, 4Diii) having an asynchronous pattern similar to those under free-run conditions (Fig. 4, compare A, D).
Fig. 2.

Frequency-dependent entrainment of PGN activity to LICs. A, Real time data (left panel) and superimposed autospectra (right panel) of dual recorded PGNs (dotted anddashed lines) and TP (LIC,solid line). i, Both neurons show an intrinsic dominant rhythm (fINT forPGN1 and PGN2, 0.78 and 0.69 Hz, respectively) under free-run conditions whenfLIC is high (2.00 Hz).ii–iii, When fLIC is moved into fINT range (fLIC: 0.60–0.70 Hz), stable 1:1 entrainment results. iv, AtfLIC = 0.81 Hz, the PGN with the higherfINT (PGN1) still shows entrainment but the other unit (PGN2) fails to lock.v–vi, At higher fLICs (0.97–1.41 Hz) both units are not entrained to LICs. The small peak atfLIC (arrowheads iniv, v) indicates minor LIC-related rhythmical components, suggesting relative coordination. Calibration: 25 μV (PGN), 10 mmHg (TP).B, Real time data (left panel) and superimposed autospectra of the PGN population (VCN,dotted line) and TP (LIC,solid black line). i, During free-run conditions (fLIC: 1.97 Hz), the population PGN activity reveals a broad peak (modal frequency, 0.64 Hz) representing the spread of fINTs within the population. ii–iv, MovingfLIC into this range (fLIC: 0.59–0.78 Hz) results in a single narrow peak at fLIC indicating that activity of most PGNs is 1:1 entrained to LICs. v–vi, At higher ventilation frequencies (1.00–1.35 Hz, v–vi) a narrow peak at fLIC is still preserved although some PGNs escape 1:1 entrainment as indicated by minor peaks in the fINT range (v,vi, arrows). Calibration: 0.5 μV (VCN), 10 mmHg (TP).
Fig. 3.
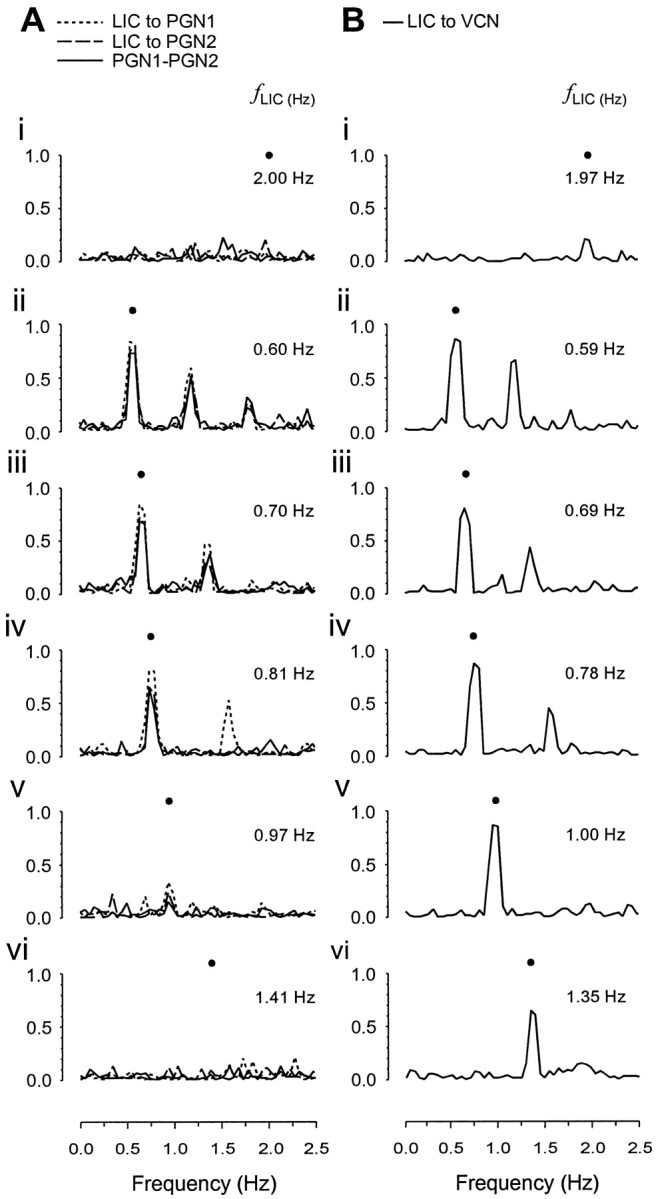
Frequency response of coupling strength between PGN activity and/or LICs. The strength of coupling is evaluated by the coherence spectrum. The neural and LIC activities are the same as those in Figure 2. fLICs are indicated byfilled circles. A, LIC→single PGN (dotted and dashed lines) and single PGN→single PGN (solid line) coherence spectra.i, During free-run (fLIC: 2.00 Hz), LIC→PGN and PGN→PGN coherence at fLIC is minimal, indicating weak coupling between them. ii–iii, WhenfLIC is moved close to thefINT of the PGNs (fLIC: 0.60–0.70 Hz), strong LIC–PGN coupling strength at fLIC emerges as revealed by the high coherence between them. iv, The strong coupling at fLIC is still preserved although the dominant frequency of one unit, PGN2, is different fromfLIC when fLIC is increased to 0.81 Hz (compare with Fig. 2Aiv), a phenomenon believed to arise from relative coordination.v–vi, When fLIC is increased further, the coherence and therefore the coupling strength atfLIC drop (fLIC: 0.97–1.41 Hz).B, LIC→VCN (population PGN) coherence spectra.i, Under free-run conditions (fLIC: 1.97 Hz), the LIC→VCN coherence at fLIC is low, suggesting that most single PGNs are not coupled through LICs.ii–v, WhenfLIC is moved into the range of PGNfINT, high coherence emerges and is maintained through a wide fLIC range (0.59–1.00 Hz). vi, Although a moderate drop is observed, the coherence remains high althoughfLIC is above thefINT range (fLIC: 1.35 Hz).
Fig. 4.
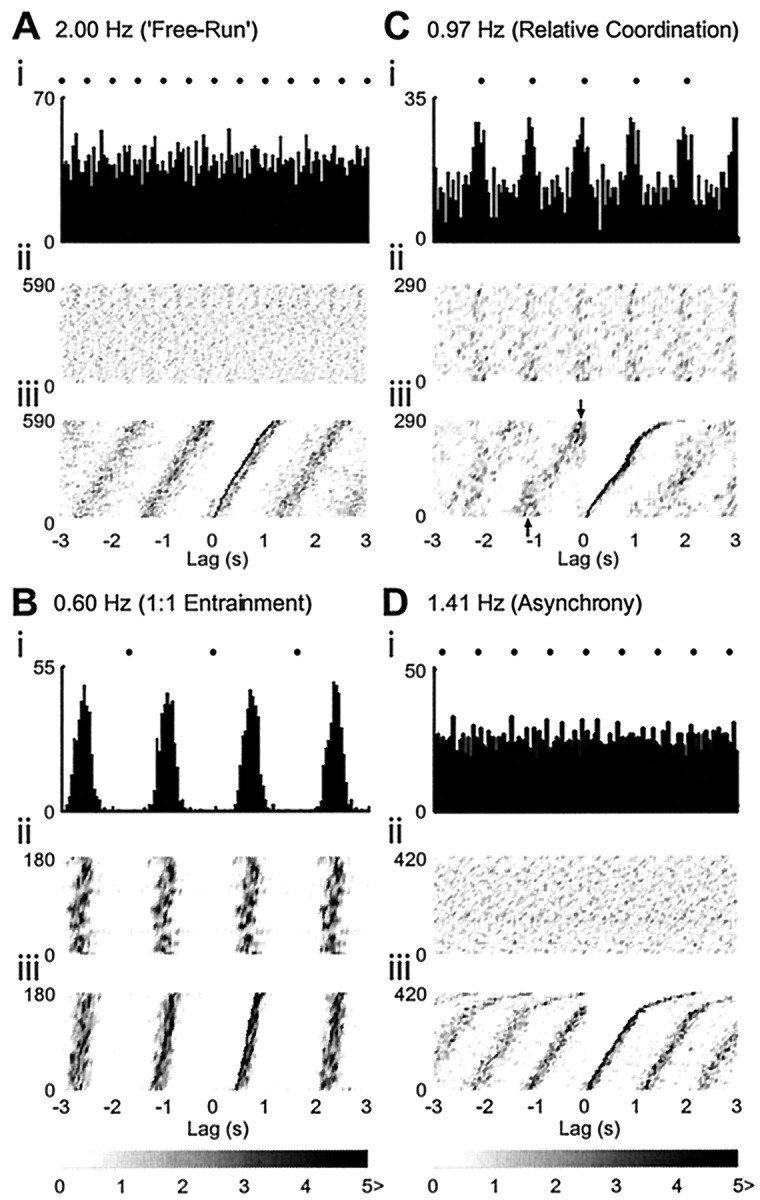
Phase relationships between single PGN activity and LICs. The neural and LIC activities are the same as those in Figures 2 and 3 (PGN1). The relative positions of the LIC occurrences are indicated by filled circles.A, Free-run. During free-run (fLIC: 2.00 Hz), the LIC→PGN cross-correlogram is essentially flat, suggesting noncorrelation (i). Constant phase-drift across time during these periods is indicated by the uniform distribution of PGN events in CRP (ii) and their cycle-spanning pattern in RCRP (iii) B, 1:1 entrainment. WhenfLIC is moved intofINT range (fLIC: 0.60 Hz), 1:1 entrainment emerges, and the cross-correlogram shows a pattern of rhythmical synchronization (i). A stationary fixed-phase relationship between PGN activity and LICs is revealed as stablevertical bands in both CRP (ii) and RCRP (iii). C, Relative coordination. WhenfLIC was moved away fromfINT (0.97 Hz), intermittent periods of phase-lock occurred, and it was manifested as LIC-related periodic peaks superimposed on a background level in the cross-correlogram (i). The dynamic nature of this phase-lock is indicated by intermittent vertical bands with variable density in CRP (ii) and vertical bands (arrows) superimposed on cycle-spanning bands in RCRP (iii). D, Asynchrony. WhenfLIC is moved farther away from PGNfINT(fLIC: 1.41 Hz), a pattern similar to that during free-run (compare with A), suggestive of complete asynchrony, appears. (i, cross-correlogram; ii, CRP; iii, RCRP). Event density in CRP and RCRP is indicated by the gray scale bar.
In some PGNs, when fLIC was high, high-order rational frequency-lock ratios, other than 1:1, were apparent. This is exemplified by 2:1 frequency-lock in Figure5A. The alignment of the second peak in the LIC autocorrelogram and the first peak in the PGN autocorrelogram (Fig. 5Ai, Aii) and the coincidence of fLIC and the first harmonic frequency of the PGN dominant rhythm (Fig. 5Aiii) suggest a 2:1 relationship. The stationary phase difference across time (Fig. 5Aiv) was grouped into two distinct clusters (Fig.5Av), a state consistent with 2:1 frequency-lock. Although a systematic search for the whole range of other high-order frequency-lock states was not the purpose of this study, a 3:1 relationship was observed in one experiment whenfLIC was increased to 2.41 Hz while a high tidal volume was maintained (Fig. 5Bi,5Bii). The temporal stability and three-cluster grouping of the phase differences was apparent as shown in the CRP and RCRP (Fig.5Biv, 5Bv).
Fig. 5.
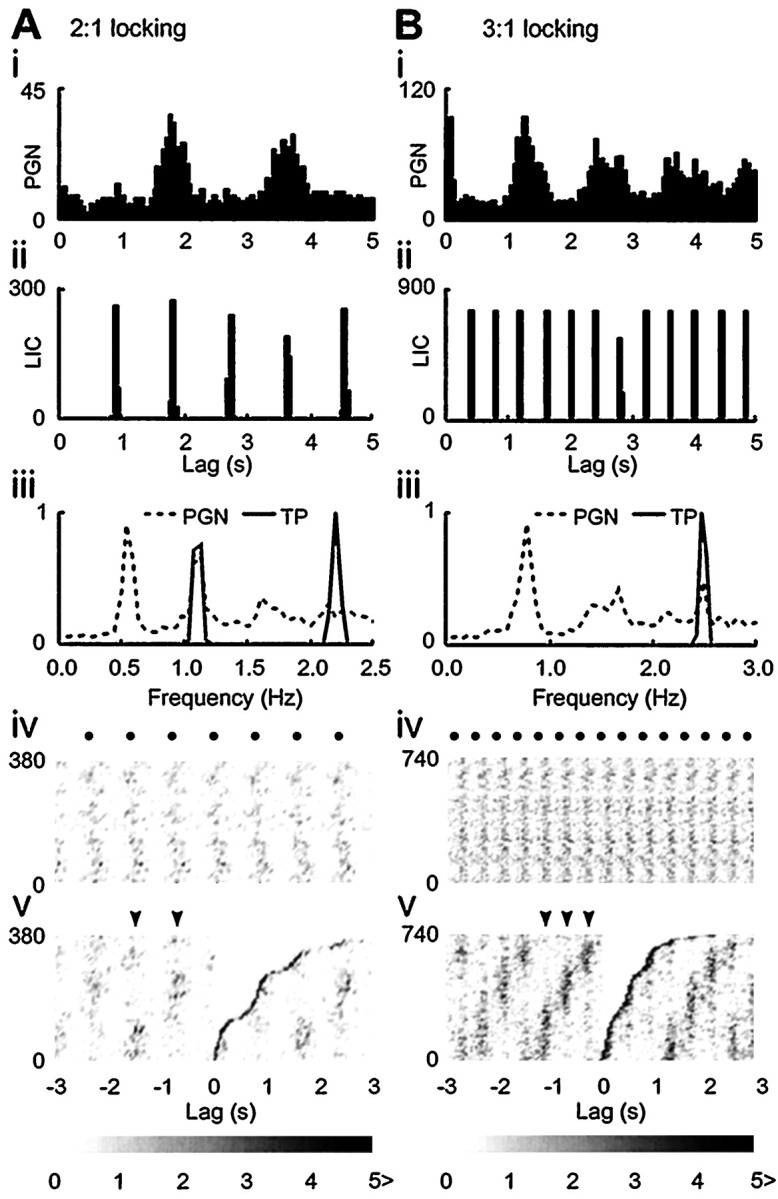
High-order rational frequency-lock.A, 2:1 frequency-lock and B, 3:1 frequency-lock. The respective frequency-locking ratio is suggested by the alignment of the first peak in the PGN autocorrelogram (Ai, Bi) with the second and the third peak in the LIC autocorrelogram (Aii, Bii), respectively. A direct read-out of the 2:1 and the 3:1 frequency relationships is provided in their autospectra in which fLIC(LIC, solid line) coincides with the first harmonic frequency and the second harmonic frequency of PGN activity (dashed line), respectively (Aiii, Biii). Although the phase difference shows a stationary feature across time as revealed by the vertical bands in the CRP (Aiv, Biv; the relative positions of the LIC occurrences are indicated by filled circles), the RCRP demonstrates that the phase differences are grouped into two distinct clusters for 2:1 lock and three distinct clusters for 3:1 lock (arrowheads in Av and Bv, respectively). Event density in CRP and RCRP is indicated by thegray scale bar.
In summary, high probability of 1:1 entrainment between LICs and single PGN activity could only be achieved whenfLIC was close to thefINT of the PGN. AsfLIC was moved away from PGNfINT, a tight coupling between LICs and the PGN could not be maintained, but instead a state of relative coordination with PGN activity being “attracted” to LICs emerged intermittently. When fLIC was increased farther away from PGN fINT, an asynchronous pattern dominated their interaction. At these highfLICs high-order rational frequency-lock other than 1:1 lock occurred in some PGNs. The change of frequency-dependent LIC–PGN coupling strength was reflected in the interaction between PGNs: high PGN→PGN coherence resulted from tight LIC–PGN coupling. As PGN activity was dissociated from LICs, the coherence between PGNs dropped.
The change of discharge patterns of single PGNs is not associated with a significant change of discharge rate
To test whether the change of discharge patterns in response tofLIC variations induced a change in the neuronal excitability, the mean discharge rate (MDR) of the single PGNs across different fLIC was calculated and compared. Under free-run conditions, the median of the MDR of the single PGNs was 1.23 Hz (range, 0.75–2.71 Hz) (n = 21 PGNs from 12 animals). The comparison across the range of fLICs tested was performed on the normalized MDR (normalized by the MDR during free-run) because of the wide variation of the MDR [see also Johnson and Gilbey (1996) and Chang et al. (1999b)]. Although a positive trend was observed in the normalized MDR as fLICwas increased, it was not significant (t test for zero slope of the regress line; n = 100 cases for all the 21 PGNs across all the fLICs tested;p = 0.055). This supports the notion that the neuronal excitability did not change significantly whenfLIC was varied.
Behavior emergent from the PGN population
In the second type of experiment, we investigated the interaction between LICs and population PGN activity. The VCN discharge behavior in response to fLIC changes was similar in experiments with PaCO2 clamp or without PaCO2 clamp during hyperventilation. A typical example (without PaCO2 clamp) showing the real time data and autospectra of the VCN and TP waves, and their coherence spectra, is shown in Figures 2B and 3B, respectively. Under free-run conditions, the VCN autospectrum revealed a single broad peak (median peak frequency, 0.73 Hz; interquartile range: 0.63–0.78) (Fig. 2Bi), and LIC→VCN coherence atfLIC was low (Fig. 3Bi). Single PGNs, recorded under the same conditions, exhibited a range of dominant frequencies and were weakly correlated or uncorrelated as described previously, suggesting that the population rhythm did not arise from mutual entrainment among the individual oscillators, but instead represented an average of thefINT range emergent from the whole oscillator pool (Christakos, 1986, 1994). MovingfLIC into thisfINT range yielded a single narrow peak in the autospectra (0.59–0.78 Hz) (Fig.2Bii–iv) with high coherence (Fig.3Bii–iv), suggesting that most PGNs in the population were 1:1 entrained to fLIC. This finding was consistent with the observation at single PGN level. At highfLIC, however, in contrast with single PGN recordings, the sharp dominant peak atfLIC (1.00–1.35 Hz) (Fig.2Bv–vi) was preserved, although some PGNs must have escaped 1:1 entrainment, as suggested by the appearance of minor peaks in fINT range (Fig.2Bv–vi, arrows). At these highfLICs, strong LIC–VCN coupling with high coherence was maintained (fLIC: 1.00–1.35 Hz) (Fig.3Bv–vi), although a moderate drop was observed asfLIC was moved farther away from thefINT range (Fig. 3, compareBv, Bvi).
In summary, like the strong LIC–PGN 1:1 coupling observed at single PGN level, when fLIC was close to the PGN fINT range, population PGN activity displayed prominent LIC-related rhythmical activity. However, in contrast to the findings in single PGNs, at highfLICs, the dominant population rhythm still maintained 1:1 frequency-lock to LICs with only a moderate decline of LIC-population PGN coupling strength (see below).
Comparison of the discharge behaviors of single PGN and population PGN activity
The difference in single and population PGN behaviors in response to changes of fLIC is summarized in Figure6A–C. ThefLIC range where the dominant PGN rhythm could maintain 1:1 lock to fLICwas wider for population PGN activity than for single PGN activity (Fig. 6A). When fLICwas increased stepwise, the dominant population rhythm could followfLIC faithfully (dotted line), yet single PGN dominant frequencies remained close to theirfINT range (Fig. 6A,shaded area). This driving frequency-related coupling depended on the frequency discrepancy betweenfLIC andfINT. As illustrated in Figure6B, although it is evident that population activity could maintain 1:1 frequency-lock (bottom dotted line) to LICs even when their frequency difference was up to 1.0 Hz, this frequency difference zone for 1:1 lock was restricted to around −0.2∼0.2 Hz (shaded area) for single PGNs. In some cases, high-order rational frequency-lock between single PGNs and LICs such as 2:1 were apparent (Fig. 6B, top dotted line). In both cases, coherence dropped significantly asfLIC was moved away fromfINT [t test for zero slope for the regression line, p < 0.001 for both cases; single PGNs, filled circles and solid line; population PGNs, open circles and dotted line (Fig. 6C)]. However, the decline in coherence was moderate at population level compared with that at single unit level (t test for equal slope, p < 0.001). The loss of entrainment of single PGNs to LICs was accompanied with reduction of coherence between two pair-recorded PGNs (ttest for zero slope, p < 0.001), and it is apparent that PGN→PGN coherence was higher when both units were 1:1 entrained to LICs [solid triangles, both units were entrained to LICs, vs open squares, at least one unit was not entrained to LICs (Fig. 6D)].
Fig. 6.

Summary scatter plots showing entrainment of single PGNs (filled circles) and population PGN (open circles) to LICs (A–C) and the change of coherence between paired PGNs (D).A, Dominant frequency (fPGN) for single PGNs and population PGN plotted against fLICillustrates the difference in distribution offPGNs when fLICis changed. Although fPGN of single PGN activity remains close to the fINT range (shaded area) when fLIC is increased, fPGN of population activity can maintain 1:1 lock (dotted line) to LICs over a much wider range. B, The frequency ratio,fLIC/fPGN, plotted against the frequency difference,fLIC −fINT, provides evidence for frequency lock at 2:1 (top dotted line) as well as 1:1 (bottom dotted line). 1:1 entrainment for single PGNs is only possible when fLIC −fINT is less than ∼0.2 Hz (shaded area), whereas populationfPGN can followfLIC faithfully over a broader range.C, LIC→PGN coherence atfLIC plotted as a function offLIC −fINT shows the decline of coherence at the single neuron (solid line) and the population (dotted line) levels (t test for zero slope of the regression lines; single PGNs: p < 0.001, population PGNs: p < 0.001). The coherence drop is more moderate for population PGN activity than single PGN activity when fLIC is moved away fromfINT (t test for equal slope of the regression lines, p < 0.001).D, The drop of LIC→PGN coherence asfLIC is increased is accompanied by decline of PGN→PGN coherence (t test for zero slope of the regression line, p < 0.001). Higher coherence and therefore stronger coupling strength at fLICresult when both units are 1:1 entrained to LICs (filled triangles, both PGNs are entrained, vs open squares, at least one PGN is not entrained).
DISCUSSION
In this paper we reveal clear differences between the activity arising from a multiple oscillator population and that of its constituent single oscillators. It has been proposed that an autonomous central oscillator is responsible for the quasiperiodic activity recorded from a peripheral sympathetic nerve (Gebber, 1980). However, the findings from our previous study (Chang et al., 1999b) and the present work demonstrate that instead of a single oscillator driving VCN sympathetic nerve activity, the rhythm is generated by multiple oscillators with different intrinsic frequencies. The discharge behavior of the VCN activity should be considered as an emergent collective property of this oscillator population in which the synchronized discharges of even a small fraction of the population will produce a robust population rhythm (Elul, 1972). Our study shows that a stable output rhythm coupled to a periodic drive can be maintained across a wide driving frequency range in such a population, each constituent oscillator exhibiting different LIC–PGN coupling dynamics as a result of the spread of fINTs. We suggest that this stable feature at the population level arises from the underlying linear and nonlinear interactions between the individual oscillators and the common drive.
Rhythm generation from a population of weakly coupled or uncoupled oscillators
Under free-run conditions in which each single PGN is “unlocked” so that it produces different intrinsic rhythms, a dominant rhythm still emerges from the population (Chang et al., 1999b). This finding is consistent with previous theoretical studies that predicted that a population of weakly coupled or uncoupled multiple oscillators is capable of generating a prominent rhythm if thefINTs are restricted to a narrow frequency range (Christakos, 1986, 1994). This provides an alternative to the model suggested in cardiac (Jalife, 1984; Michaels et al., 1986) or circadian (Liu et al., 1997) rhythm generation, in which mutual entrainment between constituent oscillators is necessary to explain the emergence of a population rhythm. We also show that at the population level there is a preservation of high coherence with LICs and a broader 1:1 frequency-locking zone compared with that of single PGNs. Our evidence suggests that this arises from three principal effects. The first is caused by the spread of intrinsic frequencies within the oscillator population. This allows a proportion of the pool to remain 1:1 entrained over a much wider driving frequency range than any single oscillator. However, at fLICs above the fINT range of single PGNs, we suggest that a second phenomenon, relative coordination, contributes to the maintenance of high coherence. Relative coordination describes interactions in which oscillators are not synchronized but nevertheless exhibit intermittent and transient periods of phase-lock (von Holst, 1939; Kelso, 1995). The state of relative coordination disengages the single PGN from a state of tight 1:1 entrainment while maintaining weak coupling to LICs. We suggest that transient phase-lock will become a relatively stable feature at the population level, because at any given moment, there is a high probability that a subpopulation of PGNs will be phase-locked to LIC. Third, we propose that high-order rational frequency-locking also occurs. This would tend to channel single PGNs into a finite number of phase differences, which would prevent continuous phase-drift and contribute to the preservation of high coherence with LICs. The driving frequency-dependent interaction is also supported by the observation that while maintaining a constant drive strength (i.e., tidal volume), a transition of coupling states from tight 1:1 entrainment to complete asynchrony between PGNs and LICs can arise from a small increase offLIC. It must be emphasized that the mechanism underlying 1:1 frequency-lock between the dominant population rhythm and fLIC was different at different fLICs. WhenfLIC was close to the center of thefINT range of the PGN population, tight 1:1 entrainment of most PGNs probably accounted for the frequency-lock at the population level. However, whenfLIC was moved away from thefINT range, with the resultant dissociation of PGN frequencies fromfLIC, the phase stabilizing effect observed in phenomena such as relative coordination and high-order rational frequency lock contributed to the maintenance of LIC-population PGN coupling.
In previous work in which a stable frequency-lock state in multifiber sympathetic activity was maintained across a wide driving frequency range, it was argued that this provided evidence indicating that sympathetic activity was not generated by an oscillator (Bachoo and Polosa, 1987). However, the findings from the present study provide evidence that oscillators do underlie sympathetic activity, and the phenomena of frequency-lock across a wide driving frequency can be explained by complex underlying dynamic processes at a single neuron level.
Functional implication of rhythm genesis in a population composed of multiple weakly coupled or uncoupled oscillators
Taken together, the driving frequency-dependent dynamics (of single oscillators) such as 1:1 entrainment, relative coordination, higher-order rational frequency-lock, and asynchrony are against a linear model in which frequency invariance is characteristic (Pavlidis, 1973; Bendat and Piersol, 1986). In contrast, they are consistent with nonlinear behaviors predicted from the theory of periodically driven biological oscillators (Pavlidis, 1973; Glass and Mackey, 1988;Hilborn, 1994; Kelso, 1995). At the level of single oscillators, we suggest that the dynamic transition between the states of 1:1 entrainment, relative coordination, higher-order rational frequency-lock, and asynchrony results in large changes in the coupling strength with LICs, but at the level of the population of oscillators (with a spread of fINTs), these LIC–PGN coupling fluctuations become smoothed and graded. This suggests that a population of weakly coupled or uncoupled oscillators is particularly suitable for producing patterned output activity and generating rapid and adaptive responses. If a system behaves like a single oscillator, it is expected that a moderate change of the driving parameters may cause a prominent change of the degree of synchrony between the driving force and the system owing to the underlying nonlinear coupling dynamics (Guevara et al., 1981; Petrillo and Glass, 1984). This is disadvantageous in a system in which the demand for stability is of paramount importance. On the other hand, it has been suggested that persistence of a global synchronous state of neurons has limited ability for information processing in the CNS (Singer, 1993). The disengagement of synchronous individual neurons is particularly important in the sympathetic nervous system controlling vascular resistance where the target organ behaves like an “integrator” with individual vascular smooth cells connected through gap junctions (Christ et al., 1996). A persistence of a synchronous state would most likely result in prolonged high vascular tone that may be harmful because coactivation of sympathetic nerve fibers innervating an artery, i.e., synchronization of PGN activity, has been shown to have a prominent effect on the contraction of the arterial smooth muscle (Hirst and Edwards, 1989). Our study shows that although retaining the capability to rapidly desynchronize neurons, the CVA PGNs can generate graded and smoothed synchronous activity coupled to the common drive, LIC-related activity. Although the influence of the strength of the periodic drive, i.e., the tidal volume, on the PGN oscillators was not investigated in the present study, our previous study has shown that the degree of synchronization between them can also be adjusted by varying the input strength (Chang et al., 1999b). In addition, the change of the PGN discharge behavior is not accompanied by a significant change of the discharge rate. This suggests that a wide range of PGN discharge patterns may be generated, without concomitant change of neuronal excitability, by changing the input parameters, either amplitude or frequency. The ability of the sympathetic nervous system to generate input-dependent patterning implies that temporal coding, as proposed in the cerebral cortex (Singer, 1996; Fetz, 1997), is used by this system to coordinate PGN activity, for example, to provide differential cardiovascular support to animals under stress (Vissing, 1997). Therefore, we propose that the principle of dynamic interactions of weakly coupled or uncoupled multiple oscillators in response to a driving force provides the system with metastability and allows it to respond in a graded dynamic manner to changes of input.
Footnotes
H.-S.C. was supported by Chang Gung Memorial Hospital. This work and K.S. were supported by Wellcome Grant 05115.
H.-S.C. and K.S. contributed equally to this work.
Correspondence should be addressed to Dr. Michael P. Gilbey, Autonomic Neuroscience Institute, Department of Physiology, Royal Free University College Medical School, Royal Free Campus, UCL, Rowland Hill Street, London NW3 2PF, UK. E-mail: mpg@rfhsm.ac.uk.
REFERENCES
- 1.Ayers JL, Selverston AI. Monosynaptic entrainment of an endogenous pacemaker network: a cellular mechanism for von Holst's magnet effect. J Comp Physiol. 1979;129:5–17. [Google Scholar]
- 2.Bachoo M, Polosa C. Properties of the inspiration-related activity of sympathetic preganglionic neurones of the cervical trunk in the cat. J Physiol (Lond) 1987;385:545–564. doi: 10.1113/jphysiol.1987.sp016507. [DOI] [PMC free article] [PubMed] [Google Scholar]
- 3.Bendat JS, Piersol AG. Random data: analysis and measurement procedures. Wiley; New York: 1986. [Google Scholar]
- 4.Chang H-S. PhD thesis. University College London, University of London; 1999. Dynamic synchronization of sympathetic oscillators. [Google Scholar]
- 5.Chang H-S, Staras K, Gilbey MP. Complex dynamics of periodically driven sympathetic oscillators. Soc Neurosci Abstr. 1999a;25:759.7. [Google Scholar]
- 6.Chang H-S, Staras K, Smith JE, Gilbey MP. Sympathetic neuronal oscillators are capable of dynamic synchronization. J Neurosci. 1999b;19:3183–3197. doi: 10.1523/JNEUROSCI.19-08-03183.1999. [DOI] [PMC free article] [PubMed] [Google Scholar]
- 7.Christ GJ, Spray DC, el-Sabban M, Moore LK, Brink PR. Gap junctions in vascular tissues: evaluating the role of intercellular communication in the modulation of vasomotor tone. Circ Res. 1996;79:631–646. doi: 10.1161/01.res.79.4.631. [DOI] [PubMed] [Google Scholar]
- 8.Christakos CN. The mathematical basis of population rhythms in nervous and neuromuscular systems. Int J Neurosci. 1986;29:103–107. doi: 10.3109/00207458608985640. [DOI] [PubMed] [Google Scholar]
- 9.Christakos CN. Analysis of synchrony (correlations) in neural populations by means of unit-to-aggregate coherence computations. Neuroscience. 1994;58:43–57. doi: 10.1016/0306-4522(94)90155-4. [DOI] [PubMed] [Google Scholar]
- 10.DeHaan RL, Hirakow R. Synchronization of pulsation rates in isolated cardiac myocytes. Exp Cell Res. 1972;70:214–220. doi: 10.1016/0014-4827(72)90199-1. [DOI] [PubMed] [Google Scholar]
- 11.Elul R. Randomness and synchrony in the generation of the electroencephalogram. In: Petsche H, Brazier MA, editors. Synchronization of EEG activity in epilepsies. Springer; New York: 1972. pp. 59–77. [Google Scholar]
- 12.Fetz EE. Temporal coding in neural populations? Science. 1997;278:1901–1902. doi: 10.1126/science.278.5345.1901. [DOI] [PubMed] [Google Scholar]
- 13.Gebber GL. Central oscillators responsible for sympathetic nerve discharge. Am J Physiol. 1980;239:H143–H155. doi: 10.1152/ajpheart.1980.239.2.H143. [DOI] [PubMed] [Google Scholar]
- 14.Gilbey MP, Spyer KM. Cardiorespiratory regulation. In: Miller AD, Bianchi AL, Bishop BP, editors. Neural control of the respiratory muscles. CRC; Boca Raton, FL: 1997. pp. 259–269. [Google Scholar]
- 15.Glantz SA. Primer of biostatistics. McGraw-Hill; New York: 1996. [Google Scholar]
- 16.Glass L, Mackey MC. From clocks to chaos: the rhythms of life. Princeton UP; Princeton: 1988. [Google Scholar]
- 17.Guevara MR, Glass L, Shrier A. Phase locking, period-doubling bifurcations, and irregular dynamics in periodically stimulated cardiac cells. Science. 1981;214:1350–1353. doi: 10.1126/science.7313693. [DOI] [PubMed] [Google Scholar]
- 18.Herzog ED, Takahashi JS, Block GD. Clock controls circadian period in isolated suprachiasmatic nucleus neurons. Nat Neurosci. 1998;1:708–713. doi: 10.1038/3708. [DOI] [PubMed] [Google Scholar]
- 19.Hilborn RC. Chaos and nonlinear dynamics. Oxford UP; New York: 1994. [Google Scholar]
- 20.Hirst GD, Edwards FR. Sympathetic neuroeffector transmission in arteries and arterioles. Physiol Rev. 1989;69:546–605. doi: 10.1152/physrev.1989.69.2.546. [DOI] [PubMed] [Google Scholar]
- 21.Jalife J. Mutual entrainment and electrical coupling as mechanisms for synchronous firing of rabbit sino-atrial pace-maker cells. J Physiol (Lond) 1984;356:221–243. doi: 10.1113/jphysiol.1984.sp015461. [DOI] [PMC free article] [PubMed] [Google Scholar]
- 22.Johnson CD, Gilbey MP. Sympathetic activity recorded from the rat caudal ventral artery in vivo. J Physiol (Lond) 1994;476:437–442. doi: 10.1113/jphysiol.1994.sp020145. [DOI] [PMC free article] [PubMed] [Google Scholar]
- 23.Johnson CD, Gilbey MP. On the dominant rhythm in the discharges of single postganglionic sympathetic neurones innervating the rat tail artery. J Physiol (Lond) 1996;497:241–259. doi: 10.1113/jphysiol.1996.sp021764. [DOI] [PMC free article] [PubMed] [Google Scholar]
- 24.Kelso JAS. Dynamic patterns: the self-organization of brain and behavior. MIT; Cambridge, MA: 1995. [Google Scholar]
- 25.Lipski J, Coote JH, Trzebski A. Temporal patterns of antidromic invasion latencies of sympathetic preganglionic neurons related to central inspiratory activity and pulmonary stretch receptor reflex. Brain Res. 1977;135:162–166. doi: 10.1016/0006-8993(77)91061-7. [DOI] [PubMed] [Google Scholar]
- 26.Liu C, Weaver DR, Strogatz SH, Reppert SM. Cellular construction of a circadian clock: period determination in the suprachiasmatic nuclei. Cell. 1997;91:855–860. doi: 10.1016/s0092-8674(00)80473-0. [DOI] [PubMed] [Google Scholar]
- 27.Marshall JM. Peripheral chemoreceptors and cardiovascular regulation. Physiol Rev. 1994;74:543–594. doi: 10.1152/physrev.1994.74.3.543. [DOI] [PubMed] [Google Scholar]
- 28.Michaels DC, Matyas EP, Jalife J. Dynamic interactions and mutual synchronization of sinoatrial node pacemaker cells. A mathematical model. Circ Res. 1986;58:706–720. doi: 10.1161/01.res.58.5.706. [DOI] [PubMed] [Google Scholar]
- 29.Pavlidis T. Biological oscillators: their mathematical analysis. Academic; New York: 1973. [Google Scholar]
- 30.Perkel DH, Gerstein GL, Moore GP. Neuronal spike trains and stochastic point processes. I. The single spike train. Biophys J. 1967a;7:391–418. doi: 10.1016/S0006-3495(67)86596-2. [DOI] [PMC free article] [PubMed] [Google Scholar]
- 31.Perkel DH, Gerstein GL, Moore GP. Neuronal spike trains and stochastic point processes. II Simultaneous spike train. Biophys J. 1967b;7:419–440. doi: 10.1016/S0006-3495(67)86597-4. [DOI] [PMC free article] [PubMed] [Google Scholar]
- 32.Petrillo GA, Glass L. A theory for phase locking of respiration in cats to a mechanical ventilator. Am J Physiol. 1984;246:311–320. doi: 10.1152/ajpregu.1984.246.3.R311. [DOI] [PubMed] [Google Scholar]
- 33.Rosenberg JR, Amjad AM, Breeze P, Brillinger DR, Halliday DM. The Fourier approach to the identification of functional coupling between neuronal spike trains. Prog Biophys Mol Biol. 1989;53:1–31. doi: 10.1016/0079-6107(89)90004-7. [DOI] [PubMed] [Google Scholar]
- 34.Rosenblum LD, Turvey MT. Maintenace tendency in coordinated rhythmic movements: relative fluctuations and phase. Neuroscience. 1988;27:289–300. doi: 10.1016/0306-4522(88)90238-2. [DOI] [PubMed] [Google Scholar]
- 35.Sano T, Sawanobori T, Adaniya H. Mechanism of rhythm determination among pacemaker cells of the mammalian sinus node. Am J Physiol. 1978;235:H379–H384. doi: 10.1152/ajpheart.1978.235.4.H379. [DOI] [PubMed] [Google Scholar]
- 36.Singer W. Synchronization of cortical activity and its putative role in information processing and learning. Annu Rev Physiol. 1993;55:349–374. doi: 10.1146/annurev.ph.55.030193.002025. [DOI] [PubMed] [Google Scholar]
- 37.Singer W. Putative functions of temporal correlations in neocortical processing. In: Koch C, Davis JL, editors. Large-scale neuronal theories of the brain. MIT; Cambridge, MA: 1996. pp. 201–237. [Google Scholar]
- 38.Sittiracha T, McLachlan EM, Bell C. The innervation of the caudal artery of the rat. Neuroscience. 1987;21:647–659. doi: 10.1016/0306-4522(87)90150-3. [DOI] [PubMed] [Google Scholar]
- 39.Smith JE, Jansen AS, Gilbey MP, Loewy AD. CNS cell groups projecting to sympathetic outflow of tail artery: neural circuits involved in heat loss in the rat. Brain Res. 1998;786:153–164. doi: 10.1016/s0006-8993(97)01437-6. [DOI] [PubMed] [Google Scholar]
- 40.Vissing SF. Differential activation of sympathetic discharge to skin and skeletal muscle in humans. Acta Physiol Scand [Suppl] 1997;639:1–32. [PubMed] [Google Scholar]
- 41.von Holst E. The behavioural physiology of animals and man: the selected papers of Erich von Holst (Martin R, translator), pp 33–135. Methuen; London: 1939. [Google Scholar]
- 42.Welsh DK, Logothetis DE, Meister M, Reppert SM. Individual neurons dissociated from rat suprachiasmatic nucleus express independently phased circadian firing rhythms. Neuron. 1995;14:697–706. doi: 10.1016/0896-6273(95)90214-7. [DOI] [PubMed] [Google Scholar]
- 43.Winfree AT. The geometry of biological time. Springer; New York: 1980. [Google Scholar]