

Abstract
In oscillatory neuronal networks that pace rhythmic behavior, Ca2+ entry through voltage-gated Ca channels often supports bursting activity and mediates graded transmitter release. We monitored simultaneously membrane potential and/or ionic currents and changes of Ca fluorescence (using the fluorescence indicator Ca Orange) in spontaneously active and experimentally manipulated oscillator heart interneurons in the leech. We show that changes in Ca fluorescence in these interneurons during spontaneous bursting and evoked activity reflect the slow wave of that activity and that these changes in Ca fluorescence are mediated by Ca2+ entry primarily through low-threshold Ca channels. Spatial and temporal maps of changes in Ca fluorescence indicate that these channels are widely distributed over the neuritic tree of these neurons. We establish a correlation between the amount of transmitter released, as estimated by the integral of the postsynaptic current, and the change in Ca fluorescence. In experiments in which we were able to record presynaptic low-threshold Ca currents, associated IPSCs, and presynaptic changes in Ca fluorescence from fine neuritic branches of heart interneurons near their region of synaptic contact with their contralateral partner, there was a close association between the rise in Ca fluorescence and the rise of the postsynaptic conductance. The changes in Ca fluorescence that we record at the end of fine neuritic branches appear to reflect changes in [Ca2+]i that mediate graded synaptic release in leech heart interneurons. These results indicate that widely distributed low-threshold Ca currents play an important role in generating rhythmic activity and in mediating graded transmitter release.
Keywords: leech heart interneurons; Ca currents, Ca Orange; intracellular Ca2+; graded synaptic transmission; spatial and temporal pattern of changes in intracellular Ca2+
Free intracellular calcium ions (Ca2+) play an essential role in the regulation of many cellular functions in neurons. Correspondingly, during neuronal activity, intracellular Ca2+ concentration ([Ca2+]i) varies in a dynamic way both temporally and spatially. The spatial and temporal pattern of changes in [Ca2+]i, monitored with different Ca2+-sensitive fluorescence dyes, is thought to reflect differences in the dynamics and cellular localization of different Ca2+ channels in the plasma membrane and Ca2+-release channels of the endoplasmic reticulum (ER) (Lipscombe et al., 1988;Regehr et al., 1989; Regehr and Tank, 1990, 1994; Lev-Ram et al., 1992;Nohmi et al., 1992; Jaffe and Brown, 1994; Eilers et al., 1995, 1996;Ghosh and Greenberg, 1995; Richardson et al., 1995; Callewaert et al., 1996; Helmchen et al., 1999; Mainen et al., 1999). Correspondingly, localized changes in [Ca2+]i are thought to be important in neuronal function. For example, during synaptic transmission, the regulatory action of Ca2+ on neurotransmitter release depends on changes in internal Ca2+ concentration ([Ca2+]i) at specific intracellular sites (Robitaille et al., 1990; Augustine et al., 1991, 1992; Llinás et al., 1992; Ghosh and Greenberg, 1995;Berridge, 1997, 1998).
In the leech, a core of the motor pattern-generating network for heartbeat includes two segmental bilateral pairs of reciprocally inhibitory oscillator heart interneurons [HN cells in segmental ganglia 3 (G3) and 4 (G4)]. The bilateral neurons are active in alternating bursts and inhibit one another via both graded and spike-mediated transmission. Graded transmission is mediated by the low-threshold Ca currents (ICaS andICaF) (Angstadt and Calabrese, 1991), whereas high-threshold Ca currents appear to underlie spike-mediated transmission (Lu et al., 1997). During normal oscillations, graded transmission occurs only at the beginning of the inhibited period, turning off the contralateral neuron, and sustained inhibition of the opposite neuron is spike-mediated (Angstadt and Calabrese, 1991; Olsen and Calabrese, 1996; Lu et al., 1997). Low-threshold Ca currents also provide depolarizing drive that helps support burst formation (Arbas and Calabrese, 1987; Olsen and Calabrese, 1996). Although the Ca currents underlying the activity of heart interneurons in the leech have been intensively studied, the spatial and temporal dynamics of [Ca2+]i during spontaneous and evoked activity in these neurons have not been described.
In this study, we monitored simultaneously membrane potential and/or ionic currents and changes of intracellular Ca2+ fluorescence in spontaneously active and experimentally manipulated oscillator heart interneurons of isolated G3 or G4. We show that changes of Ca fluorescence in these interneurons during both spontaneous bursting and evoked activity reflect the slow wave of that activity and that these changes in Ca fluorescence are mediated by Ca2+ entry primarily through low-threshold Ca channels. We present spatial and temporal maps of changes in Ca fluorescence that indicate that these channels are widely distributed over the neuritic tree of these neurons. We also establish correlations between low-threshold Ca currents, changes in Ca fluorescence, and graded synaptic transmission.
MATERIALS AND METHODS
Animals. Adult leeches (Hirudo medicinalis) were obtained from Leeches USA and Biopharm and maintained in artificial pond water (Leeches USA) at ∼15°C.
Preparation. Leeches were anesthetized in cold saline, after which individual ganglia (midbody ganglion 3 or 4) were dissected and pinned in clear, Sylgard-coated open bath recording/imaging chamber (RC-26; Warner Instrument Corporation) with a working volume of 150 μl. The sheath on the ventral surface of the ganglion was removed with fine scissors or microscalpels. Ganglia were superfused continually with normal leech saline (Nichols and Baylor, 1968) containing (in mm) 115 NaCl, 4 KCl, 1.8 CaCl2, 10 glucose, and 10 HEPES acid buffer, adjusted to pH 7.4 with NaOH or HCl.
The preparation was mounted ventral side up (unless otherwise noted) on the stage of Olympus Optical (Tokyo, Japan) BX50WI fluorescent microscope with Olympus U-MNG (exciter filter BP530–550; dichroic mirror DM570; barrier filter BA590) filter cube with a 10% neutral density filter and Olympus 40×/0.80 W water-immersion objective.
Heart interneurons were identified by the posterolateral position of their somata on the ventral surface of the ganglion and by their characteristic pattern of rhythmic bursting. Once the HN cells in a ganglion were identified, one cell (presynaptic), was iontophoretically filled with Ca2+-sensitive fluorescent dye Calcium Orange, whereas the opposite cell was not (postsynaptic). Calcium Orange (Molecular Probes, Eugene, OR; tetrapotassium salt “cell impermeant”, excitation/emission: 549/576, mw 1087.33, catalog #C-3013) is a long-wavelength calcium indicator with a nominalKd of 185 nm (at pH 7.2, 22° C) (Haugland, 1996). Eberhard and Erne (1991) measured aKd of 434 nm at pH 7.2 and 457 at pH 7.4, a dissociation rate constant of 233 sec−1, and association rate constant of 0.51 × 10⁹m−1sec−1. The fluorescence of Ca Orange increases linearly on its binding to Ca2+ in the range of free Ca2+ concentrations from 0.02 to at least 0.20 μm, with an approximately fourfold to fivefold increase from 0 to 39.8 μm free Ca2+ (Haugland, 1996). To fill cells with dye, heart interneurons were penetrated with thin-walled (1 mm o.d., 0.75 mm i.d.) borosilicate microelectrodes (A-M Systems). The very tip of electrode was filled with a solution of Ca Orange (5 mm solution in 300 mmpotassium acetate), and the rest of it was filled with 4m K-acetate and 20 mm KCl (unbuffered, pH 8.4). To inject dye into cell, negative current of −1 nA (50% duty cycle) for 10–20 min was used. In a few experiments, noted in the text, both cells were filled with Ca Orange.
Electrophysiology. Five to fifteen minutes after filling cells with dye, recording microelectrodes filled with 4 mK-acetate, 20 mm KCl (unbuffered, pH 8.4) of the same kind as used for dye injection, were inserted into both cells. For voltage-clamp experiments, microelectrodes were filled with 2m K-acetate and 2 m tetraethyl ammonium acetate (TEA-acetate) (unbuffered, pH 7.9) to block outward currents. Microelectrodes were coated along their shanks with Sylgard 186 (Dow Corning, Corning, NY) and had resistances of 20–45 MΩ and time constants of 0.5–1.5 msec when capacity compensated.
Once the cells were penetrated with recording microelectrodes, the superfusate usually was switched to a 0 mmNa+/5 mmCa2+ solution (Na+-free saline): 110.0N-methyl-d-glucamine (NMDG), 4.0 KCl, 5.0 CaCl2, 10.0 glucose, 10.0 HEPES acid buffer, adjusted to pH 7.4, with KOH or HCl. In some experiments we used normal saline, in which Co2+ or Cd2+ were used instead of Ca2+. In some cases 150 μm Cd2+ was added to normal saline.
Voltage-clamp recordings were made with an Axoclamp-2A amplifier (Axon Instruments, Foster City, CA) in single-electrode voltage-clamp mode with a sampling rate of 2.5 kHz. Current-clamp recordings were made with an Axoclamp-2A amplifier used in discontinuous current-clamp mode with a sampling rate of 2.5 kHz.
In each case, the electrode potential was monitored on an oscilloscope to ensure that the potential settled between current injection cycles. Some current recordings were made with the same amplifiers in bridge mode. All recordings were referenced to a chlorided silver wire used to ground the bath.
All electrophysiological data were acquired, digitized, and stored on a Pentium or Pentium II (Intel) computer using pClamp 7.0 software with Digidata 1200 interface of Axon Instruments.
All voltage-clamp protocols were generated using the pClamp program CLAMPEX. The usual voltage-clamp protocol consisted of voltage pulses from a holding potential of −70 mV to various depolarizing voltages. Four negative prepulses of one-fourth magnitude and equal duration preceded each of these positive pulses. The summed currents from these prepulses were used for leak subtraction. The interval between the prepulses in the sequence, the delay between the prepulse sequence and the test pulse, and the interval between prepulse-test pulse episodes were all adjusted for each different test pulse protocol so that the holding current returned to baseline between all pulses and/or prepulses. All Ca currents shown were leak-subtracted automatically using this procedure in CLAMPEX. Although the raw (unsubtracted) currents were not digitized by CLAMPEX, they were monitored on-line with an oscilloscope, so that we could verify that the estimated leak currents were time-invariant and approximately linear. In previous studies of low-threshold Ca2+ currents (Angstadt and Calabrese, 1991), we digitized leak currents (using single negative voltage prepulses of equal magnitude) directly and subtracted them off-line. The results with the automatic procedure used are similar to these previous results.
Ca imaging. Changes of Ca Orange fluorescence were continuously monitored and recorded with ICCD-350f CCD camera (Video Scope International), connected to the fluorescent microscope, described above and Axon Imaging Workbench 2.1 software with Digidata 2000 interface (Axon Instruments) on a Pentium II (Intel) computer. Intensifier gain and black (baseline) levels were adjusted to achieve minimal background fluorescence, convenient visualization of the filled neuron, and sufficient dynamic range for monitoring fluorescence changes.
Our setup permits the acquisition of full frame images of 640 × 480 pixels size at a resolution of 0.379 μm2 for 1 pixel (395 × 295 μm for full frame) with an Olympus 40×/0.80 W water-immersion objective. Changes of fluorescence were recorded from zones of 20–60 pixels (7.58–22.74 μm2). Only those parts of interneurons in which the fluorescence measurement remained unsaturated during the entire experimental protocol were used to monitor changes of fluorescence. In experiments that required the best time resolution, maximal available acquisition rate (video rate, 30 Hz) was used, yielding a time resolution of 33 msec. In other experiments, the acquisition rate was of 4–7 Hz (time resolution, 133–250 msec). Independently of acquisition rate, video signals were accumulated for 33 msec per image, without any kind of gating, using DC mode of the camera.
The advantage of using the maximal acquisition rate was the good time resolution. The disadvantage was bottlenecking because of the long transfer time the program required moving images from memory buffer onto hard drive (∼2 min for 300–360 images, collected in 10–12 sec). Thus, we used video acquisition rate to record changes of fluorescence only, whereas slower (4–7 Hz) acquisition rates were used to simultaneously record changes of fluorescence and collect full frame images.
To synchronize the acquisition of electrophysiological data and Ca fluorescence recording, the Digidata 2000 and Digidata 1200 were connected using a DIO-3 cable interface (Axon Instruments) that permits one program to trigger the other. In our experiments, we used pClamp 7.0 protocols to trigger data acquisition by Axon Imaging Workbench 2.1.
Stored data were analyzed on the same computers using pClamp program CLAMPFIT, Microcal Origin 5.0, and StatSoft Statistica software. Illustrations were created using Adobe Photoshop 5.0 and Adobe Illustrator 8.0 software. Calcium fluorescence data are presented as the changes in fluorescence (ΔF), and in some cases to compare records from different sites on the same cell with very different baseline levels of fluorescence, as ΔF/F.
RESULTS
Changes of Ca fluorescence in oscillator heart interneurons reflect their oscillatory electrical activity
All recordings were from heart interneurons of isolated third and fourth segmental ganglia, cells HN(3) and HN(4). During normal bursting activity in these neurons, Ca fluorescence oscillates in phase with membrane potential, rising during the burst and declining during the inhibited period (Fig. 1). Thus Ca fluorescence oscillates in antiphase in a reciprocally inhibitory cell pair reflecting their antiphasic electrical activity. The increase of Ca fluorescence in the bursting cell coincides with spike-induced IPSPs in inhibited cell. Release of the inhibited cell from an applied hyperpolarization evokes a Ca plateau [mediated by low-threshold Ca currents (Angstadt and Calabrese, 1991)], a huge increase of its Ca fluorescence, and strong graded synaptic inhibition of previously active cell with a concomitant decrease of Ca fluorescence of that cell (Fig. 1B). The recorded changes in Ca fluorescence follow the slow wave of membrane potential, but no changes of fluorescence associated with individual spikes were observed. In eight preparations in which Ca fluorescence was monitored in the postsynaptic cell, the level of fluorescence during strong graded inhibition fell below the trough level seen during the inhibited period of normal oscillation. This observation indicates that during normal activity [Ca2+]ilevels remain elevated above the sensitivity level of the Ca Orange indicator. The association of the changes of Ca fluorescence with changes of membrane potential indicates that the influx of extracellular Ca2+ through voltage-operated Ca channels is responsible, at least in part, for the Δ[Ca2+]i that cause these fluorescence changes in oscillator heart interneurons, both during normal activity, and during Ca plateaus induced by release from hyperpolarization. Similar results were obtained in at least 15 preparations.
Fig. 1.
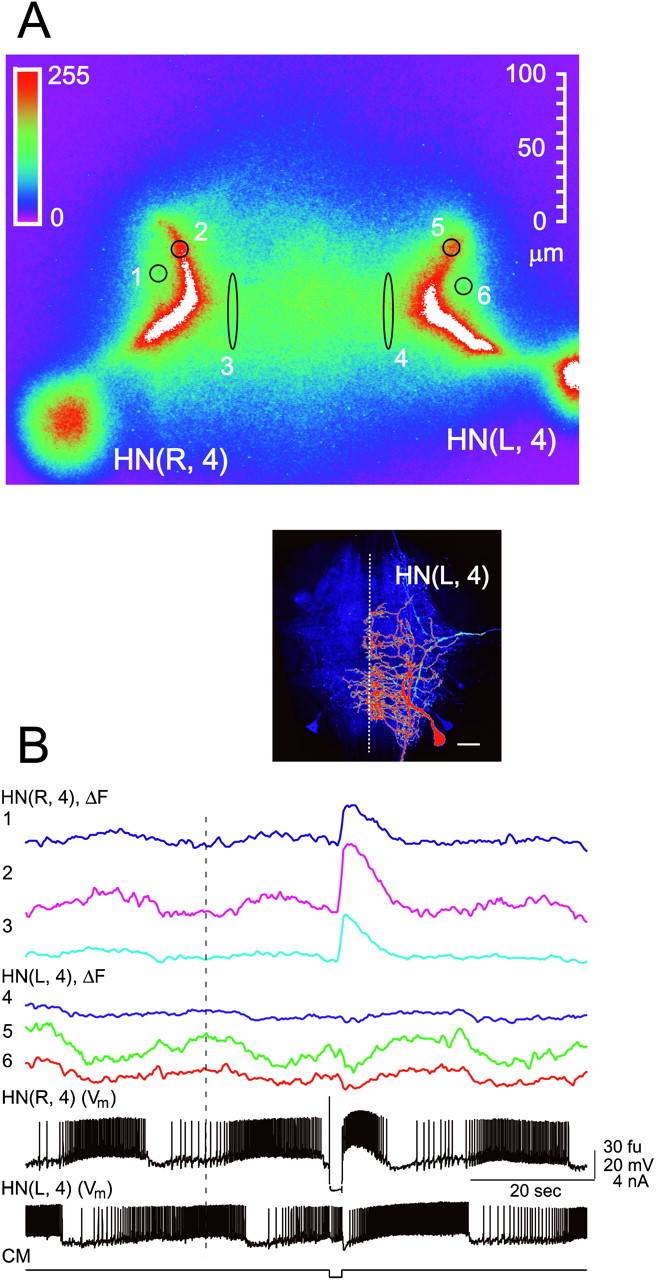
Changes in Ca fluorescence (ΔF) recorded simultaneously with membrane potential from an oscillator heart interneuron pair during normal and perturbed activity. The preparation was bathed in normal saline, and membrane potential (Vm) of both interneurons was recorded. A, Fluorescence image of heart interneurons filled with Ca Orange. In this and subsequent figures, where color fluorescence images are shown, the intensity of fluorescence is coded with the linear pseudocolor scale inset. In all cases,white indicates that the Ca fluorescence signal is above the saturation level for the camera. In this and all subsequent images, the location and relative size of the fluorescence recording sites are indicated, but they are exaggerated in size for legibility.B, Simultaneous recordings of electrical activity (Vm) and changes in Ca fluorescence (ΔF) at the sites indicated by numbers on the fluorescence image (A). The oscillations in Ca fluorescence in the two neurons are out of phase, as would be predicted from their alternating impulse bursts. The hyperpolarization-induced plateau and burst of spikes in cell HN(R,4) are associated with a large increase in Ca fluorescence and cause strong synaptic inhibition of the HN(L,4) cell, which is associated with a marked decrease in Ca fluorescence.CM, Current monitor of current injected in to cell HN(R,4). Ca fluorescence was monitored at 4–7 Hz. Theinset is a confocal fluorescent image of a dye-filled (neurobiotin, rhodamine-conjugated, anti-neurobiotin complex) oscillator heart interneuron in a fixed aqueous-glycerol cleared ganglion from R. L. Calabrese (unpublished work). It is reproduced here to show the full morphology of an oscillator heart interneuron. Fluorescence intensity is indicated by pseudocolor scale similar to that in panel A. Background fluorescence (deep purple) shows the ganglionic neuropil. There is a low level of fluorescence (light blue) in a Y-shaped process that results from dye-coupling with neurobiotin. Scale bar, 100 μm. The ganglionic midline is indicated with a dashed white line. Note the distribution of terminal branches of the neuron near the midline. These are the sites of contact between oscillator heart interneurons that underlie the synaptic connections explored in the study (Tolbert and Calabrese, 1985).
Ca channels appear to be widely distributed along the neuritic branches of oscillator heart interneurons
In some favorable preparations (n = 10), dye filling was extensive enough so that we were able to record Ca fluorescence changes in small neuritic branches of oscillator heart interneurons. These branches, which are mainly located dorsally, serve as both the input and the output sites of the reciprocal synapses with the contralateral partner of the cell (Tolbert and Calabrese, 1985) (Fig. 2). With an acquisition rate of 4–7 Hz, there were no differences in time course of Ca fluorescence changes along single branches (Fig. 2B), between different branches, or between different parts of main neurite itself (data not shown). Figure 2C is an expansion of the section of fluorescence record in Figure 2B marked with a bar, with images corresponding to the time points marked witharrows. It shows that changes of Ca fluorescence during the response of the cell to release from hyperpolarization occur simultaneously along the branch monitored, although there are differences in fluorescence intensity along the branch that may reflect differences in Ca channel density.
Fig. 2.
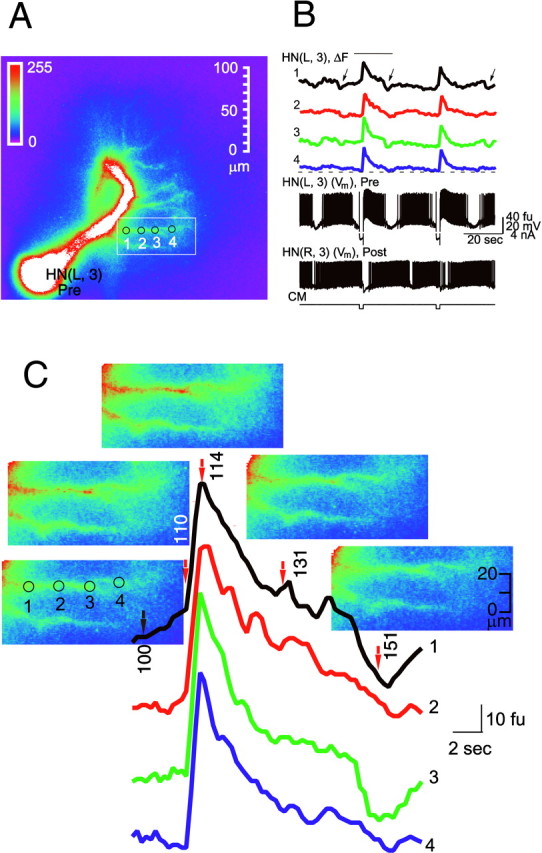
Ca fluorescence changes simultaneously along a fine medial branch of the main neurite in an oscillator interneuron during normal and perturbed activity. To image fine branches, the preparation was bathed in normal saline dorsal side up. Only one oscillator interneuron was filled with Ca Orange, but the membrane potential (Vm) of both interneurons (Pre and Post) in the ganglion was recorded. A, Fluorescence image of the HN(L,3) cell (Pre). B, Simultaneous recordings of electrical activity (Vm) and changes in Ca fluorescence (ΔF) at the sites indicated by numbers in A.Black arrows indicate artifacts (seen mainly at recording sites 1 and 3) caused by spontaneous movements of the ganglion. C, Fluorescence images superimposed on expanded section of Ca fluorescence record (B, bar).Red arrows indicate the points on the records, corresponding to the numbered images. CM, Current monitor of current injected in to cell HN(L,3). Ca fluorescence (ΔF) was monitored at 4–7 Hz.
The slow acquisition rate used in the above experiments did not permit us to determine whether the Ca fluorescence changes along fine neuritic branches are truly synchronous. Thus, we reexamined the Ca fluorescence changes at the maximal acquisition rate available with our setup, 30 Hz (video rate). Figure 3 shows results obtained with a preparation during normal activity. The changes of Ca fluorescence at different points along the branch differ in intensity, but the time course of fluorescence changes during normal oscillatory activity and in the response to the release from hyperpolarization were synchronous. During the hyperpolarization-induced plateau, the onset time and time to peak of the fluorescence changes were the same for each recording site (Fig. 3B). The differences in fluorescence intensity at different points along the branch are most likely attributable to differences of branch thickness and focal plane. Similar results were obtained in three preparations.
Fig. 3.
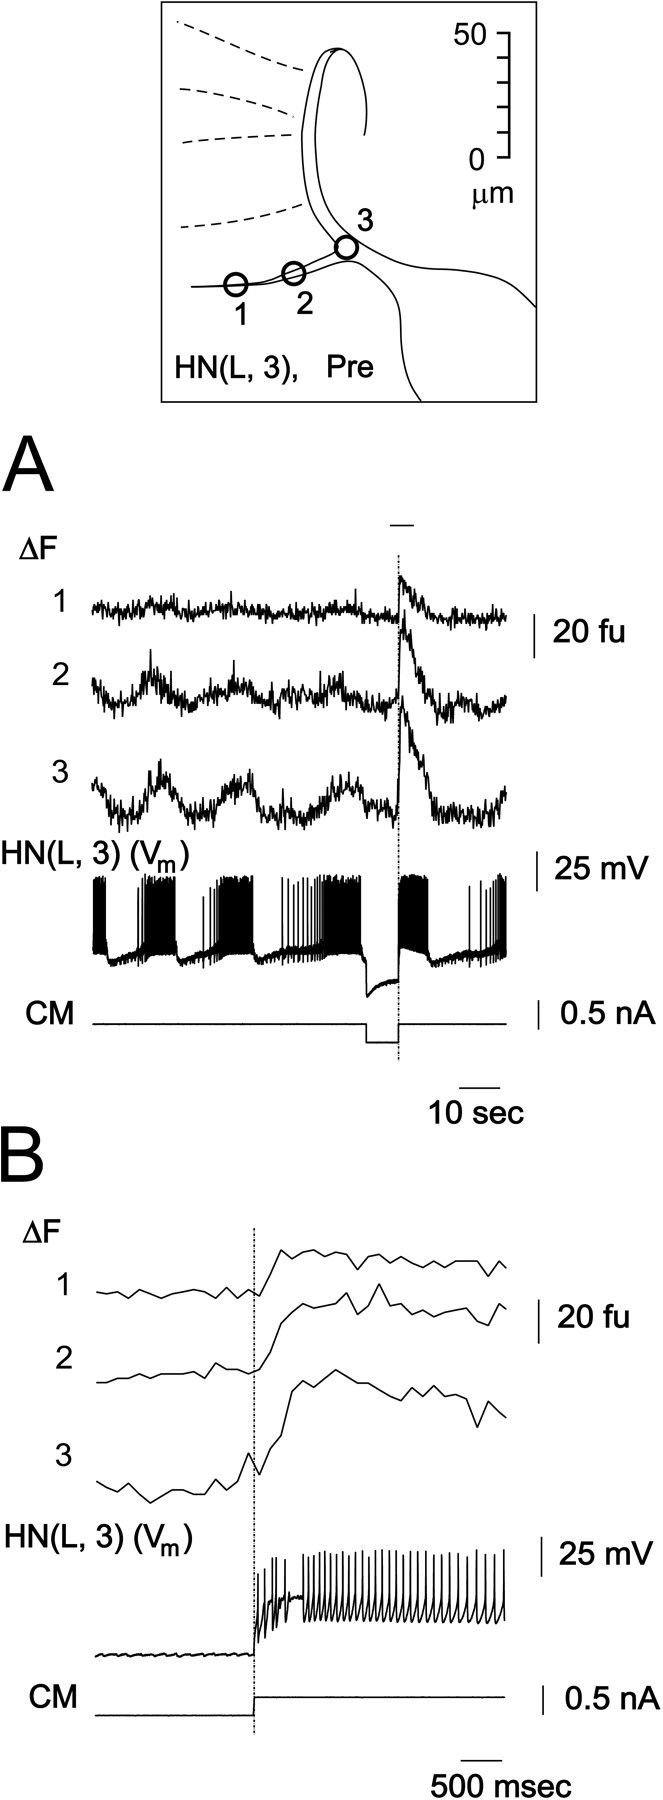
Changes in Ca fluorescence (ΔF) recorded at 30 Hz indicate that Ca channels are widely distributed along fine medial branches of the main neurite of oscillator heart interneurons. The preparation was bathed in normal saline. Inset, Diagram showing fluorescence recording sites indicated by numbers.A, Changes in Ca fluorescence (ΔF) and membrane potential (Vm) of one oscillator interneuron. The recorded cell was injected with hyperpolarizing current to induce a rebound plateau and burst. B,Expanded section of traces in A marked with bar.
In the experiment of Figure 4, we attempted to map the spatial and temporal pattern of changes in Ca fluorescence across a wide stretch of the neuritic field of an oscillator interneuron during a depolarizing voltage pulse. Both neurons of an oscillator pair were filled with Ca Orange (Fig.4A), and both were voltage-clamped while the preparation was bathed in 0 mmNa+/5 Ca2+mm saline. The presynaptic heart interneuron was held at −70 mV, and repeated (n = 4 averaged data shown) depolarizing voltage pulses (2 sec) to −35 mV were imposed. The postsynaptic cell was held at −40 mV. These voltage pulses elicited large low-threshold Ca currents (ICa) and associated graded IPSCs in the postsynaptic cell (Angstadt and Calabrese, 1991; Lu et al., 1997). Changes in Ca fluorescence along fine neuritic branches occurred nearly synchronously at all recorded sites, which were clearly associated with the presynaptic cell (branches a–e; all recorded points from site 3 lateral) (Fig.4B,C). The time to peak was slightly longer at sites closer to the main neurite. Changes in Ca fluorescence were also monitored in two imaged branches in the postsynaptic cell (branches d–e; all recorded points from site 4 lateral). These changes were small and at more lateral sites slightly negative indicating a possible reduction in [Ca2+]i during the IPSC. At points between sites 3 and 4 the fluorescence signal could not be unambiguously attributed to the presynaptic or postsynaptic cell, but the Ca fluorescence changes (increased Ca fluorescence) indicated that the signal was dominated by the presynaptic cell. Similar results were observed in two other preparations. These data do not permit us to estimate channel density per se, but it appears that Ca channels (at least of the low-threshold type) are distributed widely along whole neuritic tree. Their distribution in the soma is uncertain however, because the tremendous brightness of the soma after filling with dye makes it impossible to record any changes in Ca fluorescence. On other hand, all records taken from the main neurite as close to cell body as possible, shows no significant differences in the time course of changes in Ca fluorescence, compared to ones from neuritic branches.
Fig. 4.
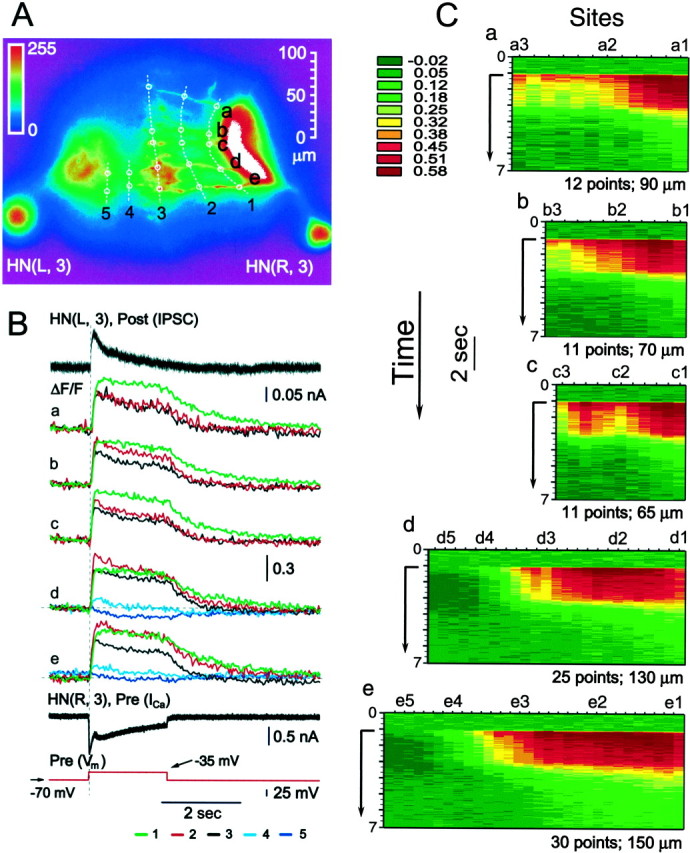
Spatial and temporal pattern of normalized changes in Ca fluorescence in response to a depolarizing voltage pulse in a pair of oscillator interneurons. Here and in Figure 10, to make records from sites with very different baseline fluorescence more comparable, Ca fluorescence is presented as ΔF/F. A, Image of preparation (dorsal side up) showing sites (1–5) for recording ΔF/F on a set of neuritic branches (a–e). Five major branches (a–e) were imaged in the HN(R,3) cell that was designated presynaptic (Pre). Two corresponding branches were imaged in the HN(L,3) cell that was designated postsynaptic (Post). Dashed white lines link corresponding recording sites on the branches. Site 4 and all points lateral, including site 5, are postsynaptic, and site 3 and all points lateral, including sites 2 and 1, are presynaptic. Points between sites 3 and 4 are in the region of Pre/Post overlap; note, that the changes in Ca fluorescence in this region are predominantly of the presynaptic type (see Results for explanation.). B, Simultaneous recordings of presynaptic low-threshold Ca currents (ICa) and normalized changes in Ca fluorescence (ΔF/F) and IPSCs in voltage clamp. The preparation was bathed in 0 mm Na+/5 mm Ca2+ saline and repeated (n = 4; average traces shown) depolarizing voltage pulses to −35 mV (from a holding potential of −70 mV) was imposed on the presynaptic cell. The postsynaptic cell was held at −40 mV.C, Pseudocolor representations the spatial and temporal pattern of normalized changes in Ca fluorescence (ΔF/F) along each of the five branches (a–e) labeled in A. Data from the experiment in B. Time axis (y-axis) starts at the top of each panel and progresses along the arrow. Time 0 corresponds to the beginning of the traces in B and the start of the arrow to the time of the voltage pulse in B. Each tick on the site axis (x-axis) represents an equally spaced fluorescence recording site with the sites illustrated inA labeled correspondingly. The number of recording sites and the total length of the branch monitored are indicated for each branch. Normalized changes in Ca fluorescence (ΔF/F) recorded at 30 Hz. Thus in all graphs the time axis is binned in 33 msec intervals.
The changes in Ca fluorescence observed are prevented by Ca channel blockers
We used conventional divalent ion Ca channels blockers to test whether the changes in Ca fluorescence observed in oscillator heart interneurons were indeed mediated by Δ[Ca2+]i brought about by Ca2+ entry through voltage-gated Ca channels.
In all six preparations tested, replacing Ca2+ ions in normal saline with Co2+ (5 mm) prevents spontaneous bursting and eliminates hyperpolarization-induced Ca plateau production and all synaptic transmission between HN cells (Arbas and Calabrese, 1987; Angstadt and Calabrese, 1991; Fig.5). Associated with these changes is an elimination of any activity-related changes in Ca fluorescence. However, the ability of HN cells to spike and to produce their characteristic hyperpolarization-activated restorative shift in membrane potential (h-current) remains (Arbas and Calabrese, 1987;Angstadt and Calabrese, 1991; Fig. 5). Small increases in background fluorescence were observed in Co2+ saline in some experiments possibly indicating some entry of Co2+ into the neurons. The ratio of the change in fluorescence of Ca Orange to 5 μmCo2+ versus 5 μmCa2+ is 41:96 (Haugland, 1996). On other hand, some release of Ca2+ from endoplasmic reticulum cannot be excluded. These results indicate that the changes in Ca fluorescence that we record reflect Ca2+ entry through voltage-gated Ca channels and confirm the essential role of extracellular Ca2+ in synaptic transmission between HN cells.
Fig. 5.
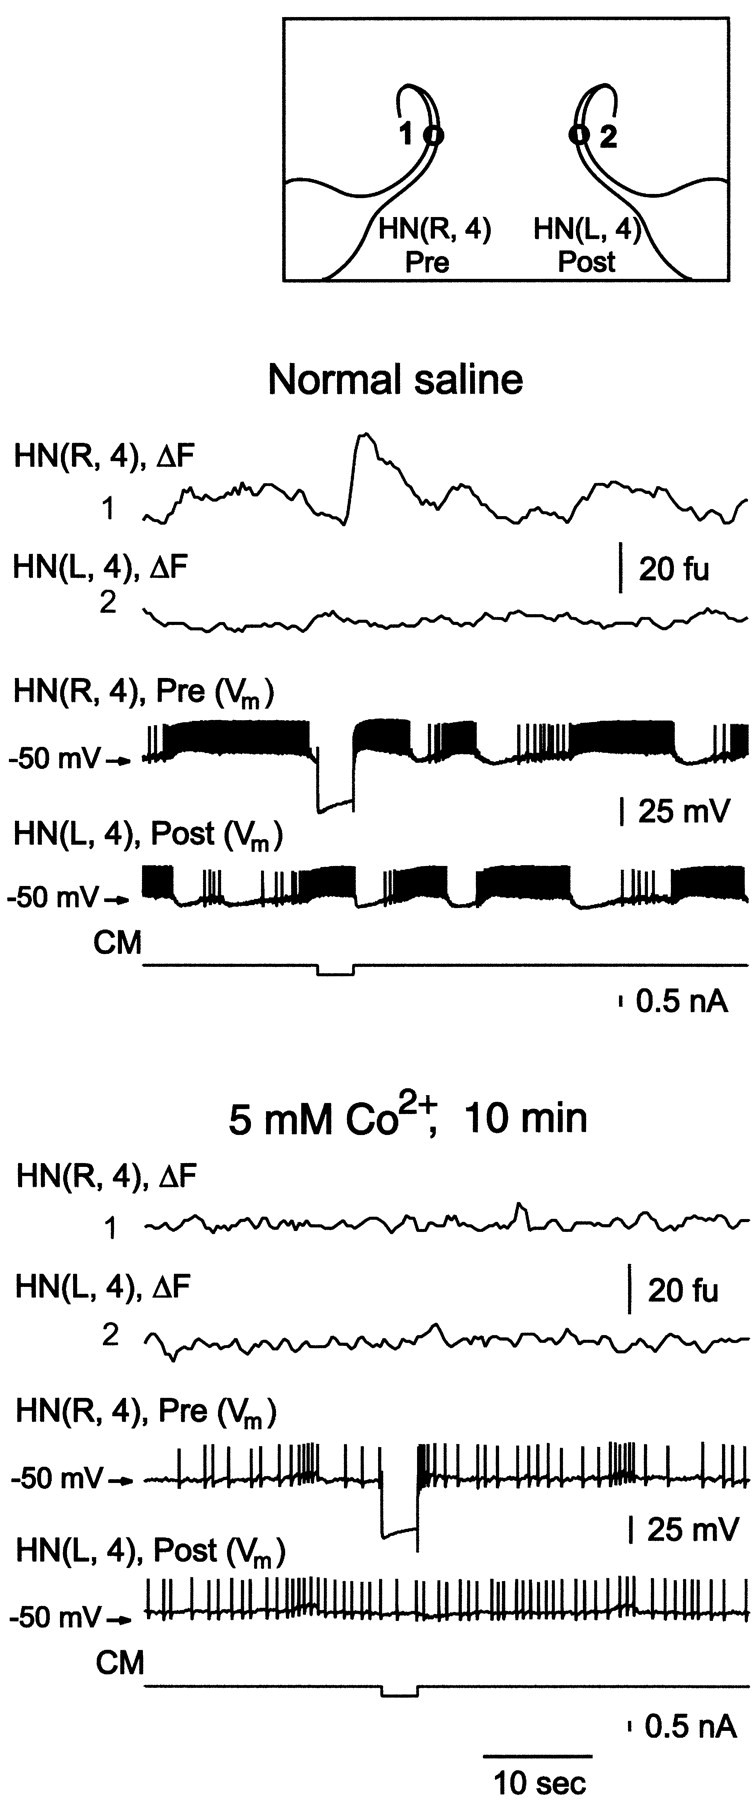
Substitution of Ca2+ with 5 mm Co2+ completely blocked changes in Ca fluorescence (ΔF), hyperpolarization-induced Ca2+plateaus, and inhibitory synaptic transmission between heart interneurons. Simultaneous recordings of electrical activity (Vm) and changes in Ca fluorescence (ΔF) in a pair of oscillator interneurons at the sites indicated by numbers on the inset. Changes in Ca fluorescence (ΔF) recorded at 4–7 Hz.
Previous work from our laboratory (Lu et al., 1997) indicates that low concentrations of Cd2+ (150 μm) block high-threshold Ca currents and spike-mediated synaptic transmission in heart interneurons and eliminates their normal oscillation. Low concentrations of Cd2+(150 μm) do not block low-threshold Ca currents, hyperpolarization-induced Ca plateaus, or associated graded inhibition in heart interneurons. We confirmed these results while monitoring changes in Ca fluorescence (Fig. 6). A 150 μm concentration of Cd2+blocked spike-mediated synaptic transmission and eliminated normal bursting activity of the cells, and Ca fluorescence became flat, but release from hyperpolarizing evoked plateaus, graded synaptic transmission, and the usual transient rise of Ca fluorescence (Fig. 6). The results support the suggestion (Lu et al., 1997) that spike-mediated transmission depends mainly on Ca2+ channels of L-type, which are highly sensitive to Cd2+ inhibition. Plateau induced changes in Ca fluorescence in presence of 150 μmCd2+ had a similar time course in the main neurite as in fine branches (in the preparations in which it was possible to image them; n = 3; data not shown). This observation supports our suggestion that low-threshold Ca channels are widely distributed in leech heart interneurons.
Fig. 6.
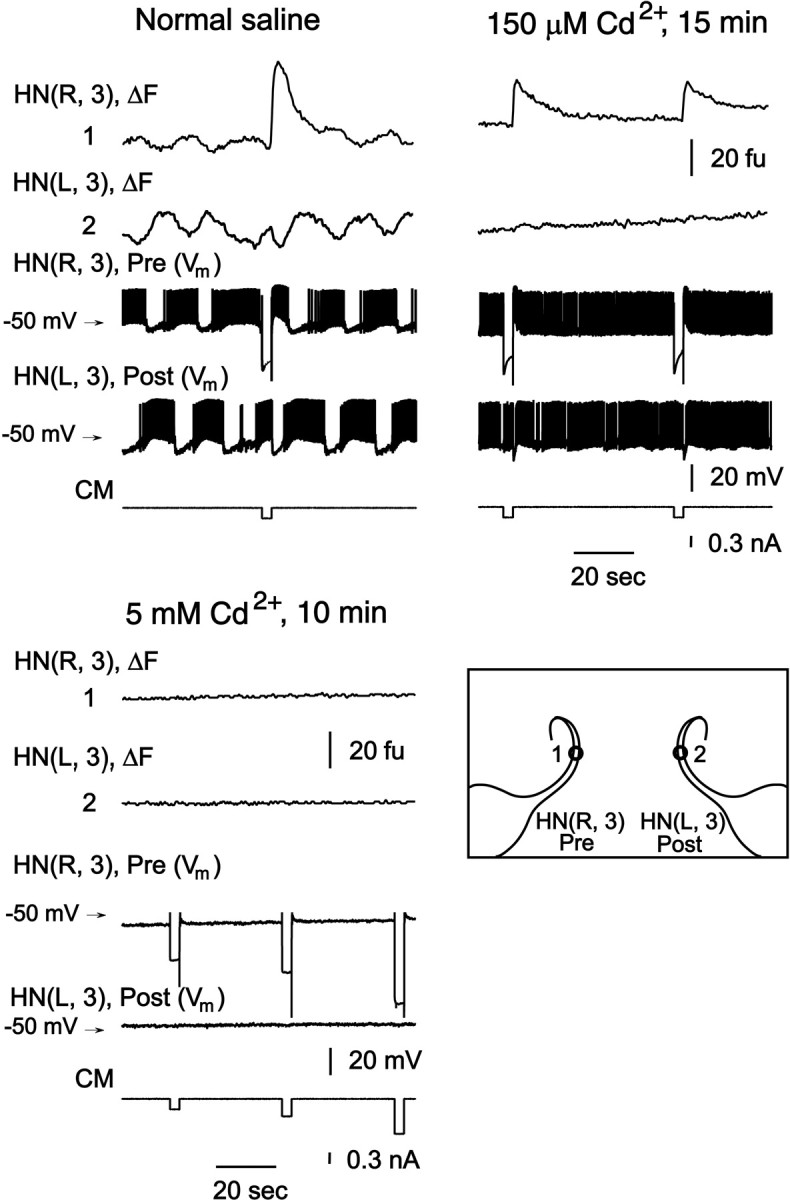
Effect of Cd2+ on changes in Ca fluorescence and synaptic transmission in a pair of oscillator interneurons. Simultaneous recordings of electrical activity (Vm) and changes in Ca fluorescence (ΔF) in a pair of oscillator interneurons at the sites indicated bynumbers on the inset. Addition of 150 μm Cd2+ to normal saline blocked spike-mediated synaptic transmission and normal oscillations in membrane potential and Ca fluorescence, but did not block hyperpolarization-induced plateaus or associated graded synaptic transmission and changes in Ca fluorescence. Substitution of Ca2+ with 5 mm Cd2+completely blocked changes in Ca fluorescence (ΔF), hyperpolarization-induced Ca2+ plateaus, and inhibitory synaptic transmission between the interneurons. Records shown were taken before and 15 and 10 min after addition of 150 μm Cd2+ and substitution of Ca2+ with 5 mm Cd2+, respectively. Changes in Ca fluorescence (ΔF) recorded at 4–7 Hz.
Replacing Ca2+ with 5 mmCd2+ completely eliminated spontaneous spike activity, hyperpolarization-induced Ca2+ plateaus, and all synaptic transmission between heart interneurons, and no spontaneous or evoked changes of Ca fluorescence could be recorded (Fig. 6). The basal level of fluorescence increased monotonically during the experiment (Fig. 6). This observation indicates that heart interneurons like some other cells (Shibuya and Douglas, 1992) and, especially, some leech neurons (Dierkes et al., 1997), are permeable to Cd2+. The ratio of the change in fluorescence of Ca Orange to 5 μmCd2+ versus 5 μmCa2+ is 100:96 (Haugland, 1996). Under this interpretation, the persistent fluorescence changes observed would then result from intracellular Cd2+concentration monotonically increasing because of the inability of the cells to eliminate Cd2+ from cytoplasm.
Graded synaptic transmission between heart interneurons correlate with Δ[Ca2+]i as determined by changes in Ca fluorescence
We investigated the role of Ca2+ in graded synaptic transmission by determining the relation between presynaptic depolarization and associated low-threshold Ca current and Ca fluorescence changes and postsynaptic responses (IPSPs or IPSCs).
Figure 7 shows simultaneous recording of presynaptic potential and changes in Ca fluorescence (acquisition rate of 4–7 Hz), and graded IPSPs, evoked by application of progressively increasing depolarizing current steps to the presynaptic cell. The preparation was bathed in 5 mmCa2+/0 mmNa+ saline, which blocks spikes but supports graded synaptic transmission. The presynaptic cell was held at −70 mV, and postsynaptic cell was held at −40 mV. Over the whole range of applied currents (0.05–0.50 nA), both presynaptic depolarization and changes in peak Ca fluorescence increased. The amplitudes of evoked IPSPs were correlated, progressively increasing until the depolarizing current amplitude reached 0.30 nA, at which point IPSPs saturated. Similar data were recorded in two other recorded preparations.
Fig. 7.
Presynaptic depolarization, presynaptic changes in Ca fluorescence, and associated inhibitory postsynaptic potential are correlated in heart interneurons. Simultaneous recordings of electrical activity (Vm) and presynaptic changes in Ca fluorescence (ΔF, at the site indicated on theinset), in a pair of oscillator interneurons.A, The preparation was bathed in 0 mmNa+/5 mm Ca2+ saline, and an increasing series of depolarizing current pulses was injected into the presynaptic cell. Changes in Ca fluorescence (ΔF) were recorded at 4–7 Hz. B, Expanded section of traces inA marked with bar.
To determine whether low-threshold Ca currents underlie this relation between presynaptic depolarization and the concurrent increase in Ca fluorescence, and postsynaptic response (IPSP), we performed voltage-clamp experiments to directly measure low-threshold Ca currents. Figure 8 shows records from experiments (n = 5) in which the presynaptic heart interneuron was voltage-clamped at −70 mV and stepped through a series of depolarized potentials (from −47.5 mV to −35 mV), the range over which Ca currents associated with graded synaptic transmission are normally recorded (Angstadt and Calabrese, 1991; Lu et al., 1997). The experimental conditions were the same as in Figure 7, but the Ca2+ signal was acquired at video rate (30 Hz). The change in Ca fluorescence, low-threshold Ca2+ currents, and the graded IPSPs increased in parallel with increased command potential (Fig.8A). We quantified these apparent relationships by plotting the integrated amplitudes of presynaptic Ca2+ currents (current × time) and the peak amplitude and integrated amplitude of the change in Ca fluorescence and integrated IPSP amplitude versus command potential (Fig. 8B). We then performed a regression analysis, which showed a significant dependence of the integrated change in Ca fluorescence and of integrated IPSP on integrated presynaptic Ca2+ current (Fig. 8C). These relations in turn suggested a linear relation between integrated IPSP and integrated Δ[Ca2+]i as measured by the integrated change in Ca fluorescence that was supported by regression analysis (Fig. 8C).
Fig. 8.
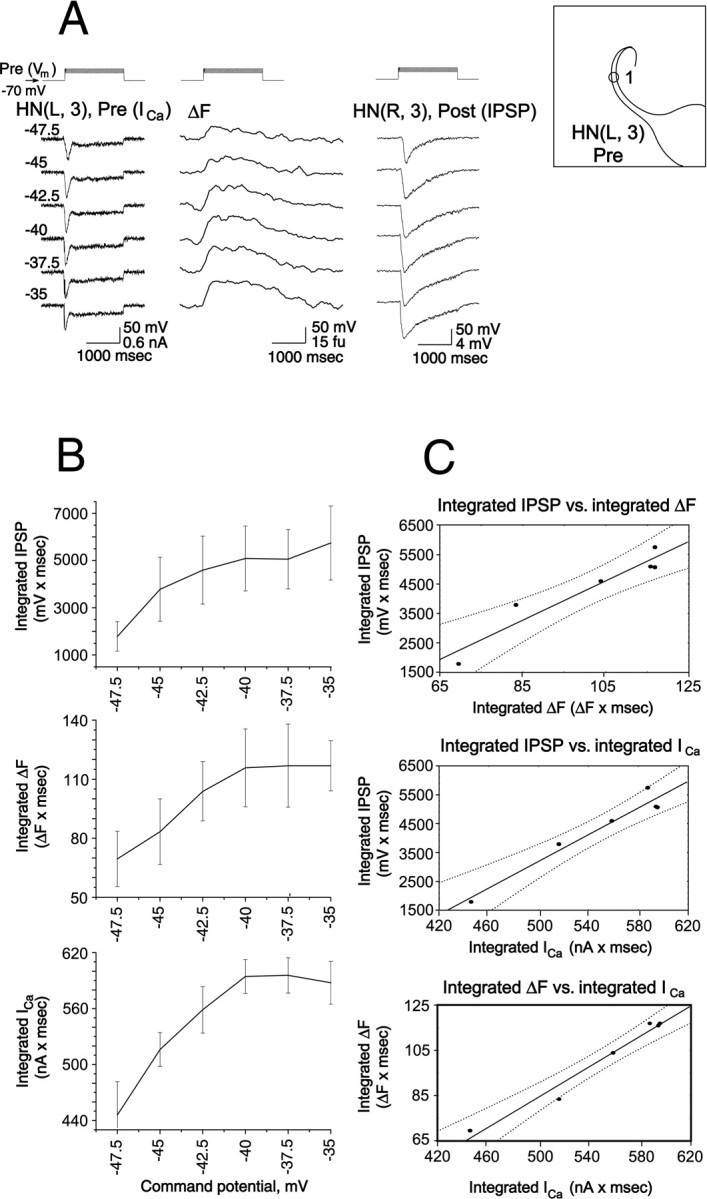
Presynaptic low-threshold Ca currents, presynaptic changes in Ca fluorescence, and associated IPSPs are correlated in heart interneurons. A, Simultaneous recordings of presynaptic low-threshold Ca currents (ICa) in voltage clamp and changes in Ca fluorescence (ΔF, at the site indicated on theinset) and IPSPs in a pair of oscillator interneurons. The preparation was bathed in 0 mm Na+/5 mm Ca2+ saline and an increasing series of depolarizing voltage pulses (from a holding potential of −70 mV) was imposed on the presynaptic cell. Changes in Ca fluorescence (ΔF) recorded at 30 Hz. B, The experiment of panelA was repeated in five preparations, and the relations of average integrated ICa, ΔF, and IPSP to the command potential during the pulse were plotted as mean ± SE. C, Using the data shown in panelB the relations between average integrated IPSP and average integrated ΔF and ICa were plotted, and the relation between average integrated ΔF andICa was plotted. Solid straight lines are from linear regression of the data, and dotted lines are 95% confidence intervals of the regression line.
To further substantiate the relationship between presynaptic low-threshold Ca current and the concurrent Δ[Ca2+]i and postsynaptic responses, similar experiments (n = 7) to those of Figure 8 were performed with the postsynaptic cell held in voltage clamp so that the waveform of postsynaptic conductance could be observed directly. The changes in Ca fluorescence, low-threshold Ca currents, and the graded IPSCs increased in parallel with increasing command potential (Fig. 9A). We again quantified apparent relationships by plotting the integrated amplitudes of presynaptic Ca currents (current × time) and the integrated amplitude of the change in Ca fluorescence and integrated IPSC amplitude versus command potential (Fig. 9B). We then performed a regression analysis, which showed a significant dependence of the integrated change Ca fluorescence and of integrated IPSC on integrated presynaptic Ca current (Fig. 9C). These relations in turn suggested a linear relation between integrated IPSC and integrated Δ[Ca2+]i as measured by the integrated change in Ca fluorescence, which was supported by regression analysis (Fig. 9C).
Fig. 9.
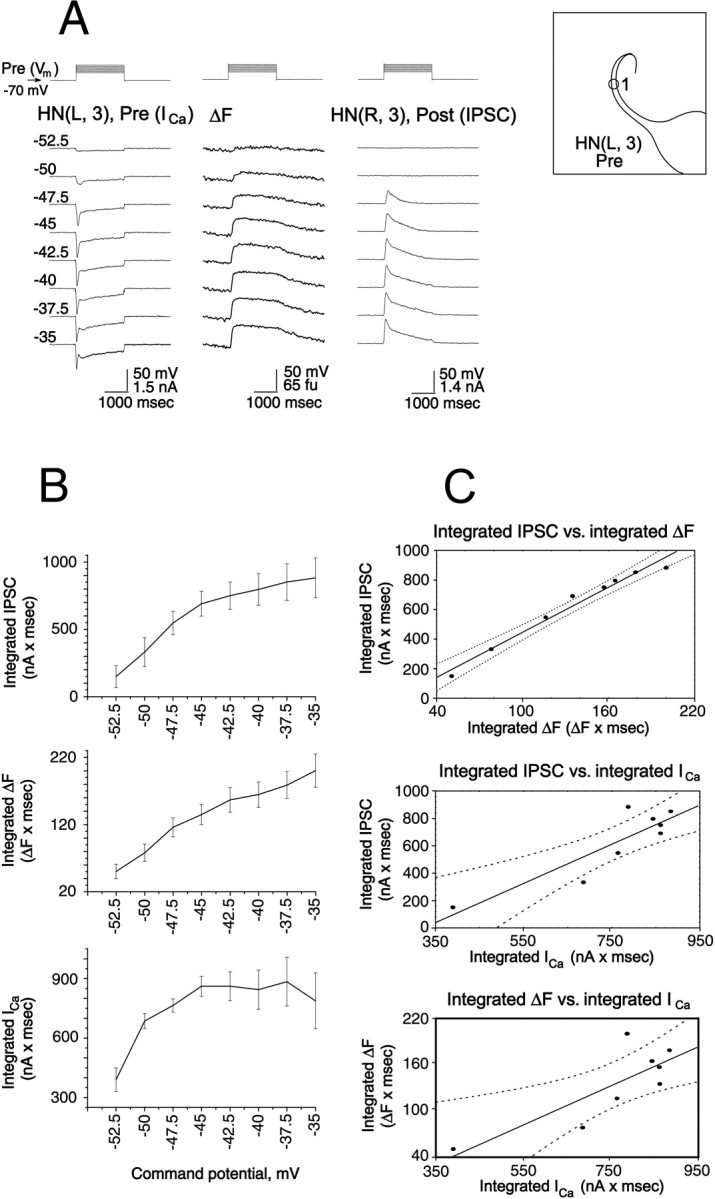
Presynaptic low-threshold Ca currents, presynaptic changes in Ca fluorescence, and associated IPSCs are correlated in heart interneurons. A, Simultaneous recordings of presynaptic low-threshold Ca currents (ICa) and changes in Ca fluorescence (ΔF, at the site indicated on the inset) and IPSCs in voltage clamp from a pair of oscillator interneurons. The preparation was bathed in 0 mm Na+/5 mmCa2+ saline, and an increasing series of depolarizing voltage pulses (from a holding potential of −70 mV) was imposed on the presynaptic cell. The postsynaptic cell was held at −40 mV. Changes in Ca fluorescence (ΔF) were recorded at 30 Hz.B, The experiment of panel A was repeated in seven preparations, and the relations of average integratedICa, ΔF, and IPSC to the command potential during the pulse were plotted as mean ± SE.C, Using the data shown in panel B the relations between average integrated IPSC and average integrated ΔF and ICa were plotted, and the relation between average integrated ΔF and ICa was plotted. Solid straight lines are from linear regression of the data, and dotted lines are 95% confidence intervals of the regression line.
The dynamics of the relations expressed above were complex, however. Clearly, presynaptic Ca current rises and peaks more rapidly with command potential than either Δ[Ca2+]i(measured as the change in Ca fluorescence) or the postsynaptic conductance (measured as IPSC), whereas the latter two quantities rise nearly in parallel. As presynaptic Ca current inactivated first rapidly (ICaF) and then more slowly (ICaS) postsynaptic conductance fell in a delayed manner, but Ca fluorescence remained elevated for the duration of the command potential pulse. The Δ[Ca2+]i (change in Ca fluorescence) reaches its maximum afterICaF has fully inactivated. Table1 compares the time constants of inactivation of ICaS during the pulse with the decay of the slow component of the IPSC and the decline of the Ca fluorescence signal (ΔF) during the pulse at two different pulse potentials. This analysis emphasizes that during the pulse Ca fluorescence declined much more slowly than either ICaS or the IPSC. Moreover, the time constants of decline of the IPSC after the pulse was far shorter at both pulse potentials than the decline in the Ca fluorescence. All time constants shown were calculated with data from the experiments illustrated in Figure 9.
Table 1.
Some time constants (τ) of decay of presynaptic Ca2+ currents, Ca2+ signals (ΔF), and IPSCs, evoked by depolarizing steps from holding potential of −70 mV
| Depolarizing step | τICaS (during depolarization) (sec) | τΔF1(during depolarization) (sec) | τΔF2 (after depolarization release) (sec) | τIPSC1 (during depolarization) (sec) | τIPSC2(after depolarization release) (sec) |
|---|---|---|---|---|---|
| −35 mV | 0.737 ± 0.201 (5) | 4.1 ± 0.69 (5) | 1.7 ± 0.17 (7) | 1.156 ± 0.242 (5) | 0.087 ± 0.019 (5) |
| −40 mV | 0.534 ± 0.259 (4) | 3.3 ± 0.73 (7) | 1.5 ± 0.23 (7) | 1.627 ± 0.338 (6) | 0.109 ± 0.29 (6) |

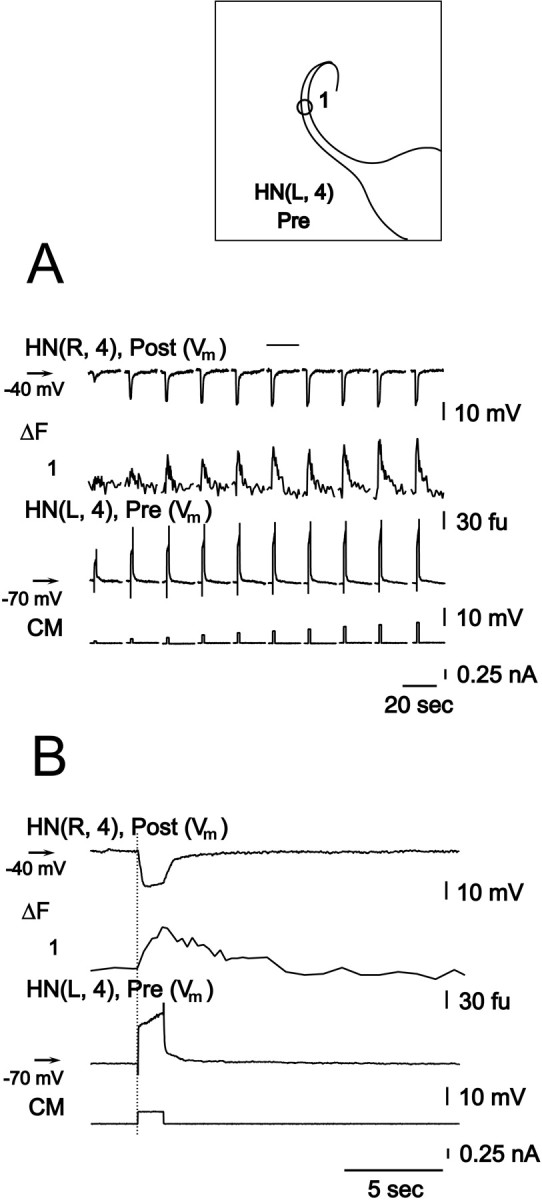
In three experiments described above with reference to Figure 4, we were able to record presynaptic low-threshold Ca currents, associated IPSCs, and presynaptic changes in Ca fluorescence from fine neuritic branches of interneurons near their region of contact with their contralateral partner (Fig. 10). These experiments allowed us to more carefully compare the rise of Ca currents and the rise of [Ca2+]i near the site of synaptic release with the associated IPSCs. At the distal end of a neuritic branch, the beginning of the rise in Ca fluorescence associated with presynaptic voltage pulse lagged the presynaptic Ca current by one video frame (33.3 msec) (at the time, whenICa is 90% maximal, the Ca fluorescence is <10% of its maximum), but it occurred within the same video frame as the beginning of the rise in the IPSC, and the increase in Ca fluorescence was >90% of maximal at the peak of the IPSC (Fig.10). These results suggest that the changes in [Ca2+]i that we record as changes in Ca fluorescence at the end of fine neuritic branches reflect those that mediate graded synaptic release in leech heart interneurons. Although the increase in Ca fluorescence rose and peaked most rapidly at the distal end of neuritic branches, even close to the main neurite, the rise in Ca fluorescence had nearly the same time course.
Fig. 10.
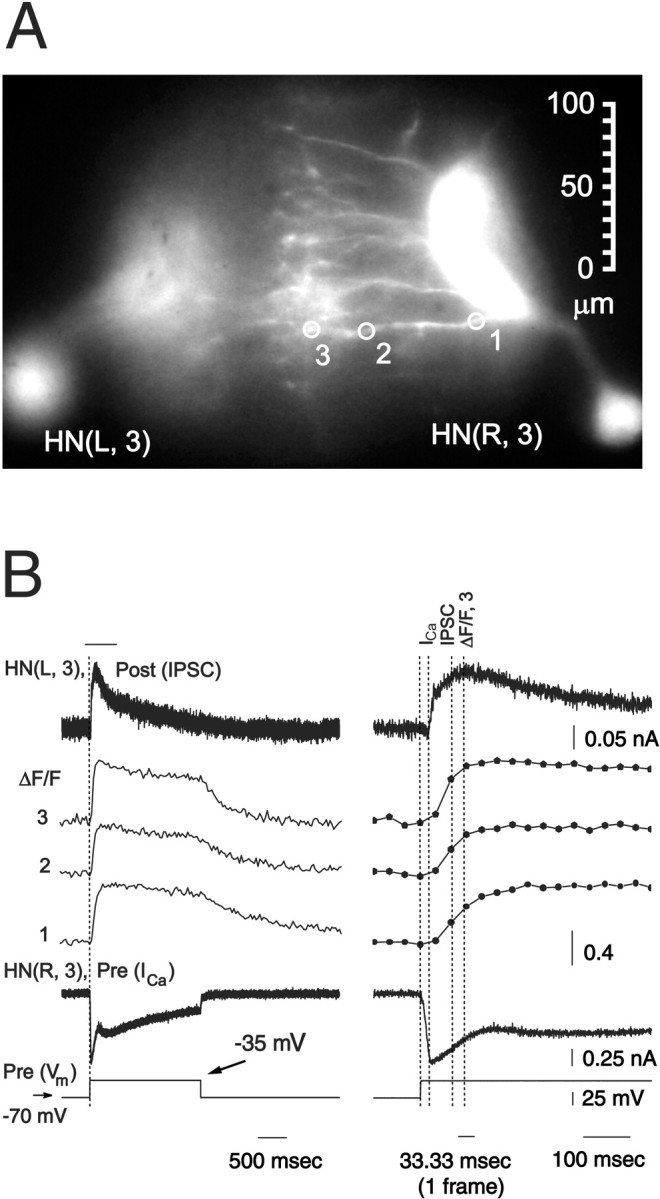
Presynaptic low-threshold Ca currents, presynaptic changes in Ca fluorescence, and associated IPSCs are correlated in heart interneurons. A, Image of preparation (dorsal side up) showing sites for recording changes in normalized Ca fluorescence (ΔF/F). B, Simultaneous recordings of presynaptic low-threshold Ca currents (ICa) and changes in Ca fluorescence and IPSCs in voltage clamp from a pair of oscillator interneurons. Traces on the right are expanded sections of the traces on the left marked by the bar. The preparation was bathed in 0 mm Na+/5 mmCa2+ saline and repeated (n = 4; average traces shown) depolarizing voltage pulses to −35 mV (from a holding potential of −70 mV) were imposed on the presynaptic cell. The postsynaptic cell was held at −40 mV. Changes in Ca fluorescence (ΔF/F) recorded at 30 Hz. Dotted lines show the start of presynaptic depolarizing step and the 90% maximal value of presynaptic ICa, Ca fluorescence in zone 3, and IPSC. Same preparation as in Figure 4.
DISCUSSION
Previous work from our laboratory has shown that low-threshold Ca currents play an important role in the electrical activity of oscillator heart interneurons by supporting burst formation (Arbas and Calabrese, 1987; Angstadt and Calabrese, 1991; Olsen and Calabrese, 1996; Lu et al., 1997). These low-threshold currents appear to comprise a rapidly inactivating (ICaF) and a slowly inactivating (ICaS) component (compare Figs. 8, 9). They also are associated with graded synaptic transmission between these interneurons. More broadly activating, L-like Ca currents, designated high-threshold, are thought to be associated with spike-mediated synaptic transmission (Lu et al., 1997). These currents are selectively blocked by low concentrations of Cd2+ (150 μm) (Lu et al., 1997). Low concentrations of Cd2+(150 μm) also block spike-mediated transmission between oscillator heart interneurons but spare grade transmission and Ca plateau potentials (Lu et al., 1997).
By studying the dynamics of changes in [Ca2+]i with the intracellular indicator Ca Orange, we hoped to determine the distribution of low-threshold Ca channels over the neuritic tree of oscillator heart interneurons and more firmly link Ca2+ entry via these channels with graded synaptic transmission. We found that there are pronounced oscillations in [Ca2+]ithroughout the main neurite and neuritic branches of these neurons during normal rhythmic activity and large increases in [Ca2+]i after hyperpolarization-induced plateaus. The plateaus and associated Δ[Ca2+]i persist in the presence of 150 μmCd2+ and in 0 Na+ saline. However, all activity and/or membrane potential-associated Δ[Ca2+]i values are blocked by 5 mm Co2+. These observations suggest that the Δ[Ca2+]I values we measure during normal activity arise via Ca2+ entry from the extracellular space through low-threshold Ca channels, although we cannot rule out a contribution of high-threshold channels activated by action potentials.
At the highest time resolution of our recording system (30 Hz), we were not able to distinguish significant temporal differences in the dynamics of these Δ[Ca2+]i values along fine neuritic branches or between neuritic branches and the main neurite. These observations indicate that low-threshold channels are widely distributed throughout the ganglionic extent of oscillator heart interneurons. However, our spatial and temporal resolution is not refined enough to eliminate the possibility that this wide distribution is patchy. Indeed there are patches along fine branches where the change in Ca fluorescence during activity is greater than in neighboring regions but it is not possible to tell whether this reflects differences in process thickness, focal resolution, or true differences in local Ca2+ entry.
In experiments on cytosolic extracts from Xenopus laevisoocytes, Allbritton et al. (1992) showed that the diffusion coefficient (D) for free calcium (Ca2+) depended on Ca2+ concentration and was 13 and 65 μm2/sec for 90 nmand 1 μm Ca2+, respectively. In our experiments, the onset time and the time course of Ca fluorescence changes for each recording site were similar, with only small differences in time-to-peak at neuritic sites closest to main neurite. These differences were no larger than 1–2 video frames (33–66 msec). With such a small diffusion coefficient for Ca2+ as observed in oocyte extracts, simple diffusion could not synchronize changes in Ca fluorescence throughout neuritic tree. Moreover, in the oocyte extract experiments (Allbritton et al., 1992), intracellular Ca2+ sequestration was pharmacologically suppressed. Thus, because of normal intracellular Ca2+ uptake in living neurons, diffusion of Ca2+ would be expected to be slower than predicted by the measured diffusion coefficients. There still remains the possibility that diffusion of the Ca2+-Ca Orange complex is significantly faster than the diffusion of free Ca2+ and might thus account at least partially for our observations.
Moreover, our observations are similar to those made by others. Lev-Ram et al. (1992) showed, for example, that in guinea pig cerebellar Purkinje neurons, calcium action potentials were accompanied by transient increases in [Ca2+]i all over the dendritic field. They argued that some observed differences in fluorescence dynamics in thin and thick branches most likely resulted from differences in surface-to-volume ratio of the two kinds of dendrites. Eilers et al. (1995) showed that during synaptic responses, changes of Ca fluorescence in dendrites and a narrow submembrane somatic shell of rat cerebellar Purkinje neurons had similar kinetics and comparable amplitudes. Callewaert et al. (1996) extended these observations to single action potentials and to unmyelinated axons (young animals) and the bare part of myelinated axon (adult animals).
Graded synaptic transmission between oscillator interneurons showed a correlation to our measured changes in [Ca2+]i. This relation appears nearly linear for the total amount of transmitter released, as estimated by the integral of the postsynaptic current and the total change in [Ca2+]i, as estimated by the integral of the change in Ca fluorescence (Figs. 8,9). In experiments in which we were able to record presynaptic low-threshold Ca currents, associated IPSCs, and presynaptic changes in Ca fluorescence from fine neuritic branches of heart interneurons near their region of synaptic contact with their contralateral partner, there was a close association between the rise in [Ca2+]i and the rise of the postsynaptic conductance (Fig. 10). These results suggest that the changes in [Ca2+]i that we record at the end of fine neuritic branches reflect those that mediate graded synaptic release in leech heart interneurons. Although the Ca fluorescence rose and peaked most rapidly at the distal end of neuritic branches, even close to the main neurite the rise of Ca fluorescence was nearly parallel. On the other hand, as noted in our earlier work, the decline in the IPSC was more similar to the decline of low-threshold Ca currents than to the decline in Ca fluorescence measured here (Fig. 9, Table 1). A nonlinear dependence of transmitter release on Δ[Ca2+]i and/or some sort of vesicular depletion or mobilization event may underlie these temporal mismatches (Katz and Miledi, 1968, 1970; Zucker, 1989).
The dynamics of Ca fluorescence changes using intracellular Ca indicator dyes have been observed in several other motor systems (Bascai et al., 1995; Fetcho and O'Malley, 1997; Fetcho et al., 1998;Krieger et al., 1999; Lev-Tov and O'Donovan, 1995; McClellan et al., 1994; McPherson et al., 1997; Ross and Graubard, 1989). In some cases, these fluorescence changes have been used as monitors of cellular activity in lieu of microelectrode recordings. Our results indicate that Ca fluorescence is indeed a useful monitor of electrical activity with distinct changes associated with depolarization and bursting activity and during hyperpolarizing inhibition.
In a similar study in the crab stomatogastric ganglion, Ross and Graubard (1989) recorded several neurons in which Ca dynamics during rhythmic activity were similar to those we have reported here for oscillator heart interneurons; Ca dynamics were uniform throughout the neuritic tree and reflected the slow wave of electrical activity. They also recorded neurons in which the Ca dynamics varied throughout the neuritic tree of the neurons. In these neurons, the Ca dynamics in the branches and main neurite near where the axon emerged from the ganglion were related to spike activity exclusively or to a mixture of spike activity and the slow wave of electrical activity, whereas the rest of the neuritic tree showed similar slow wave-related dynamics. Although we have not extensively analyzed Ca dynamics near the axon of heart interneurons, in those preparations where we have, we have noted no differences in Ca dynamics during rhythmic activity.
During normal rhythmic activity there are large variations in the level of [Ca2+]ithroughout the neuritic tree of oscillator heart interneurons. These variations parallel changes in the efficacy of spike-mediated synaptic inhibition between these cells (Olsen and Calabrese, 1996). These observations suggest that residual Ca2+(Shapiro et al., 1980) may contribute to this synaptic plasticity, a hypothesis that is currently being tested using the methods developed here.
Footnotes
This work was supported by National Institutes of Health Grant NS24072.
Correspondence should be addressed to Andrei I. Ivanov, Department of Biology, Emory University, 1510 Clifton Road, Atlanta, GA 30322. E-mail: aivanov@biology.emory.edu.
REFERENCES
- 1.Allbritton NL, Meyer T, Stryer L. Range of messenger action of calcium ion and inositol 1,4,5-trisphosphate. Science. 1992;258:1812–1815. doi: 10.1126/science.1465619. [DOI] [PubMed] [Google Scholar]
- 2.Angstadt JD, Calabrese RL. Calcium currents and graded synaptic transmission between heart interneurons of the leech. J Neurosci. 1991;11:746–759. doi: 10.1523/JNEUROSCI.11-03-00746.1991. [DOI] [PMC free article] [PubMed] [Google Scholar]
- 3.Arbas EA, Calabrese RL. Ionic conductances underlying the activity of interneurons that control heartbeat in the medicinal leech. J Neurosci. 1987;7:3945–3952. doi: 10.1523/JNEUROSCI.07-12-03945.1987. [DOI] [PMC free article] [PubMed] [Google Scholar]
- 4.Augustine GJ, Adler EM, Charlton MP. The calcium signal for transmitter secretion from presynaptic nerve terminals. Ann NY Acad Sci. 1991;635:365–381. doi: 10.1111/j.1749-6632.1991.tb36505.x. [DOI] [PubMed] [Google Scholar]
- 5.Augustine GJ, Adler EM, Charlton MP, Hans M, Swandulla D, Zipser K. Presynaptic calcium signals during neurotransmitter release: detection with fluorescent indicators and other calcium chelators. J Physiol (Paris) 1992;86:129–134. doi: 10.1016/s0928-4257(05)80017-8. [DOI] [PubMed] [Google Scholar]
- 6.Bascai BJ, Wallén P, Lev-Ram V, Grillner S, Tsien RY. Activity-related calcium dynamics in lamprey motoneurons as revealed by video-rate confocal microscopy. Neuron. 1995;14:19–28. doi: 10.1016/0896-6273(95)90237-6. [DOI] [PubMed] [Google Scholar]
- 7.Berridge MJ. Elementary and global aspects of calcium signalling. J Physiol (Lond) 1997;499:291–306. doi: 10.1113/jphysiol.1997.sp021927. [DOI] [PMC free article] [PubMed] [Google Scholar]
- 8.Berridge MJ. Neuronal calcium signalling. Neuron. 1998;21:13–26. doi: 10.1016/s0896-6273(00)80510-3. [DOI] [PubMed] [Google Scholar]
- 9.Callewaert G, Eilers J, Konnerth A. Axonal calcium entry during fast “sodium” action potentials in rat cerebellar Purkinje neurones. J Physiol (Lond) 1996;495:641–647. doi: 10.1113/jphysiol.1996.sp021622. [DOI] [PMC free article] [PubMed] [Google Scholar]
- 10.Dierkes PW, Hochstrate P, Schlue W-R. Voltage-dependent Ca2+ influx into identified leech neurones. Brain Res. 1997;746:285–293. doi: 10.1016/s0006-8993(96)01264-4. [DOI] [PubMed] [Google Scholar]
- 11.Eberhard M, Erne P. Calcium binding to fluorescent calcium indicators: Calcium Green, Calcium Orange and Calcium Crimson. Biochem Biophys Res Commun. 1991;180:209–215. doi: 10.1016/s0006-291x(05)81278-1. [DOI] [PubMed] [Google Scholar]
- 12.Eilers J, Plant T, Konnerth A. Localized calcium signalling and neuronal integration in cerebellar Purkinje neurones. Cell Calcium. 1996;20:215–226. doi: 10.1016/s0143-4160(96)90108-6. [DOI] [PubMed] [Google Scholar]
- 13.Eilers J, Callewaert G, Armstrong C, Konnerth A. Calcium signalling in a narrow somatic submembrane shell during synaptic activity in cerebellar Purkinje neurons. Proc Natl Acad Sci USA. 1995;92:10272–10276. doi: 10.1073/pnas.92.22.10272. [DOI] [PMC free article] [PubMed] [Google Scholar]
- 14.Fetcho JR, O'Malley DM. Imaging neuronal networks in behaving animals. Curr Opin Neurobiol. 1997;7:832–838. doi: 10.1016/s0959-4388(97)80143-2. [DOI] [PubMed] [Google Scholar]
- 15.Fetcho JR, Cox KJA, O'Malley DM. Monitoring activity in neuronal populations with single-cell resolution in a behaving vertebrate. Histochem J. 1998;30:153–167. doi: 10.1023/a:1003243302777. [DOI] [PubMed] [Google Scholar]
- 16.Ghosh A, Greenberg ME. Calcium signalling in neurons: molecular mechanisms and cellular consequences. Science. 1995;268:239–247. doi: 10.1126/science.7716515. [DOI] [PubMed] [Google Scholar]
- 17.Haugland RP. Handbook of fluorescent probes and research chemicals, Ed 6. Molecular Probes; Eugene, OR: 1996. [Google Scholar]
- 18.Helmchen F, Svoboda K, Denk W, Tank DW. In vivo dendritic calcium dynamics in deep layer cortical pyramidal neurons. Nat Neurosci. 1999;2:989–996. doi: 10.1038/14788. [DOI] [PubMed] [Google Scholar]
- 19.Jaffe DB, Brown TH. Confocal imaging of dendritic Ca2+ transients in hippocampal brain slices during simultaneous current- and voltage-clamp recording. Microsc Res Tech. 1994;29:279–289. doi: 10.1002/jemt.1070290404. [DOI] [PubMed] [Google Scholar]
- 20.Katz B, Miledi R. The role of calcium in neuromuscular facilitation. J Physiol (Lond) 1968;195:481–492. doi: 10.1113/jphysiol.1968.sp008469. [DOI] [PMC free article] [PubMed] [Google Scholar]
- 21.Katz B, Miledi R. Further study of the role of calcium in synaptic transmission. J Physiol (Lond) 1970;207:789–801. doi: 10.1113/jphysiol.1970.sp009095. [DOI] [PMC free article] [PubMed] [Google Scholar]
- 22.Krieger P, Büschges A, El Manira A. Calcium channels involved in synaptic transmission from reticulospinal axons in lamprey. J Neurophysiol. 1999;81:1699–1705. doi: 10.1152/jn.1999.81.4.1699. [DOI] [PubMed] [Google Scholar]
- 23.Lev-Ram V, Miyakawa H, Lasser-Ross N, Ross W. Calcium transients in cerebellar Purkinje neurons evoked by intracellular stimulation. J Neurophysiol. 1992;68:1167–1177. doi: 10.1152/jn.1992.68.4.1167. [DOI] [PubMed] [Google Scholar]
- 24.Lev-Tov A, O'Donovan MJ. Calcium imaging of motoneuron activity in the en-bloc spinal cord preparation of the neonatal rat. J Neurophysiol. 1995;74:1324–1334. doi: 10.1152/jn.1995.74.3.1324. [DOI] [PubMed] [Google Scholar]
- 25.Llinás R, Sugimori M, Silver RB. Microdomains of high calcium concentration in a presynaptic terminal. Science. 1992;256:677–679. doi: 10.1126/science.1350109. [DOI] [PubMed] [Google Scholar]
- 26.Lipscombe D, Madison DV, Poenie M, Reuter H, Tsien RW, Tsien RY. Imaging of cytosolic Ca2+ transients arising from Ca2+ stores and Ca2+ channels in sympathetic neurons. Neuron. 1988;1:355–365. doi: 10.1016/0896-6273(88)90185-7. [DOI] [PubMed] [Google Scholar]
- 27.Lu J, Dalton JF, IV, Stokes DR, Calabrese RL. Functional role of Ca2+ currents in graded and spike-mediated synaptic transmission between leech heart interneurons. J Neurophysiol. 1997;77:1779–1794. doi: 10.1152/jn.1997.77.4.1779. [DOI] [PubMed] [Google Scholar]
- 28.Mainen Z, Malinow R, Svoboda K. Synaptic calcium transients in single spines indicate that NMDA receptors are not saturated. Nature. 1999;399:151–155. doi: 10.1038/20187. [DOI] [PubMed] [Google Scholar]
- 29.McClellan AD, McPherson D, O'Donovan MJ. Combined retrograde labeling and calcium imaging in spinal cord and brainstem neurons of the lamprey. Brain Res. 1994;663:61–68. doi: 10.1016/0006-8993(94)90462-6. [DOI] [PubMed] [Google Scholar]
- 30.McPherson D, McClellan AD, O'Donovan MJ. Optical imaging of neuronal activity in tissue labeled by retrograde transport of Calcium Green Dextran. Brain Res Brain Res Protoc. 1997;1:157–164. doi: 10.1016/s1385-299x(96)00024-4. [DOI] [PubMed] [Google Scholar]
- 31.Nichols JG, Baylor DA. Specific modalities and receptive fields of sensory neurons in the central nervous system of the leech. J Neurophysiol. 1968;31:740–756. doi: 10.1152/jn.1968.31.5.740. [DOI] [PubMed] [Google Scholar]
- 32.Nohmi M, Hua S-Y, Kuba K. Intracellular calcium dynamics in response to action potentials in bullfrog sympathetic ganglion cells. J Physiol (Lond) 1992;458:171–190. doi: 10.1113/jphysiol.1992.sp019412. [DOI] [PMC free article] [PubMed] [Google Scholar]
- 33.Olsen ØH, Calabrese RL. Activation of intrinsic and synaptic currents in leech heart interneurons by realistic waveforms. J Neurosci. 1996;16:4958–4970. doi: 10.1523/JNEUROSCI.16-16-04958.1996. [DOI] [PMC free article] [PubMed] [Google Scholar]
- 34.Regehr WG, Tank DW. Postsynaptic NMDA receptor-mediated calcium accumulation in hippocampal CA1 pyramidal cell dendrites. Nature. 1990;345:807–810. doi: 10.1038/345807a0. [DOI] [PubMed] [Google Scholar]
- 35.Regehr WG, Tank DW. Dendritic calcium dynamics. Curr Opin Neurobiol. 1994;4:373–382. doi: 10.1016/0959-4388(94)90099-x. [DOI] [PubMed] [Google Scholar]
- 36.Regehr WG, Connor JA, Tank DW. Optical imaging of calcium accumulation in hippocampal pyramidal cells during synaptic activation. Nature. 1989;341:533–536. doi: 10.1038/341533a0. [DOI] [PubMed] [Google Scholar]
- 37.Richardson CM, Dowdall MJ, Green AC, Bowman D. Novel pharmacological sensitivity of the presynaptic calcium channels controlling acetylcholine release in skate electric organ. J Neurochem. 1995;64:944–947. doi: 10.1046/j.1471-4159.1995.64020944.x. [DOI] [PubMed] [Google Scholar]
- 38.Robitaille R, E, Adler EM, Charlton MP. Strategic Location of Calcium Channels at transmitter release sites of frog neuromuscular synapses. Neuron. 1990;5:773–779. doi: 10.1016/0896-6273(90)90336-e. [DOI] [PubMed] [Google Scholar]
- 39.Ross WN, Graubard K. Spatially and temporally resolved calcium concentration changes in oscillating neurons of crab stomatogastric ganglion. Proc Natl Acad Sci USA. 1989;86:1679–1683. doi: 10.1073/pnas.86.5.1679. [DOI] [PMC free article] [PubMed] [Google Scholar]
- 40.Shapiro E, Castellucci VF, Kandel ER. Presynaptic membrane potential affects transmitter release in an identified neuron in Aplysia by modulating the Ca2+ and K+ currents. Proc Natl Acad Sci USA. 1980;77:629–633. doi: 10.1073/pnas.77.1.629. [DOI] [PMC free article] [PubMed] [Google Scholar]
- 41.Shibuya I, Douglas WW. Calcium channels in rat melanotrophs are permeable to manganese, cobalt, cadmium, and lantanium, but not to nickel: evidence provided by fluorescence changes in Fura-2 loaded cells. Endocrinology. 1992;131:1936–1941. doi: 10.1210/endo.131.4.1327724. [DOI] [PubMed] [Google Scholar]
- 42.Tolbert LP, Calabrese RL. Anatomical analysis of contacts between identified neurons that control heartbeat in the leech Hirudo medicinalis. Cell Tissue Res. 1985;242:257–267. [Google Scholar]
- 43.Zucker RS. Short-term synaptic plasticity. Annu Rev Neurosci. 1989;12:13–31. doi: 10.1146/annurev.ne.12.030189.000305. [DOI] [PubMed] [Google Scholar]