

Abstract
In primates, lesions of striate cortex (V1) result in scotomas in which only rudimentary visual abilities remain. These aspects of vision that survive V1 lesions have been attributed to direct thalamic pathways to extrastriate areas, including the middle temporal area (MT). However, studies in New World monkeys and humans have questioned this interpretation, suggesting that remnants of V1 are responsible for both the activation of MT and residual vision. We studied the visual responses of neurons in area MT in New World marmoset monkeys in the weeks after lesions of V1. The extent of the scotoma in each case was estimated by mapping the receptive fields of cells located near the lesion border and by histological reconstruction. Two response types were observed among the cells located in the part of MT that corresponds, in visuotopic coordinates, to the lesioned part of V1. Many neurons (62%) had receptive fields that were displaced relative to their expected location, so that they represented the visual field immediately surrounding the scotoma. This may be a consequence of a process analogous to the reorganization of the V1 map after retinal lesions. However, another 20% of the cells had receptive fields centered inside the scotoma. Most of these neurons were strongly direction-selective, similar to normal MT cells. These results show that MT cells differ in their responses to lesioning of V1 and that only a subpopulation of MT neurons can be reasonably linked to residual vision and blindsight.
Keywords: marmoset, vision, extrastriate, receptive fields, blindsight, scotoma
In primates, lesioning of occipital cortex leads to a scotoma, the extent of which corresponds to the affected portion of the visuotopic map in striate cortex (area V1) (Grüsser and Landis, 1992). However, some visual functions remain within the affected visual field sector. For example, studies using forced-choice psychophysical tests have revealed that patients with V1 lesions can still orient toward stimuli presented within the scotoma and are even capable of correctly “guessing” some characteristics of these stimuli (Stoerig and Cowey, 1997). These subconscious visual abilities that survive V1 lesions have been referred to as “blindsight” (Weiskrantz, 1986), a condition whose phenomenology has been replicated in monkeys (Cowey and Stoerig, 1995). Moreover, if stimuli of certain spatiotemporal characteristics are presented within the scotoma, a crude level of conscious visual sensation is revealed (Weiskrantz et al., 1995).
Interpretations of the sources of blindsight and residual vision are typically based on the activity of extrastriate visual areas, activated by thalamic routes that bypass V1. Lesions (Rodman et al., 1989) or brief inactivations (Bullier et al., 1994) of V1 in Old World monkeys do not completely abolish the visual responses of cells in some extrastriate areas, including the middle temporal area (MT), a result that is compatible with the above hypothesis. In contrast, a study in New World monkeys (Aotus trivirgatus) in which MT was studied immediately after a V1 lesion reported no residual activity in the sector of MT that corresponded, in visuotopic coordinates, to the destroyed part of V1 (Krubitzer and Kaas, 1992). This result is compatible with the hypothesis that blindsight and residual vision are attributable to artifactual stimulation of parts of V1 that survive the lesion (Fendrich et al., 1992; Schärli et al., 1999).
An important issue is whether the visuotopic organization of area MT is altered by long-term lesions of V1. Studies using retinal lesions have revealed a significant potential for plasticity in the visuotopic representations in cortex (Kaas et al., 1990; Gilbert and Wiesel, 1992;Schmid et al., 1996). It is possible that the partial deafferentation caused by a V1 lesion also brings about alterations in the visuotopic map of MT, the extent of which could limit the contribution of this area to blindsight and residual vision. Whereas receptive fields of near normal dimensions and direction selectivity have been reported to exist in MT of V1-lesioned macaques, the possibility of long-term changes in the visuotopic map has not yet been addressed. Part of the problem is that the visuotopic map in macaque MT is complex, including re-representations and local discontinuities, even in normal monkeys (Maunsell and Van Essen, 1987). For this reason, the simpler and more stereotyped map in MT of New World monkeys (Allman and Kaas, 1971; Rosa and Elston, 1998) provides a better model in which to study this issue. Here we report on the visuotopic organization and response properties of MT cells several weeks after lesions of V1 in the marmoset, a species of New World monkey with diurnal habits.
MATERIALS AND METHODS
Six marmosets (Callithrix jacchus) received a unilateral lesion of V1, whereas six nontreated animals, used for a previous study (Rosa and Elston, 1998), served as controls. All animals were sexually mature and past the period of rapid changes in cellular, synaptic, and columnar organization of visual cortex that characterizes the first year of postnatal life in marmosets (Missler et al., 1993;Spatz et al., 1994). Electrophysiological recordings in and around MT were performed several weeks after lesion (Table1). All experiments were conducted following the ethical guidelines established by the National Health and Medical Research Council of Australia and were authorized and monitored by the Animal Experimentation Ethics Committees of the University of Queensland and Monash University.
Table 1.
Animals and survival times after lesion
| Case1-a | Age when lesioned (months) | Body weight (grams) | Postlesion recovery (days) |
|---|---|---|---|
| 2 | 40 | 309 | 29 |
| 4 | 37 | 393 | 38 |
| 6 | 40 | 355 | 34 |
| 7 | 24 | 349 | 35 |
| 9 | 21 | 350 | 40 |
| 10 | 25 | 335 | 28 |
Cases 1, 3, 5, and 8 were part of a related study but had no recordings in area MT.
Cortical lesions. The animals were anesthetized with intramuscular injections of ketamine (50 mg/kg) combined with xylazine (3 mg/kg). Additional doses of ketamine (5–10 mg) were used to maintain a surgical level of anesthesia (evaluated by monitoring the leg withdrawal and corneal reflexes). Injections of dexamethasone (0.4 mg/kg, i.m.) and atropine (0.15 mg/kg, i.m.) were also administered. Under sterile conditions, a craniotomy was made over the occipital pole of the right hemisphere, allowing access to V1. After removal of the dura mater, a suction probe was used to destroy V1, using previously published stereotaxic coordinates and visuotopic maps of this area as guides (Fritsches and Rosa, 1996). As illustrated in Figure1, the topography of the marmoset cortex is such that a vertical ablation at an appropriate anteroposterior level results in a lesion nearly restricted to V1, affecting mostly the central representation and leaving the far peripheral representation untouched. Variations in the anteroposterior level of the lesion between cases yielded scotomas of different sizes and shapes (Fig.2). The left hemisphere was always left untouched. After hemostasis, the exposed parts of the cortex and brainstem were protected with a sterile soft contact lens, and the piece of skull removed during surgery was cemented back in place with bone wax and dental acrylic. Special care was taken to ensure a smooth acrylic covering, without imperfections or cutting edges that could cause discomfort. Once the acrylic was dry, the muscle and skin were sutured back in anatomical layers. Injections of long-lasting antibiotics (Norocillin, 0.1 ml, i.m.) and saline with glucose (5 ml, s.c., to prevent dehydration during the recovery period) were also administered. The marmosets were then placed in a dimly lit, warm room, under the close supervision of one of the experimenters. They recovered their normal posture within 3–4 hr of the surgery and were able to eat and drink shortly thereafter.
Fig. 1.

Location and visuotopy of areas V1 and MT in the marmoset monkey, shown on lateral and medial (mirror-reversed) views of a right hemisphere. In the medial view, the banks of the calcarine sulcus were opened to reveal the part of V1 hidden therein. Isoeccentricity lines (2.5, 5, 10, 20, 40, and 60°) are indicated bythin dotted lines, and isopolar lines (−45, +45, and HM) are indicated by thin continuous lines. The intended ablation (caudal to the plane shown by the thick dashed line) would remove the central representation of V1 up to 20–30° of eccentricity.
Fig. 2.

Extent of the V1 lesions and scotomas in four animals. For each case, the estimated extent of the scotoma (gray) is indicated on a view of the central 40° of the visual field (HM and VM). The receptive fields of V1 neurons used as the basis for this estimate, which were recorded at sites near the lesion border, are also illustrated (rectangles and ovals). Theinsets at the bottom of each diagram show a projection of the extent of the scotoma on an averaged map of marmoset V1 (from Fritsches and Rosa, 1996). In these maps, isoeccentricity lines are indicated by thin dotted lines, and isopolar lines are indicated by thin continuous lines.
Electrophysiological recordings: animal care and preparation. Each of the animals underwent a single recording session. The procedures for anesthetic induction and medication were the same as those described for the lesion surgery. A tracheotomy was performed, and a tracheal tube was inserted to enable artificial ventilation. The marmoset was placed on a thermostatically controlled heating pad, and its head was positioned in a stereotaxic frame. The cortex was exposed, and an acrylic well was constructed around the craniotomy, being secured to the skull by orthopedic screws. A rod attached to an adjustable arm (mounted on the stereotaxic frame) was positioned over the frontal midline and fixed to the acrylic well. This arrangement allowed the head to be supported without the need for stereotaxic bars and offered an unhindered field of vision. The well was then filled with silicone oil, and a picture of the cortical surface was taken for plotting of electrode penetration sites.
After all surgical procedures were completed, the animal was administered an intravenous infusion of a mixture of pancuronium bromide (0.1 mg · kg−1 · h−1) sufentanil (6 μg · kg−1 · h−1), and dexamethasone (0.4 mg · kg−1 · h−1), in a saline–glucose solution. This induced muscular paralysis but maintained anesthesia. The animal was artificially ventilated with a gaseous mixture of nitrous oxide and oxygen (7:3), the percentage of CO2 in the expired air being maintained between 3.5 and 4.0% by adjustment of the respiratory rate and volume of the pump. The electrocardiogram was monitored using a computer-based data acquisition system (MacLab 8; Analog Digital Systems, Sydney, Australia). The level of anesthesia was monitored using electrocardiographic criteria (in particular, changes in heart rate in response to noxious stimuli, as detailed by Rosa et al., 1993) and the level of spontaneous activity in the brain, captured via microelectrode penetrations at sites away from the cortical lesion (Rosa et al., 1995).
Protection of the cornea, dioptric correction, and control for eye movements. Administration of atropine (1%) and phenylephrine hydrochloride (10%) eye drops resulted in mydriasis and cycloplegia. Application of a hard contact lens with a curvature radius of 3.4–3.6 mm focused the left eye (contralateral to the lesion) on the surface of a translucent hemispheric screen (radius of 60 cm) and protected the cornea from desiccation. Repeated ophthalmoscopic inspections revealed that optic media quality remained stable throughout the recordings. The right eye was also covered with a contact lens for protection but was kept covered by an opaque metal shield, except for occasional checks (e.g., when a cell responded poorly to the left eye or when responses were sampled in the hemisphere contralateral to the lesion). A reversible ophthalmoscope was used to project the position of the optic disks and foveae onto the hemispheric screen. The horizontal meridian (HM) of the visual field was defined as a line connecting the centers of the left eye fovea and blind spot (Troilo et al., 1993), and the vertical meridian (VM) was defined as perpendicular to the HM through the center of the fovea. As described previously (Rosa and Schmid, 1995), the doses of pancuronium used resulted in no residual eye movements being detectable in these experiments, as evaluated by repeated examination of the position of the fovea (i.e., the variation between consecutive estimates was within the error afforded by the reversible ophthalmoscope, which is 0.5–1°) (Fritsches and Rosa, 1996).
Electrophysiological recordings. The electrophysiological experiments consisted of three consecutive phases: (1) mapping of receptive fields in MT and surrounding areas, using hand-held stimuli; (2) mapping of receptive fields in V1, in tissue immediately surrounding the lesion, using hand-held stimuli; and (3) Quantitative analysis of single-unit responses at selected recording sites, using stimuli presented within and outside the estimated boundaries of the scotoma.
In all three phases of the experiment, tungsten-in-glass microelectrodes with an exposed tip of 10 μm were inserted in the vertical stereotaxic plane. Amplification and filtering of the electrophysiological signal was achieved via an AM Systems Model 1800 Microelectrode AC amplifier (AM Systems, Everett, WA) and a 50 Hz eliminator (HumBug; Quest Scientific, Vancouver, Canada). The signal was further processed by a computer-based waveform discrimination system (SPS-8701; Signal Processing Systems, Adelaide, Australia; operated on a 133MHz Pentium computer), which allowed the isolation of single-unit spike trains with high temporal resolution.
The experiment started with the qualitative study of receptive field extent and direction selectivity of neurons in MT. The protocol and techniques were the same as those used in our study of MT in normal marmosets (Rosa and Elston, 1998). In each animal, several electrode penetrations were directed toward the approximate location of MT, using the caudal tip of the lateral sulcus as a landmark for the location of the peripheral representation in this area. Although it was clear from the intended location of the V1 lesion that the affected portion of the visual field was primarily the central representation (Fig. 1), this initial receptive field mapping was done blindly with respect to the exact borders of the scotoma. The stimuli were luminous white spots (1–10° in diameter) and bars (2–20° long, 0.2–1° wide), moved on the surface of the hemispheric screen, via a hand-held projector. In each penetration, we sought to isolate single cell responses at sites located ∼200 μm from each other. If a clearly separable unit was not found within 300 μm of the last site, the multiunit activity was studied instead. Receptive fields based on multiunit recordings represented ∼10% of the sample. Unresolved background activity was not studied. Neurons were classified as unidirectional, bidirectional, or pandirectional (Albright, 1984). The type of response habituation to repetitive stimulation was also recorded, with cells being classified as either strongly habituating or weakly/nonhabituating.
Once the first phase of the experiment was deemed complete (typically after six to eight electrode tracks), additional electrode penetrations were aimed at the remnant part of V1, near the boundaries of the lesion. The aim of this phase of the experiment was to enable an estimation of the boundaries of the scotoma caused by the V1 lesion (in this paper, we use the word “scotoma” to refer to the region of the visual field that was originally represented in the ablated part of V1; this usage is justified on the basis of the symptoms experienced by humans and other primates after similar lesions). To obtain an estimate of the borders of the scotoma during the recording session, the electrode was moved from caudal to rostral, in rows perpendicular to the lesion border, until the first responses were obtained. Recordings were obtained at various depths, including in the calcarine sulcus and on the ventral surface. The borders of the scotoma were then estimated by drawing a line joining the inner boundaries of the receptive fields mapped at the recording sites nearest to the borders of the lesion. In some regions, the extent of the lesion was such that it reached the border between V1 and the second visual area (V2). This resulted in no responses along some parts of the perimeter of the lesion, indicating that, as in other monkeys (Cowey, 1964; Girard and Bullier, 1989), the visual responses of cells in marmoset V2 depend on inputs from V1. In these cases, the corresponding parts of the perimeter of the scotoma were estimated as the vertical meridian, which is normally represented along the outer boundary of V1 (Fritsches and Rosa, 1996). Based on a comparison between myelin-stained sections through V2 in normal and lesioned hemispheres, the maximum invasion of V2 was estimated to be ∼1.5 mm dorsally and 1 mm ventrally, in case 2. In three other cases (6, 7, and 9) direct damage to V2 was slight, both dorsally and ventrally, and restricted to the immediate vicinity of V1. The remaining two cases (4 and 10) had lesions that were primarily restricted to V1 but that touched its V2 border at some points.
In the third part of the experiments, the electrode was again aimed at MT, with the objective of quantitatively studying the single-unit responses to stimuli presented either inside or outside the scotoma. For these analyses, the spike trains processed by the SPS-8701 system were collected via a high-fidelity interface (ITC-16 Nubus; Instrutech Corp., Great Neck, NY) into a Macintosh Power PC 604e/120MHz computer (Apple Computers, Cupertino, CA), which also controlled visual stimulus generation. High-contrast drifting sine wave gratings were generated by a stimulus/data collection software package (A/DVance 3.55; McKellar Designs, Vancouver, British Columbia, Canada). These stimuli were presented on an Apple Multiple Scan 20 inch monitor (Apple Computers) located 60 cm from the eyes. The screen resolution was set to 1152 × 870 pixels, and the refresh rate was set to 75 Hz. The spatiotemporal characteristics of the stimuli were adjusted for each cell while qualitatively monitoring the responses of the cell to a full screen grating. After that, quantitative tests were performed to quantify the direction and speed sensitivities of the neuron in response to two types of stimulus: a drifting grating that nearly completely filled the estimated borders of the scotoma (the “inside” condition) and the same grating presented to the entire screen, except for the scotoma (the “outside” condition). In both conditions, the remaining part of the screen was presented with a nonmodulated gray, the luminance of which matched the average of the grating pattern. The gray pattern also covered a strip of the visual field that included the approximate borders of the scotoma, estimated as explained above. The width of this strip was 2° centrally but increased toward the periphery according to the known relationship between receptive field size and eccentricity in V1 (Fritsches and Rosa, 1996).
Histology. At the end of the experiment, the animal was given a lethal dose of sodium pentobarbitone (100 mg/kg) and perfused transcardially with 0.9% saline, followed by 4% paraformaldehyde in 0.1 m phosphate buffer, pH 7.4. Once the brain was removed from the skull, it was placed into fixative with increasing concentrations of sucrose and sectioned into 40 μm coronal slices using a freezing microtome. Alternate series were stained for Nissl substance (with cresyl violet) and myelin (Schmued, 1990), allowing the reconstruction of electrode tracks, architectonical boundaries, and the extent of the cortical lesion. The positions of recording sites along each penetration were reconstructed based on the images of the brain surface obtained during the experiment, histological reconstruction of electrode tracks, electrolytic lesions, and transitions between gray and white matter. Shrinkage attributable to histological processing (2–14% linearly, in different cases) was estimated by comparing the distances between the electrode tracks in the sections with microdrive readings. All measurements presented have been corrected for shrinkage. Two-dimensional reconstructions of the cortical surface were obtained by graphically “unfolding” contours of layer 4 of sections 640 μm apart, in such a way as to retain the neighborhood relationships between and within sections (Van Essen and Maunsell, 1980). To ensure the proper alignment and spacing between contours, we used horizontal reference needles as landmarks to align the sections and calculated the correct spacing by trigonometry every 2 mm along each contour. Because the surface of the marmoset cortex is naturally smooth for most of its extent, no discontinuities needed to be introduced in the maps of MT. The recording site locations were radially projected onto the two-dimensional maps of layer 4, following the orientation of the fascicles of cells observed in Nissl-stained sections.
Determination of the extent of the scotomas. For the purposes of data analysis, the determination of the extent of the scotomas caused by the lesions was based on a process of successive approximations, starting with the examination of histological sections through the remaining parts of V1. The limits of V1 were located using architectonic criteria (Gebhard et al., 1993), which included the thickness and sublaminar structure of layer 4. In cases in which the border region was lesioned, the involvement of V2 was estimated by comparison with sections from corresponding stereotaxic levels of the nonlesioned hemisphere. Once the extent of the lesion was estimated, we used receptive field maps from an extensive series of electrophysiological recordings in this species (Fritsches and Rosa, 1996; Rosa et al., 1997) to obtain an initial estimate of the scotoma in each case. As demonstrated by our previous work, both the gyral configuration and the visuotopic maps of V1 and V2 are highly stereotyped in marmosets, allowing one to use the topographic relationship between those two elements as a reliable guide for the estimation of visuotopic coordinates. The estimate thus obtained was fine-tuned using the receptive field mapping data obtained in V1 and V2 during the experiments (Fig. 2). Typically, recording sites within a few hundred micrometers of the lesion border yielded rich multiunit activity and clear responses within small receptive fields. In these regions, the final determination of the borders of the scotoma corresponded to the initial estimate obtained during the experiment. However, in some regions, it was found that the first sites yielding responsive neurons were located over 1 mm from the lesion border. In these cases, (Fig. 2, case #4), the final estimates of the border of the scotoma were adjusted considering the distance between the recording site and the lesion border, the cortical magnification factor of V1, and the average receptive field size (Rosa et al., 1997) at the appropriate eccentricity. [The cortical magnification factor (CMF) in marmoset V1 was calculated on the basis of the data of Fritsches and Rosa (1996). The variation of CMF in this species can be described by the function CMF = 3.95(ecc + 0.64)−0.98.] It should be stressed that, in view of the possibility of some of the remaining cortex near the lesion being inactive because of deafferentation, the borders of the scotomas used in the data analysis were, if anything, conservative.
RESULTS
The main conclusions of this study can be summarized as follows. First, several weeks after unilateral V1 ablations, visually responsive neurons are found throughout MT ipsilateral to the lesion. Second, comparison between the extent and visuotopy of MT in normal animals and animals with V1 lesions allows the estimation of a “lesion projection zone”, i.e., the part of MT in which cells are expected to be affected by the V1 lesion. In the lesion projection zone, threshold mapping of receptive field boundaries often reveals that the receptive fields are displaced beyond the borders of the scotoma. This results in a complex visual topography not seen in normal animals, including sudden jumps in receptive field position and receptive fields comprising two different parts of the visual field. Third, a subgroup of MT cells within the lesion projection zone retain receptive fields that are entirely or partially located within the borders of the scotoma. These cells alternate with cells showing “displaced” receptive fields, sometimes along the same electrode track, in an apparently nonsystematic way. Last, most neurons in MT remain strongly direction selective, both within and outside the lesion projection zone.
Receptive field mapping
In a previous study (Rosa and Elston, 1998), we demonstrated that area MT in normal marmosets has a simple visuotopic organization that is remarkably constant among individuals. As demonstrated in Figure3, at any anteroposterior level, a dorsoventral movement of the electrode results in a regular change in the polar angle of receptive field centers, which gradually move from the lower quadrant toward the upper quadrant. Moreover, receptive fields of neurons recorded at sites <1 mm apart typically overlap to some extent (Fig. 3). In comparison, we found that the visuotopic map in animals with V1 lesions is significantly more complex. This fact is illustrated in Figures4-6, which are examples of receptive field sequences obtained along electrode tracks crossing MT dorsoventrally in V1-lesioned animals.
Fig. 3.

Visuotopic organization of MT in a normal marmoset. Top left, Lateral view of the marmoset brain with the location of MT shown in gray. Middle left, Magnified view of graphically “unfolded” MT, with the locations of recording sites obtained at five successive rostrocaudal levels indicated by horizontal line segments.Bottom left, Reconstructed visuotopy of MT, based on the correlation between these recording sites and the receptive fields illustrated on the right. In the right diagram, receptive fields from the same rostrocaudal level are connected in sequences that correspond to sites progressing from dorsal to caudal in the cortex (e.g., 1–8, 9–15, etc.). For clarity, not every recording site or receptive field obtained in this case is illustrated (Rosa and Elston, 1998).
Fig. 4.

Recording sites and receptive fields in MT of an animal with a V1 lesion (case #7). The sections (left of each panel) correspond to a plane slightly tilted from coronal. The MT cortex is shown magnified, with the location of recording sites obtained in an electrode penetration (circles and crosses) indicated. Black circles indicate cells with weakly or nonhabituating responses, white circles indicate cells with strongly habituating responses, and crossesindicate cells that did not respond to the stimuli used. The borders of MT are indicated by dashed lines. The locations of these electrode penetrations, projected to two-dimensional maps of MT, are indicated by the dotted lines in the top left diagrams. The diagrams on theright of each panel illustrate a portion of the animal's visual field, with the extent of the scotoma shown ingray and receptive fields indicated byrectangles or ovals. The preferred direction of motion of each cell is indicated next to its designation (cell h responded equally well to movement in all directions).
Fig. 5.

Recording sites and receptive fields in MT of an animal with a V1 lesion (case #4). In theright diagram, the receptive fields are indicated using different line patterns only for clarity. Other conventions as in Figure 4.
Fig. 6.

Recording sites and receptive fields in MT of an animal with a V1 lesion (case #6).
The recording sites and receptive fields illustrated in the left panel of Figure 4 exemplify a common result observed in the mapping experiments; the receptive fields avoid the interior of the scotoma, instead representing portions of the visual field immediately outside its borders. The first receptive fields mapped in this track (fields 1–6) follow the normal pattern of representation in MT, moving from the lower field toward the upper field, with some overlap. However, once the lower limit of the scotoma is reached (field 6), this pattern is disrupted. The receptive fields mapped in the next four recording sites (fields 7–10) essentially re-represent the same sector of the visual field represented by field 6. They are followed by a nonoverlapping receptive field around the upper edge of the scotoma (field 11) and an unresponsive neuron (indicated by the x along the penetration). The penetration is completed with two recording sites yielding receptive fields near the vertical meridian (fields 12, 13) and two unresponsive layer 6 cells. Several characteristics of this track are unusual compared with those obtained in normal animals. First, neurons at five consecutive sites (fields 6–10), covering over 1 mm of cortex, re-represent the same region at the lower edge of the scotoma. Second, an electrode movement of as little as 200 μm is sufficient to yield nonoverlapping fields (fields 10, 11). Finally, there are several sites at which neurons do not respond to any of the stimuli used. A variant of this pattern in shown in Figure 6 (left panel) in which the receptive fields follow a broad arc along the lower edge of the scotoma (fields 1–6) and then jump to its upper edge within 240 μm (recording sites and fields 6,7).
The tracks illustrated in Figure 5 and in the right panelsof Figures 4 and 6 demonstrate that not all receptive fields of neurons in MT of lesioned animals avoid the scotoma. For example, in the track shown in the left panel of Figure 5, two receptive fields (fields 7, 8) have boundaries entirely restricted to the scotoma. Indeed, the visuotopic organization revealed by this track resembles that obtained in control animals, with the receptive fields moving gradually from the lower to the upper field. This is not, however, the typical result; more often than not, neurons with receptive fields located entirely inside the scotoma alternate with neurons with displaced fields, often in the same track. This results in a somewhat disorganized representation compared with that of normal animals. For example, in the track illustrated in theright panel of Figure 5, two cells with receptive fields partially overlapping the lower boundary of the scotoma (a,b) are followed, within 150 μm, by a cell with a non-overlapping receptive field (c) representing a small pocket of spared visual field near the fovea [although no penetrations were aimed at this part of V1 (Fig. 2), the existence of this spared region was confirmed by both the presence of responsive V2 cells covering that part of the visual field and histological reconstruction]. The sequence of receptive fields centers then “backtracks,” such that four consecutive cells with receptive fields located in the scotoma (d, g) are observed. After that, the normal lower-to-upper quadrant gradient is resumed (fields h–k). Essentially the same pattern was found in the sequence shown in Figure 4 (right). Finally, the track illustrated in the right panel of Figure6 illustrates alternation between cells with peripheral receptive fields inside the scotoma and those with displaced receptive fields; four cells with receptive fields that follow the normal MT visuotopic gradient (a–d) are followed by a cell with a split receptive field (e), responding to stimulation of both the upper and lower edges of the scotoma. The receptive fields of the following three cells then zigzag between the interior of the scotoma (g) and its upper edge (f, h) before resuming the normal topography and approaching the upper vertical meridian (i–n). There were no clear differences between animals that could be related to the degree of V2 involvement in the lesion. Each of the six cases yielded evidence of both visuotopic reorganization and residual responses inside the scotoma.
Percentages of neurons with different response properties
To assess the changes in the responses of MT cells compared with control animals, it was first necessary to estimate the sectors of MT likely to have originally represented the same part of the visual field as the ablated portion of V1. For simplicity, we will refer to these sectors of MT as the lesion projection zones. The procedure for estimating the prelesion visuotopic maps of MT, and hence the lesion projection zones, is illustrated for three animals in the left column of Figure 7. The estimated “control” location of isoeccentricity and polar lines (Rosa and Elston, 1998) was initially drawn on the individual bidimensional reconstructions of MT based on the average visuotopic map of this area (this average map was based on reconstructions of MT in six normal cases, which were superimposed after having been aligned and scaled to equal area). The estimates of pretreatment visuotopic maps thus obtained were then fine-tuned for each case by taking into consideration the recording sites yielding cells with receptive fields away from the scotoma, which followed the normal visuotopy of MT. Using the estimated prelesion maps of MT (Fig. 7, left column) as guides, the extent of each scotoma was then projected onto the cortex, thus defining an estimate of the lesion projection zone for each case (Fig. 7, gray areas in theright column). Across all animals, 139 cells were found to lie within our estimates of the lesion projection zones, whereas 143 were outside these zones.
Fig. 7.

Left, Estimates of the “normal” (prelesion) visuotopic organization of MT in three animals. The estimated locations of isoeccentricity and isopolar lines are shown, based on the averaged map of MT in six normal animals. The recording sites shown as black circles were used as a guide in regions outside the lesion projection zones. The dashed lines are estimates only. Right, Arrow diagrams indicating the displacement of visuotopic coordinates for individual recording sites. In these diagrams, the extent of the lesion projection zones is shown in gray. For cells within the lesion projection zones, an arrow connects the location of the recording site (circle) to the point of the estimated prelesion map corresponding to the location of the receptive field center. An arrow terminating outside the map indicates a receptive field center in the ipsilateral hemifield. For cells outside the lesion projection zones, this is indicated by aline segmentwithout an arrowhead. Thecrosses indicate the location of nonresponsive neurons. In view of the density of recordings in the central representation ofcase #4, for clarity some recording sites are not included in the arrow diagram (top right).
The arrow diagrams shown in the right column of Figure 7 provide an intuitive view of the extent of receptive field displacement for each recording site in three animals. Thearrows and lines connect the position of each recording site to the location in the visuotopic map corresponding to the geometric center of the neuronal receptive field recorded therein. Thus, the longer the arrow, the farther the receptive field center is from its predicted position (Calford et al., 1999). It is clear from Figure 7 that many of the recording sites within the lesion projection zones are associated with large displacements, which often exceed the radius (600 μm, mean + 2 SD; calculation based on the data of Rosa and Elston, 1998) of the point image size in MT of normal marmosets. As shown in the top panel of Figure8, the estimated visuotopic displacement, in micrometers, is significantly greater for cells and multiunit clusters within the lesion projection zones than for those outside these zones (Mann–Whitney test; U = 1197; z = 11.15; p < 0.0001, two-tailed). In the case of the latter group, the displacement reflects both the errors in estimating the map and the normal receptive field scatter. Displacements exceeding 600 μm, which are unlikely to be explainable on the basis of normal receptive field scatter alone, are associated with 33% of the recordings inside the lesion projection zone.
Fig. 8.

Top, Extent of visuotopic “reorganization” within and outside the lesion projection zones, estimated as illustrated in Figure 7. For sites outside the lesion projection zone (black bars), this indicates the error in estimate attributable to sparse sampling and the normal receptive field scatter. The radius of the point-image size (mean + 2 SD) in normal marmoset MT is indicated by the arrow.Bottom, Percentages of neurons with different functional characteristics in terms of direction selectivity (left) and habituation (right).
Overall, 62% (86 of 139) of the recording sites estimated to be located within the lesion projection zones yielded cells with displaced receptive fields centered outside the scotoma. This percentage takes into consideration only the location of the geometric center of the receptive field; many of these receptive fields invaded the scotoma to some extent (Fig. 4, fields 8–10). Moreover, 20% (28 of 139) of the sites within the lesion projection zones yielded cells with receptive fields centered within the scotoma, whereas only 18% (25 of 139) yielded cells with spontaneous activity but did not respond to any of the stimuli used. This percentage of nonresponsive recordings was much higher (χ2 = 130.6; DF = 1;p < 0.0001) than that observed outside the lesion projection zones (2%) or in MT of nonlesioned animals (<1%).
The proportions of unidirectional, bidirectional, and pandirectional cells inside and outside the lesion projection zones are illustrated in the bottom panel of Figure 8 (these percentages refer to the population of responsive neurons only). These distributions are not statistically different (χ2 = 4.454; DF = 2; p = 0.11). Of particular interest is the fact that the proportions of cells with unidirectional response selectivities are very similar (82% vs 87%) in these two regions. These proportions are also similar to those observed in MT of nonlesioned animals (86%) (Rosa and Elston, 1998). Inside the lesion projection zone, the majority of both those cells with receptive fields centered in the scotoma, and those with displaced receptive fields were direction-selective. Finally, neurons showing strong habituation to the repetitive presentation of the stimuli were significantly more common inside (37%) than outside (10%) the lesion projection zones (χ2 = 81; DF = 1; p< 0.0001).
Quantitative assessment of response properties
For 36 neurons, we sought to confirm that responses can be evoked from stimulation of the region of the visual field inside the scotoma caused by the V1 lesion. As illustrated in Figure9A, this was based on the presentation of drifting sine wave grating patterns that were either restricted to the scotoma (the inside condition) or the surrounding visual field (the outside condition). A ring of visual field surrounding the borders of the scotoma, as estimated during the experiment, was left nonstimulated in both situations. This procedure was chosen so that the assessment of the responsiveness of MT cells to stimulation of the visual field inside the scotoma was independent of the precision of the borders of hand-mapped MT receptive fields. Of the 36 cells, nearly half (17 of 36) showed no significant response to stimulation of the visual field inside the scotoma. This number includes some cells, such as cell 1 in Figure 9, that were not located in the lesion projection zone. Five other cells, all from one animal, were discarded because the size of the scotoma was overestimated during the experiment, and there was inadvertent stimulation of spared visual field in the inside condition. Thus, 13 of the cells unequivocally responded to stimulation restricted to the scotoma.
Fig. 9.
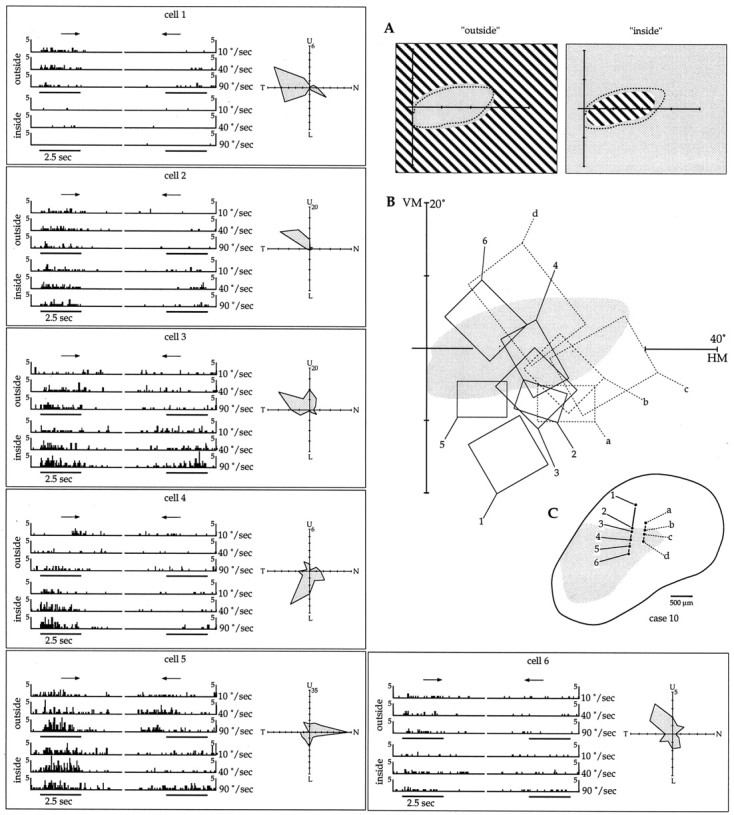
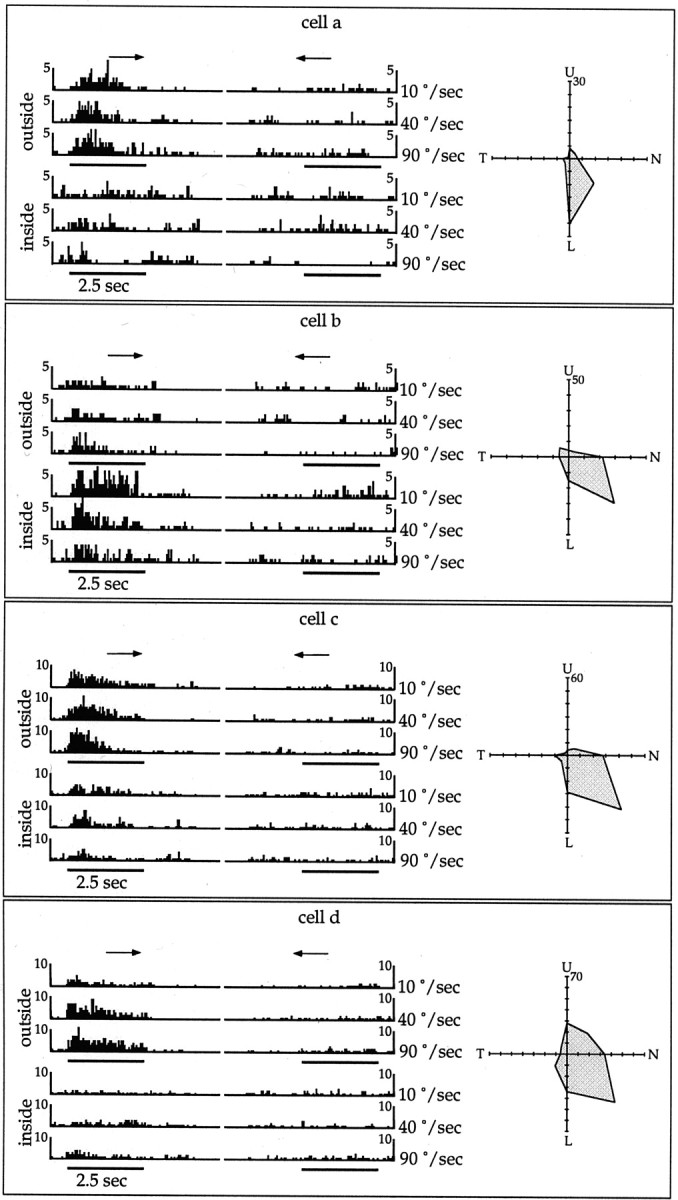
Single-unit analysis of direction selectivity of MT neurons. A, Diagramatic view of the outside and inside conditions of stimulus presentation. The dashed line shows the extent of the scotoma in this case, and thegrating pattern shows the portion of the visual field stimulated in each condition. B, Location of the (hand-mapped) receptive fields of 10 neurons in relation to the scotoma. C, Bidimensional reconstruction of MT, with the estimated extent of the lesion projection zone shown ingray and the recording sites indicated bycircles. The other panels illustrate, for each cell, peristimulus time histograms of the activity in response to stimulation of the outside (top three rows) and inside (bottom three rows) of the scotoma. The histograms on the left represent the responses to stimulus movement in the preferred direction of motion of the cell, and those on theright, responses to movement in a direction 180° from that. The results of stimulation at three different speeds (10, 40, and 90°/sec) are illustrated. The polar plots summarize the direction selectivities, assessed with full-screen gratings.
The responses of 10 MT neurons, studied in two electrode penetrations, are illustrated in Figure 9. For each cell, a polar plot is illustrated, showing its selectivity in response to full-screen gratings crossing the screen in different directions. Confirming the results of the qualitative assessment described above, every responsive cell in these penetrations was found to have a significant direction bias. The panels in Figure 9 also illustrate peristimulus time histograms that reflect, for each cell, the results of stimulation of the visual field outside (top three rows) and inside (bottom three rows) the scotoma. The responses to gratings moving both in the optimal direction of the neuron (arrowpointing to the right) and a direction 180° from that (arrow pointing to the left) are illustrated. These results demonstrate that some neurons in MT show significant responses to stimulation of the visual field inside the scotoma and that these responses are typically direction-selective. Indeed, for some of the neurons (e.g., cells 4 and b) the responses to stimulation restricted to the scotoma can be stronger than those obtained by stimulating the visual field surrounding it. In most cases, the results of the quantitative tests were compatible with the location of the hand-mapped receptive fields. For example, cell 1 only responded to the outside condition, whereas cell 4 responded much more strongly to the inside condition. However, some discrepancies were observed, such as cell 2 responding to the inside condition despite having a hand-mapped receptive field that only touched the edge of the scotoma.
In the experiment shown in Figure 9 (but not in other cases), each cell was also systematically tested with stimuli drifting at different speeds (10, 40, and 90°/sec). Although the sample was small, the data do demonstrate that different cells in the lesion projection zone of MT are tuned to different velocities of stimuli presented within the scotoma. For example, cell b shows a strong response to the slow drifting (10°/sec) stimulus, whereas cells 3 and4 are most strongly responsive to the fastest drifting (90°/sec) pattern.
DISCUSSION
Weeks after lesions of striate cortex, neurons in MT show two types of response properties with respect to receptive field location. Some cells remain responsive to stimulation of the region of the visual field originally represented in the ablated part of V1 (the scotoma), whereas others have receptive fields that appear displaced from their likely original location, so that they represent the visual field immediately surrounding the scotoma. There is also a significant increase in the proportion of cells that do not respond to stimuli such as bars and spots and in the proportion of cells which strongly habituate to repetitive stimulation. Among the responsive cells, the proportion of those with direction selectivity is unaltered.
Using a lesion paradigm similar to the one adopted here, Rodman et al. (1989) demonstrated that a significant proportion of MT cells in the macaque remain responsive and retain direction selectivity after V1 lesions. Our results in the marmoset, a New World monkey with diurnal habits, support this claim. However, a population of cells with displaced receptive fields has not been described in the macaque. Given the relatively large size of the lesions used in Rodman et al.'s study, it is possible that these cells were mistaken as unresponsive by virtue of their receptive fields being located in the periphery, beyond the stimulus presentation screen. It is also possible that there are species differences in the relative proportions of cells with displaced receptive fields or in the time course of the reorganization of the visuotopic map of MT. However, the key point is that in both species a significant proportion of MT neurons can participate in the processing of the direction of motion, even in the absence of V1 inputs. This contrasts with the findings of Krubitzer and Kaas (1992), who reported that the receptive fields of MT cells in a nocturnal New World species (owl monkey) were restricted to the part of the visual field represented in the spared region of V1. Our results, which included an electrophysiological determination of the spared sector of the visual field, show that this is not the case. It may be that the different postlesion times [hours in the case of Krubitzer and Kaas (1992), weeks in the present study] are responsible for this difference. Yet, this is not likely to be the entire explanation, because Girard et al. (1992) have shown that macaque MT cells remain active during reversible inactivation of V1. Other factors, such as the type of anesthesia (urethane in the study of Krubitzer and Kaas, 1992), or depression of cortical responses immediately after a lesion, may also be involved. Studies using behaving preparations may further clarify the effects of anesthesia on residual responses to stimulation inside the scotoma.
The existence of cells in MT that respond to stimulation of the visual field inside the scotoma makes it plausible that activity of extrastriate areas can explain blindsight and the limited residual vision of primates (including human patients) with V1 lesions. However, some studies (Fendrich et al., 1992; Gazzaniga et al., 1994;Schärli et al., 1999) propose that these visual abilities also depend on the existence of remaining “islands” of ipsilateral V1. The visual responses observed in MT in the present series of experiments are clearly not dependent on remnants of V1. The topography of V1 in the marmoset (Fig. 1) ensures that ablations that remove all cortex beyond a certain caudal level leave no such islands behind. Moreover, our paradigm for mapping the borders of the lesion allows an accurate determination of the part of the visual field that is still served by spared V1 cortex. Whereas it is likely that, despite our best efforts, some imprecision remains, this could only explain the invasion by receptive fields near the border of the scotoma. Examples of receptive fields such as those shown in the left panel of Figure 5, which invade the scotoma to a large extent, cannot be explained in this way.
A large proportion of cells in the lesion projection zones of MT have receptive fields that appear displaced from their expected location, toward the visual field immediately outside the scotoma. The validity of this conclusion, and in particular of our estimates of the proportions of cells in different functional categories, depend on the precision of our estimates of the lesion projection zones. However, we have demonstrated previously (Rosa and Elston, 1998) that the size, shape, and visuotopic organization of MT are highly stereotyped between individuals. In addition, we had the benefit of using recordings from cells with receptive fields away from the scotoma to validate the initial estimates of the map. Thus, although the exact percentages of cells in different categories may be overestimated or underestimated, it is clear that changes (e.g., in the proportions of unresponsive and strongly habituating cells) do occur. Moreover, other evidence confirms that there is disturbance of the normal visuotopy of MT (Fig. 3), including the extension of the point-image size in regions of the visual field surrounding the scotoma and large jumps in receptive field position between nearby cells (Figs. 4-6). The displacement of receptive fields of some MT cells toward the border of a scotoma was hinted by Krubitzer and Kaas (1992) and thus may exist even a few hours after a V1 lesion. It also parallels observations of studies of V1 receptive fields after retinal lesions. The displacement of V1 receptive fields is usually attributed to horizontal, intrinsic axons (Chino, 1995; Darian-Smith and Gilbert, 1995; Schmid et al., 1996). The receptive field displacements we observed are well within the range afforded by the intrinsic connections of MT in New World monkeys (Malach et al., 1997), and therefore it is plausible that they represent information rerouted from parts of MT that still receive afferents from the ipsilateral and contralateral V1. However, unlike in the case of retinal lesions, MT cells have access to other sources of inputs that convey information about the affected part of the visual field, including pathways via the pulvinar or the koniocellular layers of the lateral geniculate nucleus (for review, see Weiskrantz, 1996;Stepniewska et al., 1999). An important question is what determines whether a given cell retains a receptive field within the scotoma or acquires a displaced field. There are several factors, including the relative proportion of pulvinar inputs, the size of the V1 lesion, and the strength and range of intrinsic connections in different layers, which may be relevant in this context. Area MT is known to be subdivided into two types of columns, with respect to the strength of antagonistic surrounds (Born and Tootell, 1992). One possibility is that cells that normally summate activity from extensive portions of the visual field and are not subject to strong inhibition from the unaffected parts of MT will, upon destruction of part of V1, acquire displaced receptive fields via a process of potentiation of intrinsic horizontal connections (Hirsch and Gilbert, 1993). Other cells, which may normally receive strong inhibitory connections arising from representations of other parts of the visual field, will either retain their original receptive field location (based on subcortical afferents) or become unresponsive. Cells with receptive fields located entirely or primarily within the scotoma were found throughout layers 3–6 (Figs. 4-6), matching the distribution of pulvinocortical terminations in MT (Rockland et al., 1999). Whether or not the changes in the visuotopic map of MT bring about any “positive” functional consequences is unclear. One possibility worth investigating is whether there is a resultant increased sensitivity to motion in the parts of the visual field immediately surrounding the scotoma.
Psychophysical studies in patients rendered hemianopic because of a complete unilateral V1 lesion demonstrate that they have a limited conscious ability to distinguish between stimuli moving in different directions (Perenin, 1991; Weiskrantz et al., 1995). We found that neurons within the lesion projection zones of MT are strongly direction-selective, similar to those in normal marmoset MT. This result is in agreement with previous work in the macaque (Rodman et al., 1989; Girard et al., 1992). The fact that even neurons with displaced receptive fields show strong direction selectivity argues against the notion that this property is simply imposed on MT cells by afferents from hierarchically “lower” areas. Rather, it seems that intrinsic circuits of MT are capable of generating direction selective properties even in the absence of inputs from V1.
In summary, New World and Old World monkeys are similar in that a large fraction of MT cells continue to process visual information after removal of afferents from V1. Cells with receptive fields within the scotoma can be reasonably linked to residual vision and blindsight. At the same time, other neurons become sensitive to the region of the visual field that immediately surrounds the scotoma. It will be important to establish the time course of these changes and to determine to what extent they depend on the size of the V1 lesion. If, as we suspect, displaced receptive fields are the result of intrinsic connections from parts of MT that still receive V1 afferents, it is likely that they will be less common in subjects rendered hemianopic by complete ablation of V1, in which the callosal connections may be the only source of excitation from spared portions of the visual field.
Footnotes
This work was supported by Research Grant 990007 from the National Health and Medical Research Council. The technical assistance of Rita Collins and comments by Dr. T. Vidyasagar are gratefully acknowledged. This paper was written while M.G.P.R. was a Visiting Fellow at the Division of Psychology, Australian National University, Canberra. The use of the equipment and facilities of the Division of Psychology is gratefully acknowledged.
Correspondence should be addressed to Dr. Marcello Rosa at the above address. E-mail: marcello.rosa@med.monash.edu.au.
REFERENCES
- 1.Albright TD. Direction and orientation selectivity of neurones in visual area MT of the macaque. J Neurophysiol. 1984;52:1106–1130. doi: 10.1152/jn.1984.52.6.1106. [DOI] [PubMed] [Google Scholar]
- 2.Allman JM, Kaas JH. A representation of the visual field in the caudal third of the middle temporal gyrus of the owl monkey (Aotus trivirgatus). Brain Res. 1971;31:85–105. doi: 10.1016/0006-8993(71)90635-4. [DOI] [PubMed] [Google Scholar]
- 3.Born RT, Tootell RBH. Segregation of global and local motion processing in primate middle temporal visual area. Nature. 1992;357:497–499. doi: 10.1038/357497a0. [DOI] [PubMed] [Google Scholar]
- 4.Bullier J, Girard P, Salin PA. The role of area 17 in the transfer of information to extrastriate visual cortex. In: Peters A, Rockland KS, editors. Cereb cortex, Vol 10, Primary visual cortex in primates. Plenum; New York: 1994. pp. 301–331. [Google Scholar]
- 5.Calford MB, Schmid LM, Rosa MGP. Monocular focal retinal lesions induce short-term topographic plasticity in adult cat visual cortex. Proc R Soc Lond B Biol Sci. 1999;266:499–507. doi: 10.1098/rspb.1999.0665. [DOI] [PMC free article] [PubMed] [Google Scholar]
- 6.Chino Y. Adult plasticity in the visual system. Can J Physiol Pharmacol. 1995;73:1323–1338. doi: 10.1139/y95-187. [DOI] [PubMed] [Google Scholar]
- 7.Cowey A. Projection of the retina on to striate and prestriate cortex in the squirrel monkey, Samiri sciureus. J Neurophysiol. 1964;27:366–393. doi: 10.1152/jn.1964.27.3.366. [DOI] [PubMed] [Google Scholar]
- 8.Cowey A, Stoerig P. Blindsight in monkeys. Nature. 1995;373:247–249. doi: 10.1038/373247a0. [DOI] [PubMed] [Google Scholar]
- 9.Darian-Smith C, Gilbert CD. Topographic reorganization in the striate cortex of the adult cat and monkey is cortically mediated. J Neurosci. 1995;15:1631–1647. doi: 10.1523/JNEUROSCI.15-03-01631.1995. [DOI] [PMC free article] [PubMed] [Google Scholar]
- 10.Fendrich R, Wessinger CM, Gazzaniga MS. Residual vision in a scotoma: implications for blindsight. Science. 1992;258:1489–1491. doi: 10.1126/science.1439839. [DOI] [PubMed] [Google Scholar]
- 11.Fritsches KA, Rosa MGP. Visuotopic organisation of striate cortex in the marmoset monkey (Callithrix jacchus). J Comp Neurol. 1996;372:264–282. doi: 10.1002/(SICI)1096-9861(19960819)372:2<264::AID-CNE8>3.0.CO;2-1. [DOI] [PubMed] [Google Scholar]
- 12.Gazzaniga MS, Fendrich R, Wessinger CM. Blindsight reconsidered. Curr Directions Psychol Sci. 1994;3:93–95. [Google Scholar]
- 13.Gebhard R, Zilles K, Schleicher A, Everitt BJ, Robbins TW, Divac I. Distribution of seven major neurotransmitter receptors in the striate cortex of the New World monkey Callithrix jacchus. Neuroscience. 1993;56:877–885. doi: 10.1016/0306-4522(93)90134-2. [DOI] [PubMed] [Google Scholar]
- 14.Gilbert CD, Wiesel TN. Receptive field dynamics in adult primary visual cortex. Nature. 1992;356:150–152. doi: 10.1038/356150a0. [DOI] [PubMed] [Google Scholar]
- 15.Girard P, Bullier J. Visual activity in area V2 during reversible inactivation of area 17 in the macaque monkey. J Neurophysiol. 1989;62:1287–1302. doi: 10.1152/jn.1989.62.6.1287. [DOI] [PubMed] [Google Scholar]
- 16.Girard P, Salin PA, Bullier J. Response selectivity of neurons in area MT of the macaque monkey during reversible inactivation of area V1. J Neurophysiol. 1992;67:1437–1446. doi: 10.1152/jn.1992.67.6.1437. [DOI] [PubMed] [Google Scholar]
- 17.Grüsser OJ, Landis T. The visual world shrinks: visual field defects, hemianopias and cortical blindness. In: Grüsser OJ, Landis T, editors. Vision and visual dysfunction, Vol 12, Visual agnosias and other disturbances of visual perception and cognition. Macmillan; London: 1992. pp. 136–157. [Google Scholar]
- 18.Hirsch JA, Gilbert CD. Long-term changes in synaptic strength along specific intrinsic pathways in the cat visual cortex. J Physiol (Lond) 1993;461:247–262. doi: 10.1113/jphysiol.1993.sp019512. [DOI] [PMC free article] [PubMed] [Google Scholar]
- 19.Kaas JH, Krubitzer LA, Chino YM, Langston AL, Polley EH, Blair N. Reorganization of retinotopic cortical maps in adult mammals after lesions of the retina. Science. 1990;248:229–231. doi: 10.1126/science.2326637. [DOI] [PubMed] [Google Scholar]
- 20.Krubitzer LA, Kaas JH. Area 17 lesions deactivate area MT in owl monkeys. Vis Neurosci. 1992;9:399–407. doi: 10.1017/s0952523800010804. [DOI] [PubMed] [Google Scholar]
- 21.Malach R, Schirman TD, Harel M, Tootell RBH, Malonek D. Organization of intrinsic connections in owl monkey area MT . Cereb Cortex. 1997;7:386–393. doi: 10.1093/cercor/7.4.386. [DOI] [PubMed] [Google Scholar]
- 22.Maunsell JHR, Van Essen DC. Topographic organization of the middle temporal visual area in the macaque monkey: representational biases and the relationship to callosal connections and myeloarchitectonic boundaries. J Comp Neurol. 1987;266:535–555. doi: 10.1002/cne.902660407. [DOI] [PubMed] [Google Scholar]
- 23.Missler M, Eins S, Merker HJ, Rothe H, Wolff JR. Pre- and postnatal development of the primary visual cortex of the common marmoset. I. A changing space for synaptogenesis. J Comp Neurol. 1993;333:41–52. doi: 10.1002/cne.903330104. [DOI] [PubMed] [Google Scholar]
- 24.Perenin MT. Discrimination of motion direction in perimetrically blind fields. NeuroReport. 1991;2:397–400. doi: 10.1097/00001756-199107000-00011. [DOI] [PubMed] [Google Scholar]
- 25.Rockland KS, Andresen J, Cowie RJ, Robinson DL. Single axon analysis of pulvinocortical connections to several visual areas in the macaque. J Comp Neurol. 1999;406:221–250. doi: 10.1002/(sici)1096-9861(19990405)406:2<221::aid-cne7>3.0.co;2-k. [DOI] [PubMed] [Google Scholar]
- 26.Rodman HR, Gross CG, Albright TD. Afferent basis of visual response properties in area MT of the macaque. I. Effects of striate cortex removal. J Neurosci. 1989;9:2033–2050. doi: 10.1523/JNEUROSCI.09-06-02033.1989. [DOI] [PMC free article] [PubMed] [Google Scholar]
- 27.Rosa MGP, Elston GN. Visuotopic organisation and neuronal response selectivity for direction of motion in visual areas of the caudal temporal lobe of the marmoset monkey (Callithrix jacchus): middle temporal area, middle temporal crescent, and surrounding cortex. J Comp Neurol. 1998;393:505–527. [PubMed] [Google Scholar]
- 28.Rosa MGP, Schmid LM. Visual areas in the dorsal and medial extrastriate cortices of the marmoset. J Comp Neurol. 1995;359:272–299. doi: 10.1002/cne.903590207. [DOI] [PubMed] [Google Scholar]
- 29.Rosa MGP, Schmid LM, Krubitzer LA, Pettigrew JD. Retinotopic organization of the primary visual cortex of flying foxes (Pteropus poliocephalus and Pteropus scapulatus). J Comp Neurol. 1993;335:55–72. doi: 10.1002/cne.903350105. [DOI] [PubMed] [Google Scholar]
- 30.Rosa MGP, Schmid LM, Calford MB. Responsiveness of cat area 17 after monocular inactivation: limitation of topographic plasticity in adult cortex. J Physiol (Lond) 1995;482:589–608. doi: 10.1113/jphysiol.1995.sp020543. [DOI] [PMC free article] [PubMed] [Google Scholar]
- 31.Rosa MGP, Fritsches KA, Elston GN. The second visual area in the marmoset monkey: visuotopic organization, magnification factors, architectonical boundaries, and modularity. J Comp Neurol. 1997;387:547–567. doi: 10.1002/(sici)1096-9861(19971103)387:4<547::aid-cne6>3.0.co;2-2. [DOI] [PubMed] [Google Scholar]
- 32.Schärli H, Harman AM, Hogben JH. Blindsight in subjects with homonymous visual field defects. J Cognit Neurosci. 1999;11:52–66. doi: 10.1162/089892999563247. [DOI] [PubMed] [Google Scholar]
- 33.Schmid LM, Rosa MGP, Calford MB, Ambler JS. Visuotopic reorganisation in the primary visual cortex of adult cats following monocular and binocular retinal lesions. Cereb Cortex. 1996;6:388–405. doi: 10.1093/cercor/6.3.388. [DOI] [PubMed] [Google Scholar]
- 34.Schmued LC. A rapid, sensitive histochemical stain for myelin in frozen brain sections. J Histochem Cytochem. 1990;38:717–720. doi: 10.1177/38.5.1692056. [DOI] [PubMed] [Google Scholar]
- 35.Spatz WB, Illing RB, Vogt Weisenhorn DM. Distribution of cytochrome oxidase and parvalbumin in the primary visual cortex of the adult and neonate monkey, Callithrix jacchus. J Comp Neurol. 1994;339:519–534. doi: 10.1002/cne.903390405. [DOI] [PubMed] [Google Scholar]
- 36.Stepniewska I, Qi HX, Kaas JH. Do superior colliculus projection zones in the inferior pulvinar project to MT in primates? Eur J Neurosci. 1999;11:469–480. doi: 10.1046/j.1460-9568.1999.00461.x. [DOI] [PubMed] [Google Scholar]
- 37.Stoerig P, Cowey A. Blindsight in man and monkey. Brain. 1997;120:535–559. doi: 10.1093/brain/120.3.535. [DOI] [PubMed] [Google Scholar]
- 38.Troilo D, Howland HC, Judge SJ. Visual optics and retinal cone topography in the common marmoset (Callithrix jacchus). Vision Res. 1993;33:1302–1310. doi: 10.1016/0042-6989(93)90038-x. [DOI] [PubMed] [Google Scholar]
- 39.Van Essen DC, Maunsell JHR. Two-dimensional maps of the cerebral cortex. J Comp Neurol. 1980;191:255–281. doi: 10.1002/cne.901910208. [DOI] [PubMed] [Google Scholar]
- 40.Weiskrantz L. Blindsight: a case study and implications. Oxford UP; Oxford: 1986. [Google Scholar]
- 41.Weiskrantz L. Blindsight revisited. Curr Opin Neurobiol. 1996;6:215–220. doi: 10.1016/s0959-4388(96)80075-4. [DOI] [PubMed] [Google Scholar]
- 42.Weiskrantz L, Barbur JL, Sahraie A. Parameters affecting conscious versus unconscious visual discrimination with damage to the visual cortex (V1). Proc Natl Acad Sci USA. 1995;92:6122–6126. doi: 10.1073/pnas.92.13.6122. [DOI] [PMC free article] [PubMed] [Google Scholar]