

Abstract
Experimental and computational techniques have been used to investigate the group I metabotropic glutamate receptor (mGluR)-mediated increase in the frequency of spinal cord network activity underlying locomotion in the lamprey. Group I mGluR activation potentiated the amplitude of NMDA-induced currents in identified motoneurons and crossed caudally projecting network interneurons. Group I mGluRs also potentiated NMDA-induced calcium responses. This effect was blocked by a group I mGluR-specific antagonist, but not by blockers of protein kinase A, C, or G. The effect of group I mGluRs activation was also tested on NMDA-induced oscillations known to occur during fictive locomotion. Activation of these receptors increased the duration of the plateau phase and decreased the duration of the hyperpolarizing phase. These effects were blocked by a group I mGluR antagonist. To determine its role in the modulation of NMDA-induced oscillations and the locomotor burst frequency, the potentiation of NMDA receptors by mGluRs was simulated using computational techniques. Simulating the interaction between these receptors reproduced the modulation of the plateau and hyperpolarized phases of NMDA-induced oscillations, and the increase in the frequency of the locomotor rhythm.
Our results thus show a postsynaptic interaction between group I mGluRs and NMDA receptors in lamprey spinal cord neurons, which can account for the regulation of the locomotor network output by mGluRs.
Keywords: locomotion, mGluRs, NMDA, spinal cord, lamprey, calcium, DHPG
An understanding of the importance of synaptic connectivity and membrane properties in producing the final output of neuronal networks requires knowledge that bridges the gap between effects at the cellular and network levels. Activation of metabotropic glutamate receptors (mGluRs) leads to a variety of cellular responses, including the inhibition of calcium and potassium currents, presynaptic modulation of synaptic transmission, and postsynaptic interactions with ionotropic glutamate receptors (iGluRs; for review see Pin and Bockaert, 1995; Pin and Duvoisin, 1995; Anwyl, 1999). In many regions of the CNS, responses to exogenous NMDA application are potentiated by group I mGluR activation. In some studies, this potentiation was suggested to be mediated by a PKC-induced phosphorylation of NMDA receptors because the enhancement was blocked by PKC inhibitors (Aniksztejn et al., 1991; Kelso, 1992; but see Harvey and Collingridge, 1993). The functional consequences of the interaction between mGluRs and iGluRs have been studied in relation to synaptic plasticity (O'Connor et al., 1994, 1995). The importance of this interaction has not, however, been analyzed with respect to the activity of a neural network.
The lamprey spinal locomotor network is a vertebrate system that is well suited for this type of analysis. In this preparation the synaptic connectivity and membrane properties of many neurons forming the locomotor network have been characterized (Buchanan, 1982; Buchanan and Grillner, 1987; Grillner et al., 1998). Locomotor activity can be induced in the isolated spinal cord in vitro by activation of NMDA receptors. NMDA also elicits membrane potential oscillations in network neurons that persist in the presence of TTX (Sigvardt et al., 1985; Wallén and Grillner, 1987). These oscillations have been suggested to be important for maintaining a slow steady rate of locomotor activity (Brodin and Grillner, 1986; Wallén et al., 1987). In the lamprey spinal cord, activation of group II and III mGluRs induces presynaptic inhibition of reticulospinal transmission (Krieger et al., 1996). Activation of group I mGluRs increases the frequency of the locomotor rhythm and the amplitude of NMDA-induced depolarizations (Krieger et al., 1998). These receptors were also shown to be endogenously activated during fictive locomotion because their blockade by the specific antagonist CPCCOEt decreases the locomotor frequency (Krieger et al., 1998). Furthermore, the group I mGluR agonist DHPG induces presynaptic facilitation in reticulospinal axons, whereas the antagonist CPCCOEt blocks the facilitation evoked during trains of action potentials (Cochilla and Alford, 1998). The presynaptic facilitation was blocked by ryanodine (Cochilla and Alford, 1998).
In the present study we have tested the extent to which ryanodine-sensitive presynaptic facilitation and the postsynaptic interaction between mGluRs and NMDA receptors contribute to the increase in the locomotor frequency induced by group I mGluRs. Our results show that both the DHPG-induced increase and CPCCOEt-induced decrease in the locomotor frequency are not blocked by ryanodine. We also show that group I mGluR activation postsynaptically modulates NMDA-induced currents, calcium responses, and membrane potential oscillations. Finally, computer simulations support the hypothesis that postsynaptic interaction between mGluRs and NMDA underlies the mGluR-mediated regulation of the locomotor rhythm.
MATERIALS AND METHODS
Electrophysiology. Extracellular measurements of ventral root activity were performed on spinal cord-notochord preparations of adult Ichthymyzon unicuspis(n = 6) and Lampetra fluviatilis(n = 6). Intracellular recordings were made from isolated spinal cord preparations of adult L. fluviatilis. The effects of mGluR activation were similar in the different species (Krieger et al., 1998). The preparation was mounted in a cooled (8–12°C) Sylgard-lined chamber that was continuously perfused with a solution of the following composition (in mm): NaCl 91, KCl 2.1, CaCl2 2.6, MgCl2 1.8, NaHCO3 20, and glucose 4, bubbled with 95% O2 and 5% CO2 to pH 7.4 (I. unicuspis) or 138 NaCl, 2.1 KCl, 1.8 CaCl2, 1.2 MgCl2, 4 glucose, 2 HEPES, and 0.5l-glutamine, bubbled with O2 and pH adjusted to 7.4 (L. fluviatilis). Fictive locomotion was induced by bath application of NMDA (100 μm). The cycle duration was calculated as the time interval between midpoints of two successive bursts and averaged over 60–120 cycles. In these experiments, “n “ is the number of animals. Intracellular recordings were made from gray matter neurons with thin-walled microelectrodes filled with potassium acetate (4 m). Current injections were made in discontinuous current-clamp mode (sample rate, 1.5–2.5 kHz; band width, 0.3 kHz) with an Axoclamp 2B amplifier (Axon Instruments, Foster City, CA). Membrane potential oscillations induced by NMDA (150 μm) in the presence of tetrodotoxin (TTX; 0.75–1 μm) are referred to as NMDA-induced TTX-resistant oscillations (Wallén and Grillner, 1987). The trough potential was defined as the most negative potential during the hyperpolarized phase. A change in trough potential was judged to be significant if the change fulfilled two criteria: (1)p < 0.05, unpaired t test, and (2) change >1 mV. The detection threshold for measuring the onset and offset of the plateau duration was set at 50% of the peak amplitude, measured from trough potential to the peak of the oscillation. Cycle duration was measured as duration between two successive onset points for the plateau duration (cycle duration = plateau duration + duration of hyperpolarized phase). The analysis of the locomotor rhythm and NMDA-induced TTX-resistant oscillations were performed with DATA-PAC (Run Technologies, Laguna Hills, CA). The different parameters of NMDA-induced TTX-resistant oscillations were analyzed over 15–70 cycles in each cell, and the reported “n “ is the number of cells examined.
Cell dissociation. The spinal cord of larval lampreys (Petromyzon marinus; n = 118) was dissociated (El Manira and Bussières, 1997) in Leibovitz's L-15 culture medium (Sigma, St. Louis, MO) supplemented with penicillin-streptomycin (2 μl/ml), and the osmolarity was adjusted to 270 mOsm. Before dissociation, motoneurons were retrogradely labeled by applying fluorescein-coupled dextran amine (FDA) to the remaining muscle tissue along the entire length of the preparation after cutting all dorsal roots, thereby allowing the transport of the dye only through the ventral roots to label motoneurons. Crossed caudally projecting (CC) interneurons were labeled by injecting FDA on one side of the spinal cord and dissociating the contralateral side of the spinal cord rostral to the injection site. Some of these interneurons have been shown to be part of the spinal locomotor network. After 24 hr incubation to allow transport of the dye, the spinal cord was incubated in collagenase (1 mg/ml, 30 min; Sigma) and then in protease (2 mg/ml, 45 min; Sigma). The tissue was subsequently washed with the culture medium and triturated through a sterilized pipette. The supernatant containing the dissociated cells (from two larval spinal cords) was distributed in 10–12 Petri dishes (35 mm) and incubated at 10–12°C for 1–7 d.
Whole-cell recordings were performed from neurons in culture using an Axopatch 200A patch-clamp amplifier (Axon Instruments). Recordings were done from prelabeled motoneurons (MN; n = 6), contralaterally projecting neurons (CC; n = 7), and unidentified neurons (n = 19). Neurons were clamped at a holding potential of −50 mV, and NMDA (200 μm) was applied for 4 sec. Data acquisition and analysis were performed with pClamp software. The cells were perfused through a gravity-driven six-barrel microperfusion system with the nozzle positioned close to the recorded cell. The control solution contained (in mm): NaCl 124, KCl 2, MgCl2 1.2, CaCl2 5, glucose 10, and HEPES 10, with pH adjusted to 7.6. For whole-cell recordings, the pipettes were filled with a solution containing (in mm): KCH3SO3 102, MgCl2 1.2, CaCl2 1, EGTA 10, glucose 10, HEPES 10, ATP 2, and GTP 0.4, pH 7.6 adjusted with KOH.
Calcium imaging. The dissociated cells were incubated at room temperature for 1–2 hr with fluo-3/AM (5 μm;Molecular Probes, Eugene, OR) added to the medium. After removal of the incubation medium the cells were perfused with a solution containing (in mm): NaCl 124, KCl 2, MgCl2 1.2, CaCl2 5, glucose 10, and HEPES 10, with pH adjusted to 7.6. Drugs were added to the perfusing solution. NMDA (200 μm) was added for 10–30 sec. DHPG was applied for 2–3 min before the subsequent application of NMDA + DHPG. The NMDA antagonist d(−)-2-amino-5-phosphonopentanoic acid (d-AP-5) blocked the NMDA-induced calcium response (n = 5; data not shown). The effect of the following drugs were tested on cells preincubated with the respective drug: group I mGluR antagonist 7-(hydroxyimino)cyclopropa[b]chromen-1a-carboxylate ethyl ester (CPCCOEt), the protein kinase A and C inhibitor (-1-(5-Isoquinolinesulphonyl)-2-methylpiperazine (H-7), the protein kinase A and G inhibitorN-(2-[methylamino]ethyl)-5-isoquinolinesulfonamide (H-8), and the calcium transport blocker/activator ryanodine. NMDA, DHPG, CPCCOEt, and d-AP-5 were purchased from Tocris Cookson (Bristol, UK). H-7, H-8, and ryanodine were purchased from Research Biochemicals (Natick, MA). TTX and guanosine 5′-O-2-thiodiphosphate (GDP-β-S) were purchased from Sigma. The 488 nm line of an argon laser was used for excitation with emission filtering passing wavelengths >515 nm. The emitted light was visualized using a confocal laser scanner (Noran Odyssey) with 10× (0.25 NA) or 20× (0.40 NA) objectives (Nikon, Tokyo, Japan) attached to a Nikon Diaphot inverted microscope. Brightness over time plots were generated by averaging the intensity within manually specified regions of interest at a sampling rate of 7–15 Hz. Analysis of the brightness over time data were performed with pClamp6 (Axon Instruments). The imaging experiments were typically done on several cells, in the same field of view, on several dishes from the same dissociation, which was done using two larval lampreys. In Table1 the calcium imaging data are reported with number of cells and number of dissociations from which the cells were obtained. Changes in fluorescence (ΔF), which is a measure of changed intracellular calcium concentration, were normalized to resting fluorescence levels (Frest) subtracted with the fluorescence from a region not including dye-filled neurons (Fbackground). The fluorescence data are thus presented as ΔF/F = ΔF/(Frest −Fbackground).
Table 1.
Effect of group I mGluR antagonist and protein kinase activator and inhibitors on DHPG-induced potentiation of NMDA calcium response
| Control | Preincubated | |||
|---|---|---|---|---|
| NMDA | NMDA + DHPG | NMDA | NMDA + DHPG | |
| 1.17 ± 0.60 (34, 3) | 1.71 ± 0.89* (34, 3) | 1.45 ± 0.71 (34, 3) | 1.57 ± 0.681-a (34, 3) | CPCCOEt |
| 1.57 ± 0.97 (15, 3) | 2.29 ± 1.05* (15, 3) | 1.37 ± 0.65 (19, 3) | 1.98 ± 0.771-1601-b (19, 3) | H-7 |
| 0.92 ± 0.72 (10, 2) | 1.48 ± 1.06* (10, 2) | 0.70 ± 0.58 (13, 2) | 1.37 ± 0.741-1601-b (13, 2) | H-8 |
| 1.48 ± 0.82 (14, 2) | 1.90 ± 0.71* (14, 2) | 1.60 ± 0.51 (14, 2) | 2.09 ± 0.721-1601-b (14, 2) | Ryanodine |
Calcium responses measured as ΔF/F (mean ± SD). (n, N) = number of cells, number of dissociations.
p < 0.05 compared to NMDA in control cells.
F1-160: p < 0.05 compared to NMDA in preincubated cells.
The potentiation of NMDA response by DHPG was blocked in the presence of CPCCOEt.
The potentiation of NMDA response by DHPG was not significantly affected by H8, H7, and ryanodine.
Cell model. Compartmentalized Hodgkin–Huxley-type model neurons were equipped with Na, K, Ca, and KCacurrents (Brodin et al., 1991; Ekeberg et al., 1991; Hellgren et al., 1992; Tegnér et al., 1998). Two KCa systems were included, one (called KCaHVA) of which is activated by calcium influx through high voltage-activated (HVA) calcium channels and the other (called KCaNMDA) is activated by calcium entering through the NMDA receptor (CaNMDA). The latter KCasystem operates with a time constant that is an order of magnitude slower (Brodin et al., 1991; Tegnér et al., 1998). To reproduce NMDA-induced TTX-resistant oscillations, Na+ conductance was set to zero. The lamprey spinal CPG is modeled as a population of inhibitory crossing cells (C) inhibiting all contralateral cells and excitatory cells (E) exciting ipsilateral C and E cells (Hellgren et al., 1992;Hellgren-Kotaleski et al., 1999a). The NMDA calcium pool is modeled by the following equation:
| Equation 1 |
where φNMDA is the accumulation rate, and δNMDA is the decay rate (Brodin et al., 1991). The state variable p is the fraction of NMDA channels in the open state (Brodin et al., 1991). When the NMDA conductance is potentiated, there is both an increased depolarizing drive and an increased calcium inflow.
Statistical analysis. The locomotion experiments were analyzed with repeated measures ANOVA with post hoc Tukey's test (rm-ANOVA; GraphPad Prism, Graphpad Software) and two-way ANOVA (within-subjects design; JMP, SAS Institute). The repeated measurements in the calcium-imaging experiments with calcium channel blockers did not pass the sphericity test and were thus instead analyzed using paired t tests (GraphPad Prism, Graphpad Software) withp values adjusted according to the Bonferroni procedure (see below). A split-plot ANOVA model (JMP, SAS Institute) was used to determine statistical significance in the experiments comparing the effect of DHPG on NMDA-induced calcium responses in control cells and in cells preincubated with CPCCOEt, H-7, H-8, or ryanodine. In the model, the between-subject variable was “group” (control or preincubated), and the within-subject variable was “treatment” (NMDA or NMDA + DHPG). In all cases the main effect of “group” was not significant whereas the main effect of “treatment” was significant. One-way ANOVA with “treatment” as within factor was performed separately for control and preincubated cells using the mean square error term from the split-plot ANOVA. The p values were adjusted according to the Bonferroni procedure, i.e., because two tests are done on each factor, the p values were multiplied with 2 (only applied when unadjusted p < 0.05). In Figure 5 calcium-imaging results are presented as outlier box plots. The ends of a box are the 25th and 75th quantiles, also called the quartiles. The horizontal line across the middle identifies the median sample value. The ends of the whiskers are the outermost data points from their respective quartiles that fall within the distance computed as 1.5 *(interquartile range). Any data point that does not fall within this distance is called an outlier and plotted as a black square. NMDA-induced oscillations were analyzed using unpaired ttest or two-way ANOVA (within-subjects design). Results are reported as mean ± SD.
Fig. 5.

Effect of an mGluR antagonist and modulators of second messenger pathways on the mGluR-induced potentiation of NMDA receptors. Outlier box plots showing the amplitude of NMDA-induced calcium responses measured as ΔF/F.A, The mGluR antagonist CPCCOEt blocked the DHPG-induced potentiation of NMDA-induced calcium response. B, The potentiation persisted in the presence of the protein kinase inhibitor H-7. C, The potentiation persisted in the presence of the protein kinase inhibitor H-8. D, Ryanodine had no effect on the potentiation of NMDA response by DHPG.
RESULTS
The mGluR-induced regulation of the locomotor frequency persists in the presence of ryanodine
To test if ryanodine-sensitive presynaptic facilitation of synaptic transmission (Cochilla and Alford, 1998) could account for the increase and decrease, respectively, in the locomotor frequency by DHPG and CPCCOEt (Krieger et al., 1998), their effects were examined in the presence of 20 μm ryanodine, which blocks the DHPG-induced presynaptic facilitation (Cochilla and Alford, 1998). In control experiments, DHPG (25–100 μm; applied 30–60 min) increased the frequency of NMDA-induced (100 μm) locomotor activity from 1.80 ± 0.29 to 2.03 ± 0.33 Hz (rm-ANOVA; p < 0.01; n = 6; Fig.1A,B). After addition of ryanodine (20 μm; 70–120 min), DHPG was re-applied and again increased the locomotor frequency from 1.85 ± 0.33 to 2.06 ± 0.34 Hz (rm-ANOVA; p < 0.01;n = 6; Fig. 1A,B). Furthermore, the relative DHPG-induced frequency increase did not differ in the two cases (Fig. 1C; p > 0.4; two-way ANOVA). Ryanodine alone had no consistent effect on frequency (rm-ANOVA;p > 0.05; n = 6). Application of the mGluR antagonist CPCCOEt (100 μm; 30–65 min) decreased the NMDA-induced (100 μm) locomotor frequency from 1.99 ± 0.41 to 1.77 ± 0.39 Hz (rm-ANOVA;p < 0.01; n = 6; Fig.1D). In the presence of ryanodine (20 μm; preapplied for 35–120 min) CPCCOEt still decreased the locomotor frequency from 1.98 ± 0.47 to 1.72 ± 0.42 Hz (rm-ANOVA; p < 0.01; n = 6; Fig. 1D). The relative decrease was the same in both cases (Fig. 1E; p > 0.5; two-way ANOVA). Ryanodine alone had no consistent effect on frequency (rm-ANOVA;p > 0.05; n = 6). These results thus show that presynaptic facilitation mediated through ryanodine-sensitive calcium stores cannot explain the changes in locomotor frequency mediated by group I mGluRs. Alternative explanations were thus sought.
Fig. 1.

Ryanodine does not block the effect of group I mGluR activation on the locomotor rhythm. A, The burst frequency of 100 μm NMDA-induced locomotion increased from 1.50 ± 0.22 Hz in control (a) to 1.68 ± 0.29 Hz in the presence of DHPG (25 μm; 34 min) (b). In the presence of ryanodine (20 μm), the burst frequency increased from 1.53 ± 0.20 Hz (c) to 1.78 ± 0.26 Hz with the application of DHPG (d). B, The time course of the DHPG-induced frequency increase from one experiment. Ryanodine was present for 70 min before the application of DHPG Traces in A are taken from the points indicated.C, Summary of the effect of DHPG on the locomotor frequency in control and in the presence of ryanodine from six different experiments. D, The decrease in burst frequency induced by CPCCOEt persisted in the presence of ryanodine (20 μm; applied 40 min before CPCCOEt). CPCCOEt decreased the burst frequency from 1.78 ± 0.24 Hz to 1.47 ± 0.14 Hz in control and from 1.71 ± 0.20 Hz to 1.46 ± 0.15 Hz in the presence of ryanodine. C, Summary of the effect of CPCCOEt on the locomotor frequency in control and in the presence of ryanodine from six different experiments.
mGluR activation increases the NMDA current through a G-protein-mediated mechanism
Because mGluR-mediated presynaptic facilitation could not account for the regulation of the locomotor frequency, the contribution of postsynaptic effects was investigated by studying the interaction between mGluRs and NMDA receptors. Whole-cell patch-clamp recordings were made from isolated lamprey spinal cord neurons in culture, including MNs and crossed caudally (CC)-projecting network interneurons. Application of NMDA (100–200 μm; 4 sec) induced an inward current that was potentiated by DHPG (100 μm), from 596 ± 122 to 847 ± 218 pA in magnesium-free solution (n = 17; including MN,n = 3; CC, n = 4; p < 0.0001, paired t test) and from 241 ± 12 to 360 ± 18 pA (n = 3) in normal solution (Fig.2A). When the cells were loaded with GDP-β-S (1 mm) through the patch pipette, the potentiation of the NMDA current was blocked (Fig.2B; Mg-free, 605 ± 127 compared to 621 ± 120 pA; n = 12 including MN, n = 3; CC,n = 3; p > 0.1; paired ttest; normal solution, 391 ± 202 compared to 391 ± 206 pA;n = 2). The results were consistent in all cells tested with no significant difference (p > 0.1; two-way ANOVA) in the degree of potentiation between the different types. The potentiation of NMDA current by DHPG does not appear to depend on intracellular calcium because it was seen in the presence of the calcium chelator EGTA (10 mm) in the intracellular solution. These results thus show the existence of a postsynaptic interaction between group I mGluRs and NMDA receptors that results in a potentiation of NMDA current through a G-protein-dependent mechanism.
Fig. 2.
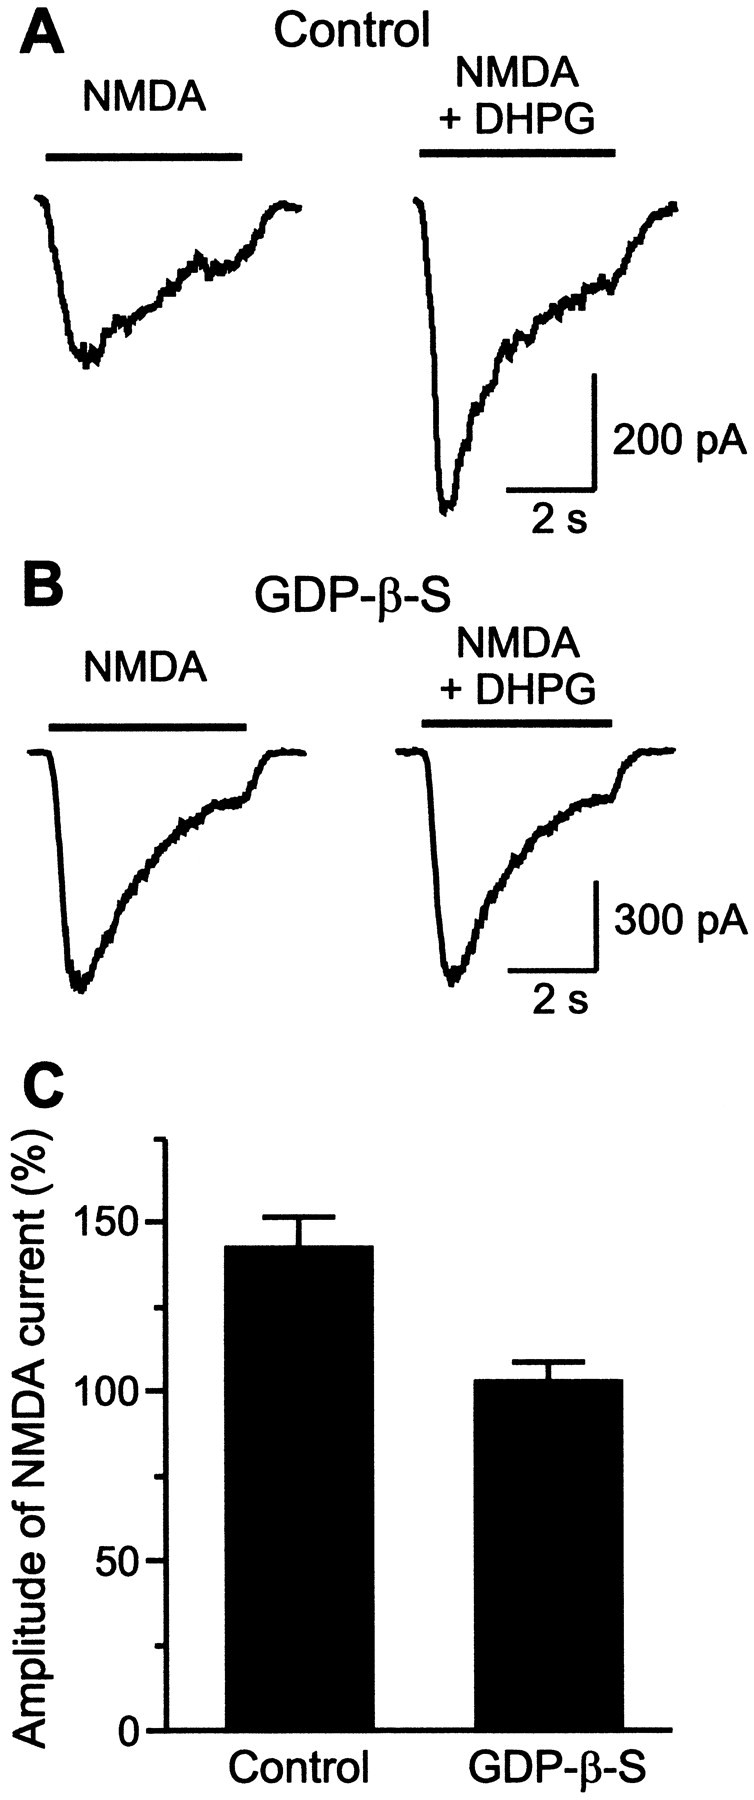
mGluR activation potentiates NMDA currents through a G-protein-dependent mechanism. A, Whole-cell recording from an isolated lamprey spinal cord neuron clamped at a holding potential of −50 mV. In control cells, application of NMDA (200 μm) induced an inward current that increased in the presence of DHPG (100 μm). B, In cells loaded with GDP-β-S (1 mm), the mGluR-mediated increase of the NMDA current was blocked. The recordings shown inA and B were made in Mg2+-free solution. C, Bar diagram showing the mGluR-mediated potentiation of NMDA current (percentage of NMDA response) in control cells (n = 17) and in cells loaded with GDP-β-S (n = 12).
mGluR activation increases NMDA-induced calcium responses
To analyze how the interaction between mGluRs and NMDA receptors affects NMDA-induced calcium responses, calcium imaging was used. Isolated spinal cord neurons in culture were incubated with fluo-3 AM (5 μm). Figure 3 shows a fluo-3-labeled neuron in which application of NMDA (200 μm) induced a calcium response (Fig. 3A). Application of DHPG (100 μm) alone induced a transient calcium response (Fig. 3B; 0.68 ± 0.38 ΔF/F; n = 27 of 115 cells), and potentiated the amplitude of NMDA-induced calcium responses (Fig.3C). DHPG (50–100 μm) increased the NMDA-induced (200 μm) calcium response from 1.34 ± 0.75 to 1.83 ± 0.88 ΔF/F(n = 115; p < 0.0001, pairedt test). The DHPG-induced potentiation of NMDA also occurred in cells that did not respond to DHPG alone. As the focus of the present study was on the interaction with NMDA receptors, the DHPG-induced calcium response was not investigated further in the present study.
Fig. 3.

Activation of group I mGluRs potentiates NMDA-induced calcium responses. A, Bath application of NMDA (10 sec; 200 μm) induced a fluorescence increase, calculated as ΔF/F from the neuron illustrated below. B, Application of DHPG (100 μm) induced a transient fluorescence increase.C, When NMDA was reapplied in the presence of DHPG, the effect of NMDA was potentiated. The images were obtained from the peak fluorescence created from an average of 30 images with the resting fluorescence subtracted.
The NMDA-induced calcium response was measured in the presence of L- and N-type calcium channel blockers to assess the contribution of these channels to the potentiation of the NMDA response by DHPG. As above, application of NMDA in the presence of DHPG increased the calcium response from 1.45 ± 0.60 to 1.86 ± 0.70 ΔF/F (n = 13; p< 0.0005; paired t test). Blockade of N- and L-type calcium channels by ω-conotoxin-GVIA and nimodipine reduced the NMDA-induced calcium response to 0.57 ± 0.25 ΔF/F(n = 13; p < 0.0005; pairedt test). In the presence of the calcium channel blockers, DHPG increased the calcium response to 0.76 ± 0.37 (ΔF/F;n = 13; p < 0.05; paired ttest). These results show that N-type and L-type calcium channels contribute to the calcium response elicited by the application of NMDA, but that the potentiation of the calcium response by DHPG still persists after blockade of these channels.
The effect of DHPG was tested on saturating NMDA concentrations to test if the mGluR-induced potentiation of the NMDA response is different from simply increasing the NMDA concentration. The dose–response curve of the NMDA-induced calcium response shows that the maximum response was reached at an NMDA concentration of 400 μm (one-way ANOVA; Fig. 4A). DHPG (100 μm) was still able to potentiate the NMDA response induced by a saturating concentration (800 μm; Fig. 4B), from 1.72 ± 0.82 ΔF/F to 2.16 ± 0.92 ΔF/F (n = 23 cells;p < 0.02; paired t test).
Fig. 4.
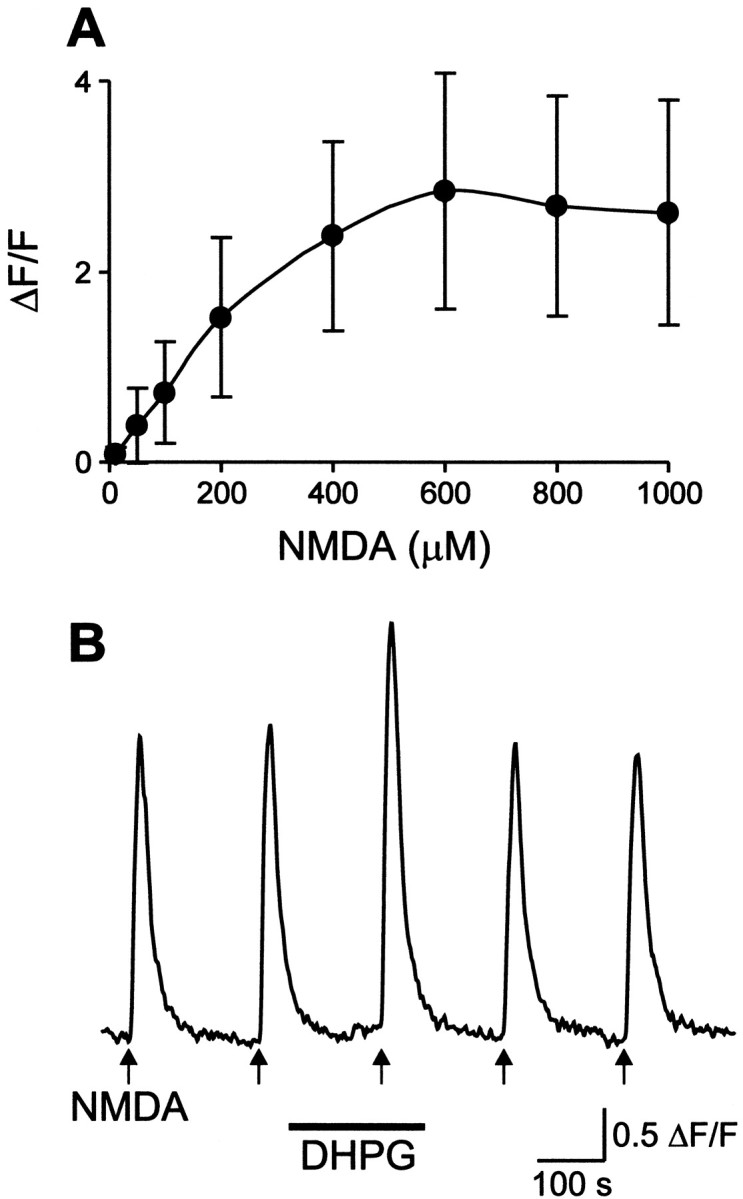
DHPG potentiates calcium responses to saturating concentrations of NMDA. A, Dose–response curve of the calcium responses to increasing concentrations of NMDA. The maximum response was elicited by 400 μm NMDA (one-way ANOVA). Each point corresponds to mean ± SD (n = 5–39 cells). B, Application of NMDA (800 μm, 10 sec) induced a transient fluorescence increase, which was potentiated by 100 μm DHPG.
The interaction between mGluRs and NMDA receptors is blocked by an mGluR antagonist but not by protein kinase A, C, and G inhibitors
To determine if the potentiation of the NMDA-induced calcium response is mediated through activation of group I mGluRs, the specific group I mGluR antagonist CPCCOEt was used. The experiments were performed on two parallel series of cultured cells from the same dissociation; one used as control, and the other preincubated with CPCCOEt (100 μm; 30 min). In control applications, DHPG increased the NMDA-induced calcium response from 1.17 ± 0.60 ΔF/F to 1.71 ± 0.89 ΔF/F (n = 34; p< 0.05; Fig. 5A; Table 1). In cells preincubated with CPCCOEt, application of DHPG did not increase the NMDA-induced calcium response (NMDA, 1.47 ± 0.71 ΔF/F; NMDA + DHPG, 1.57 ± 0.68 ΔF/F; n = 34; p> 0.05; Fig. 5A; Table 1).
In some preparations the potentiation of NMDA receptors by group I mGluRs has been suggested to be mediated by protein kinase C (Kelso, 1992). To determine if a similar mechanism is responsible for the potentiation seen in lamprey spinal cord neurons, the effect of DHPG was tested in the presence of the protein kinase A and C inhibitor H-7. DHPG significantly increased the NMDA-induced calcium response in both control cells and cells preincubated with H-7 (Fig. 5B, Table 1). We also tested H-8, an inhibitor of protein kinase A and G, and ryanodine, which interacts with intracellular calcium stores. The potentiation of the NMDA response by DHPG was unaffected by both H-8 and ryanodine (Fig. 5C,D, Table 1). These results indicate that the interaction between group I mGluRs and NMDA receptors is mediated through mechanisms independent of protein kinase A, C, and G, and ryanodine-sensitive calcium stores.
mGluR activation modulates NMDA-induced TTX-resistant oscillations
We tested the effect of DHPG on NMDA-induced oscillations known to occur during fictive locomotion (Sigvardt et al., 1985; Wallén and Grillner, 1987). Modulation of these oscillations can provide explanations for changes in the locomotor frequency (Tegnér et al., 1998). Because the shape of the NMDA-induced TTX-resistant oscillations is voltage-dependent, the effect of DHPG was studied on individual cells over a range of trough potentials (see Materials and Methods) adjusted by current injection (Fig.6A). Cycle duration, plateau duration, and the duration of the hyperpolarized phase were analyzed (see Materials and Methods). Comparisons between cells were made by taking the most hyperpolarized (range, −84 to −60 mV) and depolarized (range, −74 to −54 mV) trough potential for each individual cell. In all cases DHPG increased the plateau duration (p < 0.05; unpaired t test for each cell; n = 5) at both hyperpolarized (Fig.6A,B; mean duration increased from 379 ± 155 to 950 ± 290 msec) and depolarized trough potentials (Fig.6A,B; mean duration increased from 691 ± 369 to 3065 ± 1692 msec). In four of these cells, the relative increase was larger (p < 0.05; two-way ANOVA) at depolarized (379 ± 236%) than at hyperpolarized trough potentials (149 ± 129%). The duration of the hyperpolarized phase decreased (Fig. 6A,C) in all cells at hyperpolarized trough potentials (mean duration decrease from 2809 ± 1280 to 2015 ± 619 msec; n = 5;p < 0.05, unpaired t test for each cell), and in three of five cells at depolarized trough potentials (mean duration decrease from 1596 ± 649 to 1229 ± 367 msec;n = 3; p < 0.05; unpaired ttest for each cell). The effect of DHPG on cycle duration was dependent on trough potential (Fig. 6D). DHPG decreased the cycle duration at hyperpolarized trough potentials because of the larger decrease of the hyperpolarized phase compared to the increase of the plateau duration (Fig. 6B–D). in contrast, DHPG increased the cycle duration at depolarized trough potentials because of the larger increase of the plateau duration than the decrease of the hyperpolarized phase (Fig. 6B–D; see Discussion).
Fig. 6.

Effect of DHPG on NMDA-induced TTX-resistant oscillations. A, Application of NMDA (150 μm) in the presence of TTX (1 μm) elicits membrane potential oscillations (thin traces). Activation of mGluRs by DHPG (50 μm, thick traces) increased the plateau duration and decreased the duration of the hyperpolarized phase. In the presence of DHPG, the cycle duration was decreased at a trough potential of −80 mV, but was increased at a trough potential of −74 mV. B, Effect of DHPG on plateau duration at different trough potentials.C, DHPG decreased the duration of the hyperpolarized phase at different trough potentials. D, DHPG had different effects on the cycle duration depending on trough potential. The data presented in B–D are from the same neuron as in A.
Application of DHPG did not affect the trough membrane potential in nine neurons, induced a hyperpolarization in eight neurons (mean, 2.0 ± 0.6 mV; range, 1.2–2.8 mV), and a depolarization in two neurons (1.4–2 mV). In the nine neurons in which the trough potential was unchanged, DHPG significantly (p < 0.05; unpaired t test) increased the plateau duration (in control: median, 317 msec; range, 172–5251 msec; in DHPG: median, 842 msec; range, 379–23,940 msec). In all of these neurons DHPG also decreased the duration of the hyperpolarized phase (in control: median, 2116 msec; range, 777–3688 msec; in DHPG: median, 2036 msec; range, 712–2630 msec). The cycle duration was increased (p < 0.05 unpaired t test) in six neurons, decreased in two neurons (p < 0.05), and unchanged in one neuron (p > 0.05; unpaired t test). The variation in the effects on period is to be expected from the correlation between change of period and trough potential (Fig. 6D).
The DHPG-induced increase of the plateau duration was counteracted by the mGluR antagonist CPCCOEt. DHPG (20–50 μm; applied 4–8 min) increased the plateau duration from 322 ± 142 to 1080 ± 625 msec (n = 6; Fig.7A,B). The DHPG-induced increase of the plateau duration was significantly (p < 0.05; two-way ANOVA) reduced by application of CPCCOEt (100 μm; 323 ± 190 compared to 517 ± 379 msec; n = 6; Fig.7A,B). In three neurons, DHPG was re-applied after washout of CPCCOEt and again increased the plateau duration from 372 ± 101 to 1103 ± 530 msec (n = 3; Fig.7B). This increase was significantly larger (p < 0.05; two-way ANOVA) than in CPCCOEt. The increase in plateau duration by DHPG (20–50 μm; applied 4–7 min) persisted in the presence of the protein kinase inhibitor H-7 (10 μm;Parker et al., 1997; applied for 30–40 min before test with H-7 + DHPG; n = 4; p < 0.05; pairedt test). These results show that, like its effect on NMDA-induced calcium responses (Fig. 5A,B), the effects of DHPG on NMDA-induced oscillations were blocked by the group I mGluR antagonist but persisted after inhibition of protein kinase C.
Fig. 7.

The modulation of NMDA-induced oscillations by DHPG is counteracted by a group I mGluR antagonist. A, Application of DHPG increased the plateau duration and decreased the frequency of the NMDA-induced oscillations. These effects were blocked by the group I mGluR antagonist CPCCOEt (100 μm).B, Summary of the effect of DHPG on the plateau duration of the oscillations before (n = 6), during (n = 6), and after (n = 3) application of CPCCOEt.
Simulations of mGluR effects on cellular and network behavior
The experimental results show that activation of mGluRs modulates NMDA-induced currents, calcium responses, and membrane potential oscillations in spinal cord neurons. To determine if these effects can account for the mGluR-mediated modulation of the locomotor frequency, the potentiation of NMDA receptors by mGluR activation was included in a cell model previously developed to analyze NMDA-induced TTX-resistant oscillations and locomotor network activity (Brodin et al., 1991;Ekeberg et al., 1991; Hellgren et al., 1992; Wallén et al., 1992;Tegnér et al., 1998). In Figure 8, the thin curve represents the control situation, and the thick curve represents the potentiation of the NMDA conductance, which results in a proportional increase of calcium influx through NMDA channels (CaNMDA). We first tested if the model could reproduce the experimentally obtained effects of DHPG on NMDA-induced oscillations (Fig. 6). The effect of a potentiation of the NMDA responses on the simulated membrane potential oscillations was tested at both a relatively hyperpolarized (Fig. 8A) and a depolarized trough potential (Fig. 8B), adjusted by a simulated constant current injection. Potentiation of the NMDA conductance consists of increased CaNMDA and depolarizing drive (Fig. 8C,D). Increasing CaNMDA thus causes a larger activation of KCa channels, which leads to a more hyperpolarized trough potential (data not shown). More positive current was therefore added to achieve the same trough potential as in control recordings (Fig. 8). At both hyperpolarized (Fig.8A,E) and depolarized (Fig. 8B,E) trough potentials, the plateau duration increased, whereas the duration of the hyperpolarized phase decreased (Fig.8A,B,F). Note that the relative and absolute decrease of the hyperpolarized phase is larger at more hyperpolarized trough potentials (Fig. 8A,F), whereas the relative and absolute increase of the duration of the plateau phase is larger at more depolarized trough potentials (Fig.8B,E). The cycle duration decreased at hyperpolarized trough potentials (Fig. 8A,G), but increased at depolarized trough potentials (Fig. 8B,G), corresponding to the experimental findings (Fig. 6).
Fig. 8.

Simulation of the effect of mGluR activation on NMDA-induced TTX-resistant oscillations. A, Effect of potentiating NMDA receptors on membrane potential oscillations is shown in an excitatory neuron. Trough potentials are adjusted by current injection. In control (thin trace) current is zero, and with NMDA potentiation, current is 0.025 nA. Potentiation of NMDA receptors increases the plateau duration, decreases the duration of the hyperpolarized phase, and decreases cycle duration. B,At a more depolarized trough potential (0.1 nA; thin trace), potentiation of NMDA (0.145 nA; thick trace) again increases the plateau duration and decreases the duration of the hyperpolarized phase, but instead increases the cycle duration. C, D, Potentiation of NMDA receptors [0.1 arbitrary unit (AU)] increases the basal CaNMDA level. This leads to a slower calcium accumulation, which increases the plateau duration, and a faster decay, which decreases the duration of the hyperpolarized phase. E,Effect of potentiation of NMDA receptors on plateau duration at different trough potentials. F, The duration of the hyperpolarized phase decreased at different trough potentials.G, Potentiation of NMDA receptors had different effects on the cycle duration depending on the trough potential.
These results can be understood on the basis of CaNMDA dynamics (Fig. 8C,D). Calcium accumulation activates KCa channels, which terminates the plateau phase and determines the duration of the hyperpolarized phase (Brodin et al., 1991; Tegnér et al., 1998). When the NMDA conductance is potentiated (Fig. 8C,D, thick traces), the baseline level of CaNMDAincreases, resulting in a change in calcium dynamics. The accumulation of calcium becomes slower, whereas the decay becomes faster (Fig.8C,D). The potentiation of the NMDA conductance delays the plateau termination because more calcium is necessary to evoke a sufficient KCa current to overcome the increased depolarizing drive. The change in CaNMDA kinetics can thus explain both the increased plateau duration and decreased duration of the hyperpolarized phase, as well as the effects on cycle duration (see Discussion; Ekeberg et al., 1991; Tegnér et al., 1998; Hellgren-Kotaleski et al., 1999b).
Because the results of simulations of the potentiation of NMDA responses were similar to those obtained experimentally, we next tested if this potentiation is sufficient to reproduce the group I mGluR-mediated increase in the locomotor frequency. The mGluR-mediated increase in burst frequency (Krieger et al., 1998), was also reproduced in the network model of the lamprey locomotor CPG by potentiating the NMDA conductance (Hellgren et al., 1992; Hellgren-Kotaleski et al., 1999b). In a control simulation of the locomotor network (Fig.9A), activation of NMDA receptors elicited rhythmic alternating activity. When NMDA receptors were potentiated on only one side (Fig. 9B), the potentiated side showed a prolonged burst duration and a shortened interburst interval, as predicted from the effects on the single cell level. Potentiation of NMDA receptors on both sides increased the frequency (Fig. 9C; see also Kepler et al., 1990; Skinner et al., 1994, Hellgren-Kotaleski et al., 1999a).
Fig. 9.

Simulation of the effect of mGluR potentiation of NMDA receptors on the locomotor network. A, The network of a population of excitatory and crossed inhibitory neurons (left panel) is activated by NMDA (0.45 AU) and AMPA/kainate (3 AU). Alternating rhythmic locomotor activity is shown for one left and one right excitatory neuron (right panel). B, Potentiation of the NMDA receptors on the left side by 30% shortens the interburst interval because the potentiation of NMDA receptors leads to an earlier “escape” from contralateral inhibition. The burst duration is prolonged because the NMDA potentiation produces a more effective inhibition of the contralateral side, resulting in later escape from inhibition. C, Potentiation of both sides (30%) results in an increased burst frequency of the model network. This is because the oscillatory mechanism is dominated by an escape mechanism in which the changes in the duration of the interburst intervals decides the outcome.
DISCUSSION
Interaction between group I mGluRs and NMDA receptors
These results show that activation of postsynaptic group I mGluRs potentiates NMDA-induced currents through a G-protein-dependent mechanism in a variety of spinal neurons, including motoneurons and crossed caudally projecting interneurons. The NMDA-induced calcium response is also potentiated by activation of group I mGluRs. The interaction between group I mGluRs and NMDA receptors results in a profound modulation of NMDA-induced TTX-resistant membrane potential oscillations. The effects of DHPG on NMDA-induced calcium responses, membrane oscillations, and the locomotor rhythm were all blocked by CPCCOEt. These results thus indicate that activation of group I mGluRs potentiates NMDA responses through a postsynaptic interaction. Can this interaction explain the increase in locomotor frequency induced by DHPG? In addition to potentiating NMDA receptors, activation of group I mGluRs mediates presynaptic facilitation of reticulospinal transmission through a ryanodine-sensitive mechanism (Cochilla and Alford, 1998). The latter effect could also lead to an increase in the frequency of the locomotor activity. If this were the case it would be expected that ryanodine should block, at least partially, the increase in frequency induced by DHPG. Our results show that ryanodine had no effect on either the increased frequency induced by DHPG or the decreased frequency after blockade of endogenously activated group I mGluRs by CPCCOEt. Ryanodine-sensitive presynaptic facilitation thus does not seem to be involved in the regulation of locomotor network activity by group I mGluRs. Although other mechanisms (e.g., calcium release from internal stores or potentiation of other receptors and ion channels) can be involved in regulating locomotor activity, our results suggest that the postsynaptic interaction between group I mGluRs and NMDA receptors can account for this regulation.
mGluR-mediated potentiation of cellular responses to NMDA
The potentiation of NMDA receptors by the group I mGluR agonist DHPG was blocked by the antagonist CPCCOEt and GDP-β-S, which causes an irreversible inactivation of G-proteins, arguing for a specific effect on mGluRs. Measuring changes in calcium fluorescence showed that NMDA increased intracellular calcium concentrations. The source of the NMDA-induced calcium increase is in part caused by the activation of L- and N-type calcium channels evoked by the depolarization of the neuron. The remaining part could be attributable to calcium influx through NMDA channels and/or activation of calcium channels insensitive to the L- and N-type blockers (El Manira and Bussières, 1997). DHPG could potentiate calcium responses induced by saturating NMDA concentrations, suggesting that the interaction between mGluRs and NMDA receptors changes the properties of the receptor in a way that cannot be achieved by an increased NMDA concentration. NMDA-induced calcium responses were similar in amplitude in control cells compared to cells preincubated with ryanodine (Table 1), suggesting that ryanodine-sensitive calcium stores are not involved. The mGluR-mediated potentiation persists in the presence of protein kinase A, C, and G inhibitors. mGluR-mediated potentiation of the NMDA current has been shown previously in mammalian hippocampus (Aniksztejn et al., 1991; Harvey and Collingridge, 1993;Fitzjohn et al., 1996), spinal dorsal horn neurons (Bleakman et al., 1992), and other preparations (Kelso, 1992; Collins, 1993; Rahmann and Neuman, 1996; Wang and Daw, 1996). The signal transduction mechanism involved in the mGluR-mediated potentiation differs among preparations, with protein kinase C being involved in the effects of mGluR expressed in Xenopus oocytes (Kelso, 1992), but with evidence both for (Aniksztejn et al., 1991) and against (Harvey and Collingridge, 1993) protein kinase C in hippocampus. Furthermore, results of a recent study have suggested that the group I mGluR agonist DHPG (or a glycine contamination) can act as a coagonist at the glycine site of NMDA receptors and thus potentiate NMDA responses (Contractor et al., 1998). Our results show that the potentiation of NMDA responses by DHPG is blocked by the antagonist CPCCOEt and by intracellular injection of GDP-β-S. Thus, in the lamprey spinal cord neurons the potentiation of NMDA receptors by DHPG is mediated through a direct effect of this agonist on mGluRs rather than on NMDA receptors and that this interaction is not mediated through activation of protein kinase C.
Mechanism accounting for the mGluR-mediated regulation of burst frequency
The spinal neuronal network underlying locomotion in the lamprey can be activated by glutamate or the subtype-specific agonists NMDA, AMPA, and kainate (Grillner et al., 1998). NMDA also causes membrane potential oscillations that persist in the presence of TTX (Sigvardt et al., 1985; Wallén and Grillner, 1987). These oscillations are thought to contribute to fictive locomotion because their blockade by perfusion of magnesium-free solution results in weak and less regular ventral root bursts (Wallén and Grillner, 1987). Furthermore, NMDA-induced TTX-resistant oscillations have similar amplitude and frequency to the locomotor oscillatory activity. The oscillations consist of a rapid depolarization caused by the opening of NMDA channels, followed by a plateau phase at which voltage-dependent K+ channels balance the NMDA current. A gradual increase of KCa current, activated by calcium influx through NMDA (CaNMDA) and HVA calcium channels, leads to a rapid repolarization of the membrane potential. The duration of the hyperpolarized phase that follows is determined by the decay of calcium, which activates KCa currents (Wallén and Grillner, 1985,1987; Brodin et al., 1991; Tegnér et al., 1998). The accumulation and decay rates of CaNMDA are relatively slower than for the HVA calcium (see Materials and Methods), which more closely follows the membrane potential. Therefore the level of CaNMDA tends to decide the duration of the hyperpolarized phase. Because the properties of the NMDA-induced TTX-resistant oscillations will change the locomotor burst frequency (Brodin et al., 1991; Wallén et al., 1992), a modulation of these oscillations is a possible mechanism for the mGluR-mediated burst frequency increase. mGluR activation results in an increased plateau duration, no effect or a decrease in the duration of the hyperpolarized phase, and a membrane potential-dependent change in the frequency (Fig.6). These results were reproduced in simulations in which calcium accumulation and decay determines the duration of the plateau and hyperpolarized phases. In the simulations, the accumulation and decay of CaNMDA depended on the initial CaNMDA level. A potentiation of NMDA receptors at both relatively hyperpolarized (Fig. 8C) and depolarized trough potentials (Fig. 8D) increases the basal CaNMDA level. The higher the baseline CaNMDA level, the slower the accumulation and the faster the decay of calcium. Activation of KCachannels will terminate the plateau phase through a closure of voltage-dependent NMDA channels, and thus with a slower calcium accumulation the plateau duration will increase. The duration of the hyperpolarized phase is also determined by KCachannels. The faster calcium decay, in combination with the increased depolarizing drive caused by the NMDA potentiation, leads to a decreased duration of the hyperpolarized phase. Both experimental and simulation data show that the oscillation cycle duration is dependent on the trough potential. At hyperpolarized trough potentials, there is a more pronounced decrease of the hyperpolarized phase, relative to the increase of the plateau duration, resulting in an increase in the frequency. At more depolarized trough potentials the reverse is true. The network effect of mGluR activation with an increased burst frequency can thus be accounted for by the cellular effects observed.
Footnotes
This work was supported by the Swedish Medical Research Council (project 11562), the Swedish Foundation for Strategic Research, Erikssons Stiftelse, Jeanssons Stiftelse, Wiberg Stiftelse, and Karolinska Institute funds. P. Krieger received a fellowship from Knut and Alice Wallenbergs Stiftelse. We thank Drs. L. Brodin, S. Grillner, and D. Parker for their comments on this manuscript. We are also grateful to H. Axelgren and M. Bredmyr for excellent technical assistance.
Correspondence should be addressed to P. Krieger, Nobel Institute for Neurophysiology, Department of Neuroscience, Karolinska Institute, S-171 77 Stockholm, Sweden. E-mail: Patrik.Krieger@neuro.ki.se
REFERENCES
- 1.Aniksztejn L, Bregestovski P, Ben-Ari Y. Selective activation of quisqualate metabotropic receptor potentiates NMDA but not AMPA receptors. Eur J Pharmacol. 1991;205:327–328. doi: 10.1016/0014-2999(91)90921-c. [DOI] [PubMed] [Google Scholar]
- 2.Anwyl R. Metabotropic glutamate receptors: electrophysiological properties and role in plasticity. Brain Res Rev. 1999;29:83–120. doi: 10.1016/s0165-0173(98)00050-2. [DOI] [PubMed] [Google Scholar]
- 3.Bleakman D, Rusin KI, Chard PS, Glaum SR, Miller RJ. Metabotropic glutamate receptors potentiate ionotropic glutamate responses in the rat dorsal horn. Mol Pharmacol. 1992;42:192–196. [PubMed] [Google Scholar]
- 4.Brodin L, Grillner S. Effects of magnesium on fictive locomotion induced by activation of N-methyl-d-aspartate (NMDA) receptors in the lamprey spinal cord in vitro. Brain Res. 1986;380:244–252. doi: 10.1016/0006-8993(86)90219-2. [DOI] [PubMed] [Google Scholar]
- 5.Brodin L, Tråvén HG, Lansner A, Wallén P, Ekeberg Ö, Grillner S. Computer simulations of N-methyl-d-aspartate receptor-induced membrane properties in a neuron model. J Neurophysiol. 1991;66:473–484. doi: 10.1152/jn.1991.66.2.473. [DOI] [PubMed] [Google Scholar]
- 6.Buchanan JT. Identification of interneurons with contralateral, caudal axons in the lamprey spinal cord: synaptic interactions and morphology. J Neurophysiol. 1982;47:961–975. doi: 10.1152/jn.1982.47.5.961. [DOI] [PubMed] [Google Scholar]
- 7.Buchanan JT, Grillner S. Newly identified ‘glutamate interneurons’ and their role in locomotion in the lamprey spinal cord. Science. 1987;236:312–314. doi: 10.1126/science.3563512. [DOI] [PubMed] [Google Scholar]
- 8.Cochilla AJ, Alford S. Metabotropic glutamate receptor-mediated control of neurotransmitter release. Neuron. 1998;20:1007–1016. doi: 10.1016/s0896-6273(00)80481-x. [DOI] [PubMed] [Google Scholar]
- 9.Collins GG. Actions of agonists of metabotropic glutamate receptors on synaptic transmission and transmitter release in the olfactory cortex. Br J Pharmacol. 1993;108:422–430. doi: 10.1111/j.1476-5381.1993.tb12820.x. [DOI] [PMC free article] [PubMed] [Google Scholar]
- 10.Contractor A, Gereau RW, IV, Green T, Heinemann SF. Direct effects of metabotropic glutamate receptor compounds on native and recombinant N-methyl-d-aspartate receptors. Proc Natl Acad Sci USA. 1998;95:8969–8974. doi: 10.1073/pnas.95.15.8969. [DOI] [PMC free article] [PubMed] [Google Scholar]
- 11.Ekeberg Ö, Wallén P, Lansner A, Tråvén H, Brodin L, Grillner S. A computer based model for realistic simulations of neural networks. I The single neuron and synaptic interaction. Biol Cybern. 1991;65:81–90. doi: 10.1007/BF00202382. [DOI] [PubMed] [Google Scholar]
- 12.El Manira A, Bussières N. Calcium channel subtypes in lamprey sensory and motor neurons. J Neurophysiol. 1997;78:1334–1340. doi: 10.1152/jn.1997.78.3.1334. [DOI] [PubMed] [Google Scholar]
- 13.Fitzjohn SM, Irving AJ, Palmer MJ, Harvey J, Lodge D, Collingridge GL. Activation of group I mGluRs potentiates NMDA responses in rat hippocampal slices. Neurosci Lett. 1996;203:211–213. doi: 10.1016/0304-3940(96)12301-6. [DOI] [PubMed] [Google Scholar]
- 14.Grillner S, Ekeberg Ö, El Manira A, Lansner A, Parker D, Tegnér J, Wallén P. Intrinsic function of a neuronal network - a vertebrate central pattern generator. Brain Res Rev. 1998;26:184–197. doi: 10.1016/s0165-0173(98)00002-2. [DOI] [PubMed] [Google Scholar]
- 15.Harvey J, Collingridge GL. Signal transduction pathways involved in the acute potentiation of NMDA responses by 1S,3R-ACPD in the rat hippocampal slices. Br J Pharmacol. 1993;109:1085–1090. doi: 10.1111/j.1476-5381.1993.tb13733.x. [DOI] [PMC free article] [PubMed] [Google Scholar]
- 16.Hellgren J, Grillner S, Lansner A. Computer simulation of the segmental neural network generating locomotion in lamprey by using populations of network interneurons. Biol Cybern. 1992;68:1–13. doi: 10.1007/BF00203132. [DOI] [PubMed] [Google Scholar]
- 17.Hellgren-Kotaleski J, Lansner A, Grillner S. Neural mechanisms potentially contributing to the intersegmental phase lag in lamprey. I. Segmental oscillations dependent on reciprocal inhibition. Biol Cybern. 1999a;81:317–330. doi: 10.1007/s004220050565. [DOI] [PubMed] [Google Scholar]
- 18.Hellgren-Kotaleski J, Lansner A, Grillner S. Neural mechanisms potentially contributing to the intersegmental phase lag in lamprey. II. Hemisegmental oscillations produced by mutually coupled excitatory neurons. Biol Cybern. 1999b;81:299–315. doi: 10.1007/s004220050564. [DOI] [PubMed] [Google Scholar]
- 19.Kelso SR. Protein kinase C-mediated enhancement of NMDA currents by metabotropic glutamate receptors in Xenopus oocytes. J Physiol (Lond) 1992;449:705–718. doi: 10.1113/jphysiol.1992.sp019110. [DOI] [PMC free article] [PubMed] [Google Scholar]
- 20.Kepler TB, Marder E, Abbott LF. The effect of electrical coupling on the frequency of model neuronal oscillators. Science. 1990;248:83–85. doi: 10.1126/science.2321028. [DOI] [PubMed] [Google Scholar]
- 21.Krieger P, El Manira A, Grillner S. Activation of pharmacologically distinct metabotropic glutamate receptors depresses reticulospinal-evoked EPSPs in the lamprey spinal cord. J Neurophysiol. 1996;76:3834–3841. doi: 10.1152/jn.1996.76.6.3834. [DOI] [PubMed] [Google Scholar]
- 22.Krieger P, Grillner S, El Manira A. Endogenous activation of metabotropic glutamate receptors contributes to burst frequency regulation in the lamprey locomotor network. Eur J Neurosci. 1998;10:3333–3342. doi: 10.1046/j.1460-9568.1998.00337.x. [DOI] [PubMed] [Google Scholar]
- 23.O'Connor JJ, Rowan MJ, Anwyl R. Long-lasting enhancement of NMDA receptor-mediated synaptic transmission by metabotropic glutamate receptor activation. Nature. 1994;367:557–559. doi: 10.1038/367557a0. [DOI] [PubMed] [Google Scholar]
- 24.O'Connor JJ, Rowan MJ, Anwyl R. Tetanically induced LTP involves a similar increase in the AMPA and NMDA receptor components of the excitatory postsynaptic current: investigations of the involvement of mGlu receptors. J Neurosci. 1995;15:2013–2020. doi: 10.1523/JNEUROSCI.15-03-02013.1995. [DOI] [PMC free article] [PubMed] [Google Scholar]
- 25.Parker D, Svensson E, Grillner S. Substance P modulates sensory action potentials in the lamprey via a protein kinase C-mediated reduction of a 4-aminopyridine-sensitive potassium conductance. Eur J Neurosci. 1997;9:2064–76. doi: 10.1111/j.1460-9568.1997.tb01374.x. [DOI] [PubMed] [Google Scholar]
- 26.Pin JP, Bockaert J. Get receptive to metabotropic glutamate receptors. Curr Opin Neurobiol. 1995;5:342–349. doi: 10.1016/0959-4388(95)80047-6. [DOI] [PubMed] [Google Scholar]
- 27.Pin JP, Duvoisin R. The metabotropic glutamate receptors: structure and functions. Neuropharmacology. 1995;34:1–26. doi: 10.1016/0028-3908(94)00129-g. [DOI] [PubMed] [Google Scholar]
- 28.Rahmann S, Neuman RS. Characterization of metabotropic glutamate receptor-mediated facilitation of N-methyl-d-aspartate depolarization of neocortical neurones. Br J Pharmacol. 1996;117:675–683. doi: 10.1111/j.1476-5381.1996.tb15243.x. [DOI] [PMC free article] [PubMed] [Google Scholar]
- 29.Sigvardt KA, Grillner S, Wallén P, Van Dongen PA. Activation of NMDA receptors elicits fictive locomotion and bistable membrane properties in the lamprey spinal cord. Brain Res. 1985;336:390–395. doi: 10.1016/0006-8993(85)90676-6. [DOI] [PubMed] [Google Scholar]
- 30.Skinner FK, Kopell N, Marder E. Mechanisms for oscillation and frequency control in reciprocally inhibitory model neural networks. J Comp Neurosci. 1994;1:69–87. doi: 10.1007/BF00962719. [DOI] [PubMed] [Google Scholar]
- 31.Tegnér J, Lansner A, Grillner S. Modulation of burst frequency by calcium-dependent potassium channels in the lamprey locomotor system: dependence of the activity level. J Comp Neurosci. 1998;5:121–140. doi: 10.1023/a:1008897031013. [DOI] [PubMed] [Google Scholar]
- 32.Wallén P, Grillner S. The effect of current passage on N-methyl-d-aspartate-induced, tetrodotoxin-resistant membrane potential oscillations in lamprey neurons active during locomotion. Neurosci Lett. 1985;56:87–93. doi: 10.1016/0304-3940(85)90112-0. [DOI] [PubMed] [Google Scholar]
- 33.Wallén P, Grillner S. N-methyl-d-aspartate receptor-induced, inherent oscillatory activity in neurons active during fictive locomotion in the lamprey. J Neurosci. 1987;7:2745–2755. doi: 10.1523/JNEUROSCI.07-09-02745.1987. [DOI] [PMC free article] [PubMed] [Google Scholar]
- 34.Wallén P, Ekeberg Ö, Lansner A, Brodin L, Tråvén H, Grillner S. A computer-based model for realistic simulations of neural networks. II The segmental network generating locomotor rhythmicity in the lamprey. J Neurophysiol. 1992;68:1939–1950. doi: 10.1152/jn.1992.68.6.1939. [DOI] [PubMed] [Google Scholar]
- 35.Wang XF, Daw NW. Metabotropic glutamate receptors potentiate responses to NMDA and AMPA from layer V cells in rat visual cortex. J Neurophysiol. 1996;76:808–815. doi: 10.1152/jn.1996.76.2.808. [DOI] [PubMed] [Google Scholar]