

Abstract
The all-or-none character of transmission at central synapses is commonly viewed as evidence that only one vesicle can be released per action potential at a single release site. This interpretation is still a matter of debate; its resolution is important for our understanding of the nature of quantal response. In this work we explore observable consequences of the univesicular release hypothesis by studying a stochastic model of synaptic transmission. We investigated several alternative mechanisms for the all-or-none response: (1) the univesicular release constraint realized through lateral inhibition across presynaptic membrane, (2) the constraint of a single releasable vesicle per active zone, and (3) the postsynaptic receptor saturation.
We show that both the univesicular release constraint and the postsynaptic receptor saturation lead to a limited amount of depression by vesicle depletion, so that depletion alone cannot account for the strong paired-pulse depression observed at some cortical synapses. Although depression can be rapid if there is only one releasable vesicle per active zone, this scenario leads to a limit on the transmission probability. We evaluate additional mechanisms beyond vesicle depletion, and our results suggest that the strong paired-pulse depression may be a result of activity-dependent inactivation of the exocytosis machinery.
Furthermore, we found that the statistical analysis of release events, in response to a long stimulus train, might allow one to distinguish experimentally between univesicular and multivesicular release scenarios. We show that without the univesicular release constraint, the temporal correlation between release events is always negative, whereas it is typically positive with such a constraint if the vesicle fusion probability is sufficiently large.
Keywords: central synapse, short-term depression, exocytosis, univesicular release, receptor saturation, stochastic model
Experimental evidence from various vertebrate neural systems indicates that at central synapses transmission proceeds in an all-or-none fashion (for review, seeRedman, 1990; Korn and Faber, 1991;Walmsley et al., 1998). For instance, in experiments in which quantal analysis was combined with morphological reconstruction of synaptic connections, the number of postsynaptic quantal responses was found to be either equal to or less than the number of reconstructed active zones (Korn et al., 1982;Redman and Walmsley, 1983; Somogyi et al., 1998). In other experiments, the distribution of postsynaptic responses evoked by stimulation of single synaptic boutons was found to be unimodal (Edwards et al., 1976a,Edwards et al., 1976b; Gulyás et al., 1993; Arancio et al., 1994;Stevens and Wang, 1995; Silver et al., 1996). These observations have led to the hypothesis that at most one vesicle can be released per spike per active zone (Triller and Korn, 1982; Stevens, 1993;Korn et al., 1994). It has been proposed that fusion of one vesicle triggers a lateral inhibition across the presynaptic membrane, preventing other vesicles from being released simultaneously (Triller and Korn, 1982). The observation of an absolute refractory time of several milliseconds after a synaptic response (Stevens and Wang, 1995; Hjelmstad et al., 1997) has been interpreted as evidence for such a lateral inhibition mechanism (Dobrunz et al., 1997). A second possible basis for the univesicular release is the constraint that there is only a single releasable vesicle per active zone at any given time. Alternatively, the all-or-none synaptic transmission was proposed to arise from the saturation of postsynaptic receptors by neurotransmitter content of a single vesicle, which would imply the same postsynaptic response regardless of the number of vesicles released (Jack et al., 1981; Edwards et al., 1990; Tong and Jahr, 1994; Auger et al., 1998) [for evidence of non-saturation, see Liu et al. (1999)]. These contrasting scenarios represent different views about the nature of the synaptic quantal response. Elucidation of this issue is essential for our understanding of synaptic computation and plasticity.
The purpose of the present work is to explore observable implications of the all-or-none transmission hypothesis by computer simulation of a stochastic synapse model that is constrained by recent data on cortical synapses that, like synapses elsewhere, often exhibit short-term depression of response. Another motivation of this study is to test the proposal that short-term synaptic depression is caused by depletion of the releasable vesicle pool (Liley and North, 1952;Hubbard, 1963; Stevens and Wang, 1995). Our results suggest that with either univesicular release constraint or postsynaptic receptor saturation, vesicle depletion alone cannot account for the strong (more than twofold) paired-pulse depression (PPD) observed at cortical synapses (Markram and Tsodyks, 1996; Thomson, 1997; Varela et al., 1997; Brenowitz et al., 1998; Wang and Lambert, 1998). We consider depression mechanisms beyond vesicle depletion that can explain the observed PPD, including presynaptic inhibition via metabotropic autoreceptors (Davies and Collingridge, 1990, Davies and Collingridge, 1993; Scanziani et al., 1997) and activity-dependent inactivation of exocytosis machinery (Hsu et al., 1996).
Moreover, we found that the temporal correlation between stochastic responses to a repetitive train of stimuli behaves differently depending on whether multiple releases are allowed. Therefore, measurement of such temporal correlations may provide a novel experimental way to test the univesicular release hypothesis.
MATERIALS AND METHODS
Model of vesicle turnover. Our synapse model is, in essence, a simple model of vesicle turnover (Fig.1). There are indications, both functional and morphological, that at least two distinct pools of vesicles can be identified at the presynaptic site, a relatively small pool of vesicles immediately available for release, possibly representing vesicles docked at the presynaptic site, and a more distal and much larger reserve pool of vesicles (for review, seeZucker, 1996; Neher, 1998). However, a straightforward realization of the two-pool model as a mass action scheme (Heinemann et al., 1993), depicted in Fig.1A, is not realistic, because according to such a model the rate of refill of the docked pool is proportional to the number of reserve pool vesicles, NR. In reality, there should be a considerable bottleneck in the refill process, because at a given time only those reserve vesicles that are closest to the release site have a significant probability for being docked. Therefore, we used an alternative scheme, where the docked pool has a limited size N0, and each vacancy can be refilled at a rate independent of the reserve pool size NR. In this case a simple single-pool model (Fig. 1B) (Liu and Tsien, 1995;Wang, 1999) provides, in our view, a more accurate description of vesicle dynamics, as long as the reserve pool is far from depletion.
Fig. 1.

Models of vesicle turn-over. A, The two-pool synapse model. The “docked” pool is composed of vesicles immediately available for release. In response to an action potential, a docked vesicle is released with a certain probability dependent on ND. This pool is refilled by vesicles from the reserve pool; the dashed arrow signifies the bottleneck in the refill process. B, Single-pool synapse model. Release probability is described by a Poisson process with lateral inhibition between release sites and is given by 1 minus the failure rate, which is equal to exp(−αVN), where αVis the fusion rate for a single vesicle. Vacancy in the vesicle pool is refilled with a time constant of τD, which determines the depression recovery dynamics.
Thus, our model synapse consists of a single vesicle pool of size N with an upper limit of N0, which can lose one or more vesicles in response to a presynaptic action potential. Depletion of the vesicle pool leads to short-term depression, which recovers with a time constant τD equal to the inverse of the vacancy refill rate. Processes of vesicle release and recovery are treated stochastically (Vere-Jones, 1966;Melkonian and Kostopoulos, 1996; Quastel, 1997; Maass and Zador, 1999). Release of a single vesicle during an incoming pulse is governed by a Poisson process with some time-dependent rate λV(t), which we assume is significant only for the duration of the pulse. The integral αV = ∫ λVdt is the fusion rate for a single vesicle integrated over the duration of the presynaptic pulse. The single-vesicle release probability is then pV = 1 − exp(−αV), and the single-vesicle failure probability is 1 − pV = exp(−αV) (Dobrunz and Stevens, 1997).
In our analysis we neglect facilitation of transmitter release (Fisher et al., 1997) because we study predominantly synapses exhibiting pronounced short-term depression, which generally show a high initial release probability and little facilitation (Korn and Faber, 1987; Zucker, 1989;Debanne et al., 1996; Dobrunz and Stevens, 1997; Tsodyks and Markram, 1997). We also neglect activity-dependent changes in the recycling kinetics that can influence synaptic response to long trains of stimuli (Hubbard, 1963; Elmqvist and Quastel, 1964; Dittman and Regehr, 1998; Stevens and Wesseling, 1998;Wang and Kaczmarek, 1998), because in this work we mostly consider synaptic response to a paired-pulse stimulus (also see Discussion).
All calculations were performed using Monte-Carlo simulations of the model. The modeling computer program was written in the Clanguage, compiled using a GNU compiler and executed on Intel Pentium-powered computers running under the Linux operating system. Because the simulations were not CPU-time intensive, thousands to tens of thousand of Monte-Carlo iterations were run for each of the graphs presented, until the statistical errors were negligible.
We study two versions of the synapse model; one with the univesicular release constraint and the other with unconstrained release.
Univesicular release case. We implement the univesicular release constraint by assuming that a vesicle release event transiently prevents other vesicles from being exocytosed, as suggested byTriller and Korn (1982). Then, the release probability per stimulus is 1 minus the failure probability, given by the N th power of single-vesicle release failure probability, where N is the number of vesicles available for release (Dobrunz and Stevens, 1997, their Eq. 1.A):
| Equation 1 |
with N ≤ N0. Therefore, the univesicular release constraint implies a nonlinear dependence of the release probability on the number of available vesicles. For small αV (low-release probability), exp(−αVN) ∼ 1 − αVN, and Equation 1 yields an approximately linear relationship: pr(N) ≃ αVN.
We assume that the release site quickly recovers from the putative inhibition mechanism that prevents multivesicular release. As proposed by Dobrunz et al. (1997), such a “lateral inhibition” mechanism may be at the basis of the observed brief refractory period after a postsynaptic response, during which the probability for another release is small (Stevens and Wang, 1995; Hjelmstad et al., 1997). Experimentally, one can distinguish between the relative and the absolute refractory times; for hippocampal synapses in culture, both values are close to 5 msec (Stevens and Wang, 1995; Hjelmstad et al., 1997). Therefore, at physiological firing rates (r ≤ 40 Hz) we expect the recovery from refractoriness to be complete within an interspike interval.
Unconstrained release case. In the absence of the univesicular release constraint, when multivesicular release is allowed, individual vesicles are released independently of each other, with release probability pV = 1 − exp(−αV). The number of vesicles released in response to an action potential, ΔN, is determined by a binomial distribution with parameters pV and N (size of available pool). The average number of vesicles released is then given by 〈ΔN〉 = pVN (for fixed N). In this case the amplitude of synaptic response depends on the fraction of postsynaptic receptors that are bound by neurotransmitter released from a single vesicle, which we denote by ω (“occupancy” or “saturation” parameter). If the synaptic response produced by activation of all postsynaptic receptors is given by R, the response attributable to release of one vesicle will be R1 = ωR, response attributable to two vesicles will be R2 = Rω[1 + (1 − ω)], and so on; response attributable to release of n vesicles is then Rn = ωR[1 + (1 − ω) + ⋯ + (1 − ω)n−1] = R[1 − (1 − ω)n] (Auger et al., 1998). Average initial response is given by an average of Rn over the binomial distribution, P(n), of the number of vesicles released, n:
| Equation 2 |
Parameters. An important parameter of the synapse model is the release-ready pool size, N0. The size of the release-ready pool varies across different types of central synapses (Zucker, 1996; Neher, 1998); we use estimates for hippocampal excitatory synapses, where recordings from individual boutons have been achieved (Bekkers and Stevens, 1990; Raastad et al., 1992; Liu and Tsien, 1995). For the rat hippocampal synapses in slice and culture, Stevens and collaborators (Stevens and Tsujimoto, 1995; Dobrunz and Stevens, 1997) assessed the size of the releasable pool by measuring the number of postsynaptic responses elicited by a short high-frequency electric stimulation or by a brief application of a hypertonic solution (Rosenmund and Stevens, 1996), as well as by optical monitoring of the amount of fluorescent dye taken up and released during stimulation [Murthy et al. (1997); Murthy and Stevens (1998); also see Ryan et al. (1997)]. The available pool size estimated in individual experiments varied between 2 and 25. Ultrastructural analysis of hippocampal synapses suggests that these numbers are consistent with the number of vesicles docked at single synaptic active zones (Forti et al., 1997;Schikorski and Stevens, 1997). In our simulations N0 = 3-10. For the vesicle refill time constant we choose a value of τD = 2 sec, which agrees with the time of recovery of the readily releasable pool measured in hippocampal slice experiments by Dobrunz and Stevens (1997).
In this form, the model is specified by three parameters: the maximal size of the vesicle pool N0, the depression recovery time constant τD, and the vesicle fusion rate αV [or, equivalently, the initial release probability p0 = 1 − exp(−αVN0)]. For the case of unconstrained release, there is an additional saturation parameter ω.
Metabotropic presynaptic inhibition. Presynaptic metabotropic autoreceptors are believed to exert their action primarily through inhibition of voltage-dependent Ca2+channels (for review, see Wu and Saggau, 1997). Let x(t) be the dynamical variable describing the level of activation of inhibitory autoreceptors. Assuming that the release probability depends on a power of the spike-triggered Ca2+ influx, and that the amount of Ca2+ influx is inversely proportional to x(t), we replace the vesicle fusion rate by:
| Equation 3 |
where the constant Cx controls the strength of the inhibitory effect, and parameter q specifies Ca2+ cooperativity of vesicle release (Zucker, 1996; Neher, 1998). We chose q = 3. Presynaptic autoreceptors are assumed to be activated by neurotransmitter released by the same synapse and diffusing away from the synaptic cleft; therefore, the receptor activity variable x(t) should depend on the previous synaptic activity and show delayed response to vesicle release, which we model by simple second-order kinetics (a similar model has been used in Wang et al., 1995):
| Equation 4 |
Here ti are vesicle release times, coefficients αx and αy determine the speed of onset of presynaptic inhibition, and constants τx and τy determine the rate of decay of the inhibitory effect. We have chosen the following parameter values: αx−1 = 600 msec, αy = 1.0, τx = 2 sec, τy = 100 msec, Cx= 7. These parameter values were chosen to reproduce approximately the dependence of paired-pulse depression on the inter-pulse interval observed at hippocampal GABAergic synapses (see Fig 10).
Fig. 10.

Effect of inhibitory metabotropic autoreceptors on synaptic transmission. Solid and dashed linesindicate model simulation data with and without presynaptic inhibition, respectively. A, Inter-pulse interval dependence of paired-pulse depression. Circles indicate experimental data obtained by Davies and Collingridge (1993) by recording inhibitory currents in pyramidal cells in rat hippocampal slices in control (filled circles) and in the presence of a GABAB antagonist (open circles). B,Time course of depressing synaptic response to a 5 Hz stimulation.C, Steady-state release probability and (D) synaptic response rate (given by the product of release probability and the rate), as a function of the stimulation frequency. In contrast to Fig. 2C, presynaptic inhibition prevents response rate saturation and extends the synaptic dynamic range. Synaptic parameter values are N0 = 6, p0 = 0.8, τD = 2 sec.
Statistical analysis. For a discrete (point) process such as a spike train, or a train of release events, autocorrelation function G(τ) characterizes the likelihood of observing two events separated by a time interval equal to τ. It is defined by:
| Equation 5 |
where μ is the average event rate. In this normalization the autocorrelation function is therefore equal to the difference between the conditional probability rate of observing an event at (or close to) time t + τ, given an event at (or close to) time t, and the average (unconditional) event rate μ. Here we assume that the process is stationary, so neither G(τ) nor μ depend on t.
In the particular case of constant-frequency stimulation of period Δt, time is discretized into equally spaced points tn = nΔt, and the vesicle release event train is defined by the quantity:
| Equation 6 |
The expression for the autocorrelation function now takes the form:
| Equation 7 |
where P(ςn = 1) = 〈pr〉ss is the average steady-state release probability.
Another useful indicator of temporal correlations in the synaptic output is the coefficient of correlation between successive inter-release intervals (IRIs):
| Equation 8 |
where angled brackets denote average values, and IRIn is the n th inter-release time interval.
RESULTS
Short-term depression attributable to vesicle depletion
Time course of short-term depression
First we examine the response of the synapse model that includes the univesicular release constraint, to a stimulus train of constant frequency (Fig. 2). The release event sequences and the evolution of release probability with stimulus number are shown in Figure 2A for two different stimulation trials. Because only one release is allowed per action potential, synaptic output is a binary event sequence (release/failure). Toward the end of the traces there are time intervals of zero release probability; during those periods the vesicle pool is completely depleted. The trial-averaged release probability 〈pr〉, which represents the average synaptic response for a given stimulus, is shown in Figure 2B;it decays monotonically with stimulation as a result of the gradual depletion of the available vesicle pool, until it reaches a stationary-state value, 〈pr〉ss.
Fig. 2.

Response of the synapse model to constant frequency stimulation. A, An example with a stimulus rate of 20 Hz; (a) the stimulus train, (b) synaptic response; two sample trials are shown. Black vertical barsrepresent release events; the height of the thick gray barsdenotes the release probability at the time of arrival of a spike. Parameter values: p0 = 0.9, N0= 8, τD = 2 sec. B, Trial-averaged release probability as a function of time. C, Steady-state synaptic response rate, given by the product of the average release probability and stimulation rate r. Because the average release probability behaves like 1/r, the response rate saturates at high stimulation frequencies. D, Histogram for the inter-release intervals in the steady state is close to an exponential with time constant τ = 〈IRI〉 = 1/(r〈pr〉ss) = 274 msec (solid line), where r = 20 Hz is the stimulation frequency, and 〈pr〉ss = 0.182 is the average steady-state release probability.
The characteristic time of response decay depends both on the recovery time constant τD and the rate of stimulation r. For the linearized version of the model (small αV), one can show that this depression time constant τ is given by (see Appendix , Eq. 17):
| Equation 9 |
Therefore, τ is typically much shorter than τD; depression is faster with larger vesicle fusion rate αV or at higher stimulation rate r. For example, with αV = 0.29 (and N0 = 8 yielding p0 = 0.9 in Fig. 3) and r = 20 Hz, we have τ = 136 msec from Equation 9 although τD = 2000 msec.
Fig. 3.

Evolution of the probability distribution P(N) for the number of available vesicles. In the top left corner is indicated the stimulus number in a 30 Hz train for which the histogram is computed. Synaptic parameters are the same as in Figure 2 (N0 = 8, τD = 2 sec, p0 = 0.9). Probability distribution is computed immediately before the spike. Initial distribution is a single peak at N = N0. The last panelshows the steady-state vesicle number distribution. In the steady state, the average number of available vesicles is typically one or two.
As can be seen in Figure 2A, the number of available vesicles N is a random quantity; consequently the release probability displays a stochastic time evolution that varies from trial to trial. The state of the synapse at a given time is described by the probability distribution of N, P(N). Evolution of P(N) with time is demonstrated in Figure 3. Plotted in this figure are the histograms of the vesicle pool size immediately before a spike, for several consecutive stimuli in a 30 Hz train. Before the arrival of the first stimulus, the distribution consists of a single peak at N = N0. It gradually broadens with stimulation, until it sharpens again at low values of N, as the vesicle pool gets more depleted. In the steady state the synapse is not likely to contain more than one or two release-ready vesicles, at physiological stimulation rates much higher than the depression recovery rate 1/τD = 0.5 Hz.
Steady-state average response: the 1/r behavior
The steady-state synaptic response rate is defined as the steady-state release probability 〈pr(r)〉ss, characterizing synaptic response per single stimulus, multiplied by the stimulation rate r. In Figure 2C, the response rate is plotted as a function of the stimulation rate; it increases monotonically and approaches a plateau at high stimulation frequencies. Synaptic response saturates at a lower frequency if the vesicle fusion rate αV is larger (the initial release probability is higher) or if the recovery time constant τD is larger (the vesicle refill is slower) (Tsodyks and Markram, 1997; Markram et al., 1998). The saturation of the response rate implies that the steady-state release probability decays as 1/r at high rates, because of vesicle depletion (Liley and North, 1952). As was first noted byAbbott et al. (1997) and Tsodyks and Markram (1997), because of short-term depression the response rate becomes insensitive to the frequency of sustained presynaptic stimulation at high input frequencies. These studies used linear models of synaptic depression. Here we found that the 1/r behavior holds true for the nonlinear model, which takes into account the univesicular release constraint. Indeed, we show in Appendix that for any parameter values of the model, at sufficiently high stimulation frequencies 〈pr(r)〉ss ≃ N0/(rτD), independent of the vesicle fusion rate αV (Eq. 14).
Temporal correlation in the steady state
In addition to the average response that reaches a constant in the steady state, variability and correlations in the stochastic synaptic response can also be measured and quantified experimentally. We analyzed the fluctuation properties of our model synapse in the steady state. One important characteristic is the distribution of inter-release intervals (Fig. 2D). It is very close to an exponential with a decay time constant equal to the average inter-release interval, given by 1/(r〈pr〉ss).
The temporal autocorrelation between release events Gm = G(mΔt) (see Eq. 7 for definition), in the steady state, is shown in Figure4A,B. The autocorrelation is small in magnitude and can be either negative or positive, respectively, for small and large values of the vesicle fusion rate αV. Its temporal behavior is described by an exponential function with a time constant τcorr = 205 msec for αV = 0.374, and τcorr = 535 msec for αV = 0.114. The autocorrelation function of the number of available vesicles N has the same exponential time course, but is always positive, for all αV values (Fig. 4C,D).
Fig. 4.

Temporal correlations of the release events in the steady state. A, Autocorrelation function of the release event sequence for p0 = 0.95 (αV = 0.374). B, Autocorrelation function for p0 = 0.6 (αV = 0.114). Parameters are N0 = 8, τD = 2 sec. Stimulation rate is r = 15 Hz. C, D, Autocorrelation function for the number of available vesicles. Parameters in C and D are the same as in A and B, respectively. Filled circles mark simulation results; solid curves are exponential fits with τcorr = 205 msec forA and C, and τcorr = 535 msec for B and D.
The dependence of the temporal correlation on the vesicle fusion rate αV is shown in Figure 5. Consistent with Figure 4A, the correlation between release events at two consecutive stimuli, G1 = P(ςn+1 = 1‖ςn = 1) − 〈pr〉ss, changes sign from negative to positive as αV is increased (Fig.5A). Therefore, with a small αV, if there is already a release at stimulus n, the release probability at the next stimulus P(ςn+1 = 1‖ςn = 1) is smaller than the average release probability 〈pr〉ss, because of the loss of a vesicle. With a large αV, however, the conditional release probability P(ςn+1 = 1‖ςn = 1) becomes larger than 〈pr〉ss, despite the vesicle release at stimulus n. Similarly, the correlation coefficient for the two consecutive inter-release intervals (Fig.5B) (see Eq. 8 for definition) is negative for small αV values and becomes positive for larger αV values.
Fig. 5.
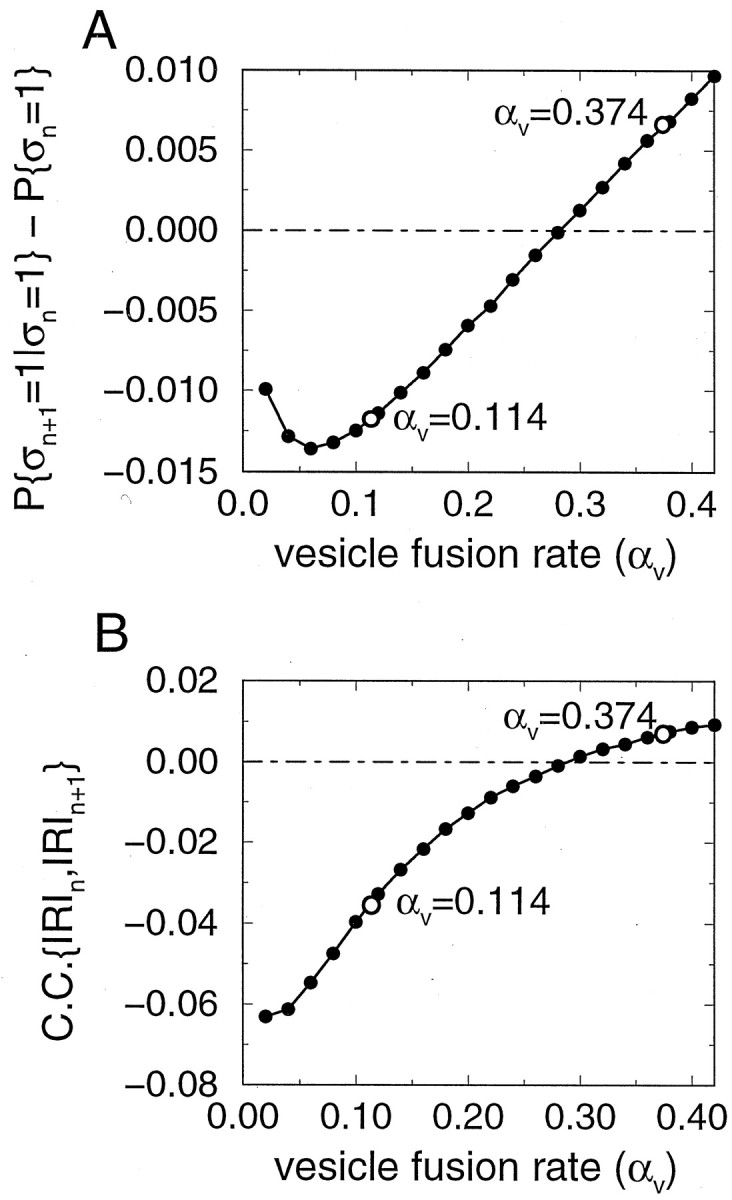
The sign of the steady-state temporal correlation depends on the vesicle fusion rate αV. A,Correlation between successive release events, as a function of αV. B, Coefficient of correlation between successive inter-release intervals as a function of αV. Both quantities become positive as αV is increased. Parameters are N0 = 8, τD = 2 sec, r = 15 Hz. Open circles mark points corresponding to αV values in Figure 4.
The value of αV should be fairly large in the depression case, because the initial release probability p0= 1 − exp(−αVN0) is large. Therefore, for our nonlinear synapse model with the univesicular release constraint, the autocorrelation function of the synaptic output is expected to be positive in general. By contrast, for the linearized version of the model where pr depends linearly on N, the correlation between successive responses can be found analytically and turns out to be always negative, regardless of parameter choices (see Eq. 20 in Appendix ). Temporal correlations are also negative if multiple releases are allowed (see below).
Strong paired-pulse depression and the all-or-none hypothesis
Univesicular release model
Although the response of the synapse model shown in Figure2B agrees well with typical depressing synaptic responses recorded experimentally, the univesicular release model cannot reproduce the strong paired-pulse depression (PPD <50–60%, where paired-pulse depression is defined as the ratio between responses to the second and first pulses: PPD ≡ p2/p1), which has been observed in some experiments on cortical synapses (Fig.6) (Debanne et al., 1996;Markram and Tsodyks, 1996; Thomson, 1997;Varela et al., 1997; Brenowitz et al., 1998; Wang and Lambert, 1998). Intuitively, if the synapse initially has N0 exocytosis-ready vesicles, and if at most one vesicle is released at the first stimulus, there are still (N0 − 1) vesicles available on the arrival of the second stimulus, and PPD by vesicle depletion alone cannot be less than (N0 − 1)/N0. For example, even if N0is as small as 3, the response to the second stimulus cannot be <2/3 = 67% of the response to the first stimulus. More precisely, we can show that:
| Equation 10 |
where the lower bound (N0 − 1)/N0 can be reached only on the assumption of linear dependence of release probability on the vesicle pool size (pr(N) = αVN). This constraint on paired-pulse depression attributable to depletion has been demonstrated earlier by Faber (1998). If the initial release probability is high (with a large vesicle fusion rate αV), the difference between pr(N0) and pr(N0 − 1) is even smaller, because of the nonlinear dependence of pr on N (Eq. 1).
Fig. 6.
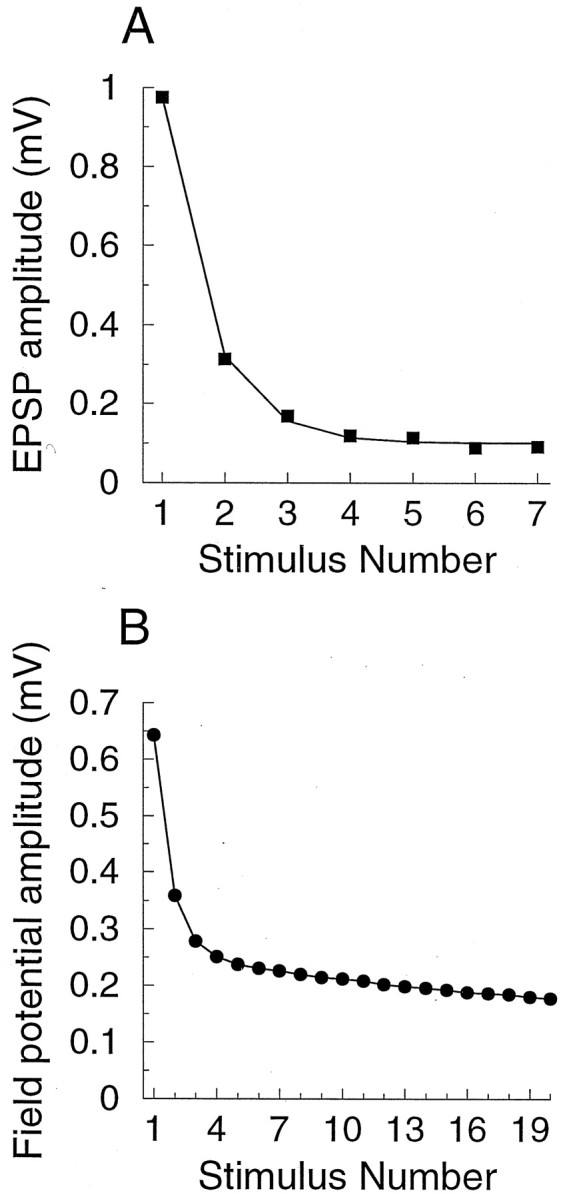
Examples of short-term depression at cortical synapses. A, Post-synaptic response to 20 Hz stimulation in rat layer 5 neocortical pyramidal neuron in slice, dual-cellular recording by Markram and Tsodyks (1996, their Fig. 2B). B, Amplitude of the field-potential response to 5 Hz stimulation of layer 4 recorded in layer 2/3 of rat visual cortex in slice. Figure was redrawn from Varela et al. (1997, their Fig. 4C).
Therefore, additional factors are likely to be involved in the generation of the strong paired-pulse depression.
Two-step exocytosis model
We considered the possibility that the effective number of readily releasable vesicles per active zone is limited to just one. This naturally leads to the univesicular release constraint, without assuming presynaptic lateral inhibition.
Suppose that there is a heterogeneity in the fusion rate αV for individual vesicles. Vesicles with high values of αV would be depleted first, and subsequent stimuli can only release vesicles with a low αV, leading to response depression. However, the strong PPD of Figure6A,B can be reproduced only if among all available vesicles only one vesicle has a large αV, because PPD = 50% can be barely achieved even with N0 = 2 in the homogeneous case (Eq. 10). The possibility that only one vesicle per release site has a high fusion probability needs to be substantiated by a biological mechanism that would select a single vesicle out of the total “docked” vesicle pool. We implemented such a constraint through an assumption that the pool of vesicles docked at the presynaptic membrane is divided into several subpopulations that are in different stages of readiness for release, in accordance with the multistage nature of exocytosis (Neher and Zucker, 1993; Südhof, 1995). In our extended model, exocytosis is represented by a two-stage process; vesicles in the intermediate state are assumed to be docked at the presynaptic membrane but have not yet undergone “priming” (Bittner and Holz, 1992; Xu et al., 1998) for release (Fig.7A). Exchange between the two stages is a reversible process and follows first-order kinetics, with rate constants k− = 1/τ−and k+ = 1/τ+. Now the number of vesicles immediately available for release is determined by the dynamic equilibrium between two stages in vesicles kinetics. With a sufficiently low priming rate k+, the number of vesicles in the release-ready (“primed”) state can have an average close to one. Figure 7B shows the simulations results for this extended version of the model. For the parameters chosen, average number of vesicles in the primed state at rest is 〈NP〉 = 1, which makes possible a 50% reduction of response after a single pulse.
Fig. 7.

The two-step model of vesicle release.A, Model kinetics. Vesicles undergo “priming” before becoming available for release. Priming rate 1/τ+ is slower than the reverse rate 1/τ−, such that on average there is only one vesicle in the immediately releasable pool.B, Depression time course in response to a 30 Hz stimulation for the two-step synapse model. Parameter values are N0 = 6, τD = 2 sec, τ+ = 1.5 sec, τ− = 0.3 sec, αV = 4.6. Notice sharp depression of response after a single stimulus.
We note that in this scenario for the all-or-none response, although there is only one primed vesicle on average, the release probability depends nonlinearly on the docked vesicle pool size N0. Indeed, the number of primed vesicles is distributed according to a binomial with parameters n = N0 and p = k+/(k+ + k−). The probability of having zero primed vesicles is (1 − p)N0, which sets a lower bound for the probability of transmission failure because no release is possible without a primed vesicle. Therefore, the release probability is expected to behave like 1 − (1 − p)N0, consistent with the experimental data (Dobrunz and Stevens, 1997). On the other hand, this scenario has a few limitations. First, even if the number of vesicles released is typically zero or one, more than one vesicle can be released in individual trials. This is because the number of the primed vesicles NP is a random quantity and fluctuates in time. Second, and more importantly, in this scenario the initial release probability is limited. If the probability of having only one vesicle in the primed pool is high, so must be the probability of having zero primed vesicles [equal to (1 − p)N0], leading to a high failure rate. For example, if N0 × p ∼ 1, and N0 = 6, then p ∼ 1/N0 = 0.17, and the probability of having zero primed vesicle (1 − p)N0 = 0.33. Therefore, the failure probability is at least 0.33, and the initial release probability must be smaller than 1 − 0.33 = 0.67.
Unconstrained release model
We have shown above that the univesicular release constraint leads to a limit on the amount of depression that can result from vesicle depletion. It can be argued then that the strong paired-pulse depression observed experimentally represents evidence against the univesicular release constraint and that the saturation of postsynaptic receptors by neurotransmitter released by a single vesicle is a possible explanation of the all-or-none nature of synaptic responses (Jack et al., 1981; Tong and Jahr, 1994;Auger et al., 1998). Here we show that this is not the case and that with synaptic saturation, depletion-induced depression is limited as well.
When multiple releases are allowed, the magnitude of PPD depends critically on the degree of saturation of postsynaptic receptors by transmitter content of a single vesicle. Intuitively, the higher is the saturation, the less difference there is between the first response caused by the release of several vesicles and the second response caused by the release of a smaller number of vesicles, and therefore the smaller should be the PPD effect. Conversely, if postsynaptic receptors are far from saturation, synaptic response will be proportional to the number of released vesicles, and depression by vesicle depletion can be more pronounced.
Simulation results are shown in Figure8. We see that PPD can indeed be very strong, under the condition that pV is large and there is little saturation (small ω). We can derive an analytical expression for the PPD magnitude when the inter-stimulus interval is much shorter than τD, so that the refill between stimuli can be neglected. In this case PPD is given by (Appendix , Eq. 22):
| Equation 11 |
In agreement with the simulation results of Figure 8, it follows from this formula that with unconstrained release PPD can be made arbitrarily strong for any N0 by choosing a sufficiently large pV. With a large pV, however, the failure probability pf = (1 − pV)N0 may become too small and incompatible with the measurements from cortical synapses. For example, if we impose a reasonable value for the failure probability, say pf = 0.1, then If we require further that saturation of postsynaptic receptors is high (ω = 1), to reconcile with the putative all-or-none response, from Equation 11 we have PPD = 75%, i.e., only a moderate amount of PPD. Even if synapses are assumed to be far from saturation, with ω = 0.4 (Liu et al., 1999), then PPD = 63%, which is still not quite as strong as in Figure 6A,B(PPD < 50%).
Fig. 8.
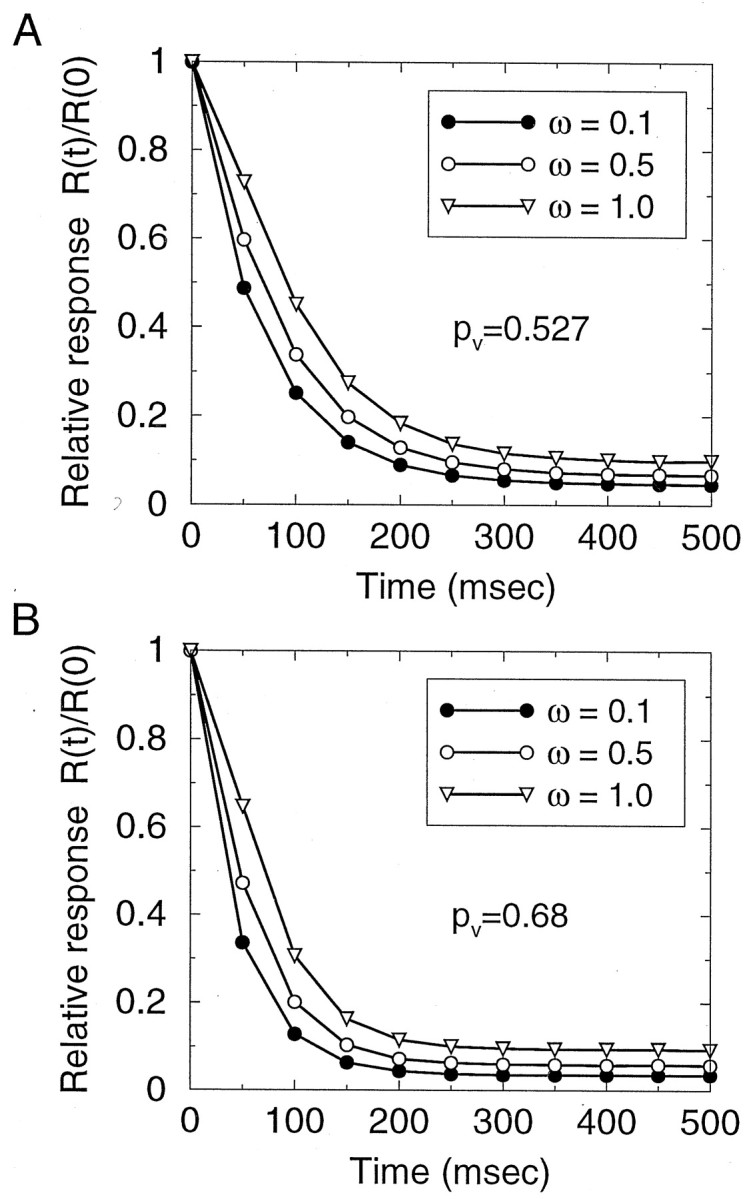
Behavior of the synapse model with unconstrained vesicle release. A, B, Response time courses for different values of the receptor saturation factor ω (between 0 and 1) specifying the degree to which postsynaptic receptors are saturated by neurotransmitter from a single vesicle. Response is measured by the average number of vesicles released and is normalized by initial response. Failure rate is 5% in A, and 1% inB. Other synaptic parameter are N0 = 4, τD = 2 sec. Stimulation rate is 15 Hz.
In Figure 9 is shown the correlation between successive synaptic release events in response to a constant-frequency spike train, in the steady state. In contrast to the case of the univesicular release constraint (Fig. 5), temporal correlation is always negative with multivesicular (unconstrained) release. In this case correlation is negative for all values of the single-vesicle release probability (pV) and regardless of the magnitude of the postsynaptic receptor occupancy factor ω. These contrasting results suggest that, in principle, the sign of the correlation between successive responses in the steady state can be used to assess whether the dependence of the release probability on the number of available vesicles is linear or nonlinear, as a test of the univesicular release hypothesis.
Fig. 9.

Temporal correlation of synaptic response is negative with unconstrained vesicle release. Correlation coefficient between the responses to two consecutive stimuli of a constant frequency stimulation train, as a function of the single-vesicle release probability, for two values of ω. Unlike in the case of the univesicular constraint (Fig. 5), here the correlation is always negative.
To conclude, although very strong PPD can in principle be achieved with multivesicular release, this scenario would require a physiologically implausible low failure probability, or postsynaptic receptors must be far from saturation, which would be inconsistent with the all-or-none synaptic response. Therefore, observation of strong PPD at cortical synapses cannot be used as an argument against the univesicular release constraint.
Depression beyond vesicle depletion
Above results suggest that the “fast” component of synaptic depression demonstrated in Figure 6 cannot be explained by vesicle depletion and that additional mechanisms are likely to be involved. We have focused on the following two possible scenarios.
Presynaptic metabotropic inhibition
Presynaptic inhibition by metabotropic receptors represents an important form of modulation of synaptic transmission. Metabotropic autoreceptors are activated by neurotransmitter released at the same nerve terminal and act through inhibition of presynaptic Ca2+ currents (Wu and Saggau, 1997), leading to a special form of short-term synaptic plasticity. Such plasticity mechanism has been observed at GABAergic synapses in rat hippocampus by Davies and Collingridge (1990,Davies and Collingridge, 1993), where activation of presynaptic GABAB receptors was shown to be responsible for the short-term depression of evoked inhibitory currents [also see Deisz and Prince (1989)]. Similar effect has been observed at glutamatergic mossy fiber hippocampal synapses of guinea pigs by Scanziani et al. (1997), with depression resulting from the recruitment of presynaptic metabotropic glutamate autoreceptors [also see Forsythe and Clements (1990);Baskys and Malenka (1991)].
We study the effect of metabotropic inhibition by introducing into our model a release-dependent negative feedback process, mimicking the presynaptic inhibition mediated by metabotropic autoreceptors (see Materials and Methods for description). With an appropriate choice of parameters, the extended model successfully reproduces the characteristic U-like dependence of paired-pulse depression on the inter-pulse interval duration observed experimentally by Davies and Collingridge (1993) (Fig.10A). Maximal depression occurs for inter-pulse intervals between 100 msec and 1 sec, corresponding to stimulation frequencies of 1–10 Hz; in this range more than twofold reduction of response is obtained. Time course of synaptic response to a periodic 5 Hz stimulation is demonstrated in Figure 10B. Here we assumed that release is univesicular; results would be similar for the model with unconstrained release.
Interestingly, this mechanism leads to a reduction of saturation of the postsynaptic steady-state response at high stimulation rates, thereby increasing the dynamic range of the synapse (Fig. 10C,D). This arises because metabotropic inhibition acts as a negative feedback to vesicle release, slowing depletion of the vesicle pool at high stimulation frequencies, and thus increasing the range over which the postsynaptic response depends on presynaptic firing rate. Consequently, if a synapse shows saturation of the steady-state response at relatively low stimulation frequencies (Abbott et al., 1997; Tsodyks and Markram, 1997; Markram et al., 1998), then its presynaptic modulation mediated by metabotropic receptors is likely small. Metabotropic autoinhibition most probably occurs at particular classes of synapses only; in some studies antagonists of metabotropic glutamate receptors were shown to have no effect on plasticity dynamics of cortical synapses (Dobrunz and Stevens, 1997).
Inactivation of release machinery
Strong PPD may also occur as a result of some activity-dependent inhibition of vesicle release machinery itself, for instance through a Ca2+-dependent inactivation of exocytosis. Experimental evidence for such a mechanism comes from the work ofHsu et al. (1996), who found that transmitter release at the squid giant synapse triggered by introduction of Ca2+ into the terminal declines rapidly, even while the Ca2+ concentration is maintained at a constant level. When Ca2+ concentration was elevated by caged-Ca2+ buffer photolysis in a stepwise manner, transmitter release occurred only transiently after each concentration increase. Hsu et al. (1996) proposed that the exocytosis-controlling molecular gates may undergo Ca2+-driven transitions between active states triggering vesicle release and inactive conformational states.
We implemented such a mechanism by introducing into our model a simple kinetic scheme where the release apparatus of each vesicle is controlled by a gate that can be in one of the three states (Fig.11A). Release can happen only when the gate is in the F (“fusion”) state, so the vesicle fusion rate αV is multiplied by the fraction of gates that are in the F state at the time of arrival of a spike. In the absence of stimulation, release gates are in the R (“rest”) state; transitions between the R and F states and between F and I (“inactivated”) states occur only during an incoming action potential, presumably through binding of a Ca2+ ion. Unless the interval between two consecutive spikes is much larger than the time constant of recovery from inactivation τr, a fraction of gates inactivated during the first spike will remain inactive at the time of arrival of the second spike, leading to short-term depression of response. Although this model is too simple to reproduce the exact adaptation of response observed by Hsu et al. (1996), it captures the basic characteristics of the process. A similar model has been proposed by Yamada and Zucker (1992) to explain the invariance of the time course of exocytosis with varying Ca2+ influx. We assumed here the univesicular release constraint; results would not be significantly different for the unconstrained case with high receptor saturation.
Fig. 11.
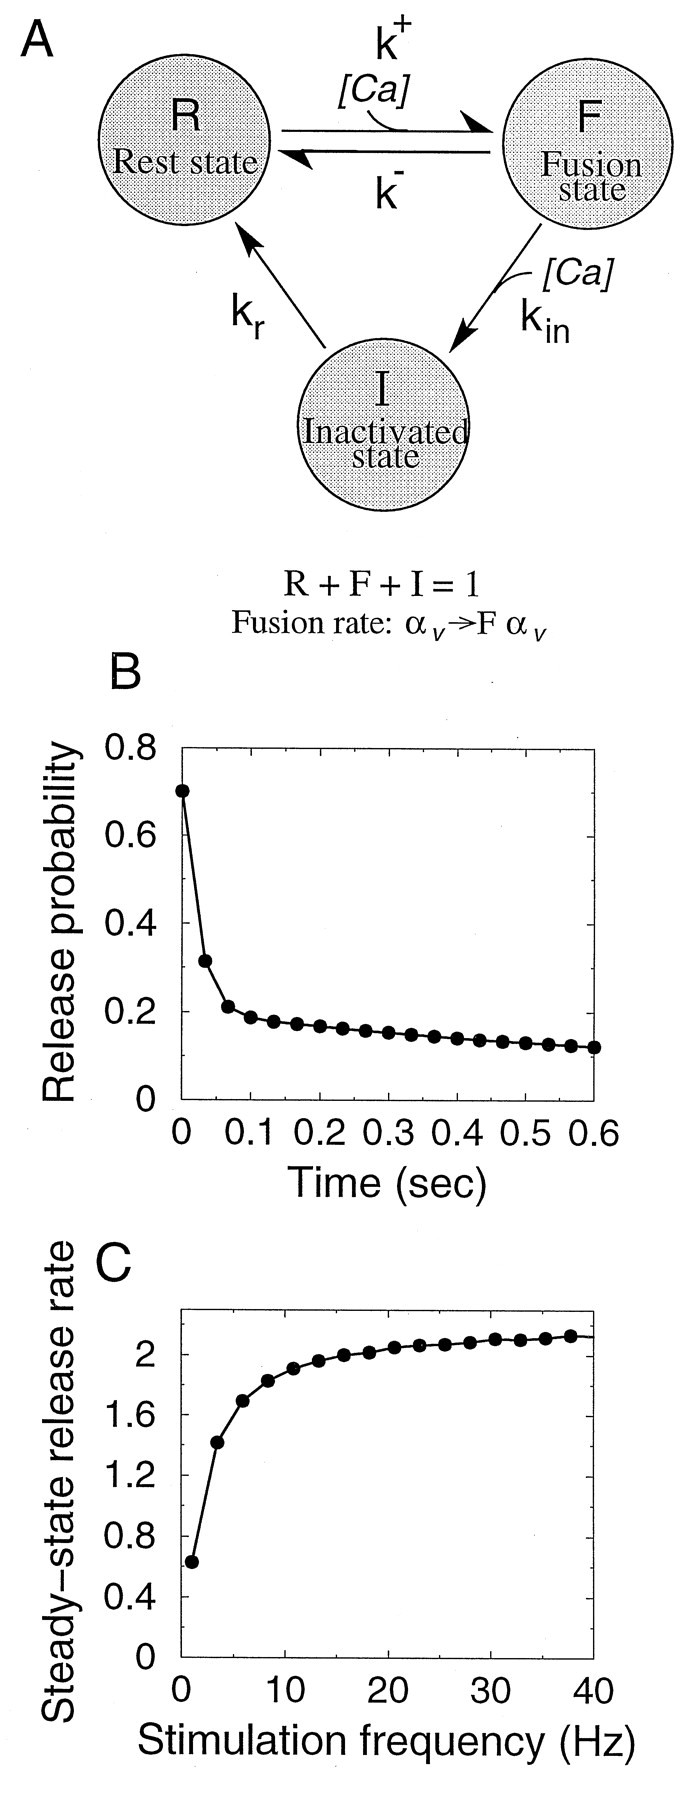
Inactivation of release machinery. A,Kinetic scheme for the model. A “gate” controlling vesicle release can be in one of the three states shown in the figure. With no stimulation, gates are predominantly in the R (rest) state. With stimulation, transition to the F (fusion) state takes place, leading to vesicle release. At the same time, quick transition from the F state to the inactive I state takes place, halting exocytosis. Internal Ca2+ is assumed to be an instantaneous function of presynaptic voltage, so Ca2+-driven transitions only occur during the brief time of stimulus arrival. B, Response time course for the release inactivation model with 30 Hz stimulation. Parameters are N0 = 6, τD = 2 sec, p0 = 0.7, k+ = 16.8 sec−1 μm−1, k− = 333 sec−1, kin = 15 sec−1μm−1, kr = 5 s−1, [Ca2+]pulse = 100 μm, Δtpulse = 2 msec. Note the biphasic time course, the sharp paired-pulse depression followed by a slower deay process. C, Steady state response rate as a function of the stimulation frequency, reaching saturation at ∼20 Hz.
With a high degree of the release machinery inactivation, the model displays strong paired-pulse depression similar to the data from cortical synapses (Fig. 11B). Note that depression now proceeds in two phases (Fig. 11B), the fast initial phase being followed by a slower phase of smaller magnitude. This behavior agrees better with the response time courses observed experimentally (Fig. 6B). Moreover, the steady-state response rate saturates at moderate stimulation frequencies (∼20 Hz) (Fig. 11C).
An interesting feature of this model is that it naturally incorporates a facilitation mechanism, in the case where inactivation is weak. For a sufficiently small inactivation rate kin, the fraction of gates in the F state will increase during the first several action potentials in a spike train. If the rest-state magnitude of the vesicle fusion rate αV is small, this would lead to facilitation of response.
DISCUSSION
We have presented a stochastic model of short-term synaptic dynamics that includes a vesicle turnover process, with the constraint that at most one vesicle can be released per stimulus (Edwards et al., 1976a, Edwards et al., 1976b; Korn et al., 1982; Redman and Walmsley, 1983; Gulyás et al., 1993;Arancio et al., 1994; Stevens and Wang, 1995; Silver et al., 1996; Dobrunz and Stevens, 1997; Somogyi et al., 1998;Walmsley et al., 1998). The univesicular release hypothesis represents a central tenet of cortical synaptic physiology, yet its validity remains a matter of debate. Here we found that this constraint has several experimentally observable implications for the dynamic responses of synapses. Our main results are twofold. First, the strong paired-pulse depression observed at some cortical synapses is unlikely to result from vesicle depletion alone and instead may be caused by activity-dependent inactivation of the exocytosis machinery itself. Second, univesicular and multivesicular release lead to different temporal statistics of release events in response to a long train of stimuli, suggesting an experimentally testable prediction for the univesicular release hypothesis.
Synaptic depression beyond vesicle depletion
We found that the all-or-none character of synaptic transmission implies a limitation on synaptic paired-pulse depression. With the univesicular release constraint realized by lateral inhibition across presynaptic membrane (Korn et al., 1994), vesicle depletion is limited to at most one per spike. Although vesicle depletion may be accelerated by multivesicular release, its effect is small if postsynaptic receptors are saturated by transmitter content of a single vesicle (Tong and Jahr, 1994; Auger et al., 1998); on the other hand, the all-or-none response cannot be realized if postsynaptic receptors are far from saturation (Liu et al., 1999). In both cases, if the all-or-none response is assumed, vesicle depletion alone cannot explain the strong paired-pulse depression observed at neocortical synapses (Fig. 6) (Markram and Tsodyks, 1996; Thomson, 1997; Varela et al., 1997; Brenowitz et al., 1998; Wang and Lambert, 1998). We also analyzed the possibility that only one of the docked vesicles is primed and truly release-ready at any time. We found that this scenario is consistent with existing experimental data (such as nonlinear dependence of release probability on the docked vesicle pool size) and can produce strong paired-pulse depression as observed at cortical synapses. However, in our implementation by a two-stage exocytosis scheme, this scenario has the special feature of having a limited transmission probability. It is not known whether the one releasable vesicle constraint can be implemented in other ways, for example by assuming that a single vesicle among all docked vesicles is situated at a privileged presynaptic membrane location. However, in such a structure-based scenario the release probability would be independent of the number of docked vesicles, contrary to experimental evidence (Dobrunz and Stevens, 1997).
Thus, to reconcile the all-or-none transmission with the observations of strong paired-pulse depression, one must allow that depression mechanisms beyond vesicle depletion significantly contribute to paired-pulse depression at central synapses (Faber, 1998). Several presynaptic and postsynaptic mechanisms can be ruled out as potential sources of strong PPD. Postsynaptic receptor desensitization is not likely to cause the dramatic depression of response for stimuli separated by a time interval of 50–200 msec as in Figure 6, because of the fast recovery of AMPA receptors from such desensitization (Colquhoun et al., 1992; Trussell et al., 1993). This is consistent with studies in which short-term plasticity at cortical synapses was shown to be unaffected by desensitization-blocking agents (Debanne et al., 1996; Dobrunz and Stevens, 1997; Varela et al., 1997; Galarreta and Hestrin, 1998;Bellingham and Walmsley, 1999). Moreover, inactivation of presynaptic Ca2+ channels is probably also not important for PPD, because the degree of inactivation caused by a single action potential is at most a few percent (Fox et al., 1987; Lemos and Nowycky, 1989; Cox and Dunlap, 1994;Forsythe et al., 1998; Patil et al., 1998; Wu et al., 1998). However, inactivation of Ca2+ currents can contribute to depression during prolonged high-frequency stimulation (Jia and Nelson, 1986; Forsythe et al., 1998;Patil et al., 1998).
We have explored two factors that may contribute to paired-pulse depression. We found that the model simulating presynaptic inhibition via metabotropic autoreceptors can reproduce strong paired-pulse depression (Fig. 10D), in agreement with experimental evidence (Davies and Collingridge, 1990,Davies and Collingridge, 1993;Scanziani et al., 1997). Activity-dependent inactivation of release machinery represents another mechanism that in our opinion can explain the strong PPD shown in Fig. 6 (Hsu et al., 1996). The version of our model incorporating such inactivation (Fig. 11A) succeeds in reproducing twofold paired-pulse depression (Fig. 11B) and leads to a biphasic response decay, similar to experimentally observed behavior. Our proposed mechanism is supported by recent evidence (Bellingham and Walmsley, 1999) that the depression at the endbulb of Held is caused by reduction of the release probability by intracellular calcium. It is possible that such a mechanism also underlies the strong depression of response observed recently in terminals of retinal bipolar cells by Burrone and Lagnado (1998).
The two depression mechanisms could be differentiated experimentally in several ways. First, presynaptic inhibition by metabotropic autoreceptors is activated by release of vesicles. Release-induced reduction of subsequent synaptic response is generally referred to as refractoriness of a synapse (Betz, 1970; Stevens and Wang, 1995; Thomson and Deuchars, 1995; Dobrunz et al., 1997; Hjelmstad et al., 1997). By contrast, inactivation of the exocytosis machinery is assumed to be induced by stimulation-triggered Ca2+ influx, independent of vesicle release. If paired-pulse depression is release-dependent, responses to a pair of stimuli would be negatively correlated (Thomson and Deuchars, 1995; Faber, 1998). Conversely, no correlation is expected if the depression does not depend on the occurrence of vesicle release. This way, the metabotropic presynaptic inhibition and the inactivation mechanism proposed here could be distinguished experimentally.
Second, previous studies, using linear models of synaptic depression, have reproduced the experimental observation that response rate reaches saturation with increasing rate of presynaptic stimulation (Abbott et al., 1997; Tsodyks and Markram, 1997). Here, we showed that this behavior holds as well for the nonlinear model of vesicle depletion with the univesicular release constraint, and when the inactivation of release machinery is included. By contrast, presynaptic inhibition, although producing strong transient paired-pulse depression, at the same time reduces the amount of saturation in the steady-state response at high stimulation frequencies. This is because metabotropic autoreceptors subserve a negative feedback to vesicle depletion; thereby the dynamical range of the synaptic responsiveness is extended. Therefore, measurement of the steady-state response rate as function of the input frequency could be used to distinguish the two candidate depression mechanisms. Finally, pharmacological means could be used to directly assess the role of specific types of metabotropic autoreceptors at a given synapse.
Univesicular release versus receptor saturation: sign of response autocorrelation
Whether postsynaptic receptors at central synapses are saturated by transmitter content of a single vesicle remains an issue of debate (Tang et al., 1994; Tong and Jahr, 1994;Frerking and Wilson, 1996; Silver et al., 1996; Forti et al., 1997). Recent work suggests that postsynaptic glutamatergic receptors at cortical synapses are generally far from saturation (Liu et al., 1999;Mainen et al., 1999). We found that the univesicular release and receptor saturation scenarios lead to different predictions about the steady-state correlation between synaptic responses to successive spikes in a constant-frequency train. We have demonstrated that for the model with the univesicular release constraint, characterized by nonlinear dependence of release probability on the number of available vesicles, the temporal autocorrelation of the synaptic response to constant-frequency stimulation is expected to be positive if the vesicle fusion rate αV is reasonably large and is negative only with small αV (Figs. 4, 5). This is in contrast with the behavior of the model where the dependence of synaptic response on the number of available vesicles is linear, in which case the correlation between successive release events is always negative, both for the model with unconstrained (multivesicular) release (Fig. 9) and for the linearized version of the constrained model (Appendix , Eq. 20). We note that such temporal correlation does not require stimulation of single synaptic connections and could be deduced from measurements with multiple synaptic contacts. Because release events at different synapses are statistically independent, the temporal autocorrelation of the postsynaptic response will be equal to the sum of correlations of responses of individual synapses. Furthermore, these results concerning the sign of the temporal correlation are still applicable if additional activity-dependent processes such as synaptic facilitation (Fisher et al., 1997) and increase in the docking rate (Hubbard, 1963; Elmqvist and Quastel, 1964; Dittman and Regehr, 1998; Stevens and Wesseling, 1998;Wang and Kaczmarek, 1998) are taken into account because in the steady state, parameters affected by these processes will have reached some constant stationary values. For example, in a scenario in which the synaptic vesicle fusion rate αV is low initially but increases with stimulation as a result of facilitation, the steady-state value of αV will be large, so the correlation between successive responses is expected to be negative in the case of unconstrained release and positive in the case of univesicular (constrained) release, allowing one to distinguish between these two possibilities. In any event, the general suggestion is that measurement of the temporal correlations in the responses to a long train of stimuli may be used to test the univesicular release hypothesis, a basic notion in cortical synaptic physiology.
Steady-state response for a general one-pool synapse model
For a constant-frequency stimulation of rate r, there is a simple relationship connecting the average synaptic response and the average number of available vesicles in the stationary state, valid for a general single-pool vesicle release model with first-order recovery kinetics. Let 〈N〉ss = 〈N(ti−)〉ss denote the average number of available vesicles immediately before arrival of a spike and 〈ΔN〉ss denote the average number of vesicles released in the steady state in response to a single stimulus. Then the average number of vesicles that are unavailable immediately after a spike is equal to {N0 − (〈N〉ss − 〈ΔN〉ss)}. Multiplying this number by the probability for a vesicle pool vacancy to be refilled during one inter-spike interval, we obtain an average for the number of vesicles refilled between two spikes, which in the steady state must be equal to the average number of vesicles released:
| Equation 12 |
Solving this equation, we obtain the following linear relationship between the average number of vesicles released and the average number of available vesicles:
| Equation 13 |
This result is valid both for the model with the univesicular release constraint and for the unconstrained model where multivesicular release is allowed. At high rates we can expand the exponent in the above expression; taking into account that 〈N(r)〉ss approaches zero with increasing rate because of depletion, we get:
| Equation 14 |
Thus, at high firing rates stationary synaptic response depend only on the refill time constant τD and the maximal vesicle pool size N0, and decreases as the inverse of rate. In the model where only one release per action potential is allowed, average number of vesicles released is equal to the average release probability, and 〈ΔN〉ss can be replaced with 〈pr〉ss in Equations 13-14. According to Equation 14, 〈pr〉ssdoes not depend on vesicle fusion rate αV at high stimulation frequencies. This result is not specific to constant-frequency stimulation and holds in the case of arbitrary stationary stimulation pattern of average rate r.
Linearized one-pool model: temporal correlation
If one assumes linear dependence of release probability on the number of vesicles, then pr(N) = αVN (the constraint of at most one release per action potential is maintained), and this linearized model can be obtained as a limiting case from the initial nonlinear model (pr)(N) = 1 − exp (−αVN)) for αVN ≪ 1. In that case, certain statistical characteristics of the model's response to constant-frequency presynaptic stimulation can be calculated analytically, using mathematical theory of stochastic processes (van Kampen, 1981).
For input stimulation rate of r = 1/Δt, the average number of available vesicles in the steady state 〈N〉ss (measured immediately before each of the pulses) is given by:
| Equation 15 |
The corresponding steady-state release probability is equal to 〈pr〉ss = αV〈N〉ss. The above expression can be found (in different notations) in Abbott et al. (1997) and Tsodyks and Markram (1997).
The time course of response is exponential and is given by:
| Equation 16 |
where N(tn−) denotes the number of vesicles immediately before the n th spike, and the response decay time constant is:
| Equation 17 |
Equation 16 is equivalent to the expression found inTsodyks and Markram (1997), with the substitutions N0 → E, αV → USE, τD → τrec.
The time constant given by Equation 17 also determines the decay of the temporal autocorrelation for the numbers of available vesicles in the stationary state:
| Equation 18 |
where the steady-state variance of the number of available vesicles N is equal to:
| Equation 19 |
However, the correlation characteristic that can be measured experimentally is the correlation between release events (see definition, Eq. 7):
| Equation 20 |
The above expression reveals that the correlation between release events is always negative, unlike in the case of the nonlinear model (Figs. 4, 5). Note that the correlation for the number of available vesicles (Eq. 18) is always positive.
Paired-pulse depression for the unconstrained model
Let R denote the response produced when all postsynaptic receptors are activated, and let ω represent the fraction of receptors that are bound by neurotransmitter after the release of a single vesicle. Then the response produced by the release of n vesicles is given by R[1 − (1 − ω)n] (Auger et al., 1998), and the average response given N available vesicles is E1(N) = R[1 − (1 − pVω)N] (Eq. (2). Response to the first pulse in a paired-pulse stimulus is then E1(N0); if we can neglect vesicle refill between two consecutive pulses (inter-pulse interval Δt ≪ τD), we can obtain an expression for the average response produced by the second pulse:
| Equation 21 |
where P(k) is the probability of release of k out of N0 vesicles, given by a binomial with parameters n = N0 and p = pV. This yields a simple expression for the magnitude of paired-pulse depression:
| Equation 22 |
Analysis of the above formula shows that paired-pulse depression is a monotonically increasing function of ω in the entire range 0 ≤ ω ≤ 1. This is to be expected, because maximal depression (minimal PPD ratio) is achieved when postsynaptic receptors are far from saturation (ω close to zero).
Footnotes
This work was supported by the Alfred P. Sloan Foundation and National Institute of Mental Health Grant MH53717-01. We thank Larry Abbott, Sacha Nelson, Venkatesh Murthy, and Charles Stevens for useful comments and helpful discussions.
Correspondence should be addressed to Xiao-Jing Wang, Volen Center for Complex Systems and Physics Department, Brandeis University, Waltham, MA 02454. E-mail: victor@ariel.ccs.brandeis.edu;xjwang@volen.brandeis.edu.
REFERENCES
- 1.Abbott LF, Varela JA, Sen K, Nelson SB. Synaptic depression and cortical gain control. Science. 1997;275:220–224. doi: 10.1126/science.275.5297.221. [DOI] [PubMed] [Google Scholar]
- 2.Arancio O, Korn H, Gulyas A, Freund T, Miles R. Excitatory synaptic connections onto rat hippocampal inhibitory cells may involve a single transmitter release site. J Physiol (Lond) 1994;481:395–405. doi: 10.1113/jphysiol.1994.sp020448. [DOI] [PMC free article] [PubMed] [Google Scholar]
- 3.Auger C, Kondo S, Marty A. Multivesicular release at single functional synaptic sites in cerebellar stellate and basket cells. J Neurosci. 1998;18:4532–4547. doi: 10.1523/JNEUROSCI.18-12-04532.1998. [DOI] [PMC free article] [PubMed] [Google Scholar]
- 4.Baskys A, Malenka RC. Agonists at metabotropic glutamate receptors presynaptically inhibit EPSCs in neonatal rat hippocampus. J Physiol (Lond) 1991;444:687–701. doi: 10.1113/jphysiol.1991.sp018901. [DOI] [PMC free article] [PubMed] [Google Scholar]
- 5.Bekkers JM, Stevens CF. Presynaptic mechanism for long-term potentiation in the hippocampus. Nature. 1990;346:724–729. doi: 10.1038/346724a0. [DOI] [PubMed] [Google Scholar]
- 6.Bellingham MC, Walmsley B. A novel presynaptic inhibitory mechanism underlies paired pulse depression at a fast central synapse. Neuron. 1999;23:159–170. doi: 10.1016/s0896-6273(00)80762-x. [DOI] [PubMed] [Google Scholar]
- 7.Betz WJ. Depression of transmitter release at the neuromuscular junction of the frog. J Physiol (Lond) 1970;206:629–644. doi: 10.1113/jphysiol.1970.sp009034. [DOI] [PMC free article] [PubMed] [Google Scholar]
- 8.Bittner MA, Holz RW. Kinetic analysis of secretion from permeabilized adrenal chromaffin cells reveals distinct components. J Biol Chem. 1992;267:16219–16225. [PubMed] [Google Scholar]
- 9.Brenowitz S, David J, Trussell L. Enhancement of synaptic efficacy by presynaptic GABA(B) receptors. Neuron. 1998;20:135–141. doi: 10.1016/s0896-6273(00)80441-9. [DOI] [PubMed] [Google Scholar]
- 10.Burrone J, Lagnado L. Desensitization of the exocytic machinery contributes to paired-pulse depression in the synaptic terminal of depolarizing bipolar cells. J Physiol (Lond) Proceedings. 1998;513.P:31P. [Google Scholar]
- 11.Colquhoun D, Jonas P, Sakmann B. Action of brief pulses of glutamate on AMPA/kainate receptors in patches from different neurones of rat hippocampal slices. J Physiol (Lond) 1992;458:261–287. doi: 10.1113/jphysiol.1992.sp019417. [DOI] [PMC free article] [PubMed] [Google Scholar]
- 12.Cox DH, Dunlap K. Inactivation of N-type calcium current in chick sensory neurons: calcium and voltage dependence. J Gen Physiol. 1994;104:311–336. doi: 10.1085/jgp.104.2.311. [DOI] [PMC free article] [PubMed] [Google Scholar]
- 13.Davies CH, Collingridge L. Paired-pulse depression of monosynaptic GABA-mediated inhibitory postsynaptic responses in rat hippocampus. J Physiol (Lond) 1990;424:513–531. doi: 10.1113/jphysiol.1990.sp018080. [DOI] [PMC free article] [PubMed] [Google Scholar]
- 14.Davies CH, Collingridge L. The physiological regulation of synaptic inhibition by GABAB autoreceptors in rat hippocampus. J Physiol (Lond) 1993;472:245–265. doi: 10.1113/jphysiol.1993.sp019945. [DOI] [PMC free article] [PubMed] [Google Scholar]
- 15.Debanne D, Guérineau NC, Gähwiler BH, Thompson SM. Paired-pulse facilitation and depression at unitary synapses in rat hippocampus: quantal fluctuation affects subsequent release. J Physiol (Lond) 1996;491:163–176. doi: 10.1113/jphysiol.1996.sp021204. [DOI] [PMC free article] [PubMed] [Google Scholar]
- 16.Deisz RA, Prince DA. Frequency-dependent depression of inhibition in guinea-pig neocortex in vitro by GABAB receptor feed-back on GABA release. J Physiol (Lond) 1989;412:513–541. doi: 10.1113/jphysiol.1989.sp017629. [DOI] [PMC free article] [PubMed] [Google Scholar]
- 17.Dittman JS, Regehr WG. Calcium dependence and recovery kinetics of presynaptic depression at the climbing fiber to Purkinje cell synapse. J Neurosci. 1998;18:6147–6162. doi: 10.1523/JNEUROSCI.18-16-06147.1998. [DOI] [PMC free article] [PubMed] [Google Scholar]
- 18.Dobrunz LE, Stevens CF. Heterogeneity of release probability, facilitation, and depletion at central synapses. Neuron. 1997;18:995–1008. doi: 10.1016/s0896-6273(00)80338-4. [DOI] [PubMed] [Google Scholar]
- 19.Dobrunz LE, Huang EP, Stevens CF. Very short-term plasticity in hippocampal synapses. Proc Natl Acad Sci USA. 1997;94:14843–14847. doi: 10.1073/pnas.94.26.14843. [DOI] [PMC free article] [PubMed] [Google Scholar]
- 20.Edwards FA, Konnerth A, Sakmann B. Quantal analysis of inhibitory synaptic transmission in the dentate gyrus of rat hippocampal slices: a patch-clamp study. J Physiol (Lond) 1990;430:213–249. doi: 10.1113/jphysiol.1990.sp018289. [DOI] [PMC free article] [PubMed] [Google Scholar]
- 21.Edwards FR, Redman SJ, Walmsley B. Statistical fluctuations in charge transfer at 1a synapses on spinal motoneurones. J Physiol (Lond) 1976a;259:665–688. doi: 10.1113/jphysiol.1976.sp011488. [DOI] [PMC free article] [PubMed] [Google Scholar]
- 22.Edwards FR, Redman SJ, Walmsley B. Non-quantal fluctuations and transmission failures in charge in charge transfer at 1a synapses on spinal motoneurones. J Physiol (Lond) 1976b;259:689–704. doi: 10.1113/jphysiol.1976.sp011489. [DOI] [PMC free article] [PubMed] [Google Scholar]
- 23.Elmqvist D, Quastel DMJ. A quantitative study of end-plate potentials in isolated human muscle. J Physiol (Lond) 1964;178:505–529. doi: 10.1113/jphysiol.1965.sp007639. [DOI] [PMC free article] [PubMed] [Google Scholar]
- 24.Faber DS. Synaptic depression at an identified central synapse: evidence for different constraints on evoked and spontaneous quanta. In: Faber DS, Korn H, Redman SJ, Thomson SM, Altman JS, editors. Central synapses: quantal mechanisms and plasticity. Human Frontier Science Program; Strasbourg: 1998. pp. 158–167. [Google Scholar]
- 25.Fisher SA, Fischer TM, Carew TJ. Multiple overlapping processes underlying short-term synaptic enhancement. Trends Neurosci. 1997;20:170–177. doi: 10.1016/s0166-2236(96)01001-6. [DOI] [PubMed] [Google Scholar]
- 26.Forti L, Bossi M, Bergamaschi A, Villa A, Malgaroli A. Loose-patch recordings of single quanta at individual hippocampal synapses. Nature. 1997;388:874–878. doi: 10.1038/42251. [DOI] [PubMed] [Google Scholar]
- 27.Forsythe ID, Clements JD. Presynaptic glutamate receptors depress excitatory monosynaptic transmission between mouse hippocampal neurones. J Physiol (Lond) 1990;429:11–16. doi: 10.1113/jphysiol.1990.sp018240. [DOI] [PMC free article] [PubMed] [Google Scholar]
- 28.Forsythe ID, Tsujimoto T, Barnes-Davies M, Cuttle MF, Takahashi T. Inactivation of presynaptic calcium current contributes to synaptic depression at a fast central synapse. Neuron. 1998;20:797–807. doi: 10.1016/s0896-6273(00)81017-x. [DOI] [PubMed] [Google Scholar]
- 29.Fox AP, Nowycky MC, Tsien RW. Kinetic and pharmacological properties distinguishing three types of calcium currents in chick sensory neurons. J Physiol (Lond) 1987;394:149–172. doi: 10.1113/jphysiol.1987.sp016864. [DOI] [PMC free article] [PubMed] [Google Scholar]
- 30.Frerking M, Wilson M. Saturation of postsynaptic receptors at central synapses? Curr Opin Neurobiol. 1996;6:395–403. doi: 10.1016/s0959-4388(96)80125-5. [DOI] [PubMed] [Google Scholar]
- 31.Galarreta M, Hestrin S. Frequency-dependent synaptic depression and the balance of excitation and inhibition in the neocortex. Nat Neurosci. 1998;1:587–594. doi: 10.1038/2822. [DOI] [PubMed] [Google Scholar]
- 32.Gulyás AI, Miles R, Sik A, Toth K, Tamamaki N, Freund TF. Hippocampal pyramidal cells excite inhibitory neurons through a single release site. Nature. 1993;366:683–687. doi: 10.1038/366683a0. [DOI] [PubMed] [Google Scholar]
- 33.Heinemann C, von Ruden L, Chow RH, Neher E. A two-step model of secretion control in neuroendocrine cells. Pflügers Arch. 1993;424:105–112. doi: 10.1007/BF00374600. [DOI] [PubMed] [Google Scholar]
- 34.Hjelmstad GO, Nicoll RA, Malenka RC. Synaptic refractory period provides a measure of probability release in the hippocampus. Neuron. 1997;19:1309–1318. doi: 10.1016/s0896-6273(00)80421-3. [DOI] [PubMed] [Google Scholar]
- 35.Hsu S-F, Augustine GJ, Jackson MB. Adaptation of Ca2+-triggered exocytosis in presynaptic terminals. Neuron. 1996;17:501–512. doi: 10.1016/s0896-6273(00)80182-8. [DOI] [PubMed] [Google Scholar]
- 36.Hubbard JI. Repetitive stimulation at the mammalian neuromuscular junction, and the mobilization of transmitter. J Physiol (Lond) 1963;169:641–662. doi: 10.1113/jphysiol.1963.sp007286. [DOI] [PMC free article] [PubMed] [Google Scholar]
- 37.Jack JJ, Redman SJ, Wong K. The components of synaptic potentials evoked in cat spinal motoneurones by impulses in single group 1a afferents. J Physiol (Lond) 1981;321:65–96. doi: 10.1113/jphysiol.1981.sp013972. [DOI] [PMC free article] [PubMed] [Google Scholar]
- 38.Jia M, Nelson PG. Calcium currents and transmitter output in cultured spinal cord and dorsal root ganglion neurons. J Neurophysiol. 1986;56:1257–1267. doi: 10.1152/jn.1986.56.5.1257. [DOI] [PubMed] [Google Scholar]
- 39.Jones MV, Westbrook GL. The impact of receptor desensitization on fast synaptic transmission. Trends Neurosci. 1996;19:96–101. doi: 10.1016/s0166-2236(96)80037-3. [DOI] [PubMed] [Google Scholar]
- 40.Korn H, Faber DS. Regulation and significance of probabilistic release mechanisms at central synapses. In: Edelman GM, Gall WE, Cowan WM, editors. Synaptic function. Wiley; New York: 1987. pp. 57–108. [Google Scholar]
- 41.Korn H, Faber DS. Quantal analysis and synaptic efficacy in the CNS. Trends Neurosci. 1991;14:439–445. doi: 10.1016/0166-2236(91)90042-s. [DOI] [PubMed] [Google Scholar]
- 42.Korn H, Mallet A, Triller A, Faber DS. Transmission at a central inhibitory synapse. II. Quantal description of release, with a physical correlate for binomial n. J Neurophysiol. 1982;48:679–707. doi: 10.1152/jn.1982.48.3.679. [DOI] [PubMed] [Google Scholar]
- 43.Korn H, Sur C, Charpier S, Legendre P, Faber DS. The one-vesicle hypothesis and multivesicular release. In: Stjärne L, Greengard P, Grillner S, Hökfelt T, Ottoson D, editors. Molecular and cellular Mechanisms of neurotransmitter release. Raven; New York: 1994. pp. 301–322. [DOI] [PubMed] [Google Scholar]
- 44.Lemos JR, Nowycky MC. Two types of calcium channels coexist in peptide-releasing vertebrate nerve terminals. Neuron. 1989;2:1419–1426. doi: 10.1016/0896-6273(89)90187-6. [DOI] [PubMed] [Google Scholar]
- 45.Liley AW, North KAK. An electrical investigation of effects of repetitive stimulation of mammalian neuromuscular junction. J Neurophysiol. 1952;16:509–527. doi: 10.1152/jn.1953.16.5.509. [DOI] [PubMed] [Google Scholar]
- 46.Liu G, Tsien RW. Properties of synaptic transmission at single hippocampal synaptic boutons. Nature. 1995;375:404–408. doi: 10.1038/375404a0. [DOI] [PubMed] [Google Scholar]
- 47.Liu G, Choi S, Tsien RW. Variability of neurotransmitter concentration and nonsaturation of postsynaptic AMPA receptors at synapses in hippocampal cultures and slices. Neuron. 1999;22:395–409. doi: 10.1016/s0896-6273(00)81099-5. [DOI] [PubMed] [Google Scholar]
- 48.Maass W, Zador AM. Dynamic stochastic synapses as computational units. Neural Comput. 1999;11:903–917. doi: 10.1162/089976699300016494. [DOI] [PubMed] [Google Scholar]
- 49.Mainen ZF, Malinow R, Svoboda K. Synaptic calcium transients in single spines indicate that NMDA receptors are not saturated. Nature. 1999;399:151–155. doi: 10.1038/20187. [DOI] [PubMed] [Google Scholar]
- 50.Markram H, Tsodyks M. Redistribution of synaptic efficacy between neocortical pyramidal neurons. Nature. 1996;382:807–810. doi: 10.1038/382807a0. [DOI] [PubMed] [Google Scholar]
- 51.Markram H, Wang Y, Tsodyks M. Differential signaling via the same axon of neocortical pyramidal neurons. Proc Natl Acad Sci USA. 1998;95:5323–5328. doi: 10.1073/pnas.95.9.5323. [DOI] [PMC free article] [PubMed] [Google Scholar]
- 52.Melkonian DS, Kostopoulos GK. Stochastic particle formulation of the vesicle hypothesis. Relevance to short-term phenomena. NeuroReport. 1996;7:937–942. doi: 10.1097/00001756-199603220-00022. [DOI] [PubMed] [Google Scholar]
- 53.Murthy VN, Stevens CF. Synaptic vesicles retain their identity through the endocytic cycle. Nature. 1998;392:497–501. doi: 10.1038/33152. [DOI] [PubMed] [Google Scholar]
- 54.Murthy VN, Sejnowski TJ, Stevens CF. Heterogeneous release properties of visualized individual hippocampal synapses. Neuron. 1997;18:599–612. doi: 10.1016/s0896-6273(00)80301-3. [DOI] [PubMed] [Google Scholar]
- 55.Neher E. Vesicle pools and Ca2+ microdomains: new tools for understanding their roles in neurotransmitter release. Neuron. 1998;20:389–399. doi: 10.1016/s0896-6273(00)80983-6. [DOI] [PubMed] [Google Scholar]
- 56.Neher E, Zucker RS. Multiple calcium-dependent processes related to secretion in bovine chromaffin cells. Neuron. 1993;10:21–30. doi: 10.1016/0896-6273(93)90238-m. [DOI] [PubMed] [Google Scholar]
- 57.Patil PG, Brody DL, Yue DT. Preferential closed-state inactivation of neuronal calcium channels. Neuron. 1998;20:1027–1038. doi: 10.1016/s0896-6273(00)80483-3. [DOI] [PubMed] [Google Scholar]
- 58.Quastel DMJ. The binomial model in fluctuation analysis of quantal neurotransmitter release. Biophys J. 1997;72:728–753. doi: 10.1016/s0006-3495(97)78709-5. [DOI] [PMC free article] [PubMed] [Google Scholar]
- 59.Raastad M, Storm JF, Andersen P. Putative single quantum and single fibre excitatory postsynaptic currents show similar amplitude range and variability in rat hippocampal slices. Eur J Neurosci. 1992;4:113–117. doi: 10.1111/j.1460-9568.1992.tb00114.x. [DOI] [PubMed] [Google Scholar]
- 60.Redman SJ. Quantal analysis of synaptic potentials in neurons of the central nervous system. Physiol Rev. 1990;70:165–198. doi: 10.1152/physrev.1990.70.1.165. [DOI] [PubMed] [Google Scholar]
- 61.Redman SJ, Walmsley B. Amplitude fluctuations in synaptic potentials evoked in cat spinal motoneurones at identified group 1a synapses. J Physiol (Lond) 1983;343:135–145. doi: 10.1113/jphysiol.1983.sp014885. [DOI] [PMC free article] [PubMed] [Google Scholar]
- 62.Rosenmund C, Stevens CF. Definition of the readily releasable pool of vesicles at hippocampal synapses. Neuron. 1996;16:1197–1207. doi: 10.1016/s0896-6273(00)80146-4. [DOI] [PubMed] [Google Scholar]
- 63.Ryan TA, Reuter H, Smith SJ. Optical detection of a quantal presynaptic membrane turnover. Nature. 1997;388:478–482. doi: 10.1038/41335. [DOI] [PubMed] [Google Scholar]
- 64.Scanziani M, Salin PA, Vogt KE, Malenka RC, Nicoll RA. Use-dependent increases in glutamate concentration activate presynaptic metabotropic glutamate receptors. Nature. 1997;385:630–634. doi: 10.1038/385630a0. [DOI] [PubMed] [Google Scholar]
- 65.Schikorski T, Stevens CF. Quantitative ultrastructural analysis of hippocampal excitatory synapses. J Neurosci. 1997;17:5858–5867. doi: 10.1523/JNEUROSCI.17-15-05858.1997. [DOI] [PMC free article] [PubMed] [Google Scholar]
- 66.Silver RA, Cull-Candy SG, Takahashi T. Non-NMDA glutamate receptor occupancy and open probability at a rat cerebellar synapse with single and multiple release sites. J Physiol (Lond) 1996;494:231–250. doi: 10.1113/jphysiol.1996.sp021487. [DOI] [PMC free article] [PubMed] [Google Scholar]
- 67.Somogyi P, Tamas G, Lujan R, Buhl EH. Salient features of synaptic organisation in the cerebral cortex. Brain Res Rev. 1998;26:113–135. doi: 10.1016/s0165-0173(97)00061-1. [DOI] [PubMed] [Google Scholar]
- 68.Stevens CF. Quantal release of neurotransmitter and long-term potentiation. Cell [Suppl] 1993;72:55–63. doi: 10.1016/s0092-8674(05)80028-5. [DOI] [PubMed] [Google Scholar]
- 69.Stevens CF, Tsujimoto T. Estimates for the pool size of releasable quanta at a single central synapse and for the time required to refill the pool. Proc Nat Acad Sci USA. 1995;92:846–849. doi: 10.1073/pnas.92.3.846. [DOI] [PMC free article] [PubMed] [Google Scholar]
- 70.Stevens CF, Wang Y. Facilitation and depression at single central synapses. Neuron. 1995;14:795–802. doi: 10.1016/0896-6273(95)90223-6. [DOI] [PubMed] [Google Scholar]
- 71.Stevens CF, Wesseling JF. Activity-dependent modulation of the rate at which synaptic vesicles become available to undergo exocytosis. Neuron. 1998;21:415–424. doi: 10.1016/s0896-6273(00)80550-4. [DOI] [PubMed] [Google Scholar]
- 72.Südhof TC. The synaptic vesicle cycle: a cascade of protein-protein interactions. Nature. 1995;375:645–653. doi: 10.1038/375645a0. [DOI] [PubMed] [Google Scholar]
- 73.Tang CM, Margulis M, Shi QY, Fielding A. Saturation of postsynaptic glutamate receptors after quantal release of transmitter. Neuron. 1994;13:1385–1393. doi: 10.1016/0896-6273(94)90423-5. [DOI] [PubMed] [Google Scholar]
- 74.Thomson AM. Activity-dependent properties of synaptic transmission at two classes of connections made by rat neocortical pyramidal axons in vitro. J Physiol (Lond) 1997;502:131–147. doi: 10.1111/j.1469-7793.1997.131bl.x. [DOI] [PMC free article] [PubMed] [Google Scholar]
- 75.Thomson AM, Deuchars J. Diverse pre- and post-synaptic properties of fast excitatory synapses. In: Wheal HV, Thomson AM, editors. Excitatory amino acids and synaptic function. Academic; London: 1995. pp. 145–172. [Google Scholar]
- 76.Tong G, Jahr CE. Multivesicular release from excitatory synapses of cultured hippocampal neurons. Neuron. 1994;12:51–59. doi: 10.1016/0896-6273(94)90151-1. [DOI] [PubMed] [Google Scholar]
- 77.Triller A, Korn H. Transmission at a central inhibitory synapse. III. Ultrastructure of physiologically identified and stained terminals. J Neurophysiol. 1982;48:708–736. doi: 10.1152/jn.1982.48.3.708. [DOI] [PubMed] [Google Scholar]
- 78.Trussell LO, Zhang S, Raman IM. Desensitization of AMPA receptors upon multiquantal neurotransmitter release. Neuron. 1993;10:1185–1196. doi: 10.1016/0896-6273(93)90066-z. [DOI] [PubMed] [Google Scholar]
- 79.Tsodyks MV, Markram H. The neural code between neocortical pyramidal neurons depends on neurotransmitter release probability. Proc Natl Acad Sci USA. 1997;94:719–723. doi: 10.1073/pnas.94.2.719. [DOI] [PMC free article] [PubMed] [Google Scholar]
- 80.van Kampen NG. Stochastic processes in physics and chemistry. North-Holland; Amsterdam: 1981. [Google Scholar]
- 81.Varela JA, Sen K, Gibson J, Fost J, Abbott LF, Nelson SB. A quantitative description of short-term plasticity at excitatory synapses in layer 2/3 of rat primary visual cortex. J Neurosci. 1997;17:7926–7940. doi: 10.1523/JNEUROSCI.17-20-07926.1997. [DOI] [PMC free article] [PubMed] [Google Scholar]
- 82.Vere-Jones D. Simple stochastic models for the release of quanta of transmitter from a nerve terminal. Aust J Stat. 1966;8:53–63. [Google Scholar]
- 83.Walmsley B, Alvarez FJ, Fyffe RE. Diversity of structure and function at mammalian central synapses. Trends Neurosci. 1998;21:81–88. doi: 10.1016/s0166-2236(97)01170-3. [DOI] [PubMed] [Google Scholar]
- 84.Wang LY, Kaczmarek LK. High-frequency firing helps replenish the readily releasable pool of synaptic vesicles. Nature. 1998;394:384–388. doi: 10.1038/28645. [DOI] [PubMed] [Google Scholar]
- 85.Wang X, Lambert NA. The mechanism of late paired-pulse depression. Soc Neurosci Abstr. 1998;24:319. [Google Scholar]
- 86.Wang XJ. Fast burst firing and short-term synaptic plasticity: a model of neocortical chattering neurons. Neuroscience. 1999;89:347–362. doi: 10.1016/s0306-4522(98)00315-7. [DOI] [PubMed] [Google Scholar]
- 87.Wang XJ, Golomb D, Rinzel J. Emergent spindle oscillations and intermittent burst firing in a thalamic model: specific neuronal mechanisms. Proc Natl Acad Sci USA. 1995;92:5577–5581. doi: 10.1073/pnas.92.12.5577. [DOI] [PMC free article] [PubMed] [Google Scholar]
- 88.Wu LG, Saggau P. Presynaptic inhibition of elicited neurotransmitter release. Trends Neurosci. 1997;20:204–212. doi: 10.1016/s0166-2236(96)01015-6. [DOI] [PubMed] [Google Scholar]
- 89.Wu LG, Borst JG, Sakmann B. R-type Ca2+ currents evoke transmitter release at a rat central synapse. Proc Natl Acad Sci USA. 1998;95:4720–4725. doi: 10.1073/pnas.95.8.4720. [DOI] [PMC free article] [PubMed] [Google Scholar]
- 90.Xu T, Binz T, Niemann H, Neher E. Multiple kinetic components of exocytosis distinguished by neurotoxin sensitivity. Nat Neurosci. 1998;1:192–200. doi: 10.1038/642. [DOI] [PubMed] [Google Scholar]
- 91.Yamada WM, Zucker RS. Time course of transmitter release calculated from simulations of a calcium diffusion model. Biophys J. 1992;61:671–682. doi: 10.1016/S0006-3495(92)81872-6. [DOI] [PMC free article] [PubMed] [Google Scholar]
- 92.Zucker RS. Short-term synaptic plasticity. Annu Rev Neurosci. 1989;12:13–31. doi: 10.1146/annurev.ne.12.030189.000305. [DOI] [PubMed] [Google Scholar]
- 93.Zucker RS. Exocytosis: a molecular and physiological perspective. Neuron. 1996;17:1049–1055. doi: 10.1016/s0896-6273(00)80238-x. [DOI] [PubMed] [Google Scholar]