

Abstract
Glutamate produces a hyperpolarizing synaptic potential in On bipolar cells by binding to the metabotropic glutamate receptor mGluR6, leading to closure of a cation channel. Here it is demonstrated that this cation channel is regulated by intracellular Ca2+. Glutamate-evoked currents were recorded from On bipolar cells in light-adapted salamander retinal slices in the presence of 2 mm external Ca2+. When glutamate was applied almost continuously, interrupted only briefly to measure the size of the response, the glutamate response remained robust. However, currents elicited by intermittent and brief applications of glutamate exhibited time-dependent run down. Run down of the glutamate response was also voltage dependent, because it was accelerated by membrane hyperpolarization. Run down was triggered, at least in part, by a rise in intracellular Ca2+; measured as a function of time or voltage, it was attenuated by intracellular buffering of Ca2+ with BAPTA or by omitting Ca2+ from the bathing solution. Current–voltage measurements demonstrated that Ca2+induced run down of the glutamate response by downregulating cation channel function, rather than by preventing closure of the channel by glutamate and mGluR6. A major source of the Ca2+that mediated this inhibition is the cation channel itself, which was found to be permeable to Ca2+, accounting for the use dependence of the run down. These results suggest that Ca2+ influx through the cation channel during background illumination could provide a signal to close the cation channel and repolarize the membrane toward its dark potential, an adaptive mechanism for coping with changes in ambient light.
Keywords: calcium, mGluR6, cation channel, metabotropic, retina, bipolar cell
The synapse between photoreceptors and On bipolar cells is one of the initial synapses in the visual system and is the first opportunity for modification of the visual signal. At this synapse, glutamate, the photoreceptor transmitter, hyperpolarizes On bipolar cells via activation of a G-protein-coupled receptor (Nawy and Jahr, 1990a; Shiells and Falk, 1990), identified molecularly as mGluR6 (Nakajima et al., 1993). Hyperpolarization results when the G-protein–mGluR6 complex suppresses a cation current that keeps the On bipolar cells continuously depolarized. The mGluR6 receptor is selectively activated by the glutamate agonistl-2-amino-4-phosphonobutyrate and is therefore characterized as a group III metabotropic receptor (for review, see Pin and Duvoisin, 1995). The G-protein, most likely Go (Vardi, 1998; Nawy, 1999a), may inhibit channel function via a direct interaction with the channel, a common pathway for Go (Hille, 1994) .
The photoreceptor–On bipolar cell synapse has long been recognized as a potentially important site for a photoreceptor-independent form of light adaptation within the retina (Dowling, 1987), although the underlying cellular mechanism has not been resolved. New insight into this problem was provided by a recent study showing that tightly buffering intracellular Ca2+ with BAPTA reduces adaptive changes in the light response of On bipolar cells (Shiells and Falk, 1999). The authors concluded that Ca2+ may mediate adaptive changes to the light response in On bipolar cells, as it does in photoreceptors. Their study raises a number of important questions. For example, the target of Ca2+ within the mGluR6 pathway is unclear. Ca2+ could be interacting with the receptor or G-protein, diminishing the ability of the receptor to close the channel, or it may downregulate the channel directly. Also, the source of the Ca2+ that mediated these adaptive changes is unclear. It has been suggested that it may be the synaptic cation channel itself (Shiells and Falk, 1999), but there is currently no evidence that the channel is permeable to Ca2+. In addition, information about the kinetics of Ca2+ action is lacking. Resolution of these issues is necessary to provide a clearer understanding of Ca2+-dependent modulation of postsynaptic responses in On bipolar cells.
Accordingly, the present study was undertaken to assess the role of Ca2+ in the function and regulation of the mGluR6 pathway. The results presented here suggest that the nonselective cation channel that is closed by glutamate is highly permeable to Ca2+ and that the entry of Ca2+ through this channel will then cause the channel to close. This feedback can be observed within a second after the opening of the cation channel. Ca2+ could provide a signal to close cation channels that have been opened by steady illumination. This process would help to restore the On bipolar cell to its dark membrane potential and operating range.
MATERIALS AND METHODS
Preparation of slices and solutions. Slices of retina from larval tiger salamanders (Kons Scientific, Germantown, WI) were prepared as described previously (Nawy and Jahr, 1990b; Walters et al., 1998). Briefly, salamanders were anesthetized with 3-aminobenzoic acid ethyl ester and decapitated, and the eyes were enucleated. Whole retinas were isolated and placed on a 0.65 μm cellulose acetate/nitrate membrane filter (Millipore, Bedford, MA) that was secured with vacuum grease to a glass slide adjacent to the recording chamber. Slices were then cut to a thickness of 150–200 μm with a tissue slicer (Stoelting, Wood Lane, IL), transferred to the recording chamber while remaining submerged, and viewed with a Zeiss (Thornwood, NY) Axioskop equipped with a water-immersion 40× objective with Hoffman modulation contrast (Modulation Contrast, Greenvale, NY). All manipulations were performed in normal room light. Slices were bathed in a solution containing (in mm): 108 NaCl, 2 CaCl2, 2.5 KCl, 1.2 MgCl2, 10 HEPES, 10 glucose, and 0.1 picrotoxin, pH 7.6 (with NaOH). Total Na+ was 110 mm. The solution was perfused continuously through the recording chamber at a rate of ∼1 ml/min. In some experiments, the metabotropic receptor antagonist (R,S)-α-cyclopropyl-4-phosphonophenylglycine (CPPG; Tocris Cookson, Ballwin, MO) was added to the control flow pipe solution. For the Ca2+-free solution, CaCl2 was replaced with 2 mm EGTA. The 20 mmCa2+ solution contained 85 mm Na+. For reversal potential experiments, MgCl2 was omitted. These solutions were applied to cells through the flow pipes (see below). The pipette solution was composed of (in mm): 85 K+gluconate, 10 KCl, 10 HEPES, 10 EGTA, 4 MgATP, and 1 LiGTP, pH 7.4 (with KOH). Final [K+] was 144 mm.
Electrophysiology and drug application. Patch pipettes were fabricated from borosilicate glass (WPI, Sarasota, Fl) using a two-stage vertical puller (Narishige, Sea Cliff, NY) and were fire-polished to resistances of 2–3 MΩ. Whole-cell recordings were obtained with an Axopatch 200A amplifier (Axon Instruments, Foster City, CA) and had input and series resistances of ∼1 GΩ and 10–19 MΩ, respectively. On bipolar cells were identified by their position in the slice and by their characteristic outward responses to glutamate. Cells were discarded if the series resistance exceeded 20 MΩ, if the holding current changed suddenly, or if the holding current during the first application of agonist exceeded −20 pA (i.e., current measured while the sustained inward current was suppressed) at −40 mV. Holding potentials were corrected for the liquid junction potential, which was measured to be 10 mV with the standard K+gluconate pipette solution. Data were acquired with Axobasic software and the Digidata 1200 interface (Axon instruments) and analyzed with Kaleidagraph (Synergy Software, Reading, PA).
Drugs were applied via two polymer-coated fused silica tubes (outer diameter, 350 μm; inner diameter, 250 μm; Polymicro Technologies, Phoenix, AZ) positioned close to the cell. One tube contained control bathing solution, and the other contained bathing solution to which 1 mm glutamate was added. The tubes were mounted to a computer-controlled piezobimorph (Morgan-Matroc, Bedford, OH). Each tube was supplied by two separate reservoirs, which were manually switched. One reservoir contained low Ca2+, either 0 or 2 mmCa2+, and the other contained higher Ca2+ concentrations, either 5 or 20 mm Ca2+. The other set of reservoirs contained the same solutions, but with added glutamate.I–V plots were constructed first in low-Ca2+ and then in high-Ca2+ solutions without repositioning the tubes. Switching from low to high Ca2+took ∼15 sec. The bath solution always contained the standard 2 mm Ca2+solution.
Measurement of reversal potentials. Direct measurement of the reversal potential of the glutamate response was often hampered by a pronounced outward rectification of the I–V relation, particularly with elevated Ca2+. The reversal potential was therefore obtained from the linear least squares fit to the outward limb of individual I–V plots. Reversal potentials were pooled from all cells to obtain a mean and SE for each Ca2+ concentration. Analysis of reversal potential shifts in single cells yielded results that were nearly identical to the shifts obtained by pooling the data. The permeability ratio Ca2+/Na+ was obtained from experimentally determined reversal potentials using the Goldman–Hodgkin–Katz (GHK) constant field equation extended to include divalent ions using ion activities (Jan and Jan, 1976; Mayer and Westbrook, 1987). Ion activity was calculated as the product of the ion concentration and activity coefficient γ. Activity coefficients used to calculate ion activities were γNa+ = 0.74, γK+ = 0.72, and γCa2+(2 mm) = 0.23 [references cited in Gilbertson et al. (1991)] and γCa2+(20 mm) = 0.44 (Taschenberger et al., 1999).
RESULTS
Use-dependent regulation of the mGluR6 cascade
Whole-cell recordings were obtained from On bipolar cells in slices of tiger salamander retina that were light-adapted by room light. Under light-adapted conditions, synaptic release of glutamate from photoreceptors should be minimal. This was confirmed with CPPG, a type III metabotropic receptor antagonist (Jane et al., 1996; von Gersdorff et al., 1997). Application of 300 μmCPPG to On bipolar cells produced no response (data not shown), indicating a lack of endogenous glutamate. At 30 sec intervals after obtaining recordings, cells were exposed to glutamate for 5 sec, to monitor the amplitude of the response. This will be referred to as the 20/120 protocol. Figure1A shows three current traces in a cell that was voltage clamped at −40 mV. Each trace is composed of the average of four glutamate responses, obtained during the time period indicated above each trace. The response appears outward because glutamate activates the metabotropic receptor mGluR6 and shuts off an inward cation conductance (Nawy and Jahr, 1990a;Shiells and Falk, 1990). There was a time-dependent run down of the response associated with a decrease in baseline current, as has been reported previously (Nawy and Jahr, 1990b). Overall, the amplitude of the response decreased to 35.3 ± 6.5% of its initial size after 15 min of recording (Fig. 1C).
Fig. 1.

Run down of the glutamate response is use dependent. A, Example of responses obtained when glutamate was applied for 5 sec at 30 sec intervals (20/120 application protocol). Each trace is the average of four responses obtained during the time intervals indicated above eachtrace. B, Example of responses from a different cell obtained by washing off glutamate for 5 sec at 2 min intervals (115/120 protocol). Each trace is a single response to the application of the control bathing solution at thetime indicated above eachtrace. The bathing solution contained the group III metabotropic receptor antagonist CPPG (300 μm). Note that even when CPPG was present, the kinetics of wash off was slowed with successive trials. The reason for this is unclear but may be attributable to increased extrusion of glutamate by glia after long periods of glutamate application. Without CPPG present, the kinetics of washout was extremely slow and variable from cell to cell. C, The mean (±SE) responses to glutamate, normalized to the size of the initial response in each individual cell receiving nearly continuous (115/120 sec; filledsquares; n = 11) or brief intermittent (20/120 sec; opencircles;n = 7) exposure to glutamate. The holding potential for all cells was −40 mV.
In darkness, photoreceptors release glutamate continuously at their maximum rate onto On bipolar cells. Consequently, a large fraction of the mGluR6 receptors are bound, and the cation conductance is primarily suppressed. These conditions were mimicked in the present study by continuously applying glutamate during establishment of whole-cell recording. Thereafter, it was washed away once every 2 min for 5 sec to measure the size of the response. Thus glutamate was present for 115 of 120 sec (115/120). Figure 1B shows a series of three responses to the wash off of glutamate at different times during the recording. The responses are inward because the removal of glutamate activated the cation conductance. Although there was a small change in the kinetics of the response to glutamate removal (see Fig.1B legend), the amplitude of the response was essentially unchanged throughout the recording period. Overall, cells exposed nearly continuously to glutamate exhibited no significant change in response amplitude (103.6 ± 11.8% of the initial response) over a 20 min recording period (Fig. 1C).
To examine better the mechanism and kinetics of response run down after glutamate deprivation, I first measured responses to glutamate in cells using the 115/120 protocol. Response run down was then initiated by switching to the low-glutamate, 20/120 protocol. An example of the result is shown in Figure2A. In this cell, which had the largest response of all of the cells that were observed, the decay of the glutamate response (Fig. 2A,filled circles) could be resolved as the sum of two exponentials, with time constants of 53.9 sec and 7.7 min. However, in six other cells, only a single exponential was required to obtain an adequate fit of the averaged data (Fig. 2A, inset), with a time constant of 1.4 min. In several experiments, the order of application protocols was reversed. Continuous application of glutamate for as long as 30 min failed to reverse run down that was induced by the 20/120 protocol (n = 4 cells; data not shown). Thus, with conventional whole-cell recording, the run down of the glutamate response was essentially irreversible.
Fig. 2.
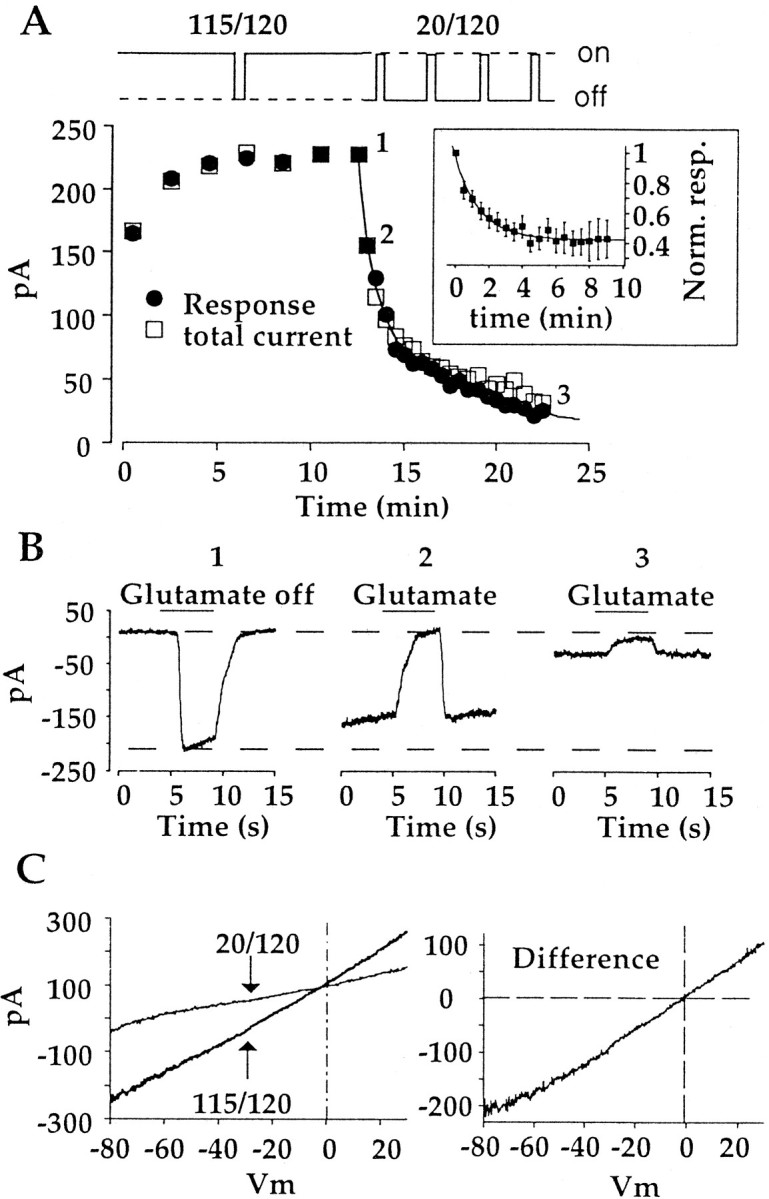
Use-dependent run down is associated with a loss of the underlying cation conductance. A, Plot of the decay of the response to glutamate (filledsquares) and the suppressible cation current (opensquares) in the same cell exposed to both glutamate application protocols. Because there is no known selective blocker of the cation channel, an independent measure of the total cation current was not possible. Instead, the amount of current was estimated by assuming that glutamate suppressed all of the cation current immediately before switching to the 20/120 protocol, when the response reached a maximum. The continuousline is a double exponential fit to the response data.Inset, Averaged decay of the response after switching to the 20/120 protocol. Data are from six cells and were reasonably well fitted by a single exponential. Norm. resp., Normalized response. B, Single responses to the withdrawal (left) or application (center,right) of glutamate at the times indicated by thenumbers1–3 inA. The decay of the response is caused solely by a loss of holding current. C,Left, Currents elicited by ramping the holding voltage from −80 to +30 mV. The duration of each ramp was ∼8 sec. Voltage ramps were obtained immediately before, and then 10 min after, switching to the 20/120 protocols. Right, Ramp subtraction showing that the change in holding current during the experiment can be attributed to the loss of a conductance with a reversible potential near 0 mV. Records shown in C are from a different cell than that producing records in A and B.
Loss of the response could be because of the failure of the receptor—G-protein complex to close the open cation channel or because cation channels are no longer open and available to be closed by glutamate. In Figure 2A, total cation current is plotted as a function of time (open squares) along with the glutamate response. Total cation current was estimated by assuming that during the largest response that was observed, glutamate suppressed all of the cation current (i.e., the total cation current was set equal to the size of the glutamate response at the time point labeled 1 in Fig. 2A). The striking similarity in the magnitude and rate of decay of the response and the loss of current that could be suppressed by glutamate is consistent with the idea that the cation channel was downregulated with time, thus accounting for the run down of the response. This can be appreciated by comparing the peak and baseline of the response during glutamate removal (Fig. 2b, left) with the peak and baseline of the trace obtained immediately (middle) and 10 min (right) after switching protocols. The holding current in the presence of glutamate, when the cation channels were closed, was essentially unchanged during the course of the experiment. Similar results were obtained in six of seven cells.
Further evidence that a loss of the cation current was responsible for the overall change in holding current was obtained by using voltage ramps to measure the cell I–V relation during the 115/120 phase of the experiment (glutamate was not applied during the ramp) and then again after switching to the 20/120 protocol. In three of three cells, one of which is shown in Figure 2C, the change in baseline was associated with a decrease in conductance (left) with a reversal potential near 0 mV (right), as expected if the conductance decrease was caused by the closure of a nonselective cation channel.
Use-dependent regulation of the channel involves Ca2+
Ca2+ has been postulated as a mediator of adaptive changes in On bipolar cell light responses (Shiells and Falk, 1999). To test the possibility that Ca2+ is involved in mediating the use-dependent effect of glutamate described here, experiments were performed with BAPTA as the Ca2+ chelator rather than EGTA. The mean amplitude of the response elicited by the 115/120 protocols in cells dialyzed with BAPTA was essentially unchanged during the same time period (Fig.3C; 98.5 ± 19.9% of the initial response), similar to the result obtained with EGTA-dialyzed cells using the same glutamate application protocol. However, dialysis with 10 mm BAPTA decreased time-dependent run down of the response observed with the 20/120 application protocol. An example of the glutamate responses obtained with BAPTA in the pipette and 2 mm Ca2+ in the bathing solution is shown in Figure 3A. Overall, the amplitude of the response was 79.2 ± 10.4% of the initial response after 15 min of recording (Fig. 3C).
Fig. 3.

BAPTA reduces use-dependent run down.A, Currents elicited by glutamate with the 20/120 protocol, recorded from an On bipolar cell with a pipet solution containing 10 mm BAPTA. Responses exhibited only moderate run down. B, C, Time course of the response to glutamate in BAPTA-dialyzed cells, using the 20/120 application protocol (B; n = 9) or the 115/120 protocol (C; n = 8). With BAPTA, the time course of the response with both protocols was similar, suggesting that intracellular Ca2+ mediates use-dependent run down.
Although BAPTA effectively diminished time-dependent run down, a significant amount of run down was still observed. BAPTA may not have reached the dendrites in time to prevent the initiation of a Ca2+-dependent process, leading to run down. Alternatively, one or more sites of Ca2+ action may not be accessible to BAPTA. Accordingly, glutamate responses were measured in a bathing solution containing no added Ca2+ and 2 mm EGTA. In this experiment, 2 mmCa2+ was present in the bath to facilitate seal formation and break-in. Immediately after breaking into the cell, the bath solution was switched to a Ca2+-free solution, and the response to glutamate was measured using the 20/120 protocol. After a delay of several minutes, a run-up of the glutamate response was typically observed, and the amplitude of the response was 139.2 ± 28.7% of the initial response (Fig.4A). Although there was a large degree of variability from cell to cell, as can be appreciated by the SE, run down was seen in only one of six cells, and in that one cell, the size of the response after 15 min was ∼90% of the initial response.
Fig. 4.

Run down is prevented by removing Ca2+ from the bathing medium but not by blocking voltage-gated Ca2+ channels. A, A summary of the run down of the glutamate response, obtained with the 20/120 protocol, is shown. Cells were bathed in solution containing 2 mm EGTA and no added Ca2+(filledcircles;n = 6) or 2 mm Ca2+and 100 μm nifedipine (opencircles; n = 5). B, This concentration of nifedipine was sufficient to block Ca2+ currents in On bipolar cells fully. A Ca2+ current was elicited with a voltage ramp from −60 to +30 mV lasting ∼2 sec. The addition of 100 μmnifedipine through a flow pipe blocked the current. Nifedipine also blocked Ca2+ current in two other cells. For this experiment, Ca2+ was replaced with 10 mmBa2+ in the bathing solution. Nifed, Nifedipine.
The possibility that the entry of Ca2+through voltage-gated Ca2+ channels might contribute to inhibition of the glutamate response was examined. Addition of 100 μm nifedipine to the normal bathing medium did not prevent run down of the glutamate response (Fig.4A) but did block voltage-gated Ca2+ current in On bipolar cells (Fig.4B), as has been reported previously (Tachibana et al., 1993; Protti and Llano, 1998). It therefore seems likely that Ca2+ entry through nifedipine-sensitive Ca2+ channels, the prominent type of voltage-gated Ca2+ channel in On bipolar cells, does not contribute to regulation of the mGluR6 pathway.
Ca2+ causes a run down of the glutamate response principally via downregulation of the cation channel. Figure5 illustrates an experiment in which the bathing medium was switched from Ca2+-free to a solution containing 2 mmCa2+. During this time, glutamate was applied briefly every 30 sec. The addition of Ca2+ produced a small transient change in the peak of the glutamate response. This was commonly observed, and the reason is unclear, but the long-lasting effect of added Ca2+ was a shift in the baseline (Fig.5B). Voltage ramps made in the absence and presence of Ca2+ (Fig. 5C, left) clearly show that the decrease in holding current was associated with a conductance decrease with a reversal potential near 0 mV. On the other hand, voltage ramps generated during glutamate application show that membrane conductance was relatively unchanged by Ca2+ when the cation channels were held closed by glutamate. Similar results were obtained in seven other On bipolar cells. These results suggest that the use-dependent inhibition described in the previous section shares a common mechanism with Ca2+, both downregulating function of the cation channel.
Fig. 5.
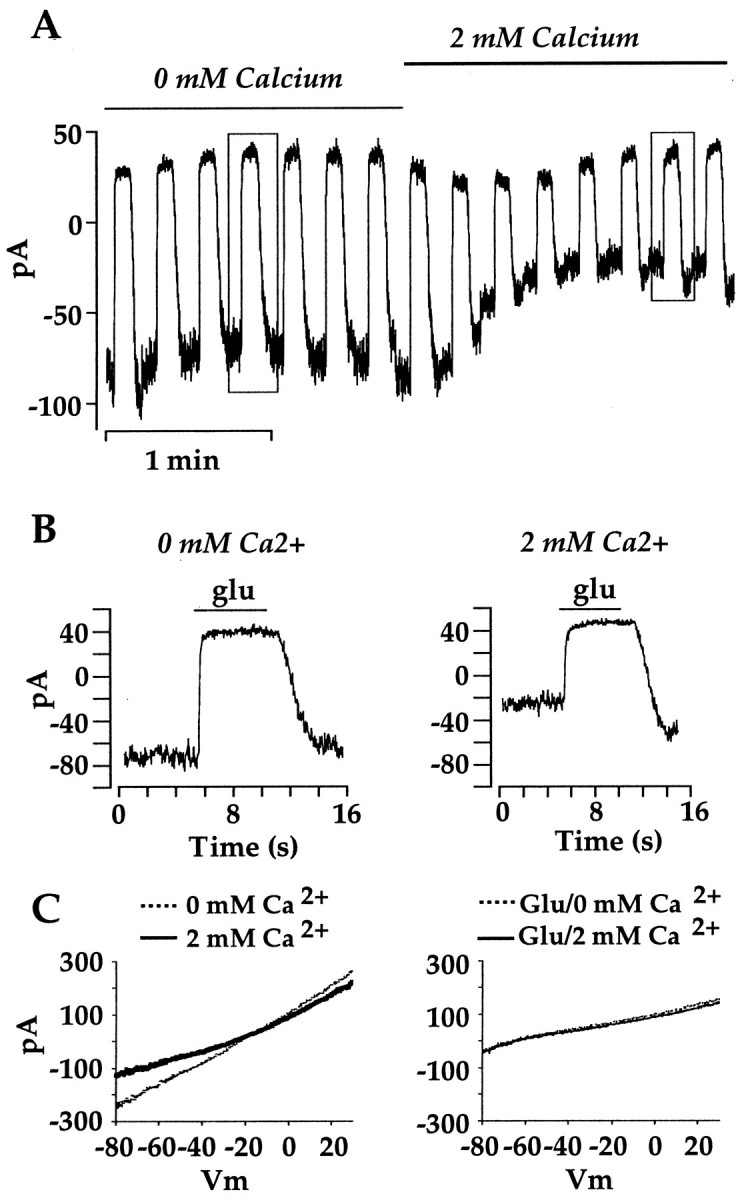
Ca2+ induces run down via downregulation of the cation conductance. A, At the indicated time, control and glutamate bathing solutions with 2 mm EGTA and no added Ca2+ were switched with solutions containing 2 mm Ca2+. Ca2+ shifted the baseline and reduced the amplitude of the response. There was a 15 sec period during which there was no acquisition before each response to glutamate. B, Glutamate responses indicated by the boxes inA are displayed on a faster time scale. Note the undershoot after removal of glutamate in the 2 mm bathing solution, although the acquisition sequence ended before the response recovered to baseline. The holding potential for this cell was −40 mV.C, Responses to voltage ramps from −80 to +30 mV and ∼8 sec long, obtained in 0 mm Ca2+(thinline) and 2 mmCa2+ (thickline) solution in the absence (left) and presence (right) of glutamate, are shown. In the presence of glutamate, when the cation channels were closed, Ca2+ had no effect on the I–Vrelation. In the absence of glutamate, Ca2+decreased membrane conductance with a reversal potential near 0 mV, suggesting that the decrease in conductance was caused by an overall downregulation of cation channel function. The cell inC is different from the cell in A andB.
The cation channel that couples to the mGluR6 receptor is permeable to Ca2+
One potential route for Ca2+ entry that is consistent with the data presented above is through the cation channel itself. Because there is presently no evidence that the channel is permeable to Ca2+, this possibility was examined by measuring the reversal potential of the glutamate response while varying the external Ca2+concentration. An example of this experiment is illustrated in Figure6. In the absence of Ca2+, the response reversed near 0 mV (Fig. 6A). However, when a portion of the external Na+ was substituted with 20 mm Ca2+ (see Materials and Methods), the reversal potential was shifted in the positive direction (Fig. 6B).
Fig. 6.

Cation-selective channels in On bipolar cells are permeable to Ca2+. A,B, Records from an On bipolar cell obtained in 0 mm Ca2+ (A) and 20 mm Ca2+ (B). Raising external Ca2+ produces a positive shift in the reversal potential of the glutamate response. C, Mean (±SE) of the outward limb of the I–V relation measured with 0 mm Ca2+ (n = 9), 5 mm Ca2+ (n = 14), or 20 mm Ca2+(n = 13) in the bath. D, Mean reversal potential as a function of external Ca2+. Fit is from the extended GHK equation (Mayer and Westbrook, 1987) with a Ca2+/K+/Na+ratio of 4.9:1.27:1.
The mean reversal potential measured in Ca2+-free solution was −0.24 ± 0.74 mV, corresponding to a Na+/K+permeability ratio near unity (1.27:1). In 5 mmCa2+, the reversal potential was +2.7 ± 1.7 mV. In the presence of higher external Ca2+, the glutamate response rectified strongly near the reversal potential, making direct measurements of the reversal potential difficult. For this reason, the reversal potential was determined by a linear extrapolation of the outer limb of theI–V relation, as illustrated in Figure 6C. In 20 mm Ca2+, the reversal potential was +10.1 ± 1.9 mV. In Figure6D the reversal potential of the glutamate response is plotted as a function of Ca2+concentration. The continuous line is the GHK equation with a Ca2+/Na+/K+ratio of 4.9:1.27:1, adjusted for the activities of Ca2+, K+, and Na+ (see Materials and Methods). Thus, the shift in the reversal potential of the glutamate response suggests that the cation channel is significantly permeable to Ca2+.
Ca2+ confers voltage dependence on the glutamate response
Downregulation of the cation conductance by Ca2+ was strongly potentiated by membrane hyperpolarization. This is illustrated in the experiments summarized in Figure 7. Cells were held at −20 mV, and the holding potential was then stepped from +30 to −80 mV. In some experiments, cells were held at each potential for 5 sec before glutamate was applied (Fig. 7A, left). In other experiments, the step length before glutamate application was increased to 65 sec (Fig. 7A, right). The mean (± SE) amplitude of the glutamate response after long and short voltage steps is plotted as a function of the step voltage in Figure 7B. The external solution always contained 2 mmCa2+. With both step lengths, the slope conductance of the voltage–response plot was similar over the range of −20 to +30 mV (short step, 2.07 nS; long step, 1.79 nS). At holding potentials more negative than −20 mV, the slope conductance declined dramatically. With short steps, the slope conductance was 0.68 nS, and with longer steps, it was 0.14 nS. The inhibition of the response at more negative holding potentials was not readily reversible and resulted in a depression of the current suppressed by glutamate irrespective of holding potential (data not shown).
Fig. 7.
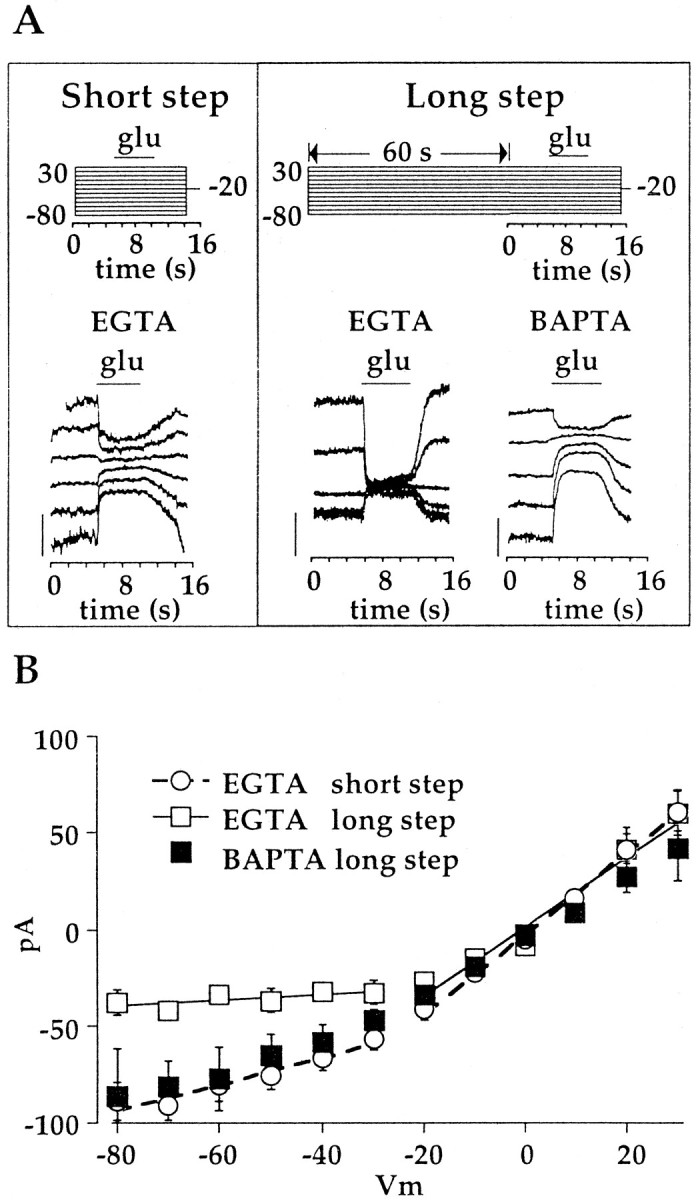
Inhibition of the steady-state glutamate response by Ca2+ is potentiated by long hyperpolarizing steps. A, Three examples of glutamate-elicited currents during a series of 10 mV voltage steps from +30 to −80 mV.Left, Responses to glutamate, applied 5 sec after the beginning of each step (Shortstep). The early portion of the trace at +30 mV has been omitted because of contamination from voltage-gated K+currents. Middle, Responses from another cell to glutamate applied 65 sec after the initiation of each step (Longstep). Right, Same as the middlepanel except that this cell was dialyzed with BAPTA. Voltage protocols are shownabove each series of responses. For clarity, only responses during odd voltage steps are shown. Calibration:left, right, 100 pA;middle, 50 pA. B, Mean (± SE) of theI–V plot obtained with short steps (opencircles; n = 15), long steps (opensquares; n = 17), and long steps in cells dialyzed with BAPTA (filledsquares;n = 11). Slope conductances for each condition were obtained from the linear regression of the averaged data over the voltage ranges of +30 to −20 and −30 to −80 mV. For short steps, slope conductances were 2.07 and 0.68 nS, respectively (dashedlines). For long steps, the slope conductances were 1.79 and 0.14 nS, respectively (continuouslines). For long steps with BAPTA in the pipette solution, the slope conductances were 1.51 and 0.79 nS, respectively.
These data are consistent with the idea that hyperpolarization increases the driving force for Ca2+through the cation channel and hastens run down of the response. Support for this idea was obtained by measuring the I–Vrelation using the long-step protocol and including BAPTA in the pipette solution (Fig. 7A, right). The slope conductance from −80 to −20 mV was 0.79 nS, similar to the conductance obtained with the short step with EGTA in the pipette solution (Fig. 7B). This experiment indicates that the rectification of the I–V relation is attributable to enhancement of Ca2+ inhibition at negative potentials. However, substantial rectification of the I–Vrelation was still observed in cells dialyzed with BAPTA. It is not clear whether this rectification persists because BAPTA is simply overwhelmed by the local increase in Ca2+or whether Ca2+ acts at other targets that are not accessible to BAPTA, such as the channel pore (see Discussion).
Many cells, particularly early in the recording, displayed a prominent undershoot after the removal of glutamate, which decayed back to baseline over the course of several seconds. An example of this undershoot in a cell recorded with 5 mmCa2+ in the bathing solution is shown in Figure 8A(thick trace). Glutamate would be expected to close nearly all of the cation channels. Thus would eliminate Ca2+ influx and favor upregulation of the cation channel. According to this model, upregulation is revealed briefly after the removal of glutamate, until the cation current decays to a smaller steady-state value as a result of Ca2+ influx. In support of this idea, switching to a Ca2+-free bathing solution almost completely abolished the undershoot and increased the steady-state amplitude of the glutamate response (Fig.8A, thin trace). In six of six cells that displayed a prominent undershoot, the undershoot was eliminated by switching to Ca2+-free solution. In the cell illustrated in Figure 8A, the time constant of decay was 0.84 sec, the fastest decay observed. In six cells, all of which could be fitted with a single exponential, the average time constant was 3.2 ± 1.4 sec.
Fig. 8.

Ca2+-induced changes in response kinetics contribute to inhibition of the response during hyperpolarization. A, Each trace is the average of four responses obtained in a bathing solution with 0 mm Ca2+ (thintrace) or 5 mm Ca2+(thicktrace). Ca2+depressed the steady-state cation current, but in this cell the depression was relieved briefly after the wash off of glutamate.Inset, The Ca2+-dependent decay of cation current was exponential, with a time constant of ∼0.8 sec in this cell. Calibration: 20 pA, 1 sec. B, I–Vrelations of the glutamate response using brief voltage steps as described in Figure 7 are shown. Steady-state responses were measured in 0 mm Ca2+(filledcircles;n = 10) or 5 mm Ca2+(opencircles; n = 9). The slope conductance for 0 mm Ca2+was 2.06 nS. In a third group of cells, the “peak” response was measured in cells that displayed a significant undershoot (opensquares; n = 11), by summing the size of the undershoot and the steady-state response. This group was obtained by pooling cells that were recorded with 5 mm Ca2+ (7 cells) and 2 mm Ca2+ (4 cells). The 0 mmCa2+ group includes only cells that displayed a significant undershoot with Ca2+ in the bathing medium.
Perhaps because of the increased driving force for Ca2+ through the channel, the size of the undershoot was enhanced relative to the steady-state glutamate response at negative holding potentials. Current–voltage relations for the glutamate response in bathing solution containing 5 or 0 mmCa2+ are shown in Figure8B. The responses were generated using the short-step protocol as in Figure 7A. In 5 mmCa2+, the steady-state response rectified sharply. Between −20 and +30 mV, the slope conductance was 1.48 nS, and it was 0.49 nS between −30 and −80 mV. In 0 mm Ca2+, the relation was relatively linear over the entire voltage range, with an overall slope conductance of 2.10 nS. When the instantaneous amplitude of the glutamate response in Ca2+ (data for 2 and 5 mm Ca2+were pooled) was measured by incorporating the undershoot, Ca2+-dependent inhibition was minimized, and the response–voltage function more closely resembled the 0 mm Ca2+function.
DISCUSSION
Synaptic responses in the dendrites of On bipolar cells are generated by current flow through a nonselective cation channel. The channel is negatively regulated by the mGluR6–Go-protein complex, which is localized to the dendrites (Vardi et al., 1993; Nakanishi, 1994; Nomura et al., 1994; Vardi and Morigiwa, 1997; Vardi, 1998). As a result, the cation channel is closed in darkness, when glutamate levels in the synapse are high, and opens when light hyperpolarizes the presynaptic photoreceptor and decreases transmitter release. In this study I show that this cation channel is regulated in a use-dependent manner. When the channels were held close by continuous application of glutamate, a large fraction of them opened in response to brief periods of glutamate removal. However, when the channels were allowed to remain open, the cation current quickly ran down. Run down was triggered, at least in part, by a rise in intracellular Ca2+, because it was attenuated by buffering Ca2+ with BAPTA or removing Ca2+ from the bathing solution. A potential source of Ca2+ entry is the cation channel itself, which was shown to have significant Ca2+ permeability.
At physiological concentrations, external Ca2+ appears to inhibit On bipolar cell cation channel function primarily by binding to an intracellular site rather than via channel block, such as has been observed for other cation channels. The effect of Ca2+described here is much slower than can be accounted for by divalent open channel block (Haynes et al., 1986; Zimmerman and Baylor, 1986;Mayer and Westbrook, 1987; Jahr and Stevens, 1993; Zagotta and Siegelbaum, 1996). Furthermore, inhibition of channel function could be primarily prevented by buffering intracellular Ca2+ with BAPTA. Downregulation of the cation current by Ca2+ probably also accounts for the pronounced voltage dependence of the glutamate response described here. During long hyperpolarizing steps (in the absence of glutamate), a greater accumulation of Ca2+ within the dendrites might be expected, because of a larger driving force for Ca2+ (Vernino et al., 1992), and this would promote further downregulation of the channel. Significant downregulation during hyperpolarizing steps as brief as 5 sec could be observed, and one such example can be seen in the −80 mV record in Figure 7A. I–V relations with long voltage steps were relatively linear when cells were buffered with BAPTA. Furthermore, instantaneous measurements of the I–V relation for the channel made in previous studies, constructed either with very brief steps or with ramps, do not exhibit pronounced rectification (Nawy and Jahr, 1991; Thoreson and Miller, 1993; Tian and Slaughter, 1994; Thoreson et al., 1995; Nawy, 1999a).
Higher concentrations of Ca2+, such as those used to measure permeability of the cation channel to Ca2+, inhibited the cation channel at all voltages that were examined. Inhibition of the cation conductance with high external Ca2+ might result from channel block, because BAPTA was unable to produce any relief from this inhibition. Alternatively, high external Ca2+ might overwhelm BAPTA and raise intracellular Ca2+ near its intracellular target (Legendre et al., 1993).
Several previous studies have sought to identify a role for Ca2+ in regulation of the mGluR6 cascade and have yielded conflicting results. An early study of rod On bipolar cells isolated from rat retina showed that removal of extracellular Ca2+ increased the magnitude of the cation current, whereas raising Ca2+ from 2.5 to 25 mm decreased the current (Yamashita and Wassle, 1991). Similar results were obtained in a study of amphibian retina in a slice preparation (Thoreson and Miller, 1993). The conclusions of these studies are in agreement with the results presented here. One difference is that these previous studies attributed the effects of Ca2+ to a direct block of the cation channel, whereas it is proposed here that at least a portion of the actions of Ca2+ can be attributed to an intracellular site of action (see below). Another laboratory has reported no significant change in the cation current or response to agonist after removal of extracellular Ca2+ (Shiells and Falk, 1992). One explanation for their result is that they held the voltage of their cells at −20 mV, significantly less negative than the holding potentials in the other studies. At −20 mV, the driving force for Ca2+ is small, and only minor effects of Ca2+ on the cation current and, hence, the glutamate response are observed (see Figs. 7, 8 of this study). In fact, close inspection of Figure 3A of the study by Shiells and Falk (1992) indicates a slight potentiation of the cation current in the absence of external Ca2+.
The findings of the present study would seem to contradict a previous study from this laboratory that concluded that CaMKII, a kinase that is activated by a rise in intracellular Ca2+, upregulates the cation channel (Walters et al., 1998). In that study, but not in the present one, bipolar cells were dialyzed with pipette solutions containing high concentrations of inorganic phosphate, because it increases the size of the glutamate response. Inorganic phosphate is an inhibitor of phosphatases (Jones and Westbrook, 1997) and probably serves this function in On bipolar cells, because a similar potentiation of the glutamate response has been observed when the Ca2+-dependent phosphatase calcineurin is inhibited (Nawy, 1999b). Calcineurin is activated by 10- to 100-fold lower Ca2+/calmodulin concentrations than is CaMKII (Klee, 1991), Therefore, one explanation for our results is that when the cation channels are open, recordings with EGTA and no added Ca2+ in the pipette allow the intracellular Ca2+ concentration near the cation channel to rise sufficiently to activate calcineurin but not CaMKII. Inhibition of calcineurin would unmask CaMKII that was activated before initiation of the recording, when intracellular Ca2+ may have been higher, or CaMKII that was weakly activated at low Ca2+concentrations during the recording. There is abundant evidence that the balance between Ca2+-dependent phosphorylation and dephosphorylation at a single site can be regulated by Ca2+ concentration and preferential activation of CaMKII or calcineurin [see references in Wang and Kelly (1996, 1997)]. It is unclear whether Ca2+levels in On bipolar cell dendrites become sufficiently high to activate CaMKII near the cation channel. If so, this would constitute a positive feedback pathway, in which the entry of Ca2+ through the channel might lead to further upregulation of the cation channel.
The run down of cation current induced by Ca2+ was essentially irreversible. As discussed above, this may be caused by an imbalance of phosphatase and kinase activities that regulate the channel. Because calcineurin is bound to the plasma membrane (for review, see Yakel, 1997), its activity may be retained during prolonged whole-cell recording, while the conjugate kinase(s) may be dialyzed from the cell. Consistent with this view is the observation that early in the recording, usually within the first 2–3 min, Ca2+-induced inhibition of the cation current could be reversed (S. Nawy, unpublished results).
The results of this study provide evidence of a Ca2+-triggered negative-feedback pathway, activated when glutamate levels in the synapse fall during steady illumination and the fraction of open channels increases. Ca2+ entering through cation channels would close them, helping to restore the membrane potential and input resistance of On bipolar cells to their preillumination values. This would insure that the input resistance of the cell remained high, preventing shunting of currents evoked by the opening of a few number of channels (Shiells and Falk, 1994). The kinetics of downregulation, estimated from the decay of the cation current after the removal of glutamate, yielded time constants of 1–6 sec, which would allow for relatively rapid recovery from adapting backgrounds. A recent study of On bipolar cells of the dark-adapted dogfish retina demonstrated that BAPTA prevents desensitization to dim light backgrounds, providing support for this model (Shiells and Falk, 1999). Regulation of the mGluR6 pathway by Ca2+ would provide the retina with an adaptive mechanism for coping with changes in ambient light in addition to adaptation within photoreceptors.
Footnotes
This work was supported by National Institutes of Health Grant EY 10254 and by an unrestricted grant from Research to Prevent Blindness Inc.
Correspondence should be addressed to Dr. Scott Nawy, Kennedy Center Room 525, 1410 Pelham Parkway South, Bronx, NY 10461. E-mail:Nawy@aecom.yu.edu.
REFERENCES
- 1.Dowling JE. The retina, an approachable part of the brain. Belknap; Cambridge, MA: 1987. [Google Scholar]
- 2.Gilbertson TA, Scobey R, Wilson M. Permeation of calcium ions through non-NMDA glutamate channels in retinal bipolar cells. Science. 1991;251:1613–1615. doi: 10.1126/science.1849316. [DOI] [PubMed] [Google Scholar]
- 3.Haynes LW, Kay AR, Yau KW. Single cyclic GMP-activated channel activity in excised patches of rod outer segment membrane. Nature. 1986;321:66–70. doi: 10.1038/321066a0. [DOI] [PubMed] [Google Scholar]
- 4.Hille B. Modulation of ion-channel function by G-protein-coupled receptors. Trends Neurosci. 1994;17:531–536. doi: 10.1016/0166-2236(94)90157-0. [DOI] [PubMed] [Google Scholar]
- 5.Jahr CE, Stevens CF. Calcium permeability of the N-methyl-d-aspartate receptor channel in hippocampal neurons in culture. Proc Natl Acad Sci USA. 1993;90:11573–11577. doi: 10.1073/pnas.90.24.11573. [DOI] [PMC free article] [PubMed] [Google Scholar]
- 6.Jan LY, Jan YN. l-Glutamate as an excitatory transmitter at the Drosophila larval neuromuscular junction. J Physiol (Lond) 1976;262:215–236. doi: 10.1113/jphysiol.1976.sp011593. [DOI] [PMC free article] [PubMed] [Google Scholar]
- 7.Jane DE, Thomas NK, Tse HW, Watkins JC. Potent antagonists at the l-AP4- and (1S,3S)-ACPD-sensitive presynaptic metabotropic glutamate receptors in the neonatal rat spinal cord. Neuropharmacology. 1996;35:1029–1035. doi: 10.1016/s0028-3908(96)00048-2. [DOI] [PubMed] [Google Scholar]
- 8.Jones MV, Westbrook GL. Shaping of IPSCs by endogenous calcineurin activity. J Neurosci. 1997;17:7626–7633. doi: 10.1523/JNEUROSCI.17-20-07626.1997. [DOI] [PMC free article] [PubMed] [Google Scholar]
- 9.Klee CB. Concerted regulation of protein phosphorylation and dephosphorylation by calmodulin. Neurochem Res. 1991;16:1059–1065. doi: 10.1007/BF00965851. [DOI] [PubMed] [Google Scholar]
- 10.Legendre P, Rosenmund C, Westbrook GL. Inactivation of NMDA channels in cultured hippocampal neurons by intracellular calcium. J Neurosci. 1993;13:674–684. doi: 10.1523/JNEUROSCI.13-02-00674.1993. [DOI] [PMC free article] [PubMed] [Google Scholar]
- 11.Mayer ML, Westbrook GL. Permeation and block of N-methyl-d-aspartic acid receptor channels by divalent cations in mouse cultured central neurones. J Physiol (Lond) 1987;394:501–527. doi: 10.1113/jphysiol.1987.sp016883. [DOI] [PMC free article] [PubMed] [Google Scholar]
- 12.Nakajima Y, Iwakabe H, Akazawa C, Nawa H, Shigemoto R, Mizuno N, Nakanishi S. Molecular characterization of a novel retinal metabotropic glutamate receptor mGluR6 with a high agonist selectivity for l-2-amino-4-phosphonobutyrate. J Biol Chem. 1993;268:11868–11873. [PubMed] [Google Scholar]
- 13.Nakanishi S. Metabotropic glutamate receptors: synaptic transmission, modulation, and plasticity. Neuron. 1994;13:1031–1037. doi: 10.1016/0896-6273(94)90043-4. [DOI] [PubMed] [Google Scholar]
- 14.Nawy S. The metabotropic receptor mGluR6 may signal through Go, but not phosphodiesterase, in retinal bipolar cells. J Neurosci. 1999a;19:2938–2944. doi: 10.1523/JNEUROSCI.19-08-02938.1999. [DOI] [PMC free article] [PubMed] [Google Scholar]
- 15.Nawy S. Regulation of the mGluR6 pathway by calcium in retinal bipolar cells. Soc Neurosci Abstr. 1999b;25:1431. [Google Scholar]
- 16.Nawy S, Jahr CE. Suppression by glutamate of cGMP-activated conductance in retinal bipolar cells. Nature. 1990a;346:269–271. doi: 10.1038/346269a0. [DOI] [PubMed] [Google Scholar]
- 17.Nawy S, Jahr CE. Time-dependent reduction of glutamate current in retinal bipolar cells. Neurosci Lett. 1990b;108:279–283. doi: 10.1016/0304-3940(90)90654-r. [DOI] [PubMed] [Google Scholar]
- 18.Nawy S, Jahr CE. cGMP-gated conductance in retinal bipolar cells is suppressed by the photoreceptor transmitter. Neuron. 1991;7:677–683. doi: 10.1016/0896-6273(91)90380-i. [DOI] [PubMed] [Google Scholar]
- 19.Nomura A, Shigemoto R, Nakamura Y, Okamoto N, Mizuno N, Nakanishi S. Developmentally regulated postsynaptic localization of a metabotropic glutamate receptor in rat rod bipolar cells. Cell. 1994;77:361–369. doi: 10.1016/0092-8674(94)90151-1. [DOI] [PubMed] [Google Scholar]
- 20.Pin JP, Duvoisin R. The metabotropic glutamate receptors: structure and functions. Neuropharmacology. 1995;34:1–26. doi: 10.1016/0028-3908(94)00129-g. [DOI] [PubMed] [Google Scholar]
- 21.Protti DA, Llano I. Calcium currents and calcium signaling in rod bipolar cells of rat retinal slices. J Neurosci. 1998;18:3715–3724. doi: 10.1523/JNEUROSCI.18-10-03715.1998. [DOI] [PMC free article] [PubMed] [Google Scholar]
- 22.Shiells RA, Falk G. Glutamate receptors of rod bipolar cells are linked to a cyclic GMP cascade via a G-protein. Proc R Soc Lond B Biol Sci. 1990;242:91–94. doi: 10.1098/rspb.1990.0109. [DOI] [PubMed] [Google Scholar]
- 23.Shiells RA, Falk G. Properties of the cGMP-activated channel of retinal on-bipolar cells. Proc R Soc Lond B Biol Sci. 1992;247:21–25. doi: 10.1098/rspb.1992.0004. [DOI] [PubMed] [Google Scholar]
- 24.Shiells RA, Falk G. Responses of rod bipolar cells isolated from dogfish retinal slices to concentration-jumps of glutamate. Vis Neurosci. 1994;11:1175–1183. doi: 10.1017/s0952523800006970. [DOI] [PubMed] [Google Scholar]
- 25.Shiells RA, Falk G. A rise in intracellular Ca2+ underlies light adaptation in dogfish retinal “on” bipolar cells. J Physiol (Lond) 1999;514:343–350. doi: 10.1111/j.1469-7793.1999.343ae.x. [DOI] [PMC free article] [PubMed] [Google Scholar]
- 26.Tachibana M, Okada T, Arimura T, Kobayashi K, Piccolino M. Dihydropyridine-sensitive calcium current mediates neurotransmitter release from bipolar cells of the goldfish retina. J Neurosci. 1993;13:2898–2909. doi: 10.1523/JNEUROSCI.13-07-02898.1993. [DOI] [PMC free article] [PubMed] [Google Scholar]
- 27.Taschenberger H, Juttner R, Grantyn R. Ca2+-permeable P2X receptor channels in cultured rat retinal ganglion cells. J Neurosci. 1999;19:3353–3366. doi: 10.1523/JNEUROSCI.19-09-03353.1999. [DOI] [PMC free article] [PubMed] [Google Scholar]
- 28.Thoreson WB, Miller RF. Membrane currents evoked by excitatory amino acid agonists in ON bipolar cells of the mudpuppy retina. J Neurophysiol. 1993;70:1326–1338. doi: 10.1152/jn.1993.70.4.1326. [DOI] [PubMed] [Google Scholar]
- 29.Thoreson WB, Velte TJ, Miller RF. Actions of phenylglycine derivatives at l-AP4 receptors in retinal ON bipolar cells. Neuropharmacology. 1995;34:27–34. doi: 10.1016/0028-3908(94)00110-e. [DOI] [PubMed] [Google Scholar]
- 30.Tian N, Slaughter MM. Pharmacological similarity between the retinal APB receptor and the family of metabotropic glutamate receptors. J Neurophysiol. 1994;71:2258–2268. doi: 10.1152/jn.1994.71.6.2258. [DOI] [PubMed] [Google Scholar]
- 31.Vardi N. Alpha subunit of Go localizes in the dendritic tips of ON bipolar cells. J Comp Neurol. 1998;395:43–52. [PubMed] [Google Scholar]
- 32.Vardi N, Morigiwa K. ON cone bipolar cells in rat express the metabotropic receptor mGluR6. Vis Neurosci. 1997;14:789–794. doi: 10.1017/s0952523800012736. [DOI] [PubMed] [Google Scholar]
- 33.Vardi N, Matesic DF, Manning DR, Liebman PA, Sterling P. Identification of a G-protein in depolarizing rod bipolar cells. Vis Neurosci. 1993;10:473–478. doi: 10.1017/s0952523800004697. [DOI] [PubMed] [Google Scholar]
- 34.Vernino S, Amador M, Luetje CW, Patrick J, Dani JA. Calcium modulation and high calcium permeability of neuronal nicotinic acetylcholine receptors. Neuron. 1992;8:127–134. doi: 10.1016/0896-6273(92)90114-s. [DOI] [PubMed] [Google Scholar]
- 35.von Gersdorff H, Schneggenburger R, Weis S, Neher E. Presynaptic depression at a calyx synapse: the small contribution of metabotropic glutamate receptors. J Neurosci. 1997;17:8137–8146. doi: 10.1523/JNEUROSCI.17-21-08137.1997. [DOI] [PMC free article] [PubMed] [Google Scholar]
- 36.Walters RJ, Kramer RH, Nawy S. Regulation of cGMP-dependent current in On bipolar cells by calcium/calmodulin-dependent kinase. Vis Neurosci. 1998;15:257–261. doi: 10.1017/s0952523898152057. [DOI] [PubMed] [Google Scholar]
- 37.Wang JH, Kelly PT. The balance between postsynaptic Ca(2+)-dependent protein kinase and phosphatase activities controlling synaptic strength. Learn Mem. 1996;3:170–181. doi: 10.1101/lm.3.2-3.170. [DOI] [PubMed] [Google Scholar]
- 38.Wang JH, Kelly PT. Postsynaptic calcineurin activity downregulates synaptic transmission by weakening intracellular Ca2+ signaling mechanisms in hippocampal CA1 neurons. J Neurosci. 1997;17:4600–4611. doi: 10.1523/JNEUROSCI.17-12-04600.1997. [DOI] [PMC free article] [PubMed] [Google Scholar]
- 39.Yakel JL. Calcineurin regulation of synaptic function: from ion channels to transmitter release and gene transcription. Trends Pharmacol Sci. 1997;18:124–134. doi: 10.1016/s0165-6147(97)01046-8. [DOI] [PubMed] [Google Scholar]
- 40.Yamashita M, Wassle H. Responses of rod bipolar cells isolated from the rat retina to the glutamate agonist 2-amino-4-phosphonobutyric acid (APB). J Neurosci. 1991;11:2372–2382. doi: 10.1523/JNEUROSCI.11-08-02372.1991. [DOI] [PMC free article] [PubMed] [Google Scholar]
- 41.Zagotta WN, Siegelbaum SA. Structure and function of cyclic nucleotide-gated channels. Annu Rev Neurosci. 1996;19:235–263. doi: 10.1146/annurev.ne.19.030196.001315. [DOI] [PubMed] [Google Scholar]
- 42.Zimmerman AL, Baylor DA. Cyclic GMP-sensitive conductance of retinal rods consists of aqueous pores. Nature. 1986;321:70–72. doi: 10.1038/321070a0. [DOI] [PubMed] [Google Scholar]