Abstract
Binocular neurons that are closely related to depth perception should respond selectively for stimuli eliciting an appropriate depth sensation. To separate perceived depth from local disparity within the receptive field, sinusoidal luminance gratings were presented within a circular aperture. The disparity of the aperture was coupled to that of the grating, thereby rendering unambiguous the psychophysical matching between repeating cycles of the grating. In cases in which the stimulus disparity differs by one horizontal period of the grating, the portion of the grating that locally covers a receptive field is binocularly identical, but the depth sensation is very different because of the aperture. For 117 disparity-selective V1 neurons tested in two monkeys, the overwhelming majority responded equally well to configurations that were locally identical but led to different perceptions of depth. Because the psychophysical sensation is not reflected in the firing rate of V1 neurons, the signals that make stereo matches explicit are most likely elaborated in extrastriate cortex.
Keywords: primary visual cortex, binocular disparity, stereopsis, correspondence problem, depth perception, behaving monkey
The extent to which the properties of disparity-selective cortical neurons match those of psychophysical depth perception remains unclear. Most existing data are compatible with the view that disparity-selective neurons in primary visual cortex (V1) perform a simple calculation of the disparity of features within their receptive fields (Ohzawa, 1998), yet several psychophysical properties of stereopsis require more complex processing. One of these is the ability to solve the stereo correspondence problem: image features on the left retina must be matched with appropriate features on the right retina before depth is perceived (Julesz, 1971; Marr and Poggio, 1979).
Whether single neurons respond only to appropriately matching stimuli is therefore an important test of how well they account for depth perception. The complexity of natural images is such that locally a binocular receptive field may receive stimulation from image features that fall in appropriate locations on each retina. On some occasions, those features are generated by a single object in the three-dimensional world (globally correct matches) and on other occasions not (false matches). If some disparity-selective neurons respond to these false matches, it suggests that an additional processing stage is required to understand why the false match is not perceived psychophysically. It has been argued that disparity selectivity in the response of complex cells to random dot stereograms (RDS; Poggio, 1984; Poggio et al., 1985) “assigns to the complex cell the unique property of solving the correspondence problem” (Poggio and Poggio, 1984). It has subsequently been pointed out that such responses to random dot stimuli are well explained on the basis of local matches alone (Qian, 1994; Fleet et al., 1996;Cumming and Parker, 1997), so by itself this test does not establish whether V1 neurons distinguish global from false matches.
Many neurons show disparity selectivity when stimulated by anticorrelated RDS (Cumming and Parker, 1997), which produce no sensation of depth (Julesz, 1971;Cogan et al., 1993; Cumming et al., 1998). This suggests that V1 neurons are not exclusively selective for psychophysically perceived matches. However, the majority of these neurons modulated their firing less strongly for anticorrelated RDS than for correlated RDS. This is at odds with predictions based on the simplest versions of local processing, but refinements of such local models may be able to accommodate this result. Thus the data need not imply a general ability to distinguish false matches from global matches. Rather, the interpretation depends on detailed comparisons of quantitative models.
These uncertainties could be avoided if it were possible to presentidentical features locally in the receptive field and yet arrange that these features were sometimes false matches but at other times globally correct matches. Psychophysically it is possible to arrange this by using a horizontal row of identical elements. When a disparity is applied to the whole row, depth is perceived at this disparity, even when the disparity is as large as the spacing between elements (McKee and Mitchison, 1988). Under these circumstances, the disparity measured between nearest identical elements on the retinas is different from the global disparity (perceived by the observer).
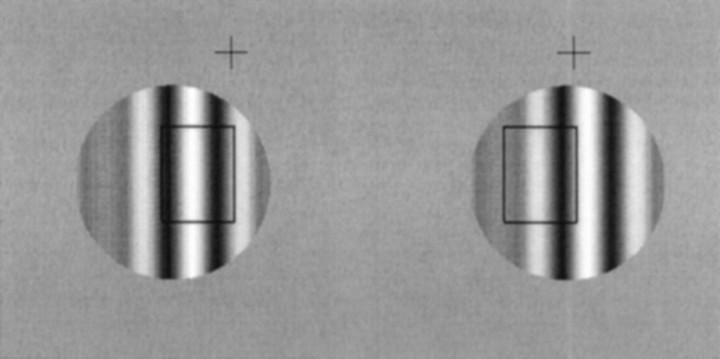
We used a modified version of this stimulus, consisting of circular patches of sinusoidal gratings, applying disparity to both the grating and the circular aperture. This produces a stable and robust sensation of depth (see Figure 1) and is highly effective in activating V1 neurons. With this stimulus, the distinction between globally correct and false matches can only be made by reference to the location of the aperture, which we arranged should lie outside the classical receptive field. Thus, binocular V1 neurons could make the distinction only if modulatory influences from beyond the classical receptive field (RF) (Maffei and Fiorentini, 1976; Gilbert and Wiesel, 1990; Sillito et al., 1995; Levitt and Lund, 1997) influence binocular interactions. This would allow disparity-selective neurons to respond preferentially to globally correct matches, as pointed out by Mitchison (1988).
Fig. 1.
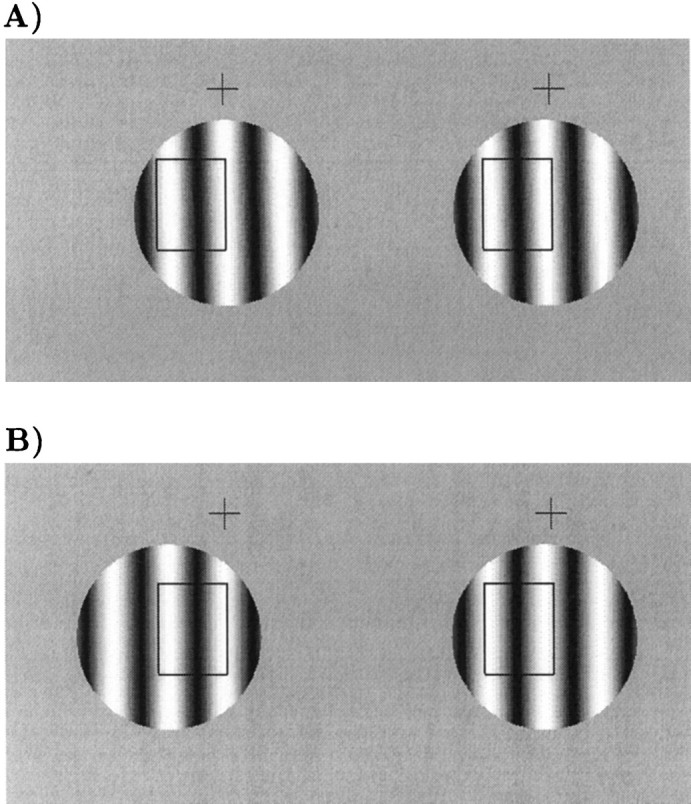
Example stimuli for free fusion. Therectangle shows diagrammatically the location of a putative receptive field. In A, corresponding parts of the stimulus overlie the receptive field. In B, the stimulus within the receptive field is identical to A, but noncorresponding parts of the stimulus are within the receptive field. Despite the fact that one of these stimuli is seen in front of the fixation cross and one is seen behind, the stimulus within the putative receptive field is the same. For clarity of exposition, the disparity is applied by translating only the left image in this diagram. During recording, disparity was applied with a symmetrical displacement of both monocular half images.
MATERIALS AND METHODS
A detailed description of the recording techniques has been given elsewhere (Cumming and Parker, 1999). In brief, monkeys were trained to fixate for fluid reward while viewing binocular stimuli via a mirror stereoscope. The positions of both eyes were recorded with scleral search coils. Extracellular action potentials were recorded via tungsten-in-glass microelectrodes (Merrill and Ainsworth, 1972), which were inserted transdurally before each recording session. Necessary surgery was performed under general anaesthetic, and all of the procedures complied with the UK Home Office regulations on animal experimentation.
Stimulus generation and selection. Stimuli consisted of high-contrast (99%), sinusoidal luminance modulations within a circular aperture. The rest of the screen was a uniform gray equal to the mean luminance of the grating (188 cd/m2). Linearity of the response of the display was measured with a Tektronix (Wilsonville, OR) J16 Photometer, and appropriate gamma correction was applied to ensure a linear response. The aperture was made sufficiently large to ensure that, at the largest disparity used, the minimum response field (MRF; determined with a binocular flashing bar at the optimal orientation) was covered by the grating in both eyes. The aperture was made no larger than this to ensure that the psychophysical percept remained robust: when a large number of grating cycles is visible there is an increased chance of perceiving matches at disparities other than that of the aperture (Hess and Wilcox, 1994; Prince and Eagle, 2000).
Typical stimulus configurations are shown in Figure1, which shows two different disparities, differing by one spatial period of the grating. Although the stimulus within a putative receptive field is identical, one of the stimuli appears in front of the fixation marker, and one appears behind. Note that with this arrangement the disparity of the bars of the grating is always consistent with the disparity of the aperture. Nonetheless, the local disparity of the bars has several alternative interpretations depending on how they are matched binocularly.
Before measuring responses to disparity, tuning curves were constructed for orientation, spatial frequency, and temporal frequency. The optimal values for each of these parameters were then used when constructing a disparity tuning curve (except that we did not use temporal frequencies >16 Hz, to keep temporal frequency substantially lower than the 72 Hz monitor refresh rate). The disparities tested were determined by the orientation and spatial frequency of the stimulus. First, the horizontal spatial period was calculated (the repeat period of a horizontal section through the stimulus). The disparity spacing was then set to one-fifth of this angle, and a minimum of seven (median, nine) stimuli were tested. The range of disparities included both the preferred disparity and one that differed from the preferred disparity by one horizontal period of the stimulus. Each stimulus was presented at least twice (median, five times).
The majority of neurons (106 of 117) were also tested with dynamic RDS presented against a midgray background. These were constructed with equal numbers of black and white square dots with dimensions 0.08 × 0.08° at an overall density of 25% and the same contrast (99%) as the gratings. Each stimulus consisted of a circular central region, which varied in disparity, and an annular surround region of fixed disparity. The central region was matched in size to the measured minimum response field (for details, see Cumming and Parker, 1999).
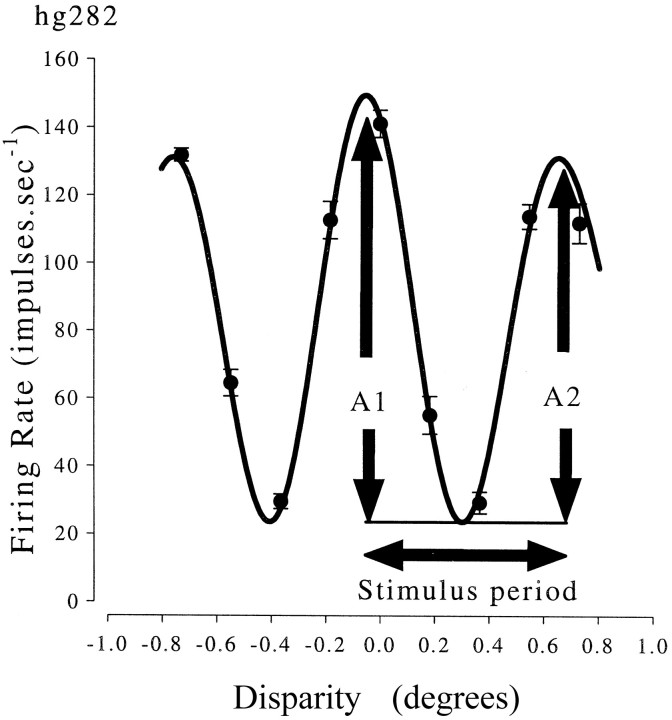
Data analysis and curve fitting. The measure of neural response used throughout was the mean firing rate over the 2 sec stimulus presentation (spikes were counted from 50 msec after the first video frame until 50 msec after the last video frame). The firing rate as a function of disparity was then fit with two curves. First, the data were fit with a sinusoid. If the firing rate were determined only by the local matches within the RF, the frequency of the fitted sinusoid would be predicted by the properties of the grating stimulus used (Ohzawa and Freeman, 1986a,Ohzawa and Freeman, 1986b). The second fit was intended to allow for the possibility that cells responded to both types of match but responded more strongly to the global match than to the false match. This curve was a sinusoid whose amplitude was modulated by a Gaussian envelope (an even-symmetric Gabor function; Figure2). For both curves, a least squares fit was produced by nonlinear regression (Numerical Algorithms Group, Oxford, UK).
Fig. 2.
Disparity selectivity of one neuron and the corresponding Gabor fit. The Gabor fit is constrained to be even-symmetric (the Gaussian is always centered at the peak). This fit is then used to compare the magnitudes of responses to locally identical stimuli (differing in disparity by one period of a horizontal cross section through the stimulus). The stimulus here was a 4 cycles per degree (cpd) grating oriented 70° from vertical, so the horizontal period was 0.25/cos(70°) = 0.73°. The peak-to-trough amplitude at the preferred disparity (A1) is compared with the peak-to-trough amplitude for the response to a disparity differing by one stimulus period (A2). This is expressed in percent attenuation: 100 ∗ (A1 − A2)/A1, and in this example is 15%. Note that if the period of the fitted Gabor is different from the stimulus period, the second peak in the Gabor fit is not at the disparity one stimulus period away from the peak. A2 is then smaller than the amplitude of the second peak in the Gabor fit.
An important assumption of regression analysis is that the residuals are constant. For the majority of cortical neurons, in which variability increases with mean firing rate (Dean, 1981;Tolhurst et al., 1981; Britten et al., 1993; Geisler and Albrecht, 1997), a simple least squares regression is inappropriate. Before using regression analysis, a transformation should be applied to the firing rates to render the residuals constant (Draper and Smith, 1998).Geisler and Albrecht (1997) have argued that the variance of firing in V1 is adequately described as linearly proportional to the mean, an observation we have confirmed for disparity-selective neurons in awake monkey V1 (Parker et al., 1998). Under these circumstances, the square root of the mean firing rate ( ) is the variable whose variance is constant (Armitage and Berry, 1994). Consequently all regression analysis (including ANOVA) was performed on . Note that the fitted curve was similarly transformed, so that the fitted sinusoid is = , where η is disparity, and m is the mean of the responses to all disparities. Thus firing rate is modeled as a linear sinusoidal function of disparity, but the transformation has the effect of reducing the weight given to the higher firing rates, compared with no transformation. (In practice, for this data set, using untransformed rates gives similar fits.)
Psychophysical training. Both animals were trained to make psychophysical judgments of depth. Initially, they were trained with random dot stimuli (Prince et al., 2000), consisting of a central region whose disparity was varied from trial to trial, and a surrounding annulus with a disparity that remained fixed at zero. If the animal successfully maintained fixation for the stimulus presentation period, the stimulus and fixation marker were replaced by two markers symmetrically above and below the former position of the fixation point. The animal signified whether the stimulus had a crossed or uncrossed disparity by moving fixation to the lower or upper marker, respectively. Only correct responses were rewarded. Once the animals performed this task reliably, they were tested with grating patches. Here, the task required a report of whether the grating patch was in front of or behind the fixation marker.
RESULTS
Psychophysical responses
First, we wished to confirm that the binocular matching of features in stimuli such as those shown in Figure 1 was perceptually unambiguous, for the animals from whom neurons were recorded. Some care is required in the choice of a stimulus configuration, particularly the size of the aperture. If the aperture is large relative to the period of the grating (i.e., many cycles of the grating are present), there is an increased possibility of some ambiguity in the psychophysical matching. In the extreme case of an infinitely large aperture, the matching becomes totally ambiguous. Human psychophysical studies have confirmed the importance of aperture size in controlling how features are matched in stimuli such as those used here (Hess and Wilcox, 1994; Prince and Eagle, 2000). To ensure that the matching was unambiguous, the aperture was made as small as possible while still ensuring that the region of overlap still covered the neuronal minimum response fields, even at the largest disparities used.
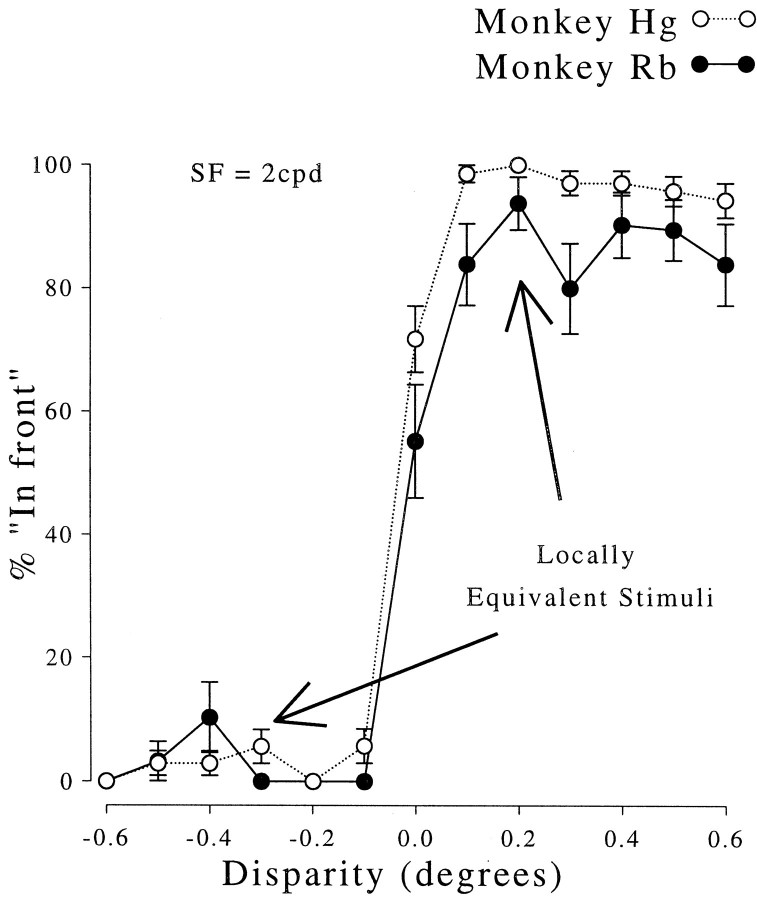
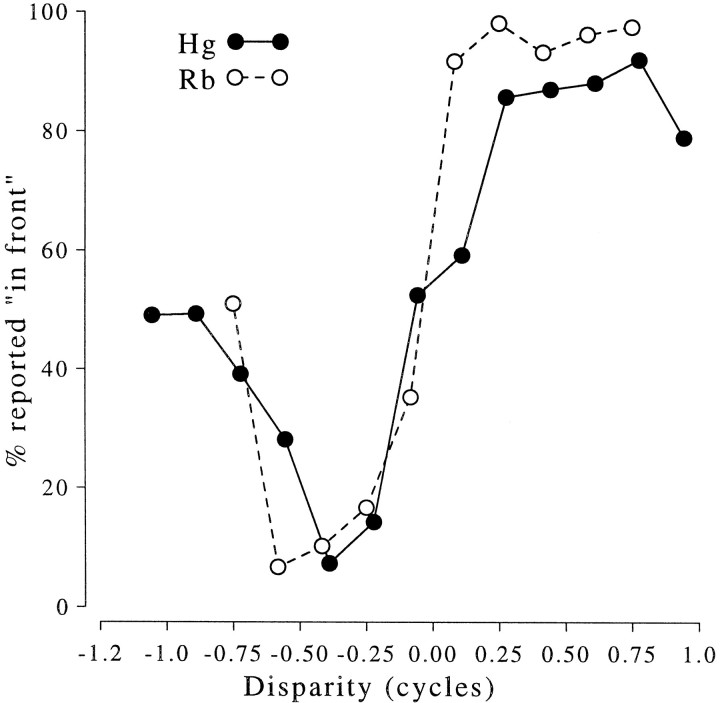
The psychophysical responses were measured with configurations identical to those used for some of the unit recordings. The results are shown in Figure 3, where it is clear that both animals successfully discriminate two configurations in which the central region is identical (see Fig. 1). These locally similar features do not produce a perception of depth at the equivalent disparity, so they are therefore “false” matches. With this distinction made on psychophysical grounds, it is then possible to consider whether disparity-selective neurons in the same animals respond to such false matches.
Fig. 3.
Psychophysical responses to gratings of the two monkeys used in this study. For all near (positive) disparities the animals consistently report seeing the grating patch in front of the fixation marker. Similarly, far disparities are consistently reported as behind. Error bars show SDs of the binomial distributions. Each stimulus was presented 50 times.
Single neuron responses
In recordings from 628 neurons in two animals (303 in Monkey Hg and 325 in Monkey Rb), we completed this experiment in 117 neurons (56 and 61 in Hg and Rb, respectively). One-way ANOVA showed a significant (p < 0.05) effect of disparity on in all these neurons. The receptive fields had eccentricities between 1 and 5°, and the mean receptive field diameter was 0.68°. Almost all of these neurons showed some orientation selectivity, and quantitative data on orientation tuning were analyzed for 83 of 117 neurons. The mean orientation bandwidth (half-width at half-height) was 23°, and there was a slight bias toward near-vertical orientations (47 of 83 neurons had preferred orientations within ±45° of vertical). At least one reason for this bias results from the stimuli used: if the preferred orientation had been near-horizontal, large disparities would have been required. This would have required the use of large stimuli, which has two hazards. First, large stimuli might overlap the fixation point, consequently disrupting the animals' control of vergence. Second, large stimuli would have many cycles of the grating within the aperture so that the perceptual response might become ambiguous. Of the 117 neurons, 37 were classified as simple, and 80 were classified as complex, on the basis of the modulation in their firing rate in response to the grating stimuli (Skottun et al., 1991; as modified byCumming et al., 1999).
The effect of disparity on firing rate is shown for one neuron from each animal in Figure 4. This shows the disparity tuning measured with both sinusoidal gratings and RDS. There are clearly two peaks in the tuning curves for sinusoidal stimuli, and only one peak in response to RDS. Thus one of the peaks represents activation by a false match. The responses were quantified by fitting a sinusoidal function to the firing rates. The period of the best-fitting sinusoid should equal the period of a horizontal cross section through the stimulus, i.e.:
where θ is the angle of the stimulus away from vertical.
Fig. 4.
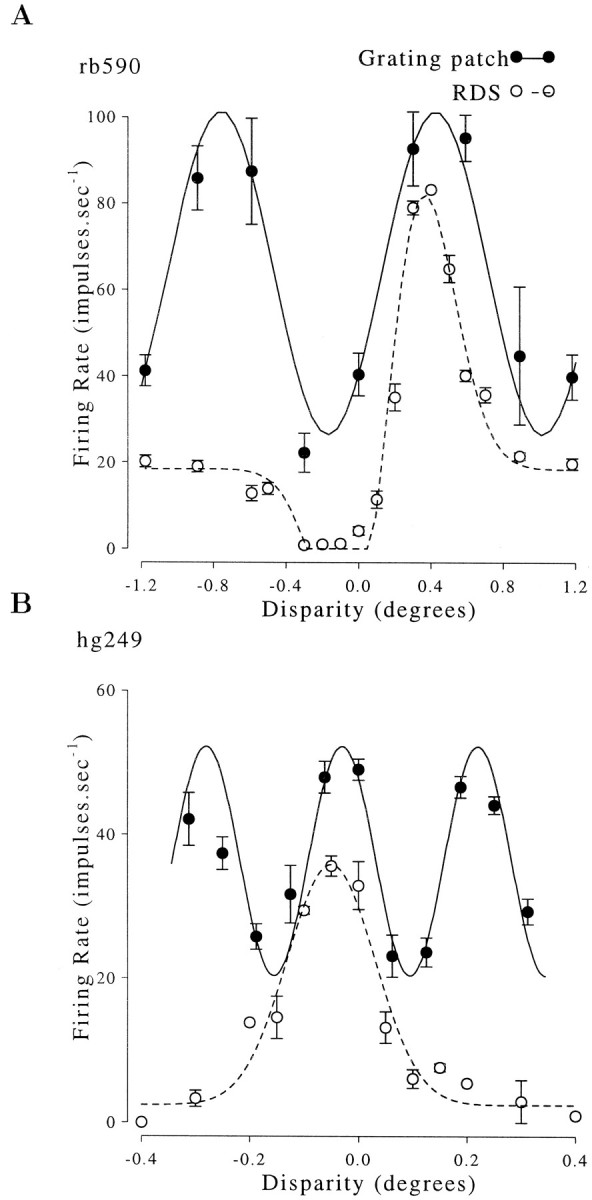
Responses of complex cells from each animal to both RDS and grating stimuli. The responses to random dot stimuli show one peak, whereas the responses to sinusoidal stimuli show two peaks. The responses to RDS are fitted with a Gabor function; the responses to gratings are fitted with a sinusoid. The spatial frequency of the sinusoid was free to vary, and the best fitting periods (1.21 and 0.263°) were very close to the respective horizontal periods of the stimuli (rb590: 4 cpd grating, oriented 78° away from vertical, horizontal period = 1.18°; Hg246: 4 cpd vertical grating, horizontal period = 0.25°). Error bars show SEM.
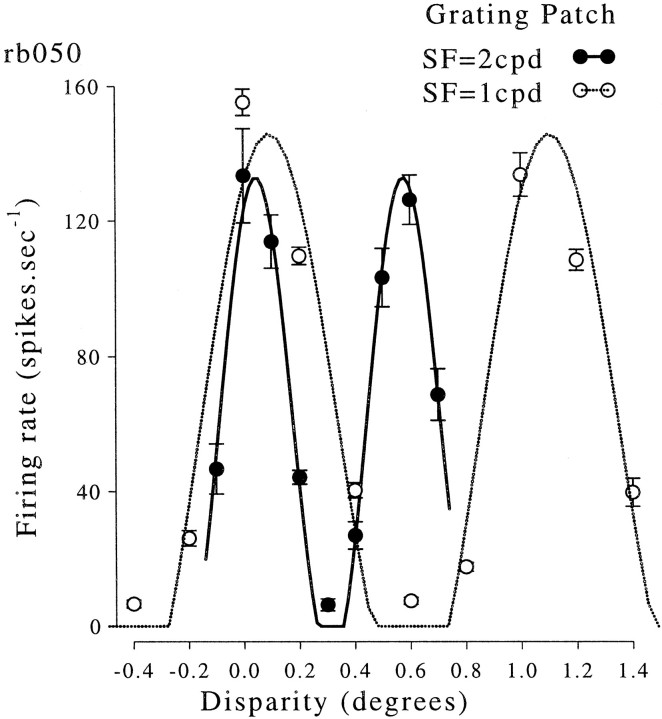
In 12 cells we also measured the response to stimuli of two different spatial frequencies (usually with a ratio 2∶1), as illustrated in Figure 5. The period of the disparity tuning function changed in the same way as the period of the stimulus. We compared the ratio of the fitted periods with the ratio of the stimulus periods. The expected value of this is unity, and the experimentally observed value was 0.95 (±0.11 SD). Thus the period of the fitted sinusoid reflects the horizontal period of the stimulus and is not determined by the receptive field structure. This is exactly what is expected if the neurons respond only to the disparity of the portion of the stimulus that falls within the classical receptive field.
Fig. 5.
Responses of one complex cell to circular patches of sinusoidal grating at different disparities. The stimulus orientation was vertical, and data were collected for two spatial frequencies. Both disparity tuning curves show two peaks, and the separation of the peaks is approximately equal to the spatial period of the stimulus. The continuous lines show sinusoidal functions fitted to the data. The spatial frequency of the fitted sinusoid was free to vary, so the best fitting frequency gives a measure of how closely the separation of the peaks matches the predicted value.
The results of fitting sinusoids to the data for all 117 cells are shown in Figure 6. Two points are contributed to this plot by each of the 12 cells for which the experiment was repeated at two spatial frequencies. There is clearly a very strong correlation between the period of the best-fitting sinusoid and the horizontal period of the stimulus, as expected if the neurons are activated by false matches in these stimuli.
Fig. 6.
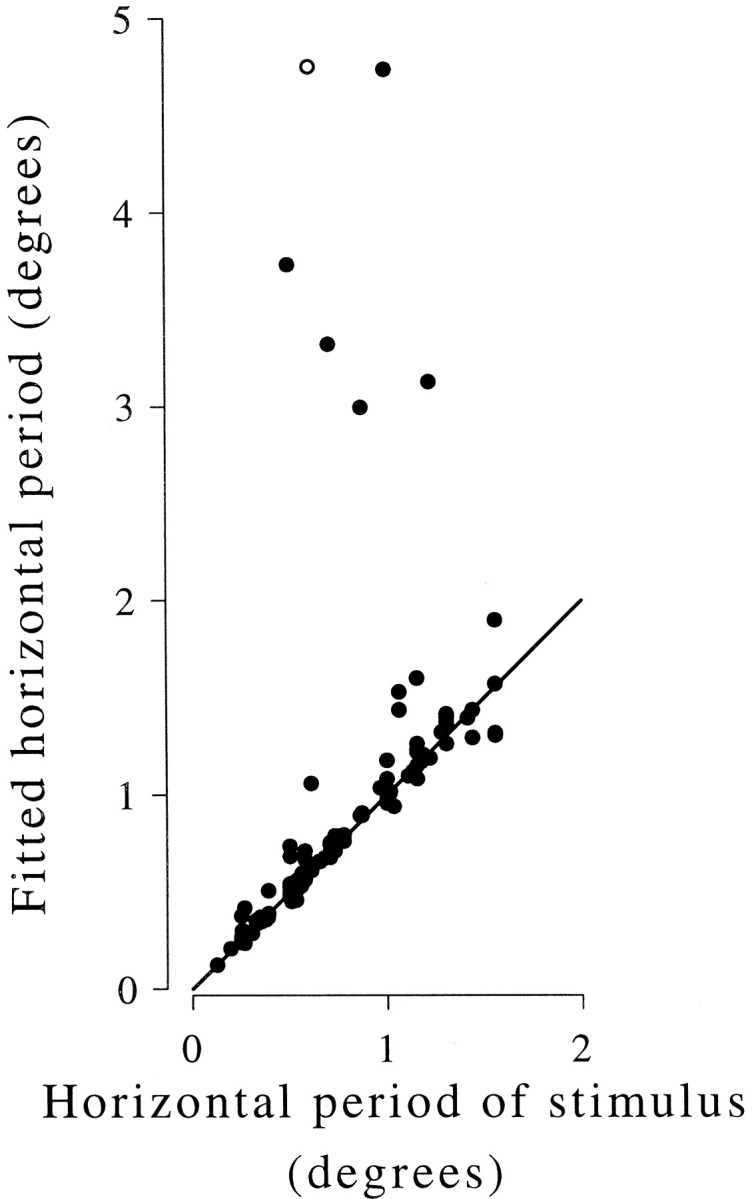
Disparity modulation is sinusoidal with the spatial period predicted by local matching. The period of the best fitting sinusoid is plotted against the horizontal spatial period of the stimulus. Results of 129 experiments are plotted from 117 neurons. Responses were measured at two spatial frequencies in 12 neurons. Most neurons show a close agreement between the expected and observed spatial period (solid line). Small deviations above this line could be the result of vergence eye movements (see Results). The open symbol shows the most extreme deviation (hg186), for which the tuning curve is shown in Figure8.
Note that small deviations from the predicted periodicity might occur as a result of vergence eye movements. If the animals tend to adjust vergence in response to the stimulus disparities, then the retinal disparity will be smaller than the nominal stimulus disparity. In this case, the tuning would be expected to modulate with a longer period than that specified by the stimulus. For each experiment we performed a linear regression of vergence angle on stimulus disparity. This revealed a small but highly significant tendency for the animals to converge with the stimulus disparity: the mean of the regression slopes was 0.027 (degrees of vergence per degree of disparity), with an SEM of 0.006 (n = 129; t test p < 0.0001). Some of the scatter of points around the identity line in Figure 6, particularly points that deviate slightly upward toward a longer fitted period, might therefore reflect the effect of vergence eye movements. A few neurons show large deviations from the predicted modulation as a function of disparity: for 6 of 129 cases, the fitted period is more than twice the predicted period. This size of deviation is much too large to be explained by random error or vergence eye movements, and other explanations must be sought.
The data in Figure 6 demonstrate that the overwhelming majority of neurons show periodic modulations in their disparity tuning, like those shown in Figures 2, 4, and 5. The spatial period of this modulation is close to that predicted from the orientation and spatial frequency of the stimulus. These tuning curves show multiple peaks, and the locations of the extra peaks correspond to disparities that place false matches within the receptive field. Although the locations of the extra peaks are well explained by this argument, this analysis does not address the question of whether the magnitude of the responses to false matches is the same as the response to globally correct matches. To examine this, even-symmetric Gabor functions were fit to the data, as shown in Figure 2.
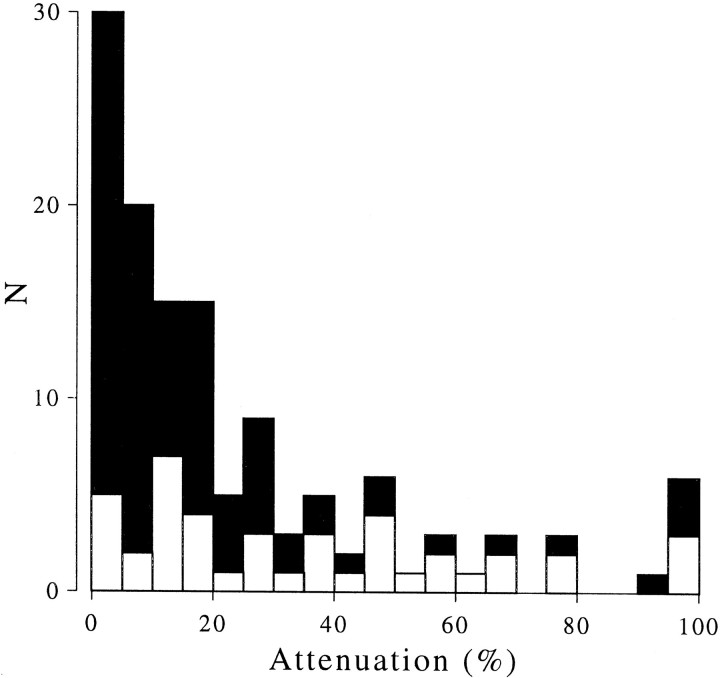
The spatial frequency of the fitted Gabor was free to vary, so that all of the tuning curves we saw could be well fit by this function. (On average, the Gabor accounted for 94% of the variance in the data sets.) The magnitude of the response at the center of the Gabor was then compared with the response to a disparity that differed by exactly one period of the stimulus (i.e., a stimulus that is identical within the minimum response field). The extent to which this second response was attenuated relative to the peak provides a measure of how far the tuning curves deviate from the simplest prediction. The example in Figure 2 shows an attenuation of 15%, slightly larger than the median of the population (14%). Figure 7 shows the distribution of this attenuation measure across the population of neurons recorded here. The great majority of neurons follow the simple pattern illustrated in Figures 2, 4, and 5: there is a periodic modulation at the predicted spatial frequency, and the responses to false matches are similar in magnitude to the responses to psychophysically perceived matches (81 of 129 experiments showed <20% attenuation).
Fig. 7.
Frequency distribution of response attenuation. This compares the response at the peak of the Gabor with the response to a stimulus differing in disparity by exactly one period of the stimulus. This is expressed as a percentage attenuation relative to the peak response. There is a large clustering of neurons in the region of zero attenuation. Note that attenuation is always calculated relative to the peak of the fitted Gabor, even though this peak could have occurred in response to a false match. Indeed comparison with the responses to RDS stimuli suggested that for many cells the largest peak was in response to a false match. Solid symbols show the data for strongly disparity-selective neurons (maximum response >20 spikes/sec and maximum response > twice minimum response). Open symbols show the remaining data.
Note that if the fitted period of modulation does not correspond to the horizontal period of the stimulus, then this analysis inevitably assigns the measured attenuation as large. This is because the attenuation is calculated for a disparity one stimulusperiod away from the Gabor center. In the specific case, when the fitted period is more than twice the stimulus period, there is no minimum in the region between the peak and the first false match, so the attenuation is 100%. All of the neurons for which the ratio (fitted period)/(predicted period) was >1.2 had attenuation values >35%. Hence, the attenuation measure captures both deviations from the expected period of the fit and variations in the amplitude of the peaks. The attenuation is always calculated relative to the largest peak (the center of the Gabor), wherever that happens to be. In some cases this peak appears to occur in response to falsematches (see Figure 8), so that by itself a substantial attenuation value does not necessarily indicate a preference for global matches over false matches.
Fig. 8.
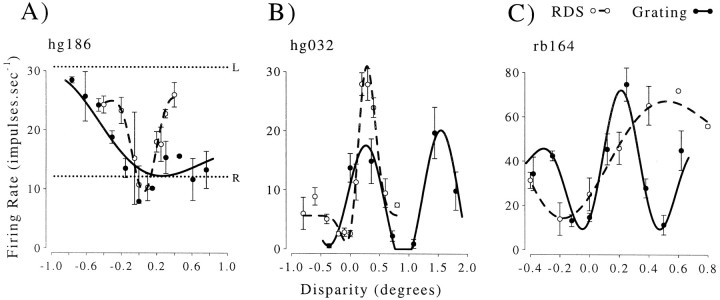
Responses of three neurons illustrating extreme deviations from simple sinusoidal tuning functions. In all three cases, the attenuation is much larger than the median of the population (14%), so these represent extreme examples. Nonetheless, when the responses to RDS are considered, it is hard to reconcile any of these cases with a specific selectivity for global matches. In each case, thesolid line shows the Gabor fit to the disparity tuning measured with gratings (solid symbols), and the dashed line shows a Gabor function fit to the disparity tuning measured with RDS (open symbols). A, Most extreme deviation observed in the entire data set (100% attenuation). The repeat period of the grating tuning curve is much larger than the stimulus period (ratio 7.8, shown with an open symbol in Fig. 6). The pattern of disparity selectivity for gratings is quite different from that observed in response to RDS. Note that the response to large positive disparities is similar to that for right eye monocular stimulation (dashed line), as if the grating patch no longer covered the RF in the left eye. B, Example in which the tuning function shows the expected periodicity but shows changes in the depth of modulation (27% attenuation). Note that the greatest firing rate is in response to a false match (assuming that the response to RDS indicates the global match normally signaled by this neuron). C, Example in which responses on either side of the central peak are attenuated (43%), yet once again the value of the preferred disparity is different from that shown in response to RDS. The pattern seen in response to the grating could occur if the area of binocular overlap in the stimulus no longer covers the neuron's binocular summation area. In all three cases shown here, the comparison of responses to gratings and RDS does not support the view that these neurons fire selectively for global stereoscopic matches.
The data in Figure 7 show that the great majority of neurons show periodic modulation in their disparity tuning, and that both the location and magnitude of the multiple peaks are as predicted on the basis that these neurons respond only to the disparity of local features within the receptive field. The distribution does show a small number of neurons that show substantial deviations from this pattern (large attenuation values), so it is possible that this represents a subgroup that is selective for global disparity matches.
Close inspection of the tuning curves suggests an alternative explanation. These large values of attenuation are all consistent with a possible failure to cover the receptive field fully with the binocular stimulus. When the responses to RDS stimuli are also examined, this explanation frequently turns out to be the more plausible. Figure 8 shows the data for gratings and RDS from three neurons with large attenuation values. All three neurons show a preferred disparity for the windowed grating stimulus that is different from the preferred disparity for the random dot stimuli. Thus, none of these data is consistent with a specific selectivity for globally correct binocular disparities. In all three cases, the pattern of results can actually be better explained by supposing that the area over which binocular interaction occurred was larger than our estimate of the classical receptive field. Using these stimuli, changes in disparity necessarily cause changes in the location of monocular stimuli: in the extreme, if the disparity was made very large, the stimulus might be moved off the monocular receptive field altogether. Such monocular artifacts are particularly hazardous here, because we tried to keep the stimuli as small as possible to ensure that the psychophysical sensation of depth was unambiguous. Because our estimate of RF size was the MRF (determined by hand plotting with a bar), it is quite possible that the area over which binocular interaction occurs was underestimated.
Figure 7 shows no evidence of two distinct groups of neurons. Neurons that respond differentially to identical stimuli within the receptive field frequently a show different disparity preference when tested with random dot patterns (Fig. 8). This group also tends to be less strongly modulated by disparity than the neurons that show more similar responses to false matches. (The solid symbols show neurons whose maximum response was >20 spikes/sec and more than double the minimum response.) Taken together, these observations suggest that the data in Figure 7 are best explained by supposing that, for these few neurons, our hand plotting of minimum response fields underestimated the area over which these neurons integrated binocular information. The available evidence strongly indicates that V1 neurons respond equally well to either false matches or globally correct matches provided that they adequately cover the binocular receptive field.
Responses to compound gratings
One feature of the grating stimuli deserves further consideration. Within the bounds of the MRF, the false matches and the global matches are identical. From one perspective it may seem unsurprising that identical stimuli within the MRF produce similar responses. An alternative view would be that, because stimuli outside the MRF can influence the activity of many V1 neurons (Maffei and Fiorentini, 1976; Gilbert and Wiesel, 1990;Sillito et al., 1995; Levitt and Lund, 1997), such influences might be critical in binocular vision. The present results demonstrate that such interactions are not exploited in solving the stereo correspondence problem. Whatever processes underlie our ability to perceive the stimuli in Figure 1 at different depths, they appear not to be reflected in the firing rate of disparity-selective neurons in V1.
This still leaves open the possibility that there are other circumstances in which V1 neurons might respond in a way that more closely resembles the psychophysical correspondence process. To examine this possibility, we investigated a subset of neurons with compound gratings composed of two spatial frequencies, as shown in Figure9. Now, when the whole pattern is displayed with a disparity equal to the spatial period of one sinusoidal component, the other sinusoidal component is at a different phase in the two eyes. Potentially, the information from the two spatial frequencies could be combined to assist in distinguishing global from false matches.
Fig. 9.
Example binocular compound grating. This is the sum of two gratings, with spatial frequencies in the ratio 3∶4. These were chosen to ensure that both component gratings produced disparity-selective responses in the neuron. The stimulus is shown here with a disparity equal to the spatial period of one of the component gratings. Thus, within the RF, one of the grating components is exactly aligned, but the other is not.
The most robust way to produce this effect psychophysically would be to add a component at a much lower spatial frequency than the optimum. However, if such a frequency was outside the spatial frequency pass band of the neuron, it is possible that it would be just as invisible to the receptive field as the aperture in the previous experiments. For all the cases examined here, we took the precaution of verifying that both component spatial frequencies were independently capable of exciting the neuron. Consequently, we chose two spatial frequencies close to the optimal, with frequencies in the ratio 3∶4, as illustrated in Figure 9. Human psychophysical experiments suggest that the information available in this kind of stimulus is sufficient to allow unambiguous stereo matching (Hess and Wilcox, 1994).
We investigated the psychophysical performance of human observers, as well as the two monkeys, using a modified version of the stimulus shown in Figure 9. The modification was required because the data in Figure 3demonstrate that the aperture effectively constrains matching, even for a single sinusoid. Clearly then, the psychophysical matches will be equally unambiguous with the stimuli illustrated in Figure 9. Because the intention of this experiment was to test the neurons with information within the receptive field that rendered the matches unambiguous, we tested observers with a stimulus that limited them to the same type of information. A compound grating was multiplied by a broad Gaussian envelope (SD = 3°), and disparities were applied only to the grating, not the envelope. In this stimulus the only information that distinguishes false from globally correct matches is the phase relationship between the two frequency components. For each stimulus, the animal made a forced choice front–back judgment. When the stimulus within the envelope was a single sinusoid, the animals' responses showed a periodicity at the spatial frequency of the stimulus. Figure 10 shows the responses to compound gratings. The animals are able to identify correctly the disparity of stimuli when either sinusoidal component alone would be unreliable, indicating that the information available to single neurons in Figure 11 is sufficient to disambiguate some stereo matches psychophysically. We have confirmed this result in three human observers.
Fig. 10.
Psychophysical responses to compound gratings, for the two animals from which neurons were recorded. The stimulus was a vertical compound grating multiplied by a Gaussian with an SD of 3°. The two component gratings had spatial frequencies of 3 and 4 cpd for monkey Rb and 6 and 8 cpd for monkey Hg. The disparity is expressed in multiples of the period of the grating of lower spatial frequency. Both animals correctly discriminate stimuli at ±0.5 cycles of disparity, indicating that they combine information across the two spatial frequencies to solve the correspondence problem.
Fig. 11.
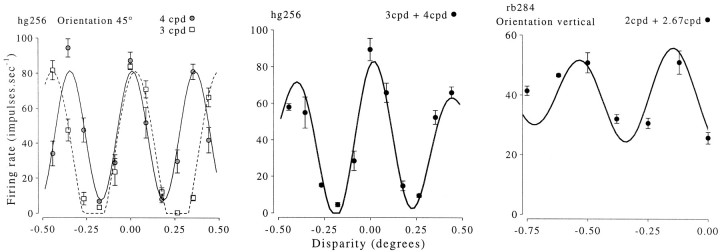
Effects of stimulating two disparity selective neurons with compound gratings. Left graph, Responses of one neuron to the two component gratings presented individually. The fitted curves are sinusoids in which the spatial period is fixed at the horizontal period of the stimulus. Center graph, Responses of the same cell to a stimulus that was the sum of the two stimuli in the left graph. The fitted curve shows a weighted linear sum of the two sinusoids fitted to the data in the left graphand accounts for 85% of the variance induced by disparity. Right graph, Responses to the compound grating of the cell for which the fitted curve was the worst in the data set. Despite this, the data are qualitatively similar to those in the center graph. There is a second peak in the tuning curve, which is smaller and broader than the peak near 0 disparity.
For recording experiments, stimuli like those in Figure 9 were used, in which both the aperture (outside the MRF) and the combination of the two gratings (inside the MRF) make the matches unambiguous. Disparity tuning curves were constructed for each component grating individually and for the compound gratings; all three stimulus types were interleaved. The compound gratings provide adequate information within the receptive field to distinguish false from global matches, so there should only be one peak in the disparity tuning curves for these stimuli, if these neurons are making use of this information. Figure 11illustrates the results for two cells, where it is clear that there are two peaks in the tuning curves, but the peaks are of different magnitudes. One would expect this difference in magnitude even if the neurons were simply signaling local matches: the large peak occurs where both grating components are at the optimal disparity, whereas at other disparities only one of the two components is at the optimal disparity. We attempted to describe the responses to the compound gratings by the weighted sum of the responses to the component gratings:
where η is the stimulus disparity, A1, φ1, A2, and φ2 are the amplitude and phase of the sinusoids fitted to the component gratings, 2πω1 and 2πω2are the horizontal periods of the component gratings, k is a weighting factor, and m is the mean rate about which the function modulates. Despite the fact that only two additional parameters (k and m) are introduced to fit the responses to compound gratings, the resulting fits describe the data well (see Figure 11). This experiment was performed on 13 cells, and on average the fit accounted for 80% of the variance in . Even in cases in which the fit was relatively poor, the data showed the same qualitative pattern: the second peak was smaller and broader than the peak nearer 0. This can be seen in Figure 11, right graph, which shows the worst fit in the data set (accounting for 64% of the variance in ). Even in this case there are clearly two peaks in the tuning curve, so qualitatively it appears as if the neuron responds to the false matches. The poor fit reflects only a quantitative failure to match the data exactly in this example. The data do not indicate any genuine ability to distinguish false matches from global ones.
The responses of single V1 neurons to disparity in compound gratings are well predicted by a linear combination of the responses to disparity in the component gratings. The psychophysical ability to combine information across components to disambiguate stereo matches reflects a nonlinear combination of the component gratings. This nonlinear combination is not reflected in the activity of single V1 neurons.
DISCUSSION
Stereo matching with extended sinusoidal gratings is inherently ambiguous: applying a disparity equal to the period of the grating produces an identical stimulus. We used an aperture to render the matching unambiguous in small circular patches of sinusoidal gratings. This was effective psychophysically for the animals used here and for human observers. We find that the response of the great majority of disparity-selective neurons in area V1 depends only on the local disparity of the stimulus within the RF, regardless of the position of the aperture. Thus these neurons are unable to distinguish false matches from global matches in these stimuli.
Several earlier studies have also demonstrated that gratings elicit periodic disparity responses (Ohzawa and Freeman, 1986a,Ohzawa and Freeman, 1986b;Wagner and Frost, 1994; Smith et al., 1997). However, in most cases this simply reflects the periodic nature of the stimulus: stimuli with disparities differing by one spatial period were identical stimuli. It is only the use of an aperture that renders these disparities discriminable and hence permits the distinction between psychophysical and neuronal responses.Wagner and Frost (1994) used an aperture in their study of neurons in the Wulst of the anesthetized barn owl. Usually, the aperture was fixed in size (10°), substantially larger than typical receptive fields. The stimuli therefore typically contained many cycles of grating, so it is not known whether they would have supported unambiguous psychophysical matching (the animals were not tested psychophysically).
In a small number of neurons, the responses did appear to distinguish between two configurations that were identical within the bounds of the receptive field. However, this interpretation depends critically on our assessment of the receptive field size. If we had underestimated the size of the receptive field, then it is quite possible that neural responses to two stimuli were different, because the stimulus within the real receptive field was different. Because our measure of receptive field extent depended on hand plotting with a bar, it is quite possible that MRF size was underestimated in this small fraction of neurons. Furthermore, recent studies have shown that RF size depends on the stimulus that is used to assess it (Sceniak et al., 1999). Thus there may be a discrepancy between the area over which binocular interaction occurs and the MRF measured with a bar, even if the latter is determined quantitatively.
Another discrepancy may arise from interactions along the length of the classical receptive field, parallel to the preferred orientation. Consider a neuron that shows end stopping (in both eyes). For the windowed grating stimuli, it is inevitable that globally correct matches correspond to elements of the same length in both eyes, whereas the false matches correspond to elements of different lengths. If neurons responded preferentially to stimuli that elicited similar degrees of end stopping in the two eyes, they could discriminate the false matches in this stimulus from the global matches. This is of especial concern with special complex cells (Palmer and Rosenquist, 1974; Gilbert, 1976), which respond preferentially to stimuli of a length shorter than the total spatial elongation of the receptive field. A more extensive comparison of receptive fields and summation areas for monocular and binocular stimuli would be necessary to substantiate this interpretation. The current data do not differentiate between this explanation and a simple failure to fill the monocular receptive fields.
In any case, the great majority of neurons show little attenuation, so these alternative mechanisms need not be invoked. These data indicate that the perceptual process that differentiates the stimulus configurations shown in Figure 1 is not reflected in the activity of disparity-selective neurons in primate V1. The parts of the stimulus that determine this psychophysical response lie outside the classical receptive field, so this result shows that the modulations produced by the nonclassical surround are not exploited to constrain stereo matching.
The present results complement our earlier study using anticorrelated RDS (Cumming and Parker, 1997), in which the false matches within the RF were quite different from the global matches. That study demonstrated that V1 neurons show disparity selectivity for these false matches, but the amplitude of the modulation was generally lower than for correlated RDS. Although this deviates from the predictions of a simple energy model (Ohzawa et al., 1990; Fleet et al., 1996; Cumming and Parker, 1997), it seems unlikely to reflect a mechanism that can identify false matches in correlated stereograms. A possible mechanism of this type is a “top-down” influence that reduces the response modulation because the animals do not perceive depth. The present results with grating patches argue against the presence of such a mechanism, because the majority of neurons respond equally well to the false matches.
The results reported here, combined with the earlier study of anticorrelated RDS, argue strongly that at least some of the psychophysical processes that solve the stereo correspondence problem are completed outside V1. This is important not only for depth perception but also for maintaining binocular single vision. Thus V1 neurons seem to be at best a preliminary stage in the representation of stereo disparity, analogous to their role in motion processing. For example, few neurons in V1 show pattern–motion selectivity when tested with plaid patterns, whereas a substantial fraction of neurons in MT do show selectivity for pattern motion (Movshon et al., 1985). It may be that for stereo, as for motion, responses in extrastriate cortical areas are able to match psychophysical responses more closely than responses in V1.
Footnotes
This work was supported by the Wellcome Trust. B.G.C. is a Royal Society University research fellow. We thank Owen Thomas for contribution to the psychophysical work and Simon Prince for critical evaluation of this paper.
Correspondence should be addressed to Dr. Bruce G. Cumming, University Laboratory of Physiology, Parks Road, Oxford, UK OX1 3PT. E-mail:bruce.cumming@physiol.ox.ac.uk.
REFERENCES
- 1.Armitage P, Berry G. Statistical methods in medical research. Blackwell; Oxford: 1994. [Google Scholar]
- 2.Britten KH, Shadlen MN, Newsome WT, Movshon JA. Responses of neurons in macaque MT to stochastic motion signals. Vis Neurosci. 1993;10:1157–1169. doi: 10.1017/s0952523800010269. [DOI] [PubMed] [Google Scholar]
- 3.Cogan A, Lomakin A, Rossi A. Depth in anticorrelated stereograms. Vision Res. 1993;33:1959–1975. doi: 10.1016/0042-6989(93)90021-n. [DOI] [PubMed] [Google Scholar]
- 4.Cumming BG, Parker AJ. Responses of primary visual cortical neurons to binocular disparity without the perception of depth. Nature. 1997;389:280–283. doi: 10.1038/38487. [DOI] [PubMed] [Google Scholar]
- 5.Cumming BG, Parker AJ. Binocular neurons in V1 of awake monkeys are selective for absolute, not relative, disparity. J Neurosci. 1999;19:5602–5618. doi: 10.1523/JNEUROSCI.19-13-05602.1999. [DOI] [PMC free article] [PubMed] [Google Scholar]
- 6.Cumming BG, Shapiro SE, Parker AJ. Disparity detection in anticorrelated stereograms. Perception. 1998;27:1367–1377. doi: 10.1068/p271367. [DOI] [PubMed] [Google Scholar]
- 7.Cumming BG, Thomas OM, Parker AJ, Hawken MJ. Classification of simple and complex cells in V1 of the awake monkey. Soc Neurosci Abstr. 1999;25:1548. [Google Scholar]
- 8.Dean AF. The variability of discharge of simple cells in the cat striate cortex. Exp Brain Res. 1981;44:437–40. doi: 10.1007/BF00238837. [DOI] [PubMed] [Google Scholar]
- 9.Draper NR, Smith H. Applied regression analysis, Ed 3. Wiley; New York: 1998. [Google Scholar]
- 10.Fleet DJ, Wagner H, Heeger DJ. Neural encoding of binocular disparity: energy models, positions shifts and phase shifts. Vision Res. 1996;36:1839–1857. doi: 10.1016/0042-6989(95)00313-4. [DOI] [PubMed] [Google Scholar]
- 11.Geisler WS, Albrecht DG. Visual cortex neurons in monkeys and cats: detection, discrimination, and identification. Vis Neurosci. 1997;14:897–919. doi: 10.1017/s0952523800011627. [DOI] [PubMed] [Google Scholar]
- 12.Gilbert CD. Laminar differences in receptive field properties of cells in cat primary visual cortex. J Physiol (Lond) 1976;268:391–421. doi: 10.1113/jphysiol.1977.sp011863. [DOI] [PMC free article] [PubMed] [Google Scholar]
- 13.Gilbert CD, Wiesel TN. The influence of contextual stimuli on the orientation selectivity of cells in primary visual cortex of the cat. Vision Res. 1990;30:1689–701. doi: 10.1016/0042-6989(90)90153-c. [DOI] [PubMed] [Google Scholar]
- 14.Hess RF, Wilcox LM. Linear and non-linear contributions to stereopsis. Vision Res. 1994;34:2431–2438. doi: 10.1016/0042-6989(94)90287-9. [DOI] [PubMed] [Google Scholar]
- 15.Julesz B. Foundations of cyclopean perception. University of Chicago; Chicago: 1971. [Google Scholar]
- 16.Levitt JB, Lund JS. Contrast dependence of contextual effects in primate visual cortex. Nature. 1997;387:73–76. doi: 10.1038/387073a0. [DOI] [PubMed] [Google Scholar]
- 17.Maffei L, Fiorentini A. The unresponsive regions of visual cortical receptive fields. Vision Res. 1976;16:1131–1139. doi: 10.1016/0042-6989(76)90253-4. [DOI] [PubMed] [Google Scholar]
- 18.Marr D, Poggio T. A computational theory of human stereo vision. Proc R Soc Lond B Biol Sci. 1979;204:301–328. doi: 10.1098/rspb.1979.0029. [DOI] [PubMed] [Google Scholar]
- 19.McKee SP, Mitchison GJ. The role of retinal correspondence in stereoscopic matching. Vision Res. 1988;28:1001–1012. doi: 10.1016/0042-6989(88)90077-6. [DOI] [PubMed] [Google Scholar]
- 20.Merrill EG, Ainsworth A. Glass-coated platinum-plated tungsten electrodes. Med Biol Eng. 1972;10:662–672. doi: 10.1007/BF02476084. [DOI] [PubMed] [Google Scholar]
- 21.Mitchison GJ. Planarity and segmentation in stereoscopic matching. Perception. 1988;17:753–782. doi: 10.1068/p170753. [DOI] [PubMed] [Google Scholar]
- 22.Movshon JA, Adelson EH, Gizzi MS, Newsome WT. The analysis of moving visual patterns. Exp Brain Res [Suppl] 1985;11:117–151. [Google Scholar]
- 23.Ohzawa I. Mechanisms of stereoscopic vision: the disparity energy model. Curr Opin Biol. 1998;8:509–515. doi: 10.1016/s0959-4388(98)80039-1. [DOI] [PubMed] [Google Scholar]
- 24.Ohzawa I, Freeman RD. The binocular organization of simple cells in the cat's visual cortex. J Neurophysiol. 1986a;56:221–242. doi: 10.1152/jn.1986.56.1.221. [DOI] [PubMed] [Google Scholar]
- 25.Ohzawa I, Freeman RD. The binocular organization of complex cells in the cat's visual cortex. J Neurophysiol. 1986b;56:243–259. doi: 10.1152/jn.1986.56.1.243. [DOI] [PubMed] [Google Scholar]
- 26.Ohzawa I, DeAngelis GC, Freeman RD. Stereoscopic depth discrimination in the visual cortex: neurons ideally suited as disparity detectors. Science. 1990;249:1037–1041. doi: 10.1126/science.2396096. [DOI] [PubMed] [Google Scholar]
- 27.Palmer LA, Rosenquist AC. Visual receptive fields of single striate cortical units projecting to the superior colliculus in the cat. Brain Res. 1974;67:27–42. doi: 10.1016/0006-8993(74)90295-9. [DOI] [PubMed] [Google Scholar]
- 28.Parker AJ, Pointon AD, Cumming BG. The variability of neuronal firing in cortical area V1 of awake, behaving monkeys. Perception [Suppl] 1998;27:9. [Google Scholar]
- 29.Poggio GF. Processing of stereoscopic information in primate visual cortex. In: Edelman G, Cowan WM, Gall WE, editors. Dynamic aspects of neocortical function. Wiley; New York: 1984. pp. 613–635. [Google Scholar]
- 30.Poggio GF, Poggio T. The analysis of stereopsis. Annu Rev Neurosci. 1984;7:379–412. doi: 10.1146/annurev.ne.07.030184.002115. [DOI] [PubMed] [Google Scholar]
- 31.Poggio GF, Motter BC, Squatrito S, Trotter Y. Responses of neurons in visual cortex (V1 and V2) of the alert macaque to dynamic random dot stereograms. Vision Res. 1985;25:397–406. doi: 10.1016/0042-6989(85)90065-3. [DOI] [PubMed] [Google Scholar]
- 32.Prince SJD, Eagle RA. Stereo correspondence in one-dimensional Gabor stimuli. Vision Res. 2000;40:913–924. doi: 10.1016/s0042-6989(99)00242-4. [DOI] [PubMed] [Google Scholar]
- 33.Prince SJD, Pointon AD, Cumming BG, Parker AJ. The precision of single neuron responses in V1 during stereoscopic depth judgments. J Neurosci. 2000;20:3387–3400. doi: 10.1523/JNEUROSCI.20-09-03387.2000. [DOI] [PMC free article] [PubMed] [Google Scholar]
- 34.Qian N. Computing stereo disparity and motion with known binocular properties. Neural Comput. 1994;6:390–404. [Google Scholar]
- 35.Sceniak MP, Ringach DL, Hawken MJ, Shapley R. Contrast's effect on spatial summation by macaque V1 neurons. Nat Neurosci. 1999;2:733–739. doi: 10.1038/11197. [DOI] [PubMed] [Google Scholar]
- 36.Sillito AM, Grieve KL, Jones HE, Cudeiro J, Davies J. Visual cortical mechanisms detecting focal orientation discontinuities. Nature. 1995;378:492–496. doi: 10.1038/378492a0. [DOI] [PubMed] [Google Scholar]
- 37.Skottun B, DeValois R, Grosof D, Movshon J, Albrecht D, Bonds A. Classifying simple and complex cells on the basis of response modulation. Vision Res. 1991;31:1079–1086. doi: 10.1016/0042-6989(91)90033-2. [DOI] [PubMed] [Google Scholar]
- 38.Smith EL, Chino YM, Ni J, Ridder WH, Crawford M. Binocular spatial phase tuning characteristics of neurons in the macaque striate cortex. J Neurophysiol. 1997;78:351–365. doi: 10.1152/jn.1997.78.1.351. [DOI] [PubMed] [Google Scholar]
- 39.Tolhurst DJ, Movshon JA, Thompson ID. The dependence of response amplitude and variance of cat visual cortical neurones on stimulus contrast. Exp Brain Res. 1981;41:414–419. doi: 10.1007/BF00238900. [DOI] [PubMed] [Google Scholar]
- 40.Wagner H, Frost B. Binocular responses of neurons in the barn owl's visual Wulst. J Comp Physiol [A] 1994;174:661–670. [Google Scholar]


