

Abstract
The brainstem contains the neural systems that are necessary for the generation of the state of paradoxical sleep (PS) and accompanying muscle atonia. Important for its initiation are the pontomesencephalic cholinergic neurons that project into the pontomedullary reticular formation and that we have recently shown increase c-Fos expression as a reflection of neural activity in association with PS rebound after deprivation in rats (Maloney et al., 1999). As a continuation, we examined in the present study c-Fos expression in the pontomedullary reticular and raphe neurons, including importantly GABAergic neurons [immunostained for glutamic acid decarboxylase (GAD)] and serotonergic neurons [immunostained for serotonin (Ser)].
Numbers of single-labeled c-Fos+ neurons were significantly increased with PS rebound only in the pars oralis of the pontine reticular nuclei (PnO), where numbers of GAD+/c-Fos+ neurons were conversely significantly decreased. c-Fos+ neurons were positively correlated with PS, whereas GAD+/c-Fos+ neurons were negatively correlated with PS, suggesting that disinhibition of reticular neurons in the PnO from locally projecting GABAergic neurons may be important in the generation of PS. In contrast, through the caudal pons and medulla, GAD+/c-Fos+ cells were increased with PS rebound, covaried positively with PS and negatively with the electromyogram (EMG). In the raphe pallidus-obscurus, Ser+/c-Fos+ neurons were positively correlated, in a reciprocal manner to GAD+/c-Fos+ cells, with EMG, suggesting that disfacilitation by removal of a serotonergic influence and inhibition by imposition of a GABAergic influence within the lower brainstem and spinal cord may be important in the development of muscle atonia accompanying PS.
Keywords: paradoxical sleep, REM sleep, c-Fos expression, reticular formation, raphe, GABAergic, serotonergic, sleep–wake states, muscle atonia
In early studies, it was demonstrated by Jouvet (1962) that the integrity of the pontomedullary reticular formation was critical for the occurrence of the state of paradoxical [or rapid eye movement (REM)] sleep (PS) and muscle atonia. Subsequent lesion studies indicated that the reticularis pontis caudalis (Jouvet, 1965) was the most important nucleus, yet others indicated that the reticularis pontis oralis was the critical nucleus for the generation of PS (Carli and Zanchetti, 1965). Transections through the upper pons (and not the caudal pons) produced a generalized and enduring muscular atonia, indicating that the oral pontine tegmentum also had the capacity to tonically inhibit muscle tonus (Keller, 1945). This influence was thought to be relayed through the medullary reticular formation, because stimulation therein was shown to produce generalized inhibition of postural tone (Magoun and Rhines, 1946). Indeed, multiple studies have since shown that stimulation in the medullary or pontine reticular formation produces motor inhibition (Chase et al., 1986; Lai and Siegel, 1988; Lai and Siegel, 1991;Kohyama et al., 1998) and that lesions in these areas diminish or eliminate muscle atonia (Jouvet and Delorme, 1965; Henley and Morrison, 1974; Sakai et al., 1979; Hendricks et al., 1982; Friedman and Jones, 1984; Schenkel and Siegel, 1989; Holmes and Jones, 1994). Acetylcholine (ACh) was revealed to be importantly involved (Domino et al., 1968;Karczmar et al., 1970; Jouvet, 1972), and when injected into the pontine reticular formation, its agonist carbachol was shown to elicit PS and/or muscle atonia (George et al., 1964; Mitler and Dement, 1974;Baghdoyan et al., 1984; Morales et al., 1987). Destruction by neurotoxic lesions of the pontomesencephalic cholinergic neurons, which innervate the pontomedullary reticular formation (Jones, 1990, 1991), resulted in a loss of PS and muscle atonia (Jones and Webster, 1988;Webster and Jones, 1988). Substantiating previous claims that presumed cholinergic neurons are active during and thus capable of stimulating PS (ElMansari et al., 1989; Kayama et al., 1992), we recently reported an increase in c-Fos expression, as a reflection of neural activity (Dragunow and Faull, 1989), in choline acetyltransferase (ChAT)-labeled pontomesencephalic neurons in association with PS rebound after deprivation in rats (Maloney et al., 1999).
As a continuation of this research, we sought in the present study to examine c-Fos expression in neurons of the pontomedullary reticular formation and raphe including, importantly, GABAergic and serotonergic neurons in association with PS. GABAergic neurons are codistributed with glutamatergic or serotonergic neurons and include both small locally projecting and larger distantly projecting neurons in some nuclei (Jones et al., 1991; Holmes et al., 1994; Ford et al., 1995;Jones, 1995). In addition to playing a role in the inhibition of pontomesencephalic monoaminergic neurons, as our previous c-Fos study suggested (Maloney et al., 1999), GABAergic neurons within the pontomedullary reticular formation and raphe could play important roles in mediating the central and peripheral changes associated with PS, including muscle atonia (Holmes and Jones, 1994). To assess potentially differential changes in c-Fos expression as a reflection of neural activity according to region and neurotransmitter, we examined c-Fos in glutamic acid decarboxylase (GAD)-immunostained neurons and serotonin (Ser)-immunostained neurons as well as other chemically unidentified neurons in the pontine and medullary reticular formation and raphe after PS deprivation and rebound as executed previously (Maloney and Jones, 1999; Maloney et al., 1999).
MATERIALS AND METHODS
Animals and surgery. Twelve male Wistar rats (Charles River, Montreal, Quebec, Canada), weighing ∼225 gm, were operated under barbiturate anesthesia (Somnotol; 67 mg/kg, i.p.) for the implantation of chronically in-dwelling electrodes for recording the electroencephalogram (EEG) and electromyogram (EMG), as described previously (Maloney et al., 1997, 1999). Animals were allowed 2 or 3 d recovery from surgery in the animal room before being placed in recording chambers for the duration of the experiment.
Recording and experimental procedures. For recording and experimentation, each rat was placed in a Plexiglas box that was contained within a larger electrically shielded recording chamber and maintained on a 12 hr light/dark cycle (with lights on from 7:00 A.M. to 7:00 P.M.). Animals had free access to food and water throughout the experiment.
The EEG and EMG signals were amplified using a Grass model 78D polygraph and subsequently sent to a computer (ALR 386SX) for analog-to-digital conversion, filtering, and storage on hard disk with the aid of Stellate Systems (Montreal, Quebec, Canada) computer software, as described previously (Maloney et al., 1997).
PS deprivation was performed using the flower pot technique that was previously shown to cause a fairly selective deprivation of PS with minimal stress in rats (Mendelson, 1974), as confirmed in its application according to the previously published procedure (Maloney et al., 1999). This deprivation procedure was reported to not be associated with changes in the weight of adrenal glands and thus to not be associated with severe levels of stress (Mendelson, 1974). Each rat was placed on an inverted flower pot that was just large enough (∼6.5 cm in diameter) to hold the animal and was surrounded by water. As previously described in detail (Maloney et al., 1999), the experimental protocol was performed over a 4 d period. Recordings were performed in the afternoon (∼12:00–3:00 P.M.) during the natural sleep period of the rat, for the 4 consecutive days. On day 1 (the first day before experimental manipulation), a baseline recording was performed on all animals. On the remaining three days of the experiment, the “condition” was varied for three different groups (with four animals per group): PS control (PSC), PS deprivation (PSD), and PS recovery (PSR). (1) For the control condition, the PSC animals remained on a bed of wood chips in their recording boxes for the 4 d. At the termination of the experiment on day 4, the PSC animals were anesthetized for perfusion (at ∼3:00 or 3:30 P.M.) after the afternoon recording period. (2) For the deprivation condition, the PSD animals were placed on flower pots for the second, third, and fourth days of the experiment. On day 4 after the recording period, the PSD animals were anesthetized for perfusion (at ∼3:30 P.M.), having been in the deprivation condition for ∼53 hr. (3) For the recovery condition, the PSR animals were also placed on flower pots for the second, third, and fourth days like the PSD animals. However, on day 4 after ∼50 hr of PS deprivation, the animals were returned to a dry bed of wood chips in their recording boxes to allow for recovery of PS. After the recording period, the animals were anesthetized for perfusion (at ∼3:00 P.M.), having been in the PS recovery condition for ∼3 hr after PS deprivation of ∼50 hr. The experiments were conducted using two recording chambers and thus on two animals at one time, running pairs of PSD and PSR or PSC and PSC animals.
Perfusion and fixation. The animals were killed under barbiturate anesthesia (Somnotol, ∼100 mg/kg) by intra-aortic perfusion of a fixative solution (containing 3% paraformaldehyde and 0.2% picric acid). The time between the barbiturate injection and initiation of the perfusion was ∼10 min.
Immunohistochemistry. Coronal sections were cut at 25 μm thickness on a freezing microtome. Up to six series of adjacent sections were collected every 200 μm for immunohistochemical processing using the peroxidase–antiperoxidase technique, as previously described (Maloney et al., 1999). For the immunostaining of c-Fos protein, an anti-c-Fos antiserum from sheep (Cambridge Research Biochemicals, Cheshire, UK) was used at a dilution of 1:3000. For neurotransmitter or enzyme immunostaining, rabbit anti-Ser antiserum (1:30,000; Incstar, Stillwater, MN) and rabbit anti-GAD antiserum (1:3000; Chemicon, Temecula, CA) were used. In all brains, one series of sections was immunostained for c-Fos alone using the brown, floccular reaction product 3,3′ diaminobenzidine (DAB) as chromogen. In other adjacent sections for the main experimental series, c-Fos was immunostained in combination with the neurotransmitter or enzyme (revealed with DAB) using a sequential procedure with c-Fos in the second position revealed with the blue granular reaction product benzidine dihydrochloride (BDHC). Controls in the absence of primary antibodies and in the presence of normal sera were routinely run with every single and dual immunostaining procedure to ensure the absence of nonspecific single or dual immunostaining. Brains from sets of PSD–PSR, which were run together experimentally, were processed in the same manner for immunohistochemistry together with an accompanying PSC brain.
Analysis of sleep–wake state data. The EEG was examined by off-line analysis on a computer screen and scored for sleep–wake state by visual assessment of EEG and EMG activity in 20 sec epochs using Eclipse software (Stellate Systems) for each 3 hr recording session, as described previously (Maloney et al., 1999). EMG amplitude was computed (for the total spectrum up to 58.0 Hz). As evaluated by EEG and EMG amplitudes, epochs were scored as one of the three major states—wake, slow wave sleep (SWS), or PS—or transition (t) stages, tSWS or tPS, between states (Maloney et al., 1999).
The number of epochs scored in each state was calculated as a percentage of total epochs in the 3 hr recording session for each day. An overall statistic was performed using a repeated-measures ANOVA with two trial factors (“state” and “day”) and one grouping factor (condition). Data were further analyzed per state by repeated-measures ANOVA tests with one trial factor (day) and one grouping factor (condition). When a main effect of condition was significant,post hoc tests were performed per day across groups (PSR or PSD vs PSC; PSR vs PSD) using Fisher's pairwise comparisons. In the case in which there was a significant difference between groups (condition), a repeated-measures ANOVA and a post hoc test were performed to examine whether there was a significant difference in state within groups by comparing the final recording day (day 4) and baseline day (day 1). Changes in average EMG activity (for the 3 hr recording period) were also assessed. For this purpose, EMG amplitude values were normalized by using the ratio of day 4 values to those of the baseline, day 1 values for the individual animals. Statistical tests of variance in EMG activity across conditions were performed for day 4 using one-way ANOVA with condition as a grouping factor and post hoc tests across conditions performed by Fisher's pairwise comparisons.
Analysis of immunohistochemical data. Cells in which the nucleus was immunostained for c-Fos were counted as c-Fos+, and their numbers were tabulated for each nucleus on each section with the aid of an image analysis system. The sections were viewed with a Leitz Orthoplan microscope equipped with an x/ymovement-sensitive stage and CCD camera attached to a computer. Single- and dual-immunostained cells were mapped using a computer-based image analysis system (Biocom, Paris, France) with a resident atlas of sections through the pontomedullary reticular formation (Jones, 1995). Single c-Fos-immunostained cells were mapped and counted unilaterally every 400 μm in the pons at representative stereotaxic levels corresponding approximately to anterior (A) 0.9 through to posterior (P) 0.3, and every 800 μm in the medulla at representative levels corresponding approximately to P 1.1 through to P 4.3 depending on the specific nucleus (Paxinos and Watson, 1986; Jones, 1995). Dual-immunostained GAD+/c-Fos+ cells were mapped and counted bilaterally every 400 μm at representative stereotaxic levels corresponding approximately to A 0.9 through to P 0.3, and every 800 μm in the medulla at representative levels corresponding approximately to P 1.1 through to P 4.3, depending on the specific pontine or medullary nuclei. Dual-immunostained Ser+/c-Fos+ cells were mapped and counted bilaterally every 400 μm through the pons and medulla at representative stereotaxic levels corresponding approximately to P 0.7 through to P 4.3 depending on the specific raphe or reticular nucleus. The experimenter (K.J.M.) mapping the cells did not have knowledge of the experimental group (PSD–PSR–PSC) to which the individual brains belonged. She was only given this information after all the data were tabulated on computer spreadsheets, when the condition group was inserted for the statistical analysis of the completed data set. Cell counts were tabulated automatically for each reticular and raphe nucleus and averaged for the pontine and medullary regions.
Whether the number of cells counted over multiple levels (sections) per nucleus per animal varied as a function of condition was examined for the regions of the pons and medulla. A one-way ANOVA was used, with condition and “nucleus” as grouping factors and “section” and “animal” as covariates. In the case of a significant main effect in a region, statistical differences in the number of cells in individual nuclei within the pontine or medullary regions were subsequently examined using a one-way ANOVA with condition as grouping factor and section and animal as covariates. When there was a significant main effect of condition, differences in cell counts between individual conditions were analyzed by post hoc tests using Fisher's pairwise comparisons. When differences in cell counts were significant across conditions in a region or nucleus, a general linear model was used to determine whether cell counts varied as a function of PS or other states. Using an interactive stepwise function with multiple linear regression, PS was entered as the independent variable, testing the hypothesis that it accounted significantly for a proportion of the variance in cell counts across conditions. In the absence of a significant relationship of cell counts with PS, SWS was stepped into the equation, and PS and SWS were evaluated in the model. In the absence of a significant relationship with PS and SWS, PS was stepped out and SWS was examined as a single independent variable. Finally, if these models including PS, PS, and SWS or SWS were not significant, wake was evaluated as the independent variable in the model. In addition, EMG was examined separately as the independent variable. For nuclei in which a significant relationship was found between the number of cells and state or EMG, simple correlations were examined. For these simple correlations, the total number of labeled cells counted was calculated for each reticular and raphe nucleus per animal by adding averaged bilateral counts across sections. To assess the correlation between total cell number and sleep states in the case in which a significant relationship was found with PS and SWS in the model, the standard partial regression coefficient for PS and SWS was calculated, and the residuals [PS(sws)] were plotted in the regression with cell number. All statistics were performed using Systat (version 9) for Windows (Evanston, IL). Figures were prepared for publication using CorelDraw (Ottawa, Ontario, Canada).
RESULTS
Sleep–wake state changes
In comparing the sleep–wake states across the two experimental and control conditions (PSR vs PSD; PSR and PSD vs PSC) or between day 4 (the final experimental day, representing the 3 hr period before anesthesia and perfusion) and day 1 (the first day before experimental manipulation, representing the baseline day or condition), it was apparent that there were marked and significant changes in the amount of time spent in PS (Table 1), as reported previously (Maloney et al., 1999). After ∼53 and 50 hr of deprivation, respectively, PS represented 0% in the PSD condition and ∼28% in the PSR condition, as compared with ∼15% in the PSC condition. There were also changes in the percentage of time spent in SWS and tPS in the PSR condition as compared with the PSD and PSC conditions, but they were not significant when compared with the respective baseline condition within each group (day 1). In the PSD condition, there was an increase in the percentage of time spent in wake as compared with the PSC and PSR conditions, which did represent a significant increase when compared with the respective baseline condition (day 1). However, PS was the one state that was significantly decreased in the deprivation and significantly increased in the recovery condition, as compared with both control and baseline conditions. The parallel changes in SWS and reciprocal changes in wake, nonetheless led us to consider the potential contribution of SWS or wake in addition to PS toward the changes in cell counts across conditions and thus to allow their inclusion in a general linear model used to examine whether changes in c-Fos-expressing cells across conditions were caused by changes in PS or other states.
Table 1.
The percentage of sleep–wake states on day 1 and day 4 for each condition (PSC, PSD, and PSR)
| Condition | State (%) | Day 1 | Day 4 |
|---|---|---|---|
| PSC | Wake | 21.82 ± 5.10 | 21.00 ± 2.00 |
| tSWS | 27.34 ± 1.43 | 30.00 ± 5.00 | |
| SWS | 11.50 ± 3.14 | 9.00 ± 3.00 | |
| tPS | 25.75 ± 4.21 | 25.00 ± 4.00 | |
| PS | 11.61 ± 2.31 | 14.50 ± 6.50 | |
| PSD | Wake | 21.65 ± 3.59 | 56.32 ± 3.87* |
| tSWS | 36.92 ± 7.02 | 34.00 ± 4.74 | |
| SWS | 8.64 ± 2.46 | 3.04 ± 1.53 | |
| tPS | 23.54 ± 5.01 | 6.25 ± 1.03(*) | |
| PS | 12.43 ± 4.57 | 0.0 ± 0.0* | |
| PSR | Wake | 20.89 ± 2.88 | 16.36 ± 1.28(†) |
| tSWS | 21.88 ± 3.83 | 10.75 ± 2.60 | |
| SWS | 25.64 ± 1.67 | 25.51 ± 1.06(*,†) | |
| tPS | 18.25 ± 4.42 | 19.25 ± 1.32(*,†) | |
| PS | 12.83 ± 1.23 | 28.37 ± 1.86*,† |
Percentage of time spent in wake, tSWS (transition from wake into SWS), SWS, tPS (transition from SWS to PS), and PS states during the ∼3 hr baseline recording period (day 1) and during the final ∼3 hr recording period before they were killed (day 4) for animals in each condition (mean ± SEM, n = 4). Significant differences per state between conditions were tested over the 4 d by repeated-measures ANOVA with one trial factor (day) and one grouping factor (condition). When there was a significant main effect for condition for one of the states, post hoc tests were performed per day across conditions using Fisher's pairwise comparisons. In the cases in which a significant difference between conditions was found, another post hoc test was performed by repeated measures to determine whether there was a significant difference between day 4 and day 1 within that group. Significant differences with respect to PSC is indicated by
p ≤ 0.05 and with respect to PSD by
p ≤ 0.05. Symbols in parentheses indicate a lack of significant difference relative to baseline, and those not in parentheses indicate a significant difference relative to baseline in the repeated-measures tests.
Average EMG activity was also found to vary significantly across conditions (F = 4.271, df = 2, 9,p ≤ 0.05), being higher in PSD (3.33 ± 0.96) than in PSC (1.18 ± 0.15, p ≤ 0.030) and PSR (1.26 ± 0.32, p ≤ 0.035), and not differing between the latter two groups. EMG was also examined independently as potentially contributing to variations in c-Fos-expressing cells across conditions.
c-Fos expression in the pontomedullary reticular formation and raphe
c-Fos expression was evident in single-immunostained cells (c-Fos+) in reticular and raphe nuclei through the pontine and medullary regions of all animals (Fig.1A). Dual-immunostained GAD+/c-Fos+ cells were evident in the oral and caudal pontine reticular nuclei (PnO and PnC), where they were codistributed with single-immunostained c-Fos+ cells (Fig. 1A). These GAD+/c-Fos+ cells were relatively small cells. Similar GAD+/c-Fos+ cells were seen among single-immunostained c-Fos+ cells in rostral and caudal medullary gigantocellular reticular nuclei (GiR and GiC). GAD+/c-Fos+ cells were also apparent in the α and ventral parts of the gigantocellular field (GiA and GiV) and in the medially adjacent magnus and pallidus-obscurus raphe nuclei (RM and RPO). In these regions, they included relatively large cells (Fig.1B) and were codistributed with large Ser+/c-Fos+ cells seen in adjacent sections (from RPO) (Fig. 1C).
Fig. 1.
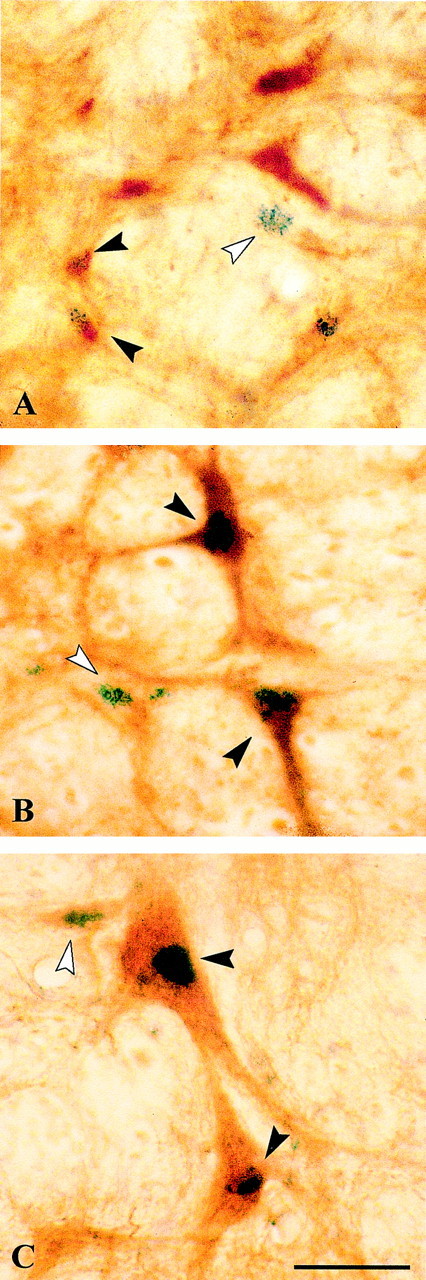
Photomicrographs of sections through the pontomedullary reticular formation, dual-immunostained for c-Fos (blue granular chromogen, BDHC) and either GAD (A, B) or serotonin (C) (brown chromogen, DAB). In the PnO (A), single c-Fos+ cells are distributed among dual-immunostained GAD+/c-Fos+ cells, as well as single GAD+ cells. In the RPO (B, C), single c-Fos+ cells are distributed among dual-immunostained GAD+/c-Fos+ (B) and Ser+/c-Fos+ (C) cells. White arrowheads indicate examples of single-immunostained c-Fos+ cells, and black arrowheadsindicate dual-immunostained cells. Scale bar, 25 μm.
c-Fos expression in the nuclei of the pontine reticular formation
The numbers of single-immunostained c-Fos+ cells in the pontine tegmentum varied significantly as a function of experimental condition and were significantly greater in the PSR condition than in the PSD and PSC conditions (Table 2, c-Fos+, Pons, Average). In the individual nuclei, the number varied significantly across conditions in the rostral, PnO, but not in the caudal, PnC, nucleus. Within the PnO, numbers of c-Fos+ cells were greater in the PSR condition in comparison to the PSD and PSC conditions (Table 2, Fig. 2) (c-Fos+, Pons, PnO). Across the pontine tegmentum (Average) and in the PnO, but not in the PnC, PS was found to account significantly for a portion of the variance in c-Fos+ cell counts and to covary positively with the counts in a linear regression model (Table 3). The number of dual-immunostained GAD+/c-Fos+ cells in the pontine tegmentum also varied significantly as a function of experimental condition yet differentially according to nucleus, as revealed by a significant interaction of condition with nucleus (Table 2, GAD+/c-Fos+, Pons, Average). In the PnO, the number of GAD+/c-Fos+ cells was lower in the PSR condition in comparison to the PSD and PSC conditions (Table 2, Fig. 2) (GAD+/c-Fos+, PnO). In the PnC, the number of GAD+/c-Fos+ cells was higher in the PSR condition in comparison to the PSD condition (Table 2, Fig. 3). In the PnO, PS alone did not account significantly for variance in GAD+/c-Fos+ cell counts but together with SWS did so in a linear regression model in which %PS covaried negatively and %SWS covaried positively with the cell counts (Table 3). In the PnC, the number of GAD+/c-Fos+ cells covaried positively and significantly with PS alone (Table 3).
Table 2.
Number of c-Fos+, GAD+/c-Fos+, or Ser+/c-Fos+ cells counted per section in nuclei of the pontomedullary reticular formation or raphe across PSC, PSD, and PSR groups
| c-Fos+2-a | Ser+/c-Fos+2-b | GAD+/c-Fos+2-b | ||||||||||
|---|---|---|---|---|---|---|---|---|---|---|---|---|
| PSC | PSD | PSR | F | PSC | PSD | PSR | F | PSC | PSD | PSR | F | |
| Pons | ||||||||||||
| PnO | 305.63 ± 44.71 | 382.18 ± 30.12 | 482.88 ± 17.63**,† | •• | 26.00 ± 2.00 | 19.08 ± 1.40* | 15.42 ± 2.01***,† | ••• | ||||
| PnC | 226.00 ± 21.84 | 222.13 ± 21.31 | 269.63 ± 30.91 | 16.50 ± 2.46 | 11.33 ± 2.09 | 20.83 ± 3.65†† | • | |||||
| Average2-c | 265.81 ± 26.14 | 302.13 ± 27.28 | 376.25 ± 32.46***,† | ••• | 21.25 ± 1.84 | 15.21 ± 1.37* | 18.13 ± 2.12 | (•) | ||||
| Medulla | ||||||||||||
| GiR | 153.25 ± 16.31 | 147.83 ± 11.97 | 178.67 ± 14.32 | 11.33 ± 2.09 | 5.50 ± 1.06 | 40.67 ± 10.40***,†† | ••• | |||||
| GiA | 66.07 ± 8.73 | 64.25 ± 9.61 | 85.17 ± 12.28 | 2.90 ± 0.29 | 5.43 ± 0.55*** | 5.30 ± 0.80*** | ••• | 8.75 ± 1.38 | 7.50 ± 2.31 | 25.42 ± 7.05**,†† | •• | |
| RM | 27.83 ± 2.66 | 30.00 ± 3.10 | 26.67 ± 3.25 | 2.31 ± 0.23 | 2.67 ± 0.31 | 2.46 ± 0.38 | 3.22 ± 0.48 | 3.44 ± 0.83 | 6.61 ± 0.73***,†† | ••• | ||
| GiC | 130.57 ± 16.50 | 133.50 ± 11.06 | 124.86 ± 9.89 | 10.20 ± 1.81 | 7.58 ± 1.25 | 19.00 ± 4.11*,†† | • | |||||
| GiV | 46.14 ± 10.32 | 50.86 ± 5.07 | 55.13 ± 6.65 | 4.30 ± 1.01 | 5.17 ± 1.52 | 4.00 ± 0.82 | ||||||
| RPO | 14.29 ± 2.85 | 18.25 ± 2.73 | 18.50 ± 2.75 | 3.57 ± 0.42 | 4.21 ± 0.51 | 2.88 ± 0.43 | 3.30 ± 0.68 | 1.83 ± 0.39 | 3.25 ± 0.80 | |||
| Average2-c | 75.61 ± 8.24 | 75.43 ± 7.29 | 84.57 ± 8.54 | 2.83 ± 0.18 | 4.00 ± 0.29*** | 3.52 ± 0.36* | ••• | 6.63 ± 0.65 | 5.04 ± 0.57 | 15.73 ± 2.49***,††† | (•••) | |
Cell counts were taken from adjacent series of sections cut at 25 μm and collected at 200 μm intervals. A significant main effect for condition is indicated by •, ••, or ••• (p≤ 0.05, 0.01, or 0.001) in the column under F, and placed in parentheses when there was a significant interaction with nucleus for the Average across nuclei. Individual ANOVAs were also performed for each nucleus with condition as grouping factor and section and animal as covariates (•, ••, or •••, p ≤ 0.05, 0.01, or 0.001). With significant main effects of condition, post hoc tests between individual conditions were performed using Fisher's pairwise comparisons. A significant difference with respect to PSC is indicated by *, **, or *** (p ≤ 0.05, 0.01, or 0.001) and with respect to PSD by †, ††, or ††† (p ≤ 0.05, 0.01, or 0.001).
c-Fos+ cell numbers correspond to the mean ± SEM of the average number of single-immunostained c-Fos+ cells counted unilaterally per section per nucleus in four animals per condition. c-Fos+ cells were counted as follows: in two sections at 400 μm intervals for the PnO (at ∼A0.9 and ∼A0.5) and PnC (at ∼A0.1 and ∼P0.3), in three sections at 800 μm intervals for the GiR, GiA, and RM (at ∼P1.1, ∼P1.9, and ∼P2.7), and in two sections at 800 μm intervals for the GiC, GiV, and RPO (at ∼P3.5 and ∼P4.3).
Ser+/c-Fos+ and GAD+/c-Fos+ cell numbers correspond to the mean ± SEM of the average number of dual-immunostained cells counted bilaterally per side per section per nucleus in three animals per condition. Ser+/c-Fos+ cells were counted as follows: in six sections at 400 μm intervals for the GiA and RM (between ∼P0.7 and ∼P2.7) and in four sections for the RPO (between ∼P3.1 and P4.3). GAD+/c-Fos+ cells were counted as follows: in two sections at 400 μm intervals for the PnO (at ∼A0.9 and ∼A0.5) and PnC (at ∼A0.1 and ∼P0.3), in three sections at 800 μm intervals for the GiR, GiA, and RM (at ∼P1.1, ∼P1.9, and ∼P2.7), and in two sections at 800 μm intervals for the GiC and GiV (at ∼P3.5 and ∼P4.3).
Statistical tests of the variation in the average cell numbers across condition were performed using a one-way ANOVA with condition and nucleus as grouping factors, and section and animal as covariates.
Fig. 2.

Computerized atlas figure through the oral pons (∼A0.5) showing the PnO, where c-Fos+ cells (indicated by x) and GAD+/c-Fos+ cells (triangles) were mapped in representative animals from PSD (left) and PSR (right) groups. Note apparent greater number of c-Fos+ cells and lesser number of GAD+/c-Fos+ cells in the PSR condition compared with the PSD condition.PnO, Pontine reticular nucleus, pars oralis.
Table 3.
Relationship between the number of c-Fos+, GAD+/c-Fos+, or Ser+/c-Fos+ cell counts and states (or EMG) as assessed by a linear regression model (testing for %PS, %PS and %SWS, %SWS or %Wake, or for EMG)
| c-Fos+ | Ser+/c-Fos+ | GAD+/c-Fos+ | |||||||
|---|---|---|---|---|---|---|---|---|---|
| State | r2 | F | State | r2 | F | State | r2 | F | |
| Pons | |||||||||
| PnO | +PS | 0.25 | 7.03* | −PS + SWS | 0.41 | 11.64*** | |||
| PnC | — | — | — | +PS | 0.13 | 5.28* | |||
| Average | +PS | 0.11 | 5.69* | — | — | — | |||
| Medulla | |||||||||
| GiR | +PS | 0.25 | 11.14** | ||||||
| (−EMG | 0.25 | 11.14**) | |||||||
| GiA | +Wake | 0.04 | 4.05* | +PS | 0.17 | 6.81* | |||
| RM | — | — | — | +PS | 0.13 | 7.91** | |||
| (−EMG | 0.10 | 5.70**) | |||||||
| GiC | +PS | 0.16 | 6.24* | ||||||
| (−EMG | 0.11 | 4.09*) | |||||||
| GiV | — | — | — | ||||||
| RPO | — | — | — | −Wake | 0.12 | 4.43* | |||
| (+EMG | 0.07 | 4.86*) | (−EMG | 0.13 | 4.57*) | ||||
| Average | +Wake | 0.02 | 5.43* | +PS | 0.08 | 18.39*** | |||
| (−EMG | 0.22 | 11.59***) | |||||||
A general linear model was used to test whether cell counts varied significantly as a function of state and/or EMG. Using multiple linear regression with an interactive stepwise procedure for adding or removing variables, a model was examined in all regions in which a significant main effect of condition was found (see Table 2). To test the principal hypothesis that cell counts varied as a function of PS, %PS alone was evaluated first. If not significant, %SWS was stepped in, and the regression for %PS and %SWS was evaluated in the model. If not significant, %SWS alone was evaluated. When none of the sleep states (PS, PS and SWS or SWS alone) were significant, %wake alone was tested in the model. %EMG was also evaluated independently. Significant models are indicated with the state(s) showing the sign (+ or −) of the covariation, the squared regression coefficient (variance), and the F value of the model. Dashes indicate a lack of significance for any of the states and EMG tested. Probabilities are indicated as *, **, or ***, (p ≤ 0.05, 0.01, or 0.001).
Fig. 3.

Computerized atlas figure through the caudal pons and medulla at ∼P 0.3 (top) showing the PnC nucleus, at ∼P 1.9 (middle) showing the GiR, GiA, and RM nuclei, and at ∼P 3.5(bottom) showing the GiC, GiV, and RPO nuclei. GAD+/c-Fos+ cells (triangles) were mapped in a representative animal from PSD (left) and PSR (right) groups. Note the apparent greater number of GAD+/c-Fos+ cells in the PSR condition compared with the PSD condition in most nuclei. PnC, Pontine reticular nucleus, pars caudalis; GiR, gigantocellular reticular nucleus, pars rostralis; GiA, gigantocellular reticular nucleus, pars α; RM, raphe magnus nucleus; GiC, gigantocellular reticular nucleus, pars caudalis; GiV, gigantocellular reticular nucleus, pars ventralis; RPO, raphe pallidus-obscurus nucleus.
The variation of cell counts as a function of PS in the PnO was further substantiated by simple correlations using total cells counted per nucleus per animal. The total number of c-Fos+ cells was positively correlated with %PS, whereas the total number of GAD+/c-Fos+ cells was reciprocally negatively correlated with %PS after partialing out the correlation with %SWS (PS[sws]) (Fig.4).
Fig. 4.

Linear regression plots and coefficients (with significance indicated by *p ≤ 0.05) for the PnO of the total number of single-immunostained c-Fos+ cells (left) as a function of the percentage of time spent in PS (df = 11) and the total number of dual-immunostained GAD+/c-Fos+ cells (right) as a function of the standardized residuals of PS after partialing out the regression with SWS [PS(sws), df = 9]. The bar charts in themiddle show the average total number of c-Fos+ cells (top left) and GAD+/c-Fos+ cells (top right) and the percentage of time spent in PS (bottom) for the three different conditions—PSC, PSD, and PSR. According to the statistics detailed in Table 2, there was a significant main effect of condition for the number of c-Fos+ cells and GAD+/c-Fos+ cells, and as detailed in Table 1, for the %PS.
c-Fos expression in the nuclei of the medullary reticular formation and raphe
The numbers of single-immunostained c-Fos+ cells in the medullary reticular formation (GiR, GiA1 GiC, and GiV) and raphe (RM and RPO) did not vary significantly as a function of experimental condition (Table 2, c-Fos+, Medulla).
The numbers of dual-immunostained Ser+/c-Fos+ cells in the medullary reticular and raphe nuclei did vary significantly as a function of experimental condition (Table 2, Ser+/c-Fos+, Medulla, Average). There was a significant increase in the PSD condition in comparison to the PSC condition for the region and in the GiA nucleus as revealed bypost hoc tests for the individual nuclei. The numbers of Ser+/c-Fos+ cells were also higher in the PSR condition in comparison to the PSC condition for the region and in the GiA nucleus and did not differ significantly from the PSD condition for the region or in any nucleus (presented in Table 2; not shown in schematic figures). In an examination of the relationship between the cell counts and sleep state, it was found that neither for the medulla (Average) nor any of the individual nuclei did sleep state (PS, PS and SWS, or SWS) significantly account for any proportion of the variance in Ser+/c-Fos+ cell counts. However, wake was found to account for a significant although small proportion of the variance for the medulla (Average) and the GiA nucleus and to covary positively therein with cell counts in a linear regression model. EMG was found to covary positively with the number of Ser+/c-Fos+ cells in the RPO.
The numbers of dual-immunostained GAD+/c-Fos+ cells in the medulla varied significantly as a function of condition. The cell counts for the PSR condition were higher compared with those of the PSD and PSC conditions (Table 2, GAD+/c-Fos+, Medulla, Average). There was also a significant interaction of condition with nucleus. Across the individual nuclei, the numbers varied significantly as a function of condition in the reticular and raphe nuclei of the GiR, GiA, GiC, and RM. The variation was evident as higher numbers of cells in the PSR condition as compared with the PSD and PSC conditions within these nuclei (Table 2, Fig. 3). In a linear regression model, PS significantly accounted for a proportion of the variance in GAD+/c-Fos+ cell counts for the entire medulla (Medulla, Average) and covaried positively with cell counts in the model (Table 3). This relationship was also significant in nuclei within the GiR, GiA, GiC, and RM. In the caudal medulla, cell counts did not vary significantly as a function of PS, PS and SWS or SWS, but did so with wake as the independent variable in the RPO. Across the medulla (Average), in the GiR and GiC reticular nuclei and in the RM and RPO raphe nuclei, EMG amplitude also significantly accounted for a proportion of the variance and covaried negatively with the GAD+/c-Fos+ cell counts in the linear regression model (Table 3).
In the RPO, where EMG covaried significantly with Ser+/c-Fos+ and GAD+/c-Fos+ cell counts, simple correlations involving the total number of cells counted per animal showed a positive correlation of EMG with Ser+/c-Fos+ cell numbers and a reciprocal negative correlation with GAD+/c-Fos+ cell numbers, as illustrated in Figure5.
Fig. 5.

Linear regression plots and coefficients (with significance indicated by *, **, *** as p ≤ 0.05, 0.01, or 0.001) for the RPO of the total number of dual-immunostained Ser+/c-Fos+ cells (left) and GAD+/c-Fos+ cells (right) with EMG activity (df = 9). The bar charts in the middle show the number of Ser+/c-Fos+ cells (top left) and GAD+/c-Fos+ cells (top right) and EMG activity (bottom) for the three different conditions—PSC, PSD, and PSR. As detailed in Table2, neither the Ser+/c-Fos+ cell counts nor GAD+/c-Fos+ counts differed significantly across conditions, yet they varied significantly as a function of EMG. As presented in the text, EMG values (normalized as a ratio of baseline) differed significantly across conditions and between groups.
DISCUSSION
The present results showed that through the pontomedullary reticular formation and raphe, the one region where c-Fos+ cells were significantly increased in number in association with an increase in PS was the PnO. In this same region, GAD+/c-Fos+ cells were significantly decreased, whereas in other regions including the PnC and medulla, they were significantly increased in association with PS. Through the medullary reticular and raphe nuclei, Ser+/c-Fos+ cells varied in number, but not as a function of PS, instead as a function of wake or EMG, significantly increasing in the RPO with increasing muscle tonus. Reciprocally, GAD+/c-Fos+ cells in the same areas significantly decreased in number with increasing muscle tonus. These results suggest a differential involvement of reticular and raphe nuclei according to both region and neurotransmitter in the generation of sleep–wake states and associated changes in muscle tonus.
To be noted, the present results are interpreted according to the assumption that c-Fos expression reflects increased neuronal discharge, although it can also reflect increases in other calcium-mediated cellular processes (Morgan and Curran, 1986; Dragunow and Faull, 1989). Differences in numbers of c-fos-expressing cells, moreover, were examined and interpreted as a function of the modified sleep–wake states, although they could also be attributable in part to different levels of stress (Cullinan et al., 1995), undoubtedly present, although reportedly attenuated in such chronic experiments (Mendelson, 1974;Stamp and Herbert, 1999).
The oral pontine reticular formation and the state of PS
Since early studies involving lesions of the brainstem in the cat, the pontine reticular formation has been known to be critical for the generation of PS, although whether the reticularis pontis caudalis or oralis is most important was not resolved (Carli and Zanchetti, 1965;Jouvet, 1965). In the present study in rats, the number of c-Fos+ cells was significantly increased and most particularly in the PnO in association with PS rebound. The PnO is densely innervated by cholinergic fibers originating in the pontomesencephalic cholinergic neurons (Jones, 1990) that play a critical role in initiating PS (Webster and Jones, 1988) and express c-Fos in association with PS rebound (Maloney et al., 1999). It is within the PnO where it was first discovered that the cholinergic agonist carbachol could elicit a PS-like state in the cat (George et al., 1964), and where, albeit in the dorsal, ventral, medial, or lateral part, it has since been confirmed many times to have the capacity to elicit all components of PS in cats and rats, including cortical activation, hippocampal theta, muscle atonia, and phasic activity (Mitler and Dement, 1974; Katayama et al., 1984; Gnadt and Pegram, 1986; Morales et al., 1987;Vanni-Mercier et al., 1989; Elazar and Paz, 1990; Yamamoto et al., 1990; Takakusaki et al., 1993; Vertes et al., 1993; Bourgin et al., 1995; Garzon et al., 1998; Horner and Kubin, 1999). This region, originally called reticularis pontis oralis in rabbit and man (Meesen and Olszewski, 1949; Olszewski and Baxter, 1954) and more recently paralemniscal tegmental field in cat (Berman, 1968), would appear to partially overlap with the region called peri-LC α by Sakai (1988) in the cat, where he found carbachol injections to be most effective in eliciting PS (Vanni-Mercier et al., 1989) and where he also recorded a large number of “specific PS-on” neurons. Within the PnO, neurons give rise to projections ascending into the forebrain and others descending into the lower brainstem and/or spinal cord (Jones and Yang, 1985; Jones, 1995), thus being in a position to modulate both forebrain and bulbospinal activities in response to carbachol injections and in the natural generation of PS. In single-unit recording studies, it has been found that a major proportion of neurons in the pontine reticular formation are excited by carbachol and ACh (Greene and Carpenter, 1985), including those that are normally active during PS (Shiromani and McGinty, 1986). Moreover, in studies with carbachol-induced PS, increases in c-Fos-expressing cells have also been reported in the rostral pontine tegmentum of cats (Shiromani et al., 1992; Yamuy et al., 1993).
In the PnO and not in the PnC, the numbers of c-Fos-expressing GABAergic neurons were actually decreased in association with PS rebound. The GABAergic neurons in the PnO could correspond to the minor proportion of pontine neurons that have been shown to be directly inhibited by carbachol and ACh (Greene and Carpenter, 1985; Shiromani and McGinty, 1986; Gerber et al., 1991; Nunez et al., 1997) and become inactive during carbachol-induced PS-like phenomena (Nunez et al., 1991). Because in the PnO the numbers of c-Fos+ cells were reciprocally increased with PS rebound, our results suggest that reticular neurons may be released from inhibition by local GABAergic neurons during naturally occurring PS. However, although there was a decrease in GABAergic c-Fos-expressing neurons in animals of the PSR group, there was not a significant simple correlation between GAD+/c-Fos+ cells and the %PS. When the variation attributable to SWS was taken into account, however, the variation particular to PS became evident, and the results indicated that GABAergic c-fos-expressing neurons were negatively correlated with PS. One possible explanation for this finding is that in the PnO GABAergic neurons may be active during SWS, as “SWS-on,” and become inactive during PS, as “PS-off” cells. Accordingly, local GABAergic neurons could be responsible for inhibiting PnO “PS-on” neurons during SWS and wake and disinhibiting them with PS. Indeed, some PS-on neurons in the pontine tegmentum have been shown to be excited by iontophoretic application of the GABAA antagonist bicuculline, when applied during SWS (Sakai and Koyama, 1996). Moreover, it has recently been reported by Chase and his colleagues (Xi et al., 1999) that injections of bicuculline into the nucleus reticularis pontis oralis elicit the state of PS, lending credence to the present results and also indicating that GABAergic PnO neurons may play a determining role in PS generation.
The pontomedullary reticular formation—raphe and muscle atonia
Wthin the medullary reticular and raphe nuclei, as in the PnC, there was no significant variation in numbers of single-immunostained c-Fos+ neurons across conditions. On the other hand, there was a significant increase in dual-immunostained GAD+/c-Fos+ neurons in association with PS rebound. These results would suggest that the small, GABAergic neurons within the caudal pontine and medullary reticular and raphe nuclei may be active during PS and responsible for inhibiting other neurons the activity of which is not compatible with PS. In many nuclei, GABAergic c-Fos-expressing neurons also covaried negatively with EMG. It is thus likely that small GABAergic cells with local projections (Jones et al., 1991; Holmes et al., 1994) serve to inhibit nearby excitatory reticulo-spinal or raphe-spinal projection neurons and thus to effect a disfacilitation of motor neurons during PS. In the ventral reticular and midline raphe nuclei, there were also relatively large GABAergic c-Fos-expressing neurons. Similarly large GABAergic neurons have been shown to project to the spinal cord (Reichling and Basbaum, 1990; Holstege, 1991; Jones et al., 1991) and postulated to provide a direct inhibitory influence in the dorsal and ventral horns, respectively, coming from the more rostral (RM and GiA) and caudal (RPO and GiV) nuclei and thus, respectively, influencing sensory and motor activity (Basbaum et al., 1978; Skagerberg and Bjorklund, 1985). Identified medullary reticulo-spinal neurons have been found to increase their discharge rate in association with hyperpolarizing potentials recorded from spinal motor neurons during carbachol or PS atonia (Kanamori et al., 1980; Takakusaki et al., 1994). Such reticulo-spinal inhibitory neurons could be GABAergic but could also well be glycinergic (Holstege and Bongers, 1991). There is direct evidence for an important role of glycine in the inhibition of spinal motor neurons during PS atonia (Chase et al., 1989). Yet there is also evidence to suggest that GABA release may be increased in the region of motor neurons during motor suppression and accordingly that GABA in addition to glycine may be involved (Kodama et al., 2000). It is also possible as shown in the spinal cord that neurons may contain and corelease GABA and glycine (Todd and Sullivan, 1990; Jonas et al., 1998).
Although numbers of Ser+/c-Fos+ neurons in the medullary reticular and raphe nuclei were altered by PS deprivation, they were not directly correlated with %PS, for similar reasons perhaps to the reported lack of significant variation in c-Fos-expressing serotonergic neurons reported in association with carbachol-induced PS (Yamuy et al., 1995). Across the medulla, serotonergic c-Fos-expressing neurons covaried positively with wake and moreover in the RPO correlated positively with EMG, where the GABAergic c-Fos-expressing neurons were reciprocally negatively correlated with EMG. These results parallel those reported after neurotoxic lesions of the medullary reticular formation and raphe, after which muscle atonia was disrupted and the degree of muscle tonus during PS was positively correlated with the number of surviving serotonergic neurons and negatively correlated with that of surviving GABAergic neurons (Holmes and Jones, 1994; Holmes et al., 1994). That these relationships emerge here with c-Fos expression in the raphe pallidus-obscurus nuclei may reflect the fact that the major projections from the serotonergic and nonserotonergic neurons of these caudal nuclei are to the ventral horn (Basbaum et al., 1978; Skagerberg and Bjorklund, 1985) and that the serotonergic neurons therein discharge most particularly in association with motor activities (Jacobs and Fornal, 1991; Veasey et al., 1995). It is also known that serotonin has an excitatory action on spinal and bulbar motor neurons (Fung and Barnes, 1989; White and Fung, 1989). As supported by recent evidence (Kubin et al., 1993; Yamuy et al., 1999; Kodama et al., 2000), our results would suggest that during PS muscle atonia, motor neurons may undergo disfacilitation by removal of a serotonergic influence and inhibition by imposition of a GABAergic, in addition to a glycinergic, influence.
In summary, the present results provide suggestive evidence for differential and important roles of pontomedullary GABAergic cell populations in relation to reticular and serotonergic neurons in the determination of the state of PS and accompanying muscle atonia.
Footnotes
This research was supported by the Canadian Medical Research Council (MRC). K.M. was the recipient of a Jeanne Timmins Graduate Student Fellowship from the Montreal Neurological Institute.
Correspondence should be addressed to Dr. Barbara E. Jones, Montreal Neurological Institute, 3801 University Street, Montreal, Quebec H3A 2B4, Canada. E-mail: mcbj@musica.mcgill.ca.
REFERENCES
- 1.Baghdoyan HA, Rodrigo-Angulo ML, McCarley RW, Hobson JA. Site-specific enhancement and suppression of desynchronized sleep signs following cholinergic stimulation of three brainstem regions. Brain Res. 1984;306:39–52. doi: 10.1016/0006-8993(84)90354-8. [DOI] [PubMed] [Google Scholar]
- 2.Basbaum AI, Clanton CH, Fields HL. Three bulbospinal pathways from the rostral medulla of the cat: an autoradiographic study of pain modulating systems. J Comp Neurol. 1978;178:209–224. doi: 10.1002/cne.901780203. [DOI] [PubMed] [Google Scholar]
- 3.Berman AL. The brain stem of the cat. A cytoarchitectonic atlas with stereotaxic coordinates. University of Wisconsin; Madison, WI: 1968. [Google Scholar]
- 4.Bourgin P, Escourrou P, Gaultier C, Adrien J. Induction of rapid eye movement sleep by carbachol infusion into the pontine reticular formation in the rat. NeuroReport. 1995;6:532–536. doi: 10.1097/00001756-199502000-00031. [DOI] [PubMed] [Google Scholar]
- 5.Carli G, Zanchetti A. A study of pontine lesions suppressing deep sleep in the cat. Arch Ital Biol. 1965;103:751–788. [PubMed] [Google Scholar]
- 6.Chase MH, Morales FR, Boxer PA, Fung SJ, Soja PJ. Effect of stimulation of the nucleus reticularis gigantocellularis on the membrane potential of cat lumbar motoneurons during sleep and wakefulness. Brain Res. 1986;386:237–244. doi: 10.1016/0006-8993(86)90160-5. [DOI] [PubMed] [Google Scholar]
- 7.Chase MH, Soja PJ, Morales FR. Evidence that glycine mediates the postsynaptic potentials that inhibit lumbar motoneurons during the atonia of active sleep. J Neurosci. 1989;9:743–751. doi: 10.1523/JNEUROSCI.09-03-00743.1989. [DOI] [PMC free article] [PubMed] [Google Scholar]
- 8.Cullinan WE, Herman JP, Battaglia DF, Akil H, Watson SJ. Pattern and time course of immediate early gene expression in rat brain following acute stress. Neuroscience. 1995;64:477–505. doi: 10.1016/0306-4522(94)00355-9. [DOI] [PubMed] [Google Scholar]
- 9.Domino EF, Yamamoto K, Dren AT. Role of cholinergic mechanisms in states of wakefulness and sleep. Prog Brain Res. 1968;28:113–133. doi: 10.1016/S0079-6123(08)64547-1. [DOI] [PubMed] [Google Scholar]
- 10.Dragunow M, Faull R. The use of c-fos as a metabolic marker in neuronal pathway tracing. J Neurosci Methods. 1989;29:261–265. doi: 10.1016/0165-0270(89)90150-7. [DOI] [PubMed] [Google Scholar]
- 11.Elazar Z, Paz M. Catalepsy induced by carbachol microinjected into the pontine reticular formation of rats. Neurosci Lett. 1990;115:226–230. doi: 10.1016/0304-3940(90)90459-m. [DOI] [PubMed] [Google Scholar]
- 12.ElMansari M, Sakai M, Jouvet M. Unitary characteristics of presumptive cholinergic tegmental neurons during the sleep-waking cycle in freely moving cats. Exp Brain Res. 1989;76:519–529. doi: 10.1007/BF00248908. [DOI] [PubMed] [Google Scholar]
- 13.Ford B, Holmes C, Mainville L, Jones BE. GABAergic neurons in the rat pontomesencephalic tegmentum. Codistribution with cholinergic and other tegmental neurons projecting to the posterior lateral hypothalamus. J Comp Neurol. 1995;363:177–196. doi: 10.1002/cne.903630203. [DOI] [PubMed] [Google Scholar]
- 14.Friedman L, Jones BE. Computer graphics analysis of sleep-wakefulness state changes after pontine lesions. Brain Res Bull. 1984;13:53–68. doi: 10.1016/0361-9230(84)90008-x. [DOI] [PubMed] [Google Scholar]
- 15.Fung SJ, Barnes CD. Raphe-produced excitation of spinal cord motoneurons in the cat. Neurosci Lett. 1989;103:185–190. doi: 10.1016/0304-3940(89)90573-9. [DOI] [PubMed] [Google Scholar]
- 16.Garzon M, deAndres I, Reinoso-Suarez F. Sleep patterns after carbachol delivery in the ventral oral pontine tegmentum of the cat. Neuroscience. 1998;83:1137–1144. doi: 10.1016/s0306-4522(97)00494-6. [DOI] [PubMed] [Google Scholar]
- 17.George R, Haslett W, Jenden D. A cholinergic mechanism in the brainstem reticular formation: induction of paradoxical sleep. Int J Neuropharmacol. 1964;3:541–552. doi: 10.1016/0028-3908(64)90076-0. [DOI] [PubMed] [Google Scholar]
- 18.Gerber U, Stevens DR, McCarley RW, Greene RW. Muscarinic agonists activate an inwardly rectifying potassium conductance in medial pontine reticular formation neurons of the rat in vitro. J Neurosci. 1991;11:3861–3867. doi: 10.1523/JNEUROSCI.11-12-03861.1991. [DOI] [PMC free article] [PubMed] [Google Scholar]
- 19.Gnadt JW, Pegram GV. Cholinergic brainstem mechanisms of REM sleep in the rat. Brain Res. 1986;384:29–41. doi: 10.1016/0006-8993(86)91216-3. [DOI] [PubMed] [Google Scholar]
- 20.Greene RW, Carpenter DO. Actions of neurotransmitters on pontine medial reticular formation neurons of the cat. J Neurophysiol. 1985;54:520–531. doi: 10.1152/jn.1985.54.3.520. [DOI] [PubMed] [Google Scholar]
- 21.Hendricks JC, Morrison AR, Mann GL. Different behaviors during paradoxical sleep without atonia depend on pontine lesion site. Brain Res. 1982;239:81–105. doi: 10.1016/0006-8993(82)90835-6. [DOI] [PubMed] [Google Scholar]
- 22.Henley K, Morrison AR. A re-evaluation of the effects of lesions of the pontine tegmentum and locus coeruleus on phenomena of paradoxical sleep in the cat. Acta Neurobiol Exp. 1974;34:215–232. [PubMed] [Google Scholar]
- 23.Holmes CJ, Jones BE. Importance of cholinergic, GABAergic, serotonergic and other neurons in the medullary reticular formation for sleep-wake states studied by cytotoxic lesions in the cat. Neuroscience. 1994;62:1179–1200. doi: 10.1016/0306-4522(94)90352-2. [DOI] [PubMed] [Google Scholar]
- 24.Holmes CJ, Mainville LS, Jones BE. Distribution of cholinergic, GABAergic and serotonergic neurons in the medullary reticular formation and their projections studied by cytotoxic lesions in the cat. Neuroscience. 1994;62:1155–1178. doi: 10.1016/0306-4522(94)90351-4. [DOI] [PubMed] [Google Scholar]
- 25.Holstege JC. Ultrastructural evidence for GABAergic brainstem projections to spinal motoneurons in the rat. J Neurosci. 1991;11:159–167. doi: 10.1523/JNEUROSCI.11-01-00159.1991. [DOI] [PMC free article] [PubMed] [Google Scholar]
- 26.Holstege JC, Bongers CMH. A glycinergic projection from the ventromedial lower brainstem to spinal motoneurons. An ultrastructural double labeling study in rat. Brain Res. 1991;566:308–315. doi: 10.1016/0006-8993(91)91715-d. [DOI] [PubMed] [Google Scholar]
- 27.Horner RL, Kubin L. Pontine carbachol elicits multiple rapid eye movement sleep-like neural events in urethane-anesthetized rats. Neuroscience. 1999;93:215–226. doi: 10.1016/s0306-4522(99)00126-8. [DOI] [PubMed] [Google Scholar]
- 28.Jacobs BL, Fornal CA. Activity of brain serotonergic neurons in the behaving animal. Pharmacol Rev. 1991;43:563–578. [PubMed] [Google Scholar]
- 29.Jonas P, Bishchofberger J, Sandkulher J. Corelease of two fast neurotransmitters at a central synapse. Science. 1998;281:419–424. doi: 10.1126/science.281.5375.419. [DOI] [PubMed] [Google Scholar]
- 30.Jones BE. Immunohistochemical study of choline acetyl transferase-immunoreactive processes and cells innervating the pontomedullary reticular formation. J Comp Neurol. 1990;295:485–514. doi: 10.1002/cne.902950311. [DOI] [PubMed] [Google Scholar]
- 31.Jones BE. Paradoxical sleep and its chemical/structural substrates in the brain. Neuroscience. 1991;40:637–656. doi: 10.1016/0306-4522(91)90002-6. [DOI] [PubMed] [Google Scholar]
- 32.Jones BE. Reticular formation. Cytoarchitecture, transmitters and projections. The rat nervous system (Paxinos G, ed), pp 155–171. Academic Press Australia; New South Wales: 1995. [Google Scholar]
- 33.Jones BE, Webster HH. Neurotoxic lesions of the dorsolateral pontomesencephalic tegmentum—cholinergic cell area in the cat. I. Effects upon the cholinergic innervation of the brain. Brain Res. 1988;451:13–32. doi: 10.1016/0006-8993(88)90745-7. [DOI] [PubMed] [Google Scholar]
- 34.Jones BE, Yang T-Z. The efferent projections from the reticular formation and the locus coeruleus studied by anterograde and retrograde axonal transport in the rat. J Comp Neurol. 1985;242:56–92. doi: 10.1002/cne.902420105. [DOI] [PubMed] [Google Scholar]
- 35.Jones BE, Holmes CJ, Rodriguez-Veiga E, Mainville L. GABA-synthesizing neurons in the medulla: their relationship to serotonin-containing and spinally projecting neurons in the rat. J Comp Neurol. 1991;312:1–19. doi: 10.1002/cne.903130210. [DOI] [PubMed] [Google Scholar]
- 36.Jouvet M. Recherches sur les structures nerveuses et les mecanismes responsables des differentes phases du sommeil physiologique. Arch Ital Biol. 1962;100:125–206. [PubMed] [Google Scholar]
- 37.Jouvet M. Paradoxical sleep—a study of its nature and mechanisms. Prog Brain Res. 1965;18:20–57. doi: 10.1016/s0079-6123(08)63582-7. [DOI] [PubMed] [Google Scholar]
- 38.Jouvet M. The role of monoamines and acetylcholine-containing neurons in the regulation of the sleep-waking cycle. Ergeb Physiol. 1972;64:165–307. doi: 10.1007/3-540-05462-6_2. [DOI] [PubMed] [Google Scholar]
- 39.Jouvet M, Delorme F. Locus coeruleus et sommeil paradoxal. C R Soc Biol. 1965;159:895–899. [Google Scholar]
- 40.Kanamori N, Sakai K, Jouvet M. Neuronal activity specific to paradoxical sleep in the ventromedial medullary reticular formation of unrestrained cats. Brain Res. 1980;189:251–255. doi: 10.1016/0006-8993(80)90024-4. [DOI] [PubMed] [Google Scholar]
- 41.Karczmar AG, Longo VG, Scotti de Carolis A. A pharmacological model of paradoxical sleep: the role of cholinergic and monoamine systems. Physiol Behav. 1970;5:175–182. doi: 10.1016/0031-9384(70)90061-2. [DOI] [PubMed] [Google Scholar]
- 42.Katayama Y, DeWitt DS, Becker DP, Hayes RL. Behavioral evidence for a cholinoceptive pontine inhibitory area: descending control of spinal motor output and sensory input. Brain Res. 1984;296:241–262. doi: 10.1016/0006-8993(84)90062-3. [DOI] [PubMed] [Google Scholar]
- 43.Kayama Y, Ohta M, Jodo E. Firing of “possibly” cholinergic neurons in the rat laterodorsal tegmental nucleus during sleep and wakefulness. Brain Res. 1992;569:210–220. doi: 10.1016/0006-8993(92)90632-j. [DOI] [PubMed] [Google Scholar]
- 44.Keller AD. Generalized atonia and profound dysreflexia following transection of the brainstem through the cephalic pons. J Neurophysiol. 1945;8:275–288. [Google Scholar]
- 45.Kodama T, Lai YY, Siegel JM (2000) Increases in inhibitory amino acid release in the hypoglossal nucleus during medial medulla-induced muscle tone suppression: an in vivo dialysis study. Sleep Res Soc Abstr, in press.
- 46.Kohyama J, Lai YY, Siegel JM. Reticulospinal systems mediate atonia with short and long latencies. J Neurophysiol. 1998;80:1839–1851. doi: 10.1152/jn.1998.80.4.1839. [DOI] [PMC free article] [PubMed] [Google Scholar]
- 47.Kubin L, Kimura H, Tojima H, Davies RO, Pack AI. Suppression of hypoglossal motoneurons during the carbachol-induced atonia of REM sleep is not caused by fast synaptic inhibition. Brain Res. 1993;611:300–312. doi: 10.1016/0006-8993(93)90517-q. [DOI] [PubMed] [Google Scholar]
- 48.Lai YY, Siegel JM. Medullary regions mediating atonia. J Neurosci. 1988;12:4790–4796. doi: 10.1523/JNEUROSCI.08-12-04790.1988. [DOI] [PMC free article] [PubMed] [Google Scholar]
- 49.Lai YY, Siegel JM (1991) Pontomedullary glutamate receptors mediating locomotion and muscle tone suppression. J Neurosci 2931–2937. [DOI] [PMC free article] [PubMed]
- 50.Magoun HW, Rhines R. An inhibitory mechanism in the bulbar reticular formation. J Neurophysiol. 1946;9:165–171. doi: 10.1152/jn.1946.9.3.165. [DOI] [PubMed] [Google Scholar]
- 51.Maloney KJ, Jones BE. c-Fos expression in neurons of the pontomedullary reticular formation and raphe, including GABAergic and serotonergic, neurons during paradoxical sleep deprivation and recovery. Soc Neurosci Abstr. 1999;25:26. doi: 10.1523/JNEUROSCI.20-12-04669.2000. [DOI] [PMC free article] [PubMed] [Google Scholar]
- 52.Maloney KJ, Cape EG, Gotman J, Jones BE. High frequency gamma electroencephalogram activity in association with sleep-wake states and spontaneous behaviors in the rat. Neuroscience. 1997;76:541–555. doi: 10.1016/s0306-4522(96)00298-9. [DOI] [PubMed] [Google Scholar]
- 53.Maloney KJ, Mainville L, Jones BE. Differential c-Fos expression in cholinergic, monoaminergic and GABAergic cell groups of the pontomesencephalic tegmentum after paradoxical sleep deprivation and recovery. J Neurosci. 1999;19:3057–3072. doi: 10.1523/JNEUROSCI.19-08-03057.1999. [DOI] [PMC free article] [PubMed] [Google Scholar]
- 54.Meesen H, Olszewski J. A cytoarchitectonic atlas of the rhombencephalon of the rabbit. S. Karger; Basel: 1949. [Google Scholar]
- 55.Mendelson WB. The flower pot technique of rapid eye movement sleep deprivation. Pharmacol Biochem Behav. 1974;2:553–556. doi: 10.1016/0091-3057(74)90018-5. [DOI] [PubMed] [Google Scholar]
- 56.Mitler MM, Dement WC. Cataplectic-like behavior in cats after microinjections of carbachol in pontine reticular formation. Brain Res. 1974;68:335–343. doi: 10.1016/0006-8993(74)90402-8. [DOI] [PMC free article] [PubMed] [Google Scholar]
- 57.Morales FR, Engelhardt JK, Soja PJ, Pereda AE, Chase MH. Motoneuron properties during motor inhibition produced by microinjection of carbachol into the pontine reticular formation of the decerebrate cat. J Neurophysiol. 1987;57:1118–1129. doi: 10.1152/jn.1987.57.4.1118. [DOI] [PubMed] [Google Scholar]
- 58.Morgan JI, Curran T. Role of ion flux in the control of c-fos expression. Nature. 1986;322:552–555. doi: 10.1038/322552a0. [DOI] [PubMed] [Google Scholar]
- 59.Nunez A, de Andres I, Garcia-Austt E. Relationships of nucleus reticularis pontis oralis neuronal discharge with sensory and carbachol evoked hippocampal theta rhythm. Exp Brain Res. 1991;87:303–308. doi: 10.1007/BF00231847. [DOI] [PubMed] [Google Scholar]
- 60.Nunez A, DelaRoza C, Rodrigo-Angulo ML, Buno W, Reinoso-Suarez F. Electrophysiological properties and cholinergic responses of rat ventral oral pontine reticular neurons in vitro. Brain Res. 1997;754:1–11. doi: 10.1016/s0006-8993(97)00035-8. [DOI] [PubMed] [Google Scholar]
- 61.Olszewski J, Baxter D. Cytoarchitecture of the human brain stem. Karger; Basel: 1954. [Google Scholar]
- 62.Paxinos G, Watson C. The rat brain in stereotaxic coordinates. Academic; Sydney: 1986. [DOI] [PubMed] [Google Scholar]
- 63.Reichling DB, Basbaum AI. Contribution of brainstem GABAergic circuitry to descending antinociceptive controls. 1. GABA-immunoreactive projection neurons in the periaqueductal gray and nucleus raphe magnus. J Comp Neurol. 1990;302:370–377. doi: 10.1002/cne.903020213. [DOI] [PubMed] [Google Scholar]
- 64.Sakai K. Executive mechanisms of paradoxical sleep. Arch Ital Biol. 1988;126:239–257. [PubMed] [Google Scholar]
- 65.Sakai K, Koyama Y. Are there cholinergic and non-cholinergic paradoxical sleep-on neurones in the pons? NeuroReport. 1996;7:2449–2453. doi: 10.1097/00001756-199611040-00009. [DOI] [PubMed] [Google Scholar]
- 66.Sakai K, Sastre J-P, Salvert D, Touret M, Tohyama M, Jouvet M. Tegmentoreticular projections with special reference to the muscular atonia during paradoxical sleep in the cat: an HRP study. Brain Res. 1979;176:233–254. doi: 10.1016/0006-8993(79)90981-8. [DOI] [PubMed] [Google Scholar]
- 67.Schenkel E, Siegel JM. REM sleep without atonia after lesions of the medial medulla. Neurosci Lett. 1989;98:159–165. doi: 10.1016/0304-3940(89)90503-x. [DOI] [PMC free article] [PubMed] [Google Scholar]
- 68.Shiromani PJ, McGinty DJ. Pontine neuronal response to local cholinergic infusion: relation to REM sleep. Brain Res. 1986;386:20–31. doi: 10.1016/0006-8993(86)90137-x. [DOI] [PubMed] [Google Scholar]
- 69.Shiromani PJ, Kilduff TS, Bloom FE, McCarley RW. Cholinergically induced REM sleep triggers Fos-like immunoreactivity in dorsolateral pontine regions associated with REM sleep. Brain Res. 1992;580:351–357. doi: 10.1016/0006-8993(92)90968-f. [DOI] [PubMed] [Google Scholar]
- 70.Skagerberg G, Bjorklund A. Topographic principles in the spinal projections of serotonergic and non-serotonergic brainstem neurons in the rat. Neuroscience. 1985;15:445–480. doi: 10.1016/0306-4522(85)90225-8. [DOI] [PubMed] [Google Scholar]
- 71.Stamp JA, Herbert J. Multiple immediate-early gene expression during physiological and endocrine adaptation to repeated stress. Neuroscience. 1999;94:1313–1322. doi: 10.1016/s0306-4522(99)00368-1. [DOI] [PubMed] [Google Scholar]
- 72.Takakusaki K, Matsuyama K, Kobayashi Y, Kohyama J, Mori S. Pontine microinjection of carbachol and critical zone for inducing postural atonia in reflexively standing decerebrate cats. Neurosci Lett. 1993;153:185–188. doi: 10.1016/0304-3940(93)90318-f. [DOI] [PubMed] [Google Scholar]
- 73.Takakusaki K, Matsuyama K, Kobayashi Y, Kohyama J, Mori S. Discharge properties of medullary reticulospinal neurons during postural changes induced by intrapontine injections of carbachol, atropine and serotonin, and their functional linkages to hindlimb motoneurons in cats. Brain Res. 1994;99:361–374. doi: 10.1007/BF00228973. [DOI] [PubMed] [Google Scholar]
- 74.Todd AJ, Sullivan AC. Light microscope study of the coexistence of GABA-like and glycine-like immunoreactivities in the spinal cord of the rat. J Comp Neurol. 1990;296:496–505. doi: 10.1002/cne.902960312. [DOI] [PubMed] [Google Scholar]
- 75.Vanni-Mercier G, Sakai K, Lin J-S, Jouvet M. Mapping of cholinoceptive brainstem structures responsible for the generation of paradoxical sleep in the cat. Arch Ital Biol. 1989;127:133–164. [PubMed] [Google Scholar]
- 76.Veasey SC, Fornal CA, Metzler CW, Jacobs BL. Response of serotonergic caudal raphe neurons in relation to specific motor activities in freely moving cats. J Neurosci. 1995;15:5346–5359. doi: 10.1523/JNEUROSCI.15-07-05346.1995. [DOI] [PMC free article] [PubMed] [Google Scholar]
- 77.Vertes RP, Colom LV, Fortin WJ, Bland BH. Brainstem sites for the carbachol elicitation of the hippocampal theta rhythm in the rat. Exp Brain Res. 1993;96:419–429. doi: 10.1007/BF00234110. [DOI] [PubMed] [Google Scholar]
- 78.Webster HH, Jones BE. Neurotoxic lesions of the dorsolateral pontomesencephalic tegmentum-cholinergic cell area in the cat. II. Effects upon sleep-waking states. Brain Res. 1988;458:285–302. doi: 10.1016/0006-8993(88)90471-4. [DOI] [PubMed] [Google Scholar]
- 79.White SR, Fung SJ. Serotonin depolarizes cat spinal motoneurons in situ and decreases motoneuron afterhyperpolarizing potentials. Brain Res. 1989;502:205–213. doi: 10.1016/0006-8993(89)90615-x. [DOI] [PubMed] [Google Scholar]
- 80.Xi M-C, Morales FR, Chase MH. Evidence that wakefulness and REM sleep are controlled by a GABAergic pontine mechanism. J Neurophysiol. 1999;82:2015–2019. doi: 10.1152/jn.1999.82.4.2015. [DOI] [PubMed] [Google Scholar]
- 81.Yamamoto K, Mamelak AN, Quattrochi JJ, Hobson JA. A cholinoceptive desynchronized sleep induction zone in the anterodorsal pontine tegmentum: locus of the sensitive region. Neuroscience. 1990;39:279–293. doi: 10.1016/0306-4522(90)90267-8. [DOI] [PubMed] [Google Scholar]
- 82.Yamuy J, Mancillas JR, Morales FR, Chase MH. c-Fos expression in the pons and medulla of the cat during carbachol-induced active sleep. J Neurosci. 1993;13:2703–2718. doi: 10.1523/JNEUROSCI.13-06-02703.1993. [DOI] [PMC free article] [PubMed] [Google Scholar]
- 83.Yamuy J, Sampogna S, Lopez-Rodriguez F, Luppi PH, Morales FR, Chase MH. Fos and serotonin immunoreactivity in the raphe nuclei of the cat during carbachol-induced active sleep: a double-labeling study. Neuroscience. 1995;67:211–223. doi: 10.1016/0306-4522(94)00633-g. [DOI] [PubMed] [Google Scholar]
- 84.Yamuy J, Fung SJ, Xi M, Morales FR, Chase MH. Hypoglossal motoneurons are postsynaptically inhibited during carbachol-induced rapid eye movement sleep. Neuroscience. 1999;94:11–15. doi: 10.1016/s0306-4522(99)00355-3. [DOI] [PubMed] [Google Scholar]