

Abstract
The extent and function of synchronization of oscillatory elements in the human sensorimotor cortex during movement remains unclear. Here we determine whether synchronization is distributed in both the spatial and frequency domains and whether it changes according to task. Electrocorticographic (ECoG) signals were recorded from presumed nonpathological areas simultaneously with electromyographic (EMG) signals from upper limb muscles during isometric and phasic movement tasks in humans with subdural electrodes in situ for investigation of epilepsy. Functional mapping of the sensorimotor cortex was performed by previous electrical stimulation through the same ECoG electrodes used for recording. Significant coherence between ECoG and EMG was seen at discrete frequencies in the range of 7–100 Hz. There was no predilection for coherence within a given frequency band to be associated with cortical sites that had been functionally defined as producing contralateral arm motor responses on stimulation. However, coherence with muscle in the 7–14 and 15–30 Hz band tended to be associated with ECoG sites that lay close to or within the central sulcus as determined intraoperatively. The spatial pattern and frequency of coherence changed with different tasks, although similarities in the coherence pattern remained for tasks that shared common features. These findings provide support for the hypothesis that that synchronization at specific frequencies links cortical activities into a functional ensemble during voluntary movement.
Keywords: coherence, electrocorticography, motor control, binding, task-dependent changes, cortical stimulation
An unsolved problem of motor control is how disparate activities are coordinated during movement. In the visual areas, coherent oscillations at ∼40 Hz have been proposed as a mechanism to “bind” together spatially distributed but functionally related neuronal pools because the arrival of synchronous action potentials at common postsynaptic sites will be more effective than uncorrelated firing of the same inputs (Gray et al., 1989; Singer, 1993). Several studies in monkeys have now confirmed the presence of transient oscillations in the voltage of local field potentials at 20–30 Hz, which may be synchronized over spatially separate areas of sensorimotor cortex (Murthy and Fetz, 1996a,b; Baker et al., 1997;Donoghue et al., 1998). These activities may in turn be synchronized with electromyographic (EMG) activity in muscle. Similar coherence between brain and muscle, in the 20–30 Hz and other frequency bands, can also be detected in humans using electroencephalographic (EEG) and magnetoencephalographic (MEG) recordings (Conway et al., 1995; Brown et al., 1998a).
However, these observations do not in themselves provide strong support for “binding” within the motor system. More convincing would be the demonstration of task-specific patterns of distributed synchronization over narrow frequency bands that would lead to a significant increase in efficacy at common postsynaptic sites. Previous studies in humans have been limited by the spatial and temporal averaging involved in scalp EEG and MEG recordings, whereas task-specific narrow band synchronization may have so far escaped detection in monkeys through a number of methodological difficulties. The concentration on time domain measures (Murthy and Fetz, 1996a,b; Donoghue et al., 1998) and the use of single-ended rather than bipolar recording electrodes (Murthy and Fetz, 1996a,b; Baker et al., 1997; Donoghue et al., 1998) bias against the detection of specific narrow band synchronization, whereas animal studies depend on heavily overlearned tasks that may involve cortical reorganization (Nudo et al., 1996). The lack of evidence for task-specific narrow band synchronization has prompted most authors to suggest that oscillatory activity in the sensorimotor cortex is related to preparation or attention rather than the details of movement execution (Hari and Salenius, 1999).
In the present study we recorded directly from the surface of the cortex in six conscious patients who had arrays of electrodes implanted subdurally over frontal and parietal cortex to locate suspected foci of epileptic seizures. We could therefore record field potentials simultaneously from a wide area of motor and sensory cortex while subjects performed a variety of relatively unpracticed arm movements. Patients were selected because their motor areas appeared normal, as judged by magnetic resonance imaging and the absence of ictal or interictal epileptic activity. Electrical activity was recorded bipolarly from pairs of adjacent cortical electrodes together with EMG from upper limb muscles. The signals were then analyzed in the frequency domain to reveal patterns of significant coherence.
MATERIALS AND METHODS
All subjects participated according to the declaration of Helsinki, with informed consent and the approval of the local ethics committee. Case details are indicated in Table1. Cases 1 and 2 were recruited from the Toronto Western Hospital (TWH), and cases 3–6 were recruited from the Kinikum Grosshadern, University of Munich Hospital (MH).
Table 1.
Clinical details, site of subdural electrodes, and postoperative outcome
| Case: Age/sex | Diagnosis: Pre-op CNS signs | Drugs (mg/d) | Site of subdural electrodes | Lesion site and histology | Post-op outcome | Muscle(s) analyzed |
|---|---|---|---|---|---|---|
| 1 32 F | Epilepsy | None | Left motor cortex (anterior to central sulcus) | Spike focus in face area. MRI head normal. No histology available. | No resection performed. | Right abductor Pollicis brevis |
| 2 53 M | Left AVM Right hemianopia, weak right leg, severe sensory loss right side (absent proprioception in the fingers). Normal power in right arm. Bilaterally extensor plantar responses. | Carbamazepine, 400 mg; Frisium, 10 mg; Amytriptyline, 150 mg | Left sensorimotor cortex | MRI head showed normal cortex but an AVM in the left thalamus and internal capsule. No histology available. | No resection performed. | Right deltoid Right wrist extensors |
| 3 23 F | Epilepsy | Carbamazepine, 1300 mg | Right sensorimotor cortex | Post-central cortical dysplasia including sensory hand area as determined by electrical stimulation and median SEPs. | Engel class II | Left wrist extensors and flexors |
| 4 20 F | Epilepsy | Gabapentin, 1600 mg; Phenytoin, 400 mg | Right sensorimotor cortex | Cortical dysplasia in right superior frontal gyrus | Engel 1a | Left wrist extensors |
| 5 32 M | Epilepsy | Gabapentin, 1200 mg; Carbamazepine, 1600 mg | Right sensorimotor cortex | Right frontal cortical dysplasia, sparing motor hand area as determined by intraoperative stimulation | Engel 1a | Left wrist extensors and left first dorsal interosseous. |
| 6 34 M | Epilepsy | Carbamazepine, 1800 mg | Left motor cortex (anterior to central sulcus) | High resolution MRI was normal | Engel 1a | Right wrist extensors and flexors and deltoid |
Seizures are classified according to measures described in Engel et al. (1993).
Subdural electrodes (AD-Tech, Rachine, WI) were implanted as part of the patient's preoperative assessment to localize the extent of the motor, sensory, and language-related cortex before surgical resection and to determine the source of intractable seizures. The electrocorticographic (ECoG) electrodes (MH, 3-mm-diameter platinum-iridium; TWH, 5-mm-diameter stainless steel) had a 1 cm center-to-center separation and were embedded in 1.5-mm-thick SILASTIC rubber. The electrode arrays that were recorded varied from 8 × 8 to 1 × 4. The arrays were placed over the lateral convexity of the cortical hemisphere. The position of the array was determined relative to the central sulcus visualized intraoperatively and checked against the pattern of sensory evoked potentials and of motor responses to direct stimulation. Recordings were limited to areas of cortex that demonstrated no structural or functional abnormality. This was determined by normal magnetic resonance imaging appearances and the absence of ictal and interictal activity on prolonged subdural telemetry: signals were not analyzed from cortex that was subsequently resected. Analysis was felt to include at least part of the primary motor cortex and up to 4–5 cm anterior to the central sulcus. This, and the fact that the electrodes were placed over the gyri while the primary motor cortex mainly lies in the anterior bank of the central sulcus, especially in its inferior extent, meant that the premotor cortex (area 6) was also recorded (Zilles et al., 1995; White et al., 1997).
Determination of sensorimotor areas and sites of epileptogenic activity. Extraoperative and intraoperative stimulation was routinely performed to determine electrode sites that were capable of producing motor or sensory responses. The procedures performed at MH have been described previously (Luders et al., 1987). Anesthesia (nitrous oxide, 50–60%; isofluran; fentanyl) was administered during intraoperative stimulation, whereas during extraoperative stimulation the subjects received their usual antiepileptic medication and clobazam as necessary if stimulation induced seizures. Stimulations at each electrode site (square pulses of 0.3 msec duration and 50 Hz rate for a total duration of 5 sec) were delivered using a Grass (Quincy, MA) S-88 dual output stimulator. Bipolar stimulation of adjacent electrodes was performed with the reference electrode being one where no afterdischarges or functional responses were observed, usually on the outside of the electrode array. Stimulation intensity was increased from 1–15 mA in 2 mA steps until a functional response or afterdischarges were observed. After this, stimulation intensity was increased in 1 mA steps. At TWH, monopolar stimulation was applied through each electrode (square pulses of 6 mA and 0.1 msec duration at 1 Hz). In both centers, the body part affected and the nature of each response was determined. “Motor” and “sensory” electrodes were defined as those that produced, on either intraoperative or extraoperative stimulation, a motor or sensory response at a stimulation intensity <15 mA (Lesser et al., 1987). Electrodes in which short-latency evoked potentials were recorded in response to peripheral nerve stimulation were also defined as being “sensory”. Finally, the spatial extent of ictal and interictal epileptic activity was recorded.
Experimental protocol and recording procedure. ECoG activity was recorded simultaneously with surface EMG from proximal (deltoid) and/or distal (intrinsic hand muscles and/or wrist extensors/flexors) upper limb muscles during two tasks (Table 1). Subjects performed either repeated self-paced phasic (frequency, ∼0.25 Hz) or maximal tonic (isometric) contractions of the relevant muscle. Individual tonic contractions lasted a minimum of 7 sec, but were repeated every 20–60 sec so that the total length of contraction analyzed varied from 20–100 sec (mean, 60 ± 31 sec SD). Individual runs of phasic movements lasted an average of 106 sec (±85 sec) and, after exporting data segments with muscle activity, the total length of contraction analyzed varied from 20–340 sec (mean, 64.4 ± 96 sec).
Recording parameters differed between TWH and MH. In TWH, simultaneous bipolar electrode recordings of cortical potentials were performed from adjacent horizontal electrodes. ECoG and EMG were amplified and bandpass-filtered (ECoG, 0.5–1000 Hz; EMG, 20–1000 Hz). After analog-to-digital (AD) conversion using a 1401 laboratory interface (Cambridge Electronic Design, Cambridge, UK), the data were stored on a personal computer as SMR files (Spike 3; Cambridge Electronic Design). All data were sampled at 1 kHz. Any aliasing caused by the low sampling rate was considered minimal, because the mean background noise level was only 1.2–2.6 ηV/Hz in the 500 Hz to 5 kHz band.
In MH, ECoG and EMG were both amplified, bandpass-filtered (1–200 Hz, except for cases 5 and 3 in whom signals were lowpass-filtered at 1000 and 500 Hz), and sampled at 2 kHz (except case 5, 5 kHz and case 6, 1 kHz). Initially, simultaneous monopolar electrode recordings were performed at each electrode site with the reference electrode either being situated on the dura or at a distant electrode site. The data were AD-converted and stored (Neuroscan). The signals were subsequently converted to SMR format (conversion program written by D. Buckwell). Preliminary off-line analysis indicated that bipolar recordings derived from adjacent electrodes were less noisy than monopolar ECoG referenced to a distant electrode. Thus, bipolar ECoG was derived from all possible adjacent subdural electrode combinations in the horizontal, vertical, and diagonal directions within the area selected for analysis.
Analysis. For both tonic and phasic contractions (tasks), only those data segments in which the muscle was active were analyzed, with the relevant data being exported using the Spike 3 program. The surface EMG was then rectified, and the coherence between this and the simultaneously recorded ECoG signal at each bipolar site was determined (programs written by D. Halliday). The coherence was calculated up to 100 Hz with a resolution of 1.95 Hz (except for case 5, in which the resolution was 2.4 Hz). The determination of measures used and the calculation of their confidence limits have been described previously (Halliday et al., 1995). A fast Fourier transform was performed on nonoverlapping sections of equal length, the results were averaged across sections, and the autospectra and cross-spectra and from this coherence were determined. The coherence, at a given frequency λ, between processes x andy, Rxy(λ) 2, is the covariance between the two signals at that frequency. It is a bounded measure taking values from 0 to 1, where 0 means that there is no linear association between the signals and 1 means that there is a perfect linear association between the signals. The number of coherence spectra calculated per condition varied from 3–63 between subjects. A Bonferroni correction was therefore calculated for each subject to achieve an overall confidence limit of 95%. Data exceeding this 95% confidence limit was subsequently divided into one of four frequency bands, 7–14, 15–30, 31–60, and 60–100 Hz. Peaks of significant coherence were discrete and comprised only one or two data points, making assessment of the phase relationship unreliable (Gotman, 1983).
Significant coherence at a given bipolar electrode was also analyzed to determine whether there was any significant difference in the coherence at that site between tonic and phasic contractions. To do this, the square root of the coherence (a complex valued function termed coherency) was transformed at each frequency using the Fisher transform. This results in values of constant variance for each record given by 1/2L, where L is the number of segment lengths used to calculate the coherence. A χ2 test (Amjad et al., 1997) was then used to test the hypothesis of equal coherence values in the original records at each frequency.
A time domain measure, the cumulant density, was calculated from the inverse Fourier transform of the cross-spectrum. With the EMG signal as the reference, the cumulant density represents the cross-correlation of the ECoG signal relative to the EMG signal. Cumulant density estimates were used to assess changes in polarity of the ECoG when comparing signals from consecutive bipolar sites, and thus to help localize the site of oscillatory activity within the cortex. Only cumulant density estimates with data points above the 95% confidence level (after Bonferroni correction) were assessed (see Halliday et al., 1995, for details on the determination of confidence limits).
The last stage of the analysis involved testing whether cortical sites coherent with EMG were themselves synchronized at the same frequency. To do this we calculated the coherence between pairs of bipolar ECoG without common electrodes. Only the signals from bipolar electrodes that showed significant coherence with EMG at precisely the same frequency were assessed for significant coherence at that specific frequency. This was compared to the coherence found between one of the above bipolar ECoG pairs and one that either did not share the same frequency of coherence or did not demonstrate any significant coherence with EMG. The distance between ECoG pairs and the functional properties of the ECoG pairs were matched between the groups.
RESULTS
Coherence between ECoG and EMG and ECoG and ECoG
Significant coherence between ECoG and EMG was regularly seen over 15–30, 31–60, and 61–100 Hz, whereas coherence over 7–12 Hz was less frequent. Although coherence was seen over a range of frequencies, in any one task the coherence between a pair of cortical electrodes and muscle was often tuned to just a single frequency in the range of 7–100 Hz (Fig.1C–E). This was true of 84% of 77 spectra with significant coherence. The exact frequency of significant coherence (within a resolution of 1.95 Hz) was the same at two or more sites within the same record (Figs. 1B,2B,C) more often than would be predicted by chance (χ2 test, df = 3, p < 0.001, Fig.3A). Records showing coherence at the same frequency at three or more sites, as indicated in Figures1B and 2, B and C, were however, uncommon.
Fig. 1.
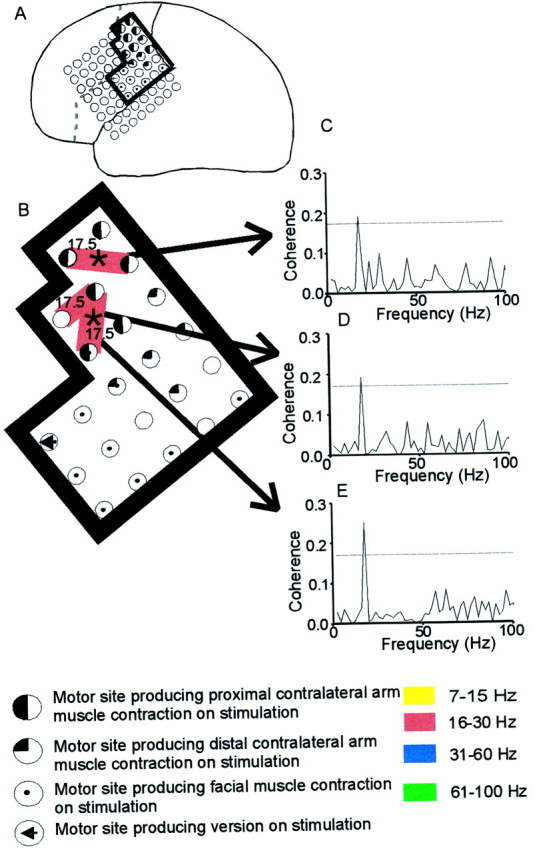
ECoG–EMG coherence at specific frequencies.A, Case 6, Location of the subdural grid. In this and Figure 2, black and graylines are the central sulcus and the surgical resection line, respectively, and the black boxed area is that analyzed. B, Coherence (significant at the 95% level after Bonferoni correction) between the left bipolar ECoG and right wrist flexors during tonic contraction. Circles indicate the electrode positions, and connecting lines indicate that significant coherence was observed between this bipolar electrode pair and muscle. The frequency band of significant coherence is color-coded, and the functional properties of the electrodes are indicated in the key. All three sites showed coherence with muscle at 17.5 Hz, as indicated in the coherence spectra in C–E. *Indicates that at this site the coherence at 17.5 Hz was significantly higher than that seen during a phasic contraction. The bipolar sites giving spectra D and E were themselves coherent at 17.5 Hz, with activity simultaneously recorded from the more rostral site giving C.
Fig. 2.
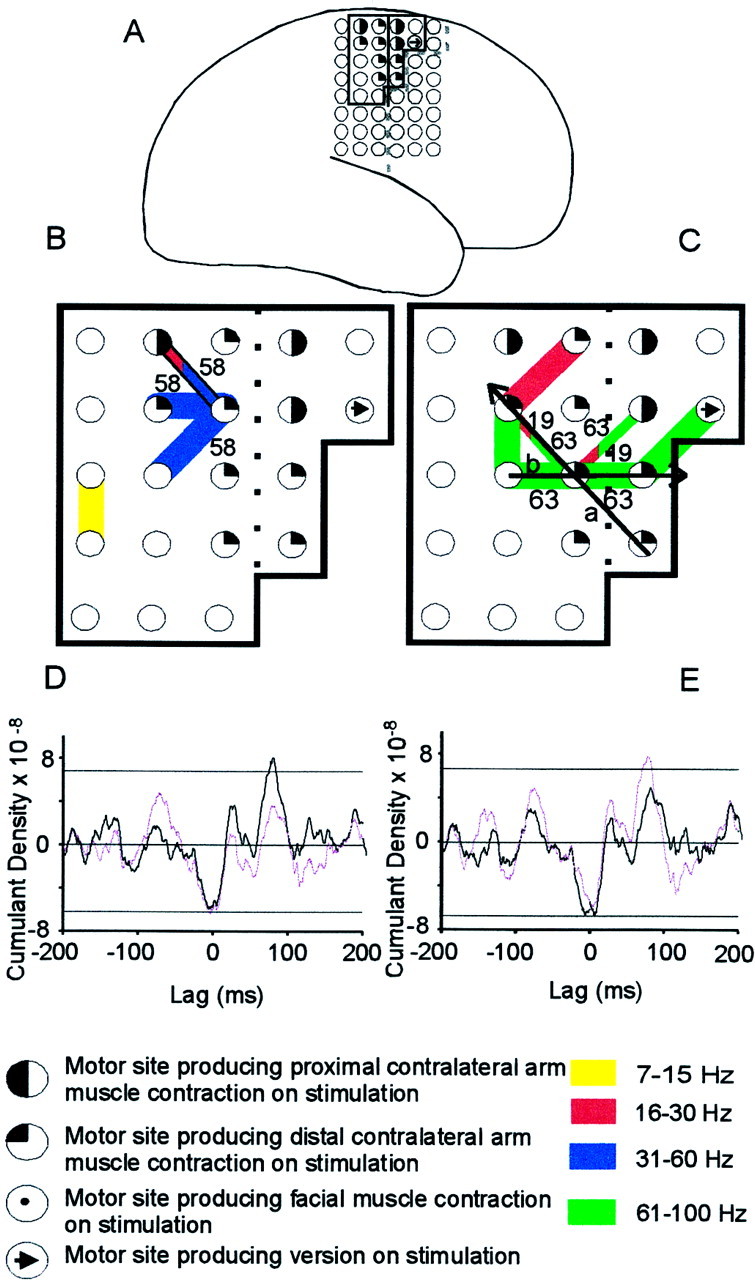
Task-related changes in ECoG–EMG coherence.A, Case 5, Location of the subdural grid.B,C, Coherence between the right bipolar ECoG and left first dorsal interosseous during tonic (B) and phasic (C) contractions. Note that activity in the high gamma band (61–100 Hz) was only found during phasic contractions. Key is shown below.D,E, Cumulant density estimates during phasic contraction calculated between muscle and ECoG. InD, ECoG activity was recorded from the two adjacent bipolar pairs, indicated by the diagonal arrow inC. In E, ECoG activity was recorded from the two adjacent bipolar pairs, indicated by the horizontal arrow in C. The cumulant density estimates calculated for sites a or b are indicated by a purple line in D andE and have been inverted to highlight polarity reversal. The top and bottom horizontal linesindicate the 95% (Bonferoni corrected) confidence levels.
Fig. 3.

Summary of frequency sharing between electrodes and changes in frequency with task. A, Frequency histogram of the number of ECoG–EMG coherence spectra sharing a peak at the same frequency in a given record (pooled across all patients).B, Total incidence of significant coherence within the four frequency bands during both tonic and phasic contractions across all patients. In both A and B all significant points were counted when coherence spectra demonstrated more than one discrete significant peak.
Sites sharing the same frequency were clustered (Fig.2B,C), but covered several square centimeters of cortex. In three cases, sites sharing the same frequency of coherence within a given analysis were separated by 1–1.5 cm without any intervening coherence with muscle (Fig. 1B). In each of these cases the activities recorded at each of the bipolar ECoG sites were themselves coherent (five of six comparisons) at the same frequency at which they were coherent with muscle. These results are consistent with the presence of several separate sources of activity, each coherent with muscle and in turn with themselves at the same specific frequency. The alternative, that coherence between separate ECoG sites might result from volume conduction from a more localized single source, seems less likely given that volume conduction of spontaneous cortical activity is not seen between ECoG electrodes separated by as little as 3 mm (Copper et al., 1965). Moreover, in 87.5% of comparisons (seven of eight), there was no significant coherence at the relevant frequency between those electrode pairs in the above three subjects coherent with muscle and equidistant sites which were not coherent at that frequency. This was significantly different to the incidence of coherence at a given frequency seen when both of the bipolar sites were also coherent with muscle (p = 0.016; Fisher's exact test). This suggests that ECoG–ECoG coherence was specific to sites that were functionally linked, as demonstrated by their common relationship with muscle, and did not simply reflect volume conduction.
Localization of cortical activities correlated with muscle
Coherence with muscle in any of the frequency bands did not systematically favor electrodes giving a motor response, whether tonic and/or clonic, after electrical stimulation, or those activating the contralateral proximal or distal upper limb (χ2, p > 0.05, df = 2).
In contrast, there was a tendency for the distribution of those ECoG sites coherent with muscle to differ between frequency bands, although this did not reach statistical significance (χ2, p > 0.05, df = 4). ECoG sites coherent with muscle within the 7–14 and 15–30 Hz bands tended to straddle the central sulcus, whereas those coherent with muscle within the 61–100 Hz band tended to be found slightly anterior to the central sulcus (Fig. 4). Coherent activity within the 31–60 Hz band tended to be fairly uniformly distributed within the area analyzed. The distribution of those ECoG sites coherent with muscle at frequencies <30 Hz was confirmed in the time domain. In four of six subjects, reversals in the polarity of the cumulant density were observed. The period of the main oscillatory activity, as determined from the cumulant, was between 50 and 70 msec in eight of nine cumulant density estimates and corresponded to a peak in the relevant ECoG–EMG coherence spectra in the 15–30 Hz band (Fig. 5). In the remaining case, the period was 125 msec (∼8 Hz). In all eight cases where the cumulant estimates reflected 15–30 Hz activity, the phase reversal was centered on an electrode that was within 1 cm of the central sulcus. The electrode about which the phase reversal was centered was defined as producing a motor response on stimulation in six of eight cases (Fig. 2D,E). In the remaining case in which the cumulant had a period of 125 msec, the electrode about which the phase reversal occurred was one that produced a distal contralateral sensory response on stimulation. This electrode lay 1 cm posterior to the presumed central sulcus.
Fig. 4.

Localization of ECoG sites coherent with muscle over a given frequency band. The location of ECoG sites is given relative to the central sulcus. When the bipolar signal from two ECoG sites were coherent with muscle and sites lay on opposite sides of the central sulcus, this was defined as straddling the sulcus. The number of coherent ECoG sites averaged across all records for each subject is given after subtraction of that expected if coherent sites were randomly distributed across the whole sampled grid. A value of above zero therefore indicates that the number of sites at that location was higher than that expected. Note that coherence within the 7–30 Hz band was preferentially represented in ECoG electrodes that straddled the central sulcus and that at 60–100 Hz was over-represented just anterior to this.
Fig. 5.
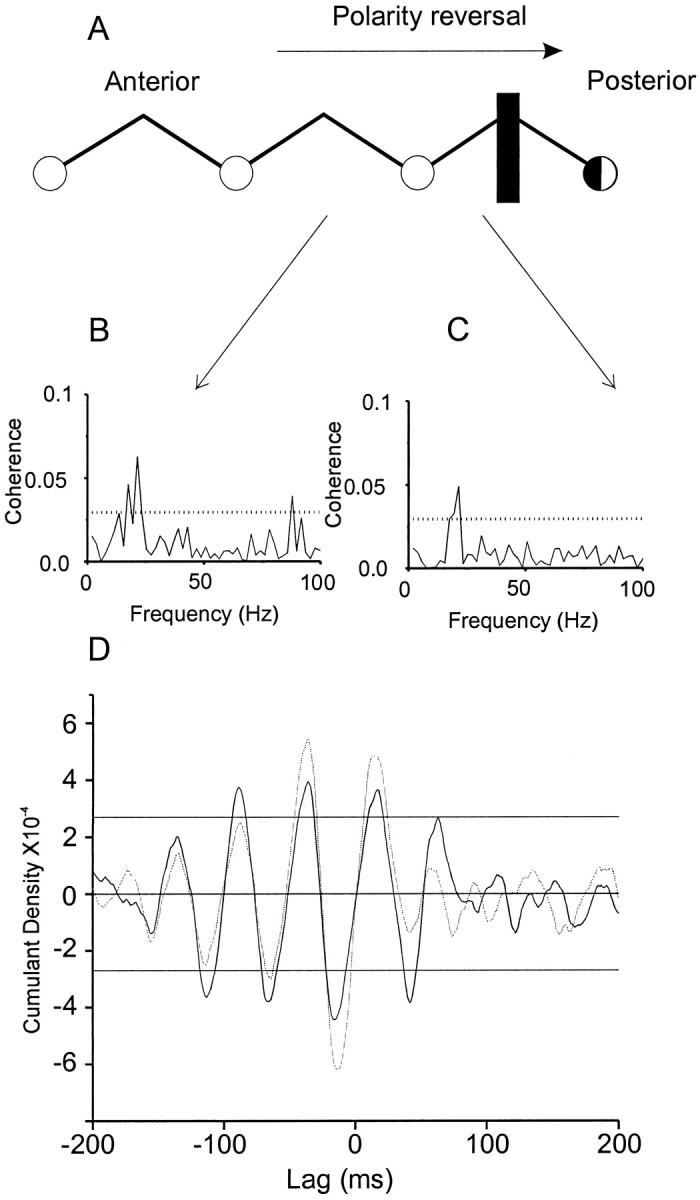
Reversal in the polarity of the cumulant density estimate between adjacent bipolar electrode sites. A, Case 2, Bipolar chain lying over the left sensorimotor cortex. The estimated position of the central sulcus is indicated by thevertical line. The electrode posterior to the central sulcus produced a motor response in the right extensor digitorum communis on stimulation. Coherence (B,C) and cumulant density estimates (D) calculated from signals recorded between the bipolar electrodes, which are indicated by arrows, and the right deltoid during tonic contraction. The cumulant density estimate corresponding toB is in gray and has been inverted to highlight polarity reversal.
Task-related changes in coherence
The incidence of significant coherence at different frequencies varied between tasks with significant coherence above 30 Hz tending to occur more frequently during phasic contractions and coherence below 30 Hz tending to occur during tonic contractions (χ2, p = 0.052, df = 1, Fig. 3B). In addition, the frequency of ECoG–EMG coherence at a given site often changed significantly with task. For the six subjects, within the 15–30, 31–60, and 61–100 Hz bands there were 14, 7, and 3 bipolar electrodes, respectively, in which the ECoG–EMG coherence changed significantly (p < 0.05) between phasic and tonic contractions. No such examples were seen in the 7–14 Hz band.
Importantly, tasks with common elements could share some of the same frequencies of ECoG–EMG coherence, and presumably therefore have in common certain cortical networks. This was established in cases 3 and 6, in which coherence was calculated between ECoG and either the forearm flexors or extensors during tonic wrist extension or flexion and during the flexion or extension phase of phasic wrist movements. During phasic movements, each muscle was silent when its antagonist was active and there was no cross-talk of electrical signals between muscles. During phasic wrist flexion and extension there was a tendency for the same frequency of coherence to be represented across the different phases of wrist movement, as if flexion and extension were organized as the same task, despite the different muscles involved. In contrast, there was minimal sharing of frequencies when the same patients then performed tonic flexion or extension of the wrist as separate tasks or if different muscles were compared during different task conditions (such as wrist flexors during phasic movements compared to wrist extensors during tonic contractions). Figure6 summarizes the incidence of common frequencies found between different tasks in the two subjects.
Fig. 6.

The incidence of common shared frequencies found between different tasks in cases 3 and 6. Tasks were assessed to ascertain if common frequencies of significant ECoG–EMG coherence occurred between certain tasks. Results are given as a percentage of the total number (T) of significant coherence peaks observed in the two tasks. The tasks were: same muscle, different movement (e.g., comparison of wrist flexors during phasic and isometric contractions; T = 22); different muscle, same movement (e.g., comparison of wrist extensors and flexors during phasic contraction; T = 21); different muscle, different movement (e.g., comparison of wrist flexors during tonic contraction and wrist extensors during phasic contraction; T = 22).
DISCUSSION
Frequencies involved in ECoG–EMG coherence
The areas of cortex analyzed were unaffected by epileptogenic activity or gross morphological abnormalities and were presumed to consist of normal cortex, although it is possible that minor functional abnormalities caused by the repeated spread of seizure activity were present. With this caveat, this study is the first to show coherence between normal cortical and muscle activity in the high gamma (61–100 Hz) range during voluntary contraction in humans. One of the advantages of the techniques used here over others is that cortical activity of high frequency is not attenuated by distance or interposed tissues (Elger and Burr, 1994). Nevertheless, some suggestion of coherence at high frequency has come from scalp EEG recordings in the pathological condition of cortical myoclonus (Brown et al., 1998b), and high-frequency activity within motor areas of the cortex was recently reported by Crone et al. (1998a) and Aoki et al. (1999). The finding of coherence in the 7–14 Hz band is also novel, but was rather inconsistent in the tasks used here. The presence of coherent activity between cortex and EMG at 15–30 and 31–60 Hz was confirmed (Conway et al., 1995; Baker et al., 1997; Salenius et al., 1997; Brown et al., 1998a; Kilner et al., 1999), although the task specificity noted in noninvasive studies is shown here to be a coarse approximation. Thus, the coherence at 15–30 Hz between cortex and muscle was by no means abolished on movement, and at some sites even increased during movement. Similarly, although the incidence of coherence over the gamma band was higher during phasic contraction, it was also not uncommon during tonic contraction.
Spatial extent of coherence
Coherence with muscle could be distributed across several square centimeters of cortex. A number of instances were found in which the frequency of coherence was identical at electrode sites separated by 1.0–1.5 cm, despite the fact that intervening cortex showed no coherence with muscle at the relevant frequency. Distributed patterns are also seen in the sites of cortical activation during single joint movements (Schieber and Hibbard, 1993; Sanes et al., 1995), in the motor response to stimulation (Sato and Tanji, 1989; Donoghue et al., 1992), and in the movement-related desynchronization of ECoG signals (Crone et al., 1998b).
The present study did not detect any predilection for coherence within a given frequency band to be associated with bipolar ECoG electrodes that were functionally defined as producing either an upper limb sensory or motor response on stimulation. Neither was there any relationship between coherence within a given band and any type of motor response, whether tonic or clonic, proximal, or distal. However, there was a tendency for ECoG sites coherent with activity within the lower frequency bands to straddle the central sulcus. Furthermore, the site of polarity reversal of cumulant density estimates reflecting β activity was also in close proximity to the central sulcus and usually involved a “motor” electrode. This suggests that the main source of cortical activity coherent with muscle in the 15–30 Hz band may be within or close to the central sulcus where the majority of the primary motor cortex is sited (White et al., 1997). This finding is consistent with MEG studies, which also localize the source of coherent MEG muscle activity within the 15–30 Hz to the central sulcus (Salenius et al., 1997; Brown et al., 1998a).
Role of coherence
The frequency of coherence seen was discrete, and within a given record several bipolar ECoG pairs were coherent with muscle at the same frequency more often than would be expected by chance. Often these ECoG pairs included a common electrode, suggesting the presence of a single source of oscillatory activity, although the fact that coherent oscillations were picked up at all using subdural macroelectrodes suggests that such sources themselves involve the extensive synchronization of cortical elements. The findings in three cases went even further than this. In these, coherence with muscle at a given frequency was found at sites separated by cortex that showed no such relationship. Importantly, these distributed sites were in turn coherent with each other. Previous investigators have suggested that common subthreshold or suprathreshold oscillatory activity across functionally related cortical sites may underlie the presence of synchronous firing, especially over distances longer than 2 mm (Volgushev et al., 1997; Konig et al., 1999). The synchronous firing of neurons may be more effective in causing summation at later stages of processing (Gray, 1994). In this way, common oscillatory activity may provide a mechanism for the binding together of functionally related cortical elements necessary for movement execution or higher order functions such as attention or ongoing motor planning (Brown and Marsden, 1998; Donoghue et al., 1998).
Task specificity
The coherence between ECoG and EMG activity suggests that these cortical sites are linked to the motor act, that is they form a functional ensemble. Coherence with muscle also implies that the cortical sites themselves may be coherent and therefore linked with one another, and, in many cases, this was confirmed. This suggests that those neuronal populations contributing to a given action are characterized by their tendency to resonate at specific frequencies. Pyramidal cell discharge tends to be phase-locked to oscillations in the local field potential (LFP) (Murthy and Fetz, 1996b), which are thus reflected downstream in the pattern of discharge of spinal motoneurons (Salenius et al., 1997; Brown et al., 1998b), thereby accounting for the coherence between ECoG and EMG. The latter may be taken as evidence that the synchronization of LFPs in segregated areas of the cortex is translated into a synchronization of action potentials at common postsynaptic sites such as the spinal anterior horn, a core prerequisite of the “binding” hypothesis. Furthermore, the pattern of three-way coherence between ECoG and EMG and ECoG and ECoG varied in both spatial and frequency domains between different tasks, consistent with a role in the bringing together of selected cortical elements into a given task. Thus, the incidence of coherence at different frequencies tended to show some task specificity. In addition, common frequencies were represented in related tasks, such as flexion and extension during repeated phasic movements of the wrist, but coherence tended to shift to new frequencies when unrelated tasks were performed.
In conclusion, we have shown that cortical networks may resonate at specific frequencies, (albeit chosen from a wide band). These resonances may involve primary motor, sensory, and premotor cortices and include sites giving very different kinds of response after stimulation, as might be expected from a mechanism that brings together distributed cortical elements. Importantly, resonant frequencies, and presumably the cortical networks that they reflect, are dynamic and change with task. Thus corticocortical synchronization occurs with a precision in the millisecond range, is essentially limited to those cortical elements active in a given task, and changes in both its distribution and frequency in a task-related manner. It may therefore have a role in the binding of related activities during different motor tasks.
Footnotes
We thank D. Halliday, J. R. Rosenberg, and D. Buckwell for statistical advice and the use of programs used in the analysis of data, A. Lozano and P. Winkler for the grid implantation and surgical treatment of the patients at TW and GRH, and E. Sincini for technical assistance.
Correspondence should be addressed to Dr. P. Brown, Medical Research Council Human Movement and Balance Unit, Institute of Neurology, Queen Square, WCIN 3BG London, UK. E-mail: p.brown@ion.ac.uk.
REFERENCES
- 1.Amjad AM, Halliday DM, Rosenberg JR, Conway BA. An extended difference of coherence test for comparing and combining several independent coherence estimates: theory and application to the study of motor units and physiological tremor. J Neurosci Methods. 1997;73:69–79. doi: 10.1016/s0165-0270(96)02214-5. [DOI] [PubMed] [Google Scholar]
- 2.Aoki F, Fetz EE, Shupe L, Lettich E, Ojemann GA. Increased gamma-range activity in human sensorimotor cortex during performance of visuomotor tasks. Clin Neurophysiol. 1999;110:524–537. doi: 10.1016/s1388-2457(98)00064-9. [DOI] [PubMed] [Google Scholar]
- 3.Baker SN, Olivier E, Lemon RN. Coherent oscillations in monkey motor cortex and hand muscle EMG show task-dependant modulation. J Physiol (Lond) 1997;501:225–241. doi: 10.1111/j.1469-7793.1997.225bo.x. [DOI] [PMC free article] [PubMed] [Google Scholar]
- 4.Brown P, Marsden CD. What do the basal ganglia do? Lancet. 1998;351:1801–1804. doi: 10.1016/s0140-6736(97)11225-9. [DOI] [PubMed] [Google Scholar]
- 5.Brown P, Salenius S, Rothwell JC, Hari R. The cortical correlate of the Piper rhythm in man. J Neurophysiol. 1998a;80:2911–2917. doi: 10.1152/jn.1998.80.6.2911. [DOI] [PubMed] [Google Scholar]
- 6.Brown P, Farmer SF, Halliday DM, Marsden JF, Rosenberg JR. Coherent cortical and muscle discharge in cortical myoclonus. Brain. 1998b;122:461–472. doi: 10.1093/brain/122.3.461. [DOI] [PubMed] [Google Scholar]
- 7.Conway BA, Halliday DM, Farmer SF, Shahani U, Maas P, Weir AL, Rosenberg JR. Synchronisation between motor cortex and spinal motoneuronal pool during the performance of a maintained motor task in man. J Physiol (Lond) 1995;489:917–924. doi: 10.1113/jphysiol.1995.sp021104. [DOI] [PMC free article] [PubMed] [Google Scholar]
- 8.Copper R, Winter AI, Crow HJ, Grey Walter W. Comparison of subcortical, cortical and scalp activity using chronically indwelling electrodes in man. Electroencephalogr Clin Neurophysiol. 1965;18:217–228. doi: 10.1016/0013-4694(65)90088-x. [DOI] [PubMed] [Google Scholar]
- 9.Crone NE, Migloiretti DL, Gordon B, Lesser RP. Functional mapping of human sensorimotor cortex with electroencephalographic analysis 2 Event related synchronisation in the gamma band. Brain. 1998a;121:2301–2315. doi: 10.1093/brain/121.12.2301. [DOI] [PubMed] [Google Scholar]
- 10.Crone NE, Migloiretti DL, Gordon B, Sieracki JM, Wilson MT, Uematsu S, Lesser RP. Functional mapping of human sensorimotor cortex with electroencephalographic analysis 1 Alpha and beta event-related desynchronisation. Brain. 1998b;121:2271–2299. doi: 10.1093/brain/121.12.2271. [DOI] [PubMed] [Google Scholar]
- 11.Donoghue JP, Leibovic S, Sanes JN. Organization of the forelimb area in squirrel monkey motor cortex: representation of digit, wrist, and elbow muscles. Exp Brain Res. 1992;89:1–19. doi: 10.1007/BF00228996. [DOI] [PubMed] [Google Scholar]
- 12.Donoghue JP, Sanes JN, Hatsopoulos NG, Gaal G. Neural discharge and local field potential oscillations in primate motor cortex during voluntary movements. J Neurophysiol. 1998;79:159–173. doi: 10.1152/jn.1998.79.1.159. [DOI] [PubMed] [Google Scholar]
- 13.Elger CE, Burr W. Subdural electrodes. Acta Neurol Scand [Suppl] 1994;152:44–50. doi: 10.1111/j.1600-0404.1994.tb05185.x. [DOI] [PubMed] [Google Scholar]
- 14.Engel JJ, Van Ness PC, Rasmussen TB, Ojemann LM. Outcome with respect to epileptic seizures. In: Engel J, editor. Surgical treatment of the epilepsies. Raven; New York: 1993. pp. 609–621. [Google Scholar]
- 15.Gotman J. Measurement of small time differences between EEG channels: method and application to epileptic seizure propagation. Electroencephalogr Clin Neurophysiol. 1983;56:501–514. doi: 10.1016/0013-4694(83)90235-3. [DOI] [PubMed] [Google Scholar]
- 16.Gray CM. Synchronous oscillations in neuronal systems: mechanisms and Functions. J Comput Neurosci. 1994;1:11–38. doi: 10.1007/BF00962716. [DOI] [PubMed] [Google Scholar]
- 17.Gray CM, Konig P, Engel AK, Singer W. Stimulus-specific Neuronal Oscillations in cat visual cortex exhibit inter-columnar synchronisation which reflects global stimulus properties. Nature. 1989;338:334–337. doi: 10.1038/338334a0. [DOI] [PubMed] [Google Scholar]
- 18.Halliday DM, Rosenberg JR, Amjad AM, Breeze P, Conway BA, Farmer SF. A framework for the analysis of mixed time series/point process data - theory and application to the study of physiological tremor, single motor unit discharges and electromyograms. Prog Biophys Mol Biol. 1995;64:237–278. doi: 10.1016/s0079-6107(96)00009-0. [DOI] [PubMed] [Google Scholar]
- 19.Hari R, Salenius S. Rhythmical corticomotor communication. NeuroReport. 1999;10:1–10. [PubMed] [Google Scholar]
- 20.Kilner JM, Baker SN, Salenius S, Jousmaki V, Hari R, Lemon RN. Task-dependant modulation of 15–30 Hz coherence between rectified EMGs from human hand and forearm muscle. J Physiol (Lond) 1999;516:559–570. doi: 10.1111/j.1469-7793.1999.0559v.x. [DOI] [PMC free article] [PubMed] [Google Scholar]
- 21.Konig P, Engel AK, Singer W. Relation between oscillatory activity and long-range synchronisation in cat visual cortex. Proc Acad Natl Acad Sci USA. 1999;92:290–294. doi: 10.1073/pnas.92.1.290. [DOI] [PMC free article] [PubMed] [Google Scholar]
- 22.Lesser RP, Luders HO, Klem G, Dinner DS, Morris HH, Hahn JF, Wyllie E. Extraoperative cortical functional localization in patients with epilepsy. J Clin Neurophysiol. 1987;4:27–53. doi: 10.1097/00004691-198701000-00003. [DOI] [PubMed] [Google Scholar]
- 23.Luders HO, Lesser RP, Dinner DS. Commentary: chronic intracranial recording and stimulation with subdural electrodes. In: Engel JJ, editor. Surgical treatment of the epilepsies. Raven; New York: 1987. pp. 297–321. [Google Scholar]
- 24.Murthy V, Fetz EE. Oscillatory activity in sensorimotor cortex of awake monkeys: synchronisation of local field potentials and relation to behaviour. J Neurophysiol. 1996a;76:3949–3967. doi: 10.1152/jn.1996.76.6.3949. [DOI] [PubMed] [Google Scholar]
- 25.Murthy V, Fetz EE. Synchronisation of neurones during local field potential oscillations in sensorimotor cortex of awake monkeys. J Neurophysiol. 1996b;76:3968–3982. doi: 10.1152/jn.1996.76.6.3968. [DOI] [PubMed] [Google Scholar]
- 26.Nudo RJ, Milliken GW, Jenkins WM, Merzenich MM. Use-dependent alterations of movement representations in primary motor cortex of adult squirrel monkeys. J Neurosci. 1996;16:785–807. doi: 10.1523/JNEUROSCI.16-02-00785.1996. [DOI] [PMC free article] [PubMed] [Google Scholar]
- 27.Salenius S, Portin K, Kajola M, Salmelin R, Hari R. Cortical control of human motoneuron firing during isometric contraction. J Neurophysiol. 1997;77:3401–3405. doi: 10.1152/jn.1997.77.6.3401. [DOI] [PubMed] [Google Scholar]
- 28.Sanes JN, Donoghue JP, Thangaraj V, Edelman RR, Warach S. Shared neural correlates controlling hand movements in human motor cortex. Science. 1995;268:1775–1777. doi: 10.1126/science.7792606. [DOI] [PubMed] [Google Scholar]
- 29.Sato KC, Tanji J. Digit-muscle responses evoked from multiple intracortical foci in monkey precentral motor cortex. J Neurophysiol. 1989;62:959–970. doi: 10.1152/jn.1989.62.4.959. [DOI] [PubMed] [Google Scholar]
- 30.Schieber MH, Hibbard LS. How somatotopic is the motor cortex hand area ? Science. 1993;261:489–492. doi: 10.1126/science.8332915. [DOI] [PubMed] [Google Scholar]
- 31.Singer W. Synchronisation of cortical activity and its putative role in information processing and learning. Annu Rev Neurosci. 1993;55:349–374. doi: 10.1146/annurev.ph.55.030193.002025. [DOI] [PubMed] [Google Scholar]
- 32.Volgushev M, Chistiakova M, Singer W. Modification of discharge patterns of neocortical neurones by induced oscillations of the membrane potential. Neuroscience. 1997;83:15–25. doi: 10.1016/s0306-4522(97)00380-1. [DOI] [PubMed] [Google Scholar]
- 33.White LE, Andrews TJ, Hulette C, Richards A, Groelle M, Paydarfar J, Purves D. Structure of the human sensorimotor system 1: morphology and cytoarchitecture of the central sulcus. Cereb Cortex. 1997;7:18–30. doi: 10.1093/cercor/7.1.18. [DOI] [PubMed] [Google Scholar]
- 34.Zilles K, Schlaug G, Matelli M, Luppino G, Schleucher A, Qu M, Dabringhaus A, Seitz R, Roland P. Mapping of human and macaque sensorimotor areas by integrating architectonic, transmitter receptor, MRI and PET data. J Anat. 1995;187:515–537. [PMC free article] [PubMed] [Google Scholar]