Abstract
Cytoskeletal proteins are axonally transported with slow components a and b (SCa and SCb). In peripheral nerves, the transport velocity of SCa, which includes neurofilaments and tubulin, is 1–2 mm/d, whereas SCb, which includes actin, tubulin, and numerous soluble proteins, moves as a heterogeneous wave at 2–4 mm/d. We have shown that two isoforms of microtubule-associated protein 1B (MAP1B), which can be separated on SDS polyacrylamide gels on the basis of differences in their phosphorylation states (band I and band II), were transported at two different rates. All of band I MAP1B moved as a coherent wave at a velocity of 7–9 mm/d, distinct from slow axonal transport components SCa and SCb. Several other proteins were detected within the component that moved at the velocity of 7–9 mm/d, including the leading wave of tubulin and actin. The properties of this component define a distinct fraction of the slow axonal transport that we suggest to term slow component c (SCc). The relatively fast transport of the phosphorylated MAP1B isoform at 7–9 mm/d may account for the high concentration of phosphorylated MAP1B in the distal end of growing axons. In contrast to band I MAP1B, the transport profile of band II was complex and contained components moving with SCa and SCb and a leading edge at SCc. Thus, MAP1B isoforms in different phosphorylation states move with distinct components of slow axonal transport, possibly because of differences in their abilities to associate with other proteins.
Keywords: slow axonal transport, cytoskeleton, protein phosphorylation, sciatic nerve, dorsal root ganglion neurons, tubulin, neurofilaments
Cytoskeleton proteins are synthesized in neuronal cell bodies and anterogradely transported along axons by slow axonal transport (Ochs, 1972; Willard et al., 1974;Hoffman and Lasek, 1975; Black and Lasek, 1978). The analysis of slow axonal transport initially focused on metabolic-labeling studies with radioactive amino acids in systems such as the optic and sciatic nerves. These studies showed two waves that moved at different rates, slow component a (SCa) at 0.1–1 mm/d and SCb at 2–4 mm/d (Hoffman and Lasek, 1975; Black and Lasek, 1979, 1980). SCa is primarily composed of neurofilament and tubulin, whereas SCb contains a large number of cytoplasmic proteins that include actin, myosin, clathrin, calmodulin, synapsin, tubulin, tau, and microtubule-associated protein 1A (MAP1A) (Hoffman and Lasek, 1975; Willard, 1977; Black and Lasek, 1979; Brady et al., 1981; Garner and Lasek, 1981; Lasek et al., 1984; Hoffman et al., 1985; Baitinger and Willard, 1987; Tashiro and Komiya, 1989;Watson et al., 1989; Nixon et al., 1990; Mercken et al., 1995; Tashiro et al., 1996; Koehnle and Brown, 1999). The transport velocities of the slow components in PNS axons are faster than those in CNS axons and may reflect the differences in length, structure, and composition of the corresponding nerves. There are various proposals concerning the definition and classification of the different components of slow axonal transport, including the observation that some polypeptides can move at rates faster than 4 mm/d (Karlsson and Sjostrand, 1971; Willard et al., 1974; Garner and Lasek, 1982). However, kinetic analysis of the rate of movement of the waves of radiolabeled proteins in axons and their shape, persistence, and composition have all contributed to a diversity of views on the mechanism of slow axonal transport. There is also disagreement on the form of the assembly and transport of the cytoskeleton, particularly for microtubules (for review, see Baas and Yu, 1996; Joshi, 1998; Nixon, 1998). One model emphasizes the steady movement of assembled microtubules (Lasek et al., 1984), whereas the other argues that microtubules can move as subunits or oligomers and assemble distally (Bamburg et al., 1986). Slow axonal transport may have elements of both models, allowing both transport and assembly to occur simultaneously via interactions of different cytoskeleton elements.
Microtubules and a group of MAPs play important roles in the elaboration of neuritic processes during development and in defining mature neuronal morphology (Hirokawa, 1994). The controversy over the axonal transport mechanism of microtubules raises the question of how MAPs are transported along the axon because they associate with microtubules and modulate their dynamics. MAP1B is the earliest microtubule-associated protein expressed in the developing nervous system (Bloom et al., 1985) and remains high in adult dorsal root ganglion (DRG) neurons and sciatic nerve axons (Ma et al., 1997). The heterogeneity of MAP1B is caused by differential phosphorylation (Matus, 1988; Fischer and Romano-Clarke, 1990; Ulloa et al., 1993). The different phosphorylated isoforms of MAP1B can be separated on SDS-PAGE into two protein bands of 340 and 320 kDa, termed mode I and mode II isoforms (Diaz-Nido et al., 1988; Ulloa et al., 1993, 1994). These isoforms of MAP1B are differentially regulated during development, have different distributions in neuronal compartments, and are phosphorylated by different types of kinases. However, because these properties do not always correlate with the position of the protein bands on gels, we use the more descriptive term of band I and band II isoforms when the isoforms are identified by gel electrophoresis and specify the antibody used to define a specific phosphorylation isoform (Fischer and Romano-Clarke, 1990; Gordon-Weeks et al., 1993; Black et al., 1994;Boyne et al., 1995; Johnstone et al., 1997).
In the present study we demonstrate that the band I MAP1B isoform moves as a coherent wave at a velocity of 7–9 mm/d, distinct from slow axonal transport components SCa and SCb. In contrast, the band II MAP1B isoform moves with SCa (1.5 mm/d) and SCb (4 mm/d), overlapping with the transport of tubulin and actin.
MATERIALS AND METHODS
Injections of [35S]methionine and [35S]cysteine. All procedures were approved by the institutional animal welfare committee of MCP Hahnemann University and conformed to National Institutes of Health guidelines for the care and use of laboratory animals. Adult female Sprague Dawley rats (250 gm; Taconic, Germantown, NY) were anesthetized with a cocktail of xylazine (10 mg/kg), ketamine (95 mg/kg), and acepromazine (0.7 mg/kg) administered intraperitoneally. The L5 DRG was exposed by a partial laminectomy. Two microliters of saline containing 250 μCi of the [35S]methionine and [35S]cysteine mixture (>1000 Ci/mmol; concentrated to 25 mCi/0.2 ml; DuPont NEN, Wilmington, DE) were injected into the midpoint of the DRG using a glass micropipette.
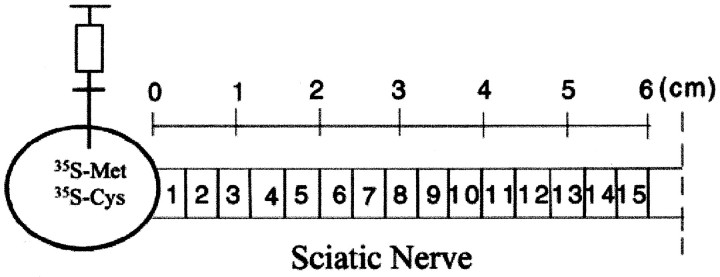
Tissue preparations. Rats were deeply anesthetized and killed 4, 6, 13, and 30 d after injection. The L4 and L5 dorsal roots and the sciatic nerve were dissected from the spinal cord to where it divides in the lower thigh (Fig.1). The sciatic nerve was aligned and then frozen on dry ice. The frozen nerve (∼60 mm in length) was put on a Mickel gel slicer and cut into 15 consecutive 4 mm segments. Each segment was homogenized in 100 μl of homogenization buffer containing 1% SDS [50 mm Tris, 2 mm EDTA, 1 mm phenylmethylsulfonyl fluoride (PMSF), 1.0% Aprotinin, and 25 μm leupeptin, pH 7.5] in a small plastic-Teflon homogenizer. After centrifugation at 15,000 rpm for 15 min at 4°C, the supernatants were frozen on dry ice and kept at −80°C. For SDS-PAGE, the supernatant was mixed with 80 μl of 2× SDS sample buffer.
Fig. 1.
Diagram showing the injection of the [35S]methionine and [35S]cysteine mixture into the DRG and the orientation of the sciatic nerve segments used for fluorographic studies.
SDS-PAGE and fluorography. Axonally transported radiolabeled proteins were analyzed by SDS-PAGE and fluorography (2–3 animals/time point). A high-resolution gradient gel (4–10% acrylamide; 1.5 mm thickness) was used to separate labeled proteins. The entire supernatant prepared from each nerve segment, from the DRG to the distal segment of the sciatic nerve, was loaded into the consecutive wells of the gel. Prestained protein molecular weight markers ranging from 33 to 180 kDa (Sigma, St. Louis, MO) were used to determine the position of specific proteins, such as tubulin, neurofilaments, actin, and high-molecular weight tau. After gel electrophoresis, gels were soaked in a fixation solution containing 10% glacial acetic acid and 30% methanol for 30–60 min. For fluorography, these fixed gels were impregnated with the scintillator Entensify NEF-992 (DuPont NEN), dried with vacuum under heat using temperature in the range of 60–70°C, and exposed to Kodak X-OMAT AR x-ray film at −80°C. Quantitative analysis of radiolabeled protein levels was performed by scanning the digitized images of the fluorography; the integrated density of the radiolabeled protein bands, within the linear range of analysis (Ma et al., 1999), was calculated using the ONE-Dscan software package (Scanalytics, Billerica, MA).
Western blots. Brains, DRGs, and sciatic nerves were homogenized in 5 vol by weight of homogenization buffer containing 1% SDS (50 mm Tris, 2 mm EDTA, 1 mmPMSF, 1.0% Aprotinin, and 25 μm leupeptin, pH 7.5) and centrifuged in a microfuge at 15,000 rpm at 4°C for 15 min, and the supernatant was stored at −80°C. Protein concentration was determined by the BCA Protein Assay Reagent (Pierce, Rockford, IL). Samples were loaded onto gradient polyacrylamide gels (4–10%), transferred onto nitrocellulose membranes, and incubated with the MAP1B polyclonal antibody 1BNR (Ma et al., 1999) or the MAP1B monoclonal antibody clone 1BP (Black et al., 1994; Boyne et al., 1995) and the appropriate secondary antibodies followed by chemiluminescent detection (Supersignal; Pierce).
To identify MAP1B, we also analyzed axonally transported radiolabeled proteins by SDS-PAGE and fluorography followed by Western blots. Radiolabeled proteins extracted from consecutive segments of sciatic nerve were separated on SDS-PAGE, transferred onto nitrocellulose membrane, impregnated with the enhancer spray NEF-970 (DuPont NEN), and exposed to Kodak X-OMAT AR x-ray film at −80°C. The same membrane was then incubated with the MAP1B monoclonal antibody clone 1BP (1:1000) (Black et al., 1994; Boyne et al., 1995) and clone 1.2 (1:200) (Fischer and Romano-Clarke, 1990; Ma et al., 1997) followed by DAB color detection. The radiolabeled protein bands of the fluorography were compared with MAP1B bands detected by the MAP1B antibodies on the Western blot (data not shown).
Immunoprecipitation of MAP1B protein. Frozen tissue was homogenized with 100 μl of Tris buffer without SDS (50 mmTris, 2 mm EDTA, 1 mm PMSF, 1.0% Aprotinin, and 25 μm leupeptin, pH 7.5). After centrifugation, the supernatant containing radiolabeled MAP1B protein was mixed with 300 μl of immunoprecipitation buffer (100 mm Tris-HCl, 200 mm NaCl, 10 mm EDTA, 1.25% NP-40, 1 mm PMSF, 1.0% Aprotinin, and 25 μmleupeptin, pH 7.4). Immobilized protein A (Pierce) was incubated with the above mixture at 4°C for 2 hr. After centrifugation and collection of the supernatant, the polyclonal antibody 1BNR (10 μl) was mixed with 400 μl of supernatant and then incubated overnight at 4°C. This mixture was then incubated with additional immobilized protein A (50 μl) at 4°C for 4 hr. After six washes with TBS (100 mm Tris-HCl, 200 mm NaCl, 10 mmEDTA, 1 mm PMSF, 1.0% Aprotinin, and 25 μmleupeptin, pH 7.4), the immunoprecipitated protein was eluted from the protein A gel by boiling in 100 μl of 2× SDS sample buffer for 5 min and prepared for SDS-PAGE analysis. After gel electrophoresis, gels were fixed, impregnated, dried, and exposed for fluorographic analysis, as described above.
Taxol microtubule preparations. The taxol method (Vallee, 1982) was used to prepare microtubule fractions from the radiolabeled sciatic nerves. The frozen tissue was homogenized in 2 vol of MEM buffer (50 mm PIPES, pH 6.6, 1 mmMgSO4, 1 mm EGTA, and protease inhibitors) and centrifuged at 40,000 × g for 30 min. The supernatant was adjusted to contain 10 mmtaxol and 1 mm GTP, incubated at 37°C to polymerize the microtubules, and centrifuged at 40,000 ×g for 15–30 min. The pellet containing the radiolabeled microtubule proteins was rinsed with 100 μl of MEM, resuspended in 1× SDS sample buffer, and used for SDS-PAGE analysis. After gel electrophoresis, gels were treated for further fluorographic analysis, as described above.
RESULTS
Identification of MAP1B isoforms during axonal transport
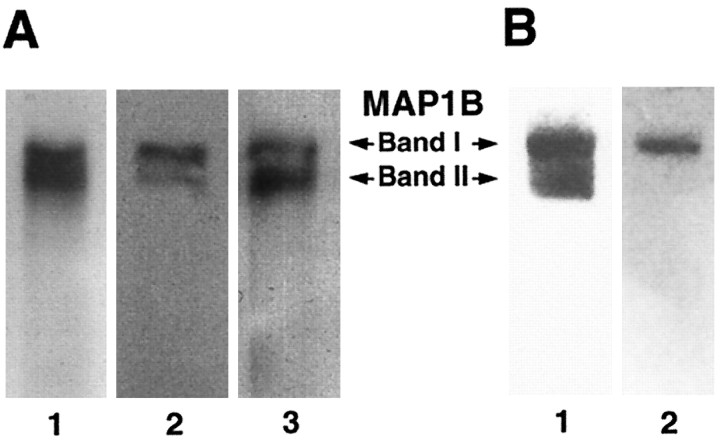
The expression of MAP1B in adult sciatic nerve was characterized by Western blot analysis. MAP1B isoforms can be resolved into two distinct bands of 340 and 320 kDa, referred to as the band I and band II isoforms of MAP1B (Fig.2A, lane 3). The presence of the two prominent bands of MAP1B in adult sciatic nerve is consistent with previous studies indicating that the levels of MAP1B remain relatively high in the adult peripheral nervous system (Bush et al., 1996b; Ma et al., 1997). The presence of two similar MAP1B bands can also be observed in the DRG and in the developing brain (Fig.2A, lanes 2, 1, respectively). The identity of the band I isoform was further characterized by showing that it can be specifically recognized by the 1BP monoclonal antibody (Fig. 2B, lane 2). Our previous studies demonstrated that the 1BP antibody recognizes a phosphorylated MAP1B isoform (Boyne et al., 1995) that is developmentally regulated (Ma et al., 1997) and concentrated in the distal region of growing axons (Black et al., 1994).
Fig. 2.
Western blots probed with the MAP1B polyclonal antibody 1BNR (1:5000 dilution). A, Heterogeneity of the MAP1B protein in rat brain at postnatal day 7 (lane 1; 20 μg), adult DRG (lane 2; 30 μg), and sciatic nerve (lane 3; 40 μg) is shown. B, In rat brain the antibody 1BNR detected both bands I and II (lane 1), but the monoclonal 1BP antibody, which recognizes a phosphorylated isoform of MAP1B, reacted specifically with band I (lane 2).
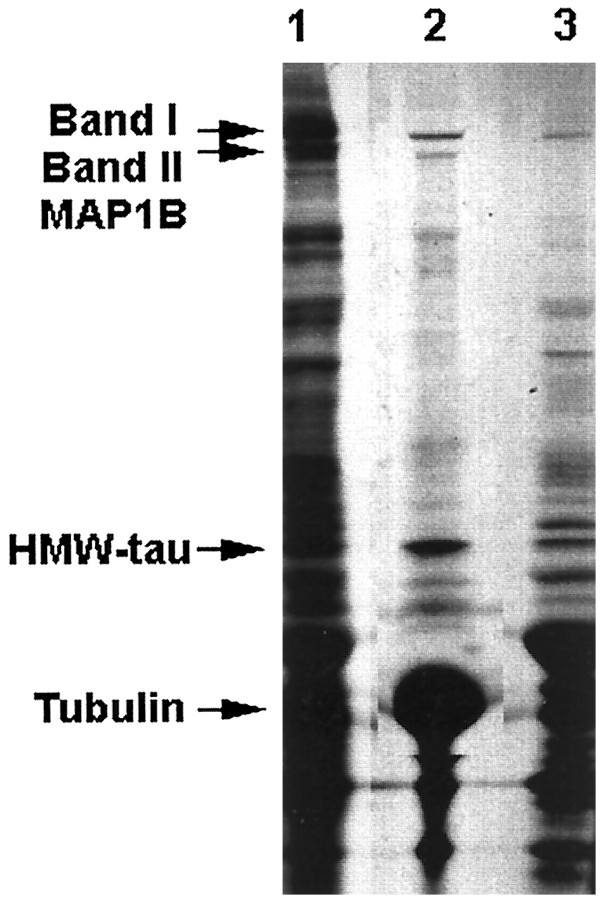
To determine the rate of axonal transport of MAP1B isoforms in sciatic nerve, we radiolabeled DRG neurons by injection of [35S]methionine and [35S]cysteine into the L5 DRG of adult rats. The sciatic nerves were removed and separated into 15 consecutive 4 mm segments at 4, 6, 13, and 30 d after radiolabeling. The labeled proteins, analyzed by SDS-PAGE and fluorography, showed that the two MAP1B isoforms at 340 and 320 kDa had major differences in the distribution of their transport waves at 4 d (Fig.3A), 6 d (Fig.3B), and 13 d (Fig. 3C) after injection of isotope. The identification of MAP1B isoforms was confirmed by immunoprecipitation experiments with a specific MAP1B antibody. Four sciatic nerve segments (S2, S5, S8, and S11) and the L5 DRG, radiolabeled for 6 d, were pooled from two rats (Fig.3B) and immunoprecipitated separately (Fig.4). The results show the immunoprecipitation of the two putative MAP1B isoforms; the 340 kDa band of MAP1B (band I) was present only in segments 5, 8, and 11, whereas the 320 kDa band of MAP1B (band II) was present in all segments including the DRG. This profile matched the distribution of these isoforms on SDS-PAGE of the complete sciatic nerve (Fig. 3B) and confirmed the differences in the axonal transport rate of the two MAP1B isoforms. The immunoprecipitation of these proteins was quantitative because densitometric analysis showed that 94% of the MAP1B immunoreactivity was present in the immunoprecipitant. Preparations of microtubules from the radiolabeled sciatic nerve by the taxol method indicated that the two MAP1B isoforms were present in the microtubule fraction (Fig. 5) and confirmed the identity of these bands as microtubule-associated proteins. This identity was also verified by Western blot analysis of the radiolabeled proteins (data not shown). Taken together, these data indicated that MAP1B was transported as two distinct isoforms at different axonal transport rates.
Fig. 3.
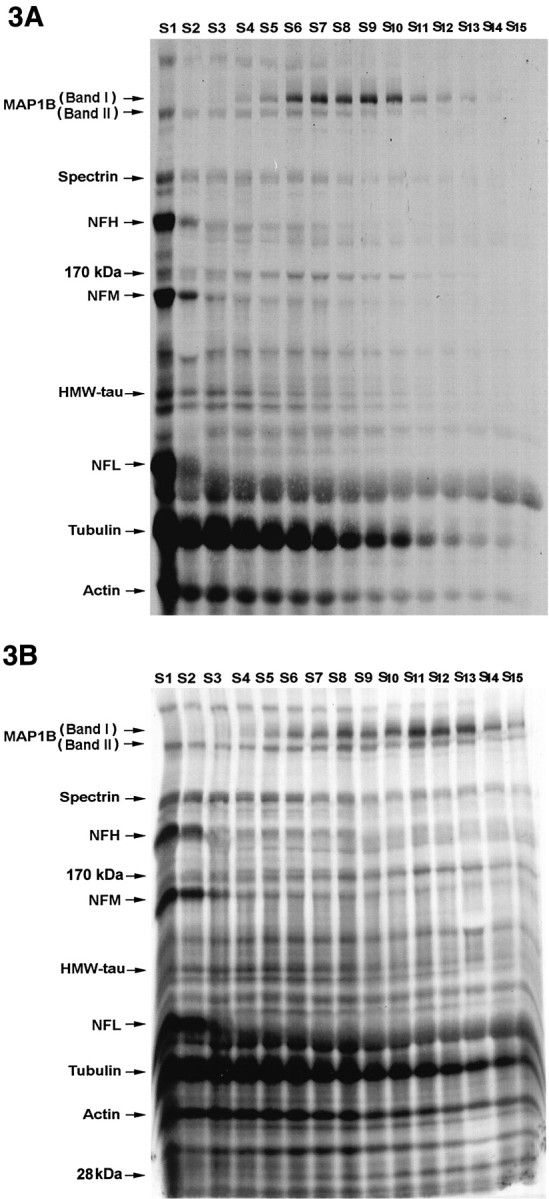
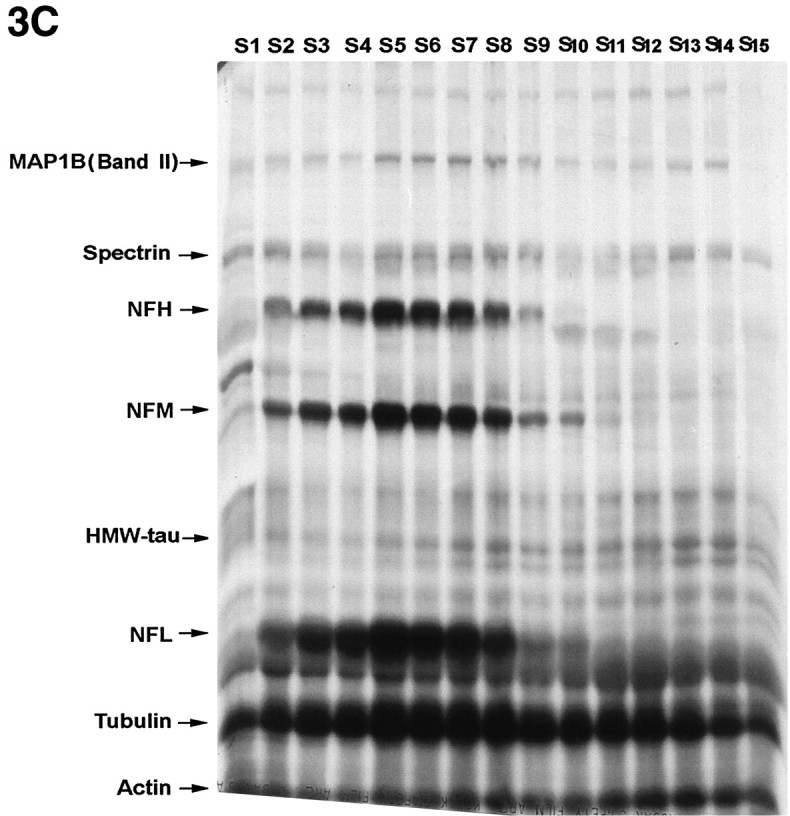
Fluorographs illustrating the slow transport profiles of radiolabeled proteins in sciatic axons of DRG neurons by 4 d (A), 6 d (B), and 13 d (C) after injection of [35S]methionine and [35S]cysteine. The lanes(S1–S15) in these gels represent 15 consecutive 4 mm sciatic nerve segments progressing distally from the DRG.HMW-tau, High-molecular weight tau (110 kDa);MAP1B, microtubule-associated protein 1B (320–340 kDa);NFH, high-molecular weight neurofilament (200 kDa);NFL, low-molecular weight neurofilament (70 kDa);NFM, middle-molecular weight neurofilament (160 kDa);S1–S15, segments 1–15.
Fig. 4.
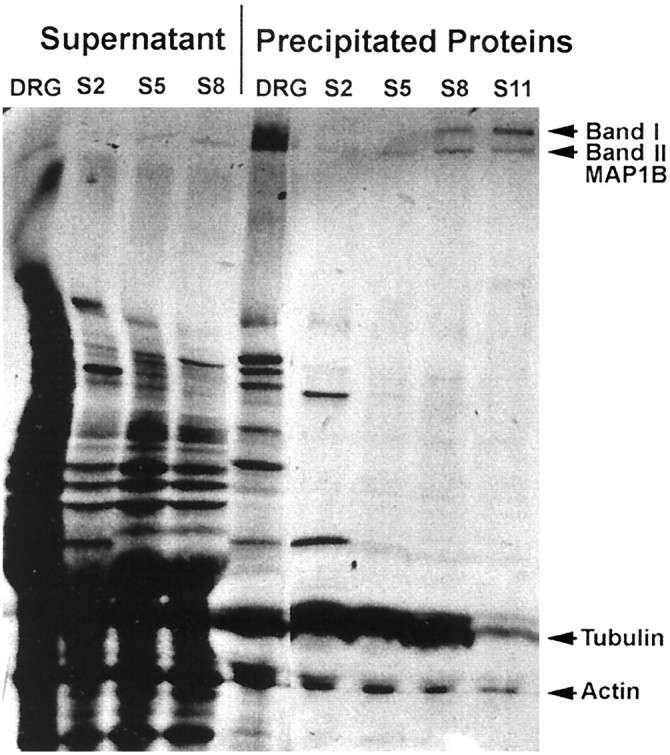
Immunoprecipitation identifying the radiolabeled MAP1B isoforms in the L5 DRG and sciatic nerve segments 2, 5, 8, and 11 by day 6 after injection. Total labeled protein homogenates were incubated with the specific MAP1B polyclonal antibody 1BNR and precipitated by protein A-bound agarose beads. DRG, Dorsal root ganglion; MAP1B, microtubule-associated protein 1B (320–340 kDa); S2, segment 2;S5, segment 5; S8, segment 8;S11, segment 11.
Fig. 5.
Taxol preparations of microtubules showing radiolabeled MAP1B proteins through in vitro microtubule assembly from the sciatic nerve segments 8–14 obtained 6 d after injection. The taxol-assembled microtubule pellet (lane 2) contains both band I and band II MAP1B isoforms. Total radiolabeled proteins in the supernatant extracted by homogenization buffer containing SDS are shown in lane 1, whereas the nonmicrotubule supernatant is shown in lane 3.HMW-tau, High-molecular weight tau (110 kDa);MAP1B, microtubule-associated protein 1B.
Axonal transport of MAP1B isoforms in rat dorsal root ganglion cells
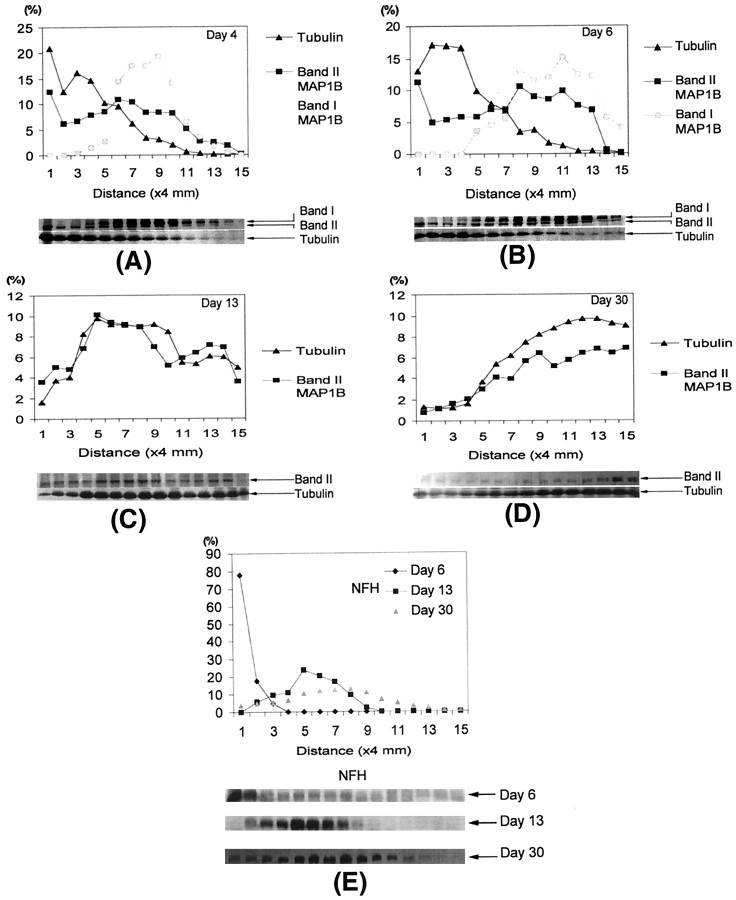
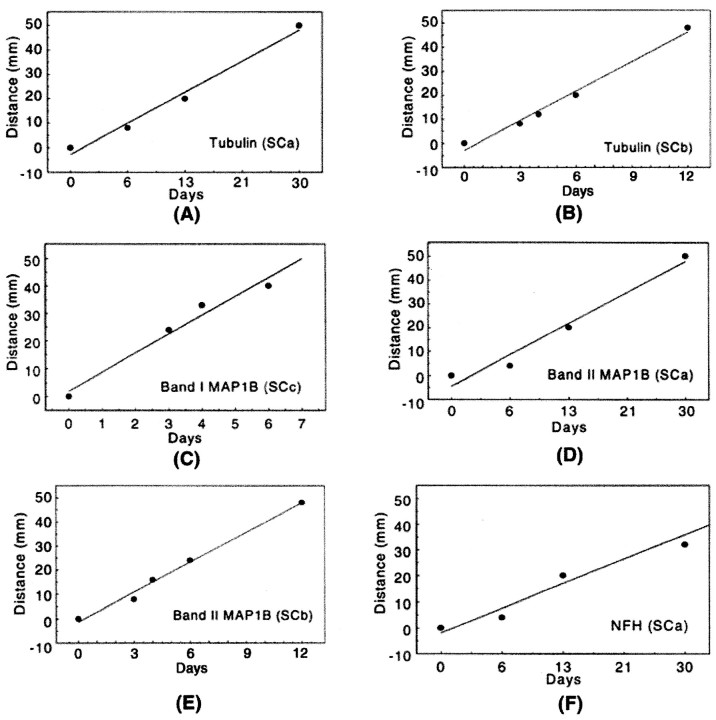
The differences in the axonal transport rates of the two MAP1B isoforms are illustrated by analysis of sciatic nerves that were radiolabeled for 4, 6, and 13 d (Fig. 3). By day 4 after the radiolabeling, the peak of the band I MAP1B transport wave moved a distance of 36 mm (Fig. 3A, segment 9), and by 6 d it moved a distance of 44 mm (Fig. 3B,segment 11) indicating a velocity of 7–9 mm/d. In agreement with this rate, by 13 d band I was no longer detectable even in distal segments of the 60 mm sciatic nerve (Fig. 3C). When the radioactivity of band I MAP1B was plotted against the distance from the DRG, the movement of the wave and the position of the peak could readily be analyzed and compared with that of the other MAP1B isoform (Fig. 6). In contrast to band I, the axonal transport of band II was more complex and included several waves. The leading edge of band II moved with a velocity that was similar to that of the band I isoform as observed at 4 and 6 d after isotope injection (Fig. 3A,B). The peak of the band II transport waves moved at a velocity of 1–4 mm/d. These transport waves showed the best resolution at 13 d after isotope injection with one discrete peak at a distance of 20 mm moving with SCa at a velocity of 1.5 mm/d (Fig. 6C, segment 5) and a second peak at a distance of 52 mm moving with SCb at a velocity of 4 mm/d (Fig. 6C, segment 13). Indeed, at 30 d, band II showed only a single peak at a distance of 45 mm corresponding to SCa at a consistent velocity of 1.5 mm/d; the second peak corresponding to SCb remained only as a trailing shoulder in the most distal segments. The same pattern and transport rates were also observed in regenerating axons after sciatic nerve axotomy (data not shown). In summary, the two radiolabeled MAP1B isoforms (band I and band II) showed distinct rates of axonal transport. All of band I was transported in a coherent wave of 7–9 mm/d, which also contained the leading wave of band II. The transport profile of band II was more complex and contained components moving with SCa and SCb at a velocity of 1.5 and 4 mm/d, respectively.
Fig. 6.
The distribution of radiolabeled tubulin and MAP1B in the sciatic nerve axons at 4 d (A), 6 d (B), 13 d (C), and 30 d (D) after injection and the distribution of radiolabeled NFH in the sciatic nerve axons at 6, 13, and 30 d after injection (E). The amount of radioactivity in consecutive 4 mm segments of the sciatic nerve, expressed relative to the total radioactivity of each specific protein in the sciatic nerve, is plotted against distance from the DRG. The data shown are the average of three to four independent determinations. NFH, High-molecular weight neurofilament; MAP1B, microtubule-associated protein 1B.
Comparison of the axonal transport kinetics of MAP1B isoforms and tubulin
We compared the different transport velocities of the MAP1B isoforms with those of identifiable proteins whose rate of transport is known. We were able to identify on SDS-PAGE the bands of spectrin (220 kDa), the neurofilaments (high-molecular weight neurofilament at 200 kDa, middle-molecular weight neurofilament at 160 kDa, and low-molecular weight neurofilament at 70 kDa), tubulin (50 kDa), and actin (40 kDa). The slow axonal transport of the major cytoskeletal proteins is associated predominantly with SCa and SCb. All three neurofilament subunits that are known to be transported in SCa showed coherent waves that moved at a velocity of 1.5 mm/d and clearly defined this transport component (Figs. 3C,7F). The tubulin proteins that are known to be transported in both SCa and SCb showed waves that moved at velocities of 1.5 and 4 mm/d, best seen in Figures6C and 7, A and B. In contrast, the wave of the band I isoform of MAP1B moved at a velocity of 7–9 mm/d, distinct from SCa and SCb as demonstrated in the following analysis (Fig. 7C). At 4 d after isotope injection ∼95% of the labeled band I was transported beyond segment 5, whereas ∼80% of tubulin was at segments 1–5, and 85% of the neurofilaments were in segment 1 (Figs. 3A, 6A). At 6 d after isotope injection ∼85% of the labeled band I had traveled beyond segment 7, whereas 90% of tubulin was in segments 1–7, and 98% of the neurofilaments were in segments 1–2 (Figs.3B, 6B). Interestingly, although tubulin did not have a discrete peak that moved with band I MAP1B, the leading wave of tubulin moved at a velocity of 7–9 mm/d, indicating that a small fraction of tubulin, representing 5–10% of this protein, overlapped with the band I transport wave. In contrast to band I, the slow transport waves of the band II isoform overlapped with the SCa and SCb waves of tubulin, best seen in Figures 6C and 7,D and E, indicating the similarity in the transport profile between this MAP1B isoform and tubulin. Similar overlap was observed with other proteins that moved at both SCa and SCb rates, including spectrin and actin. As with tubulin, the leading edge of the transport wave for both spectrin and actin moved at a velocity of 7–9 mm/d, indicating that a small fraction of these proteins also overlapped with the band I transport wave. We also observed that the wave of band I was not the only protein moving at 7–9 mm/d. There were several other unknown protein bands with waves whose transport velocity was similar to that of band I (e.g., Fig. 3A,B, 170 and 28 kDa), indicating that the slow component of the band I transport wave defines a distinct transport fraction with a defined group of proteins.
Fig. 7.
Regression analysis of three slow components of axonal transport in adult rat sciatic nerves. Tubulin is transported with both SCa (A) and SCb (B), whereas neurofilament proteins including NFH are exclusively transported with SCa (F). Interestingly, the band I MAP1B isoform and a fast wave of the band II MAP1B isoform move with SCc (C), whereas the band II MAP1B isoform moves mainly with SCa (D) and SCb (E). MAP1B, Microtubule-associated protein 1B; NFH, high-molecular weight neurofilament; SC, slow component.
DISCUSSION
We have shown that the two isoforms of MAP1B, which are present in peripheral axons and can be separated on SDS gels on the basis of differences in their phosphorylation states, are transported at two different rates. One of the isoforms moves at a velocity of 7–9 mm/d, which is distinct from the previously described components of slow axonal transport SCa (1.5 mm/d) and SCb (4 mm/d). We have also observed that there are several other proteins that are transported at a velocity of 7–9 mm/d. We consider that this isoform may be representative of the third class of slow transport, which we tentatively refer to as SCc. In contrast, the second isoform of MAP1B moves with SCa (1.5 mm/d) and SCb (4 mm/d), in a pattern that overlaps with the transport of tubulin and actin. These findings indicate that isoforms of MAP1B in different phosphorylation states move in distinct components of slow axonal transport possibly because of changes in their ability to associate with other proteins. These results suggest that elements of the neuronal cytoskeleton have a broad range of axonal transport rates that are best defined by three slow components.
Identity of MAP1B isoforms in adult sciatic nerve axons during transport
Both the band I and band II isoforms of MAP1B were detected in adult sciatic nerve axons, DRG, and neonate brain (Fig.2A) by a specific antibody (1BNR) that was prepared against the recombinant MAP1B protein (Ma et al., 1999). In addition, band I was recognized (Fig. 2B) by a monoclonal antibody (1BP) with specificity to a phosphorylated isoform of MAP1B that is developmentally regulated and concentrated in the distal region of growing axons (Black et al., 1994; Boyne et al., 1995; Ma et al., 1997). However, the relative levels of these bands varied in the different tissues reflecting the heterogeneity of the MAP1B isoforms in relation to their multiple phosphorylation sites. The two MAP1B isoforms were quantitatively immunoprecipitated from four separate segments of sciatic nerves that were radiolabeled for 6 d. More than 90% of the two radiolabeled bands were present in the immunoprecipitated fraction (Fig. 4). Furthermore, the profile of the two MAP1B isoforms in the four segments that were immunoprecipitated was very similar to the profile of proteins observed in the 6 d-radiolabeled sciatic nerves (Fig. 3B). Microtubule preparations of the radiolabeled sciatic nerve showed that both MAP1B isoforms are assembled with tubulin in the presence of taxol. However, only 50% of the MAP1B isoforms were recovered in the microtubule fraction because of the known inefficiency of MAP1B to assemblein vitro with microtubules (Takemura et al., 1992; Pedrotti and Islam, 1995).
There are several possible explanations why the presence of the two prominent MAP1B isoforms in the slow axonal fraction was not reported in previous studies that documented the axonal transport of tubulin, neurofilament, and tau. First, most of the previous studies used 7.5 or 10% acrylamide gels that are optimal for separation of proteins at a range of 50–200 kDa but do not resolve well the high-molecular weight isoforms of MAP1B at 320–430 kDa (Hoffman and Lasek, 1980; Tashiro and Komiya, 1989; Tashiro et al., 1996). Consequently, for our studies we used 4–10% gradient SDS gels that can separate the MAP1B protein bands at 320–340 kDa. Second, because of the relatively fast transport of band I MAP1B at 7–9 mm/d, the transport wave of this protein after 1 week would have reached the limit of the analyzed range, and after 2 weeks it would no longer be detectable. This limitation makes MAP1B protein easy to miss, particularly when most of the previous studies have focused on SCa and SCb proteins and were therefore performed at relatively long times after the radiolabeling. In a retrospective analysis of published data it is interesting to note that in several studies of neurofilament and tubulin transport, two high-molecular weight proteins similar to the MAP1B isoforms were observed but not characterized (Oblinger and Lasek, 1988; Moskowitz and Oblinger, 1995).
The band I MAP1B isoform represents a distinct slow component of axonal transport (SCc)
Several early reports have shown that the transport mechanism of slow components is more complicated than thought previously (Karlsson and Sjostrand, 1971; Willard et al., 1974; Hoffman and Lasek, 1975;Willard, 1977; Black and Lasek, 1979; Garner and Lasek, 1982). The observations of an additional slow component moving at 4–12 mm/d (Karlsson and Sjostrand, 1971; Willard et al., 1974) are supported by our studies showing that MAP1B and other polypeptides are transported at the rate of 7–9 mm/d in rat adult sciatic axons. This suggests that SCc defines a distinct transport fraction with a defined group of proteins.
The transport wave of the band I MAP1B isoform at 7–9 mm/d is coherent at all time points that we have analyzed and can be clearly separated from SCb. In fact, the transport wave of band I has a very small trailing shoulder at SCb of <5% of the total counts. The conceptual importance of assigning proteins moving at a transport velocity of 7–9 mm/d as a distinct component (SCc) is that it helps to define the transport range and limits of the slow axonal transport. The alternative of regarding the 7–9 mm/d rate as part of SCb has been plausible in the past because there was no need to consider this fraction as a distinct component and it was viewed rather as a leading edge of proteins moving at SCb. However, with the identification of a major cytoskeleton protein (and others, e.g., in Fig. 3A,B,170 and 28 kDa) that moves with a coherent wave at a velocity of 7–9 mm/d and with little or no overlap with SCb, it is no longer justifiable to ignore this fraction and put an arbitrary limit on the properties of the slow axonal transport.
It is important, however, to emphasize that the definition of a distinct SCc that includes an isoform of a microtubule-associated protein cannot by itself determine the nature of the associations of this MAP1B isoform with tubulin or the transport mechanism of these proteins. For example, although the transport wave of band I is distinct from tubulin, ∼10% of the tubulin leading edge moves at 7–9 mm/d. It is, therefore, possible to view SCc either as a complex of proteins that includes MAP1B, associated with microtubules and other proteins, or as separate proteins that include unassociated MAP1B, tubulin subunits, and other individual proteins. It is also possible to hypothesize that SCc has a distinct transport machinery associated with this complex or to assume that proteins transported at SCc are associated with the same motor as SCb (or SCa) proteins but that this association is stronger and results in a faster transport. Changes in the phosphorylation state of MAP1B may occur within axons, affect its binding properties, and result in transition between the transport components. In either case, it is now necessary to include in any model of slow axonal transport the ability to move proteins coherently at 7–9 mm/d. It is also necessary to provide a rationale for moving a cytoskeletal protein such as MAP1B at that rate when the maximum rate of axonal growth is significantly less (∼1–2 mm/d). One explanation for the relatively fast velocity of SCc relates to the well documented concentration of phosphorylated MAP1B in the distal end of growing axons (Mansfield et al., 1991; Black et al., 1994; Boyne et al., 1995;Bush et al., 1996a). It is plausible that the fraction of proteins destined for distal regions of axons, including MAP1B and some populations of tubulin and actin, is transported as a distinct complex. In contrast, other proteins such as neurofilaments that contribute to axonal stability or cytosolic proteins that have a uniform distribution in axons move at the lower end of slow axonal transport in SCa and SCb, respectively. Another explanation for the differences in velocities among the slow axonal components relates to the continuous turnover of proteins that are transported in the adult peripheral nerve. It is possible that proteins critical to the structure and function of peripheral axons are transported at relatively fast rates to allow a rapid accumulation of their steady-state levels. The presence of relatively high levels of MAP1B in peripheral axons may be critical to their ability to regenerate without a change in the levels and transport rate of MAP1B. Because of the length of peripheral axons, any adjustment in the level of protein synthesis to increase accumulation at distal regions may take a very long time. Consequently, one strategy allowing local dynamic control of MAP1B localization in the PNS is maintaining high levels of synthesis combined with relatively fast axonal transport.
Footnotes
This work was supported by National Institutes of Health Grants NS24275, NS24707, and HD07467 and by Eastern Paralyzed Veterans of America.
Correspondence should be addressed to Dr. Itzhak Fischer, Department of Neurobiology and Anatomy, MCP Hahnemann University, 3200 Henry Avenue, Philadelphia, PA 19129. E-mail: Itzhak.Fischer@drexel.edu.
REFERENCES
- 1.Baas PW, Yu W. A composite model for establishing the microtubule arrays of the neuron. Mol Neurobiol. 1996;12:145–161. doi: 10.1007/BF02740651. [DOI] [PubMed] [Google Scholar]
- 2.Baitinger C, Willard M. Axonal transport of synapsin I-like proteins in rabbit retinal ganglion cells. J Neurosci. 1987;7:3723–3735. doi: 10.1523/JNEUROSCI.07-11-03723.1987. [DOI] [PMC free article] [PubMed] [Google Scholar]
- 3.Bamburg JR, Bray D, Chapman K. Assembly of microtubules at the tip of growing axons. Nature. 1986;321:788–790. doi: 10.1038/321788a0. [DOI] [PubMed] [Google Scholar]
- 4.Black MM, Lasek RJ. A difference between the proteins conveyed in the fast component of axonal transport in guinea pig hypoglossal and vagus motor neurons. J Neurobiol. 1978;9:433–443. doi: 10.1002/neu.480090603. [DOI] [PubMed] [Google Scholar]
- 5.Black MM, Lasek RJ. Axonal transport of actin: slow component b is the principal source of actin for the axon. Brain Res. 1979;171:401–413. doi: 10.1016/0006-8993(79)91045-x. [DOI] [PubMed] [Google Scholar]
- 6.Black MM, Lasek RJ. Slow components of axonal transport: two cytoskeletal networks. J Cell Biol. 1980;86:616–623. doi: 10.1083/jcb.86.2.616. [DOI] [PMC free article] [PubMed] [Google Scholar]
- 7.Black MM, Slaughter T, Fischer I. Microtubule-associated protein 1b (MAP1b) is concentrated in the distal region of growing axons. J Neurosci. 1994;14:857–870. doi: 10.1523/JNEUROSCI.14-02-00857.1994. [DOI] [PMC free article] [PubMed] [Google Scholar]
- 8.Bloom GS, Luca FC, Vallee RB. Microtubule-associated protein 1B: identification of a major component of the neuronal cytoskeleton. Proc Natl Acad Sci USA. 1985;82:5404–5408. doi: 10.1073/pnas.82.16.5404. [DOI] [PMC free article] [PubMed] [Google Scholar]
- 9.Boyne LJ, Martin K, Hockfield S, Fischer I. Expression and distribution of phosphorylated MAP1B in growing axons of cultured hippocampal neurons. J Neurosci Res. 1995;40:439–450. doi: 10.1002/jnr.490400403. [DOI] [PubMed] [Google Scholar]
- 10.Brady ST, Tytell M, Heriot K, Lasek RJ. Axonal transport of calmodulin: a physiologic approach to identification of long-term associations between proteins. J Cell Biol. 1981;89:607–614. doi: 10.1083/jcb.89.3.607. [DOI] [PMC free article] [PubMed] [Google Scholar]
- 11.Bush MS, Goold RG, Moya F, Gordon-Weeks PR. An analysis of an axonal gradient of phosphorylated MAP 1B in cultured rat sensory neurons. Eur J Neurosci. 1996a;8:235–248. doi: 10.1111/j.1460-9568.1996.tb01208.x. [DOI] [PubMed] [Google Scholar]
- 12.Bush MS, Tonge DA, Woolf C, Gordon-Weeks PR. Expression of a developmentally regulated, phosphorylated isoform of microtubule-associated protein 1B in regenerating axons of the sciatic nerve. Neuroscience. 1996b;73:553–563. doi: 10.1016/0306-4522(96)00078-4. [DOI] [PubMed] [Google Scholar]
- 13.Diaz-Nido J, Serrano L, Mendez E, Avila J. A casein kinase II-related activity is involved in phosphorylation of microtubule-associated protein MAP-1B during neuroblastoma cell differentiation. J Cell Biol. 1988;106:2057–2065. doi: 10.1083/jcb.106.6.2057. [DOI] [PMC free article] [PubMed] [Google Scholar]
- 14.Fischer I, Romano-Clarke G. Changes in microtubule-associated protein MAP1B phosphorylation during rat brain development. J Neurochem. 1990;55:328–333. doi: 10.1111/j.1471-4159.1990.tb08855.x. [DOI] [PubMed] [Google Scholar]
- 15.Garner JA, Lasek RJ. Clathrin is axonally transported as part of slow component b: the microfilament complex. J Cell Biol. 1981;88:172–178. doi: 10.1083/jcb.88.1.172. [DOI] [PMC free article] [PubMed] [Google Scholar]
- 16.Garner JA, Lasek RJ. Cohesive axonal transport of the slow component b complex of polypeptides. J Neurosci. 1982;2:1824–1835. doi: 10.1523/JNEUROSCI.02-12-01824.1982. [DOI] [PMC free article] [PubMed] [Google Scholar]
- 17.Gordon-Weeks PR, Mansfield SG, Alberto C, Johnstone M, Moya F. A phosphorylation epitope on MAP 1B that is transiently expressed in growing axons in the developing rat nervous system. Eur J Neurosci. 1993;5:1302–1311. doi: 10.1111/j.1460-9568.1993.tb00916.x. [DOI] [PubMed] [Google Scholar]
- 18.Hirokawa N. Microtubule organization and dynamics dependent on microtubule-associated proteins. Curr Opin Cell Biol. 1994;6:74–81. doi: 10.1016/0955-0674(94)90119-8. [DOI] [PubMed] [Google Scholar]
- 19.Hoffman PN, Lasek RJ. The slow component of axonal transport. Identification of major structural polypeptides of the axon and their generality among mammalian neurons. J Cell Biol. 1975;66:351–366. doi: 10.1083/jcb.66.2.351. [DOI] [PMC free article] [PubMed] [Google Scholar]
- 20.Hoffman PN, Lasek RJ. Axonal transport of the cytoskeleton in regenerating motor neurons: constancy and change. Brain Res. 1980;202:317–333. doi: 10.1016/0006-8993(80)90144-4. [DOI] [PubMed] [Google Scholar]
- 21.Hoffman PN, Thompson GW, Griffin JW, Price DL. Changes in neurofilament transport coincide temporally with alterations in the caliber of axons in regenerating motor fibers. J Cell Biol. 1985;101:1332–1340. doi: 10.1083/jcb.101.4.1332. [DOI] [PMC free article] [PubMed] [Google Scholar]
- 22.Johnstone M, Goold RG, Fischer I, Gordon-Weeks PR. The neurofilament antibody RT97 recognises a developmentally regulated phosphorylation epitope on microtubule-associated protein 1B. J Anat. 1997;191:229–244. doi: 10.1046/j.1469-7580.1997.19120229.x. [DOI] [PMC free article] [PubMed] [Google Scholar]
- 23.Joshi HC. Microtubule dynamics in living cells. Curr Opin Cell Biol. 1998;10:35–44. doi: 10.1016/s0955-0674(98)80084-7. [DOI] [PubMed] [Google Scholar]
- 24.Karlsson JO, Sjostrand J. Synthesis, migration and turnover of protein in retinal ganglion cells. J Neurochem. 1971;18:749–767. doi: 10.1111/j.1471-4159.1971.tb12005.x. [DOI] [PubMed] [Google Scholar]
- 25.Koehnle TJ, Brown A. Slow axonal transport of neurofilament protein in cultured neurons. J Cell Biol. 1999;144:447–458. doi: 10.1083/jcb.144.3.447. [DOI] [PMC free article] [PubMed] [Google Scholar]
- 26.Lasek RJ, Garner JA, Brady ST. Axonal transport of the cytoplasmic matrix. J Cell Biol. 1984;99:S212–S221. doi: 10.1083/jcb.99.1.212s. [DOI] [PMC free article] [PubMed] [Google Scholar]
- 27.Ma D, Nothias F, Boyne LJ, Fischer I. Differential regulation of microtubule-associated protein 1B (MAP1B) in rat CNS and PNS during development. J Neurosci Res. 1997;49:319–332. doi: 10.1002/(sici)1097-4547(19970801)49:3<319::aid-jnr7>3.0.co;2-f. [DOI] [PubMed] [Google Scholar]
- 28.Ma D, Chow S, Obrocka M, Connors T, Fischer I. Induction of microtubule-associated protein 1B expression in Schwann cells during nerve regeneration. Brain Res. 1999;823:141–153. doi: 10.1016/s0006-8993(99)01148-8. [DOI] [PubMed] [Google Scholar]
- 29.Mansfield SG, Diaz-Nido J, Gordon-Weeks PR, Avila J. The distribution and phosphorylation of the microtubule-associated protein MAP 1B in growth cones. J Neurocytol. 1991;20:1007–1022. doi: 10.1007/BF01187918. [DOI] [PubMed] [Google Scholar]
- 30.Matus A. Neurofilament protein phosphorylation—where, when and why [news]. Trends Neurosci. 1988;11:291–292. doi: 10.1016/0166-2236(88)90086-0. [DOI] [PubMed] [Google Scholar]
- 31.Mercken M, Fischer I, Kosik K, Nixon R. The axonal transport of tau proteins: three distinct transport rates for tau, tubulin and other microtubule-associated proteins in mouse retinal ganglion cells. J Neurosci. 1996;16:8259–8267. doi: 10.1523/JNEUROSCI.15-12-08259.1995. [DOI] [PMC free article] [PubMed] [Google Scholar]
- 32.Moskowitz PF, Oblinger MM. Sensory neurons selectively upregulate synthesis and transport of the beta III-tubulin protein during axonal regeneration. J Neurosci. 1995;15:1545–1555. doi: 10.1523/JNEUROSCI.15-02-01545.1995. [DOI] [PMC free article] [PubMed] [Google Scholar]
- 33.Nixon RA. The slow axonal transport of cytoskeletal proteins. Curr Opin Cell Biol. 1998;10:87–92. doi: 10.1016/s0955-0674(98)80090-2. [DOI] [PubMed] [Google Scholar]
- 34.Nixon RA, Fischer I, Lewis SE. Synthesis, axonal transport, and turnover of the high molecular weight microtubule-associated protein MAP 1A in mouse retinal ganglion cells: tubulin and MAP 1A display distinct transport kinetics. J Cel Biol. 1990;110:437–448. doi: 10.1083/jcb.110.2.437. [DOI] [PMC free article] [PubMed] [Google Scholar]
- 35.Oblinger MM, Lasek RJ. Axotomy-induced alterations in the synthesis and transport of neurofilaments and microtubules in dorsal root ganglion cells. J Neurosci. 1988;8:1747–1758. doi: 10.1523/JNEUROSCI.08-05-01747.1988. [DOI] [PMC free article] [PubMed] [Google Scholar]
- 36.Ochs S. Fast transport of materials in mammalian nerve fibers. Science. 1972;176:252–260. doi: 10.1126/science.176.4032.252. [DOI] [PubMed] [Google Scholar]
- 37.Pedrotti B, Islam K. Purification of microtubule associated protein MAP1B from bovine brain: MAP1B binds to microtubules but not to microfilaments. Cell Motil Cytoskeleton. 1995;30:301–309. doi: 10.1002/cm.970300407. [DOI] [PubMed] [Google Scholar]
- 38.Takemura R, Okabe S, Umeyama T, Kanai Y, Cowan NJ, Hirokawa N. Increased microtubule stability and alpha tubulin acetylation in cells transfected with microtubule-associated proteins MAP1B, MAP2 or tau. J Cell Sci. 1992;103:953–964. doi: 10.1242/jcs.103.4.953. [DOI] [PubMed] [Google Scholar]
- 39.Tashiro T, Komiya Y. Stable and dynamic forms of cytoskeletal proteins in slow axonal transport. J Neurosci. 1989;9:760–768. doi: 10.1523/JNEUROSCI.09-03-00760.1989. [DOI] [PMC free article] [PubMed] [Google Scholar]
- 40.Tashiro T, Sun X, Tsuda M, Komiya Y. Differential axonal transport of soluble and insoluble tau in the rat sciatic nerve. J Neurochem. 1996;67:1566–1574. doi: 10.1046/j.1471-4159.1996.67041566.x. [DOI] [PubMed] [Google Scholar]
- 41.Ulloa L, Avila J, Diaz-Nido J. Heterogeneity in the phosphorylation of microtubule-associated protein MAP1B during rat brain development. J Neurochem. 1993;61:961–972. doi: 10.1111/j.1471-4159.1993.tb03609.x. [DOI] [PubMed] [Google Scholar]
- 42.Ulloa L, Diez-Guerra FJ, Avila J, Diaz-Nido J. Localization of differentially phosphorylated isoforms of microtubule-associated protein 1B in cultured rat hippocampal neurons. Neuroscience. 1994;61:211–223. doi: 10.1016/0306-4522(94)90225-9. [DOI] [PubMed] [Google Scholar]
- 43.Vallee RB. A taxol-dependent procedure for the isolation of microtubules and microtubule-associated proteins (MAPs). J Cell Biol. 1982;92:435–442. doi: 10.1083/jcb.92.2.435. [DOI] [PMC free article] [PubMed] [Google Scholar]
- 44.Watson DF, Hoffman PN, Fittro KP, Griffin JW. Neurofilament and tubulin transport slows along the course of mature motor axons. Brain Res. 1989;477:225–232. doi: 10.1016/0006-8993(89)91410-8. [DOI] [PubMed] [Google Scholar]
- 45.Willard M. The identification of two intra-axonally transported polypeptides resembling myosin in some respects in the rabbit visual system. J Cell Biol. 1977;75:1–11. doi: 10.1083/jcb.75.1.1. [DOI] [PMC free article] [PubMed] [Google Scholar]
- 46.Willard M, Cowan WM, Vagelos PR. The polypeptide composition of intra-axonally transported proteins: evidence for four transport velocities. Proc Natl Acad Sci USA. 1974;71:2183–2187. doi: 10.1073/pnas.71.6.2183. [DOI] [PMC free article] [PubMed] [Google Scholar]


