

Abstract
The molecular mechanisms that coordinate the functional organization of the mammalian neocortex are largely unknown. We tested the involvement of a putative guidance label, ephrin-A5, in the functional organization of the somatosensory cortex by quantifying the functional representations of individual whiskers in vivo in adult ephrin-A5 knock-out mice, using intrinsic signal optical imaging. In wild-type mice ephrin-A5 is expressed in a gradient in the somatosensory cortex during development. In adult ephrin-A5 knock-out mice, we found a spatial gradient of change in the amount of cortical territory shared by individual whisker functional representations across the somatosensory cortex, as well as a gradient of change in the distance between the functional representations. Both gradients of change were in correspondence with the developmental expression gradient of ephrin-A5 in wild-type mice. These changes involved malformations of the cortical spacing of the thalamocortical components, without concurrent malformations of the intracortical components of individual whisker functional representations. Overall, these results suggest that a developmental guidance label, such as ephrin-A5, is involved in establishing certain spatial relationships of the functional organization of the adult neocortex, and they underscore the advantage of investigating gene manipulation using in vivo functional imaging.
Keywords: whisker, vibrissa, barrel, posteromedial barrel subfield, intrinsic signal optical imaging, axonal guidance, thalamocortical, intracortical
Accumulating evidence indicates that neuronal activity may have a lesser role in establishing aspects of the functional organization in the somatosensory cortex than previously expected based on the classical model of ocular dominance development in the visual cortex (for review, see Purves et al., 1994; Katz and Shatz, 1996; Crair, 1999; but see Crowley and Katz, 1999). This evidence implies that other factors, such as genetically determined guidance labels, may also be involved in establishing aspects of such organization. Ephrin-A5 is one molecule in the ephrin-A family that is expressed in gradients in areas receiving retinal projections and implicated to be topographically specific axon guidance labels for retinal axon mapping (Drescher et al., 1997; Feldheim et al., 1998;Flanagan and Vanderhaeghen, 1998; Frisen et al., 1998; Hornberger et al., 1999). Ephrin-A5 is also known to be expressed in the cortex, where it has been proposed to regulate the layer specificity of intracortical connections (Castellani et al., 1998) or the area specificity of connections to the neocortex or limbic cortex (Gao et al., 1998; Mackarehtschian et al., 1999). Based initially on the findings that ephrin-A5 is expressed in a medial-to-lateral gradient across the rodent primary somatosensory cortex and has topographically specific effects on thalamic axons in vitro (Vanderhaeghen et al., 2000), we suspected that ephrin-A5 could have a role as a within-area topographic label and that its removal might affect the pattern of afferent connections to the somatosensory cortex. Such changes in thalamocortical connectivity could lead, in turn, to changes in the thalamocortical aspects (the sensory input) of the functional organization of the somatosensory cortex. Ephrin-A5 removal could also directly (Castellani et al., 1998) or indirectly affect the pattern of intracortical connections, and could lead, in turn, to changes in the intracortical aspects (cortical processing of sensory input) of the functional organization of the somatosensory cortex.
To test whether ephrin-A5 affects the thalamocortical and intracortical aspects of the functional organization of the cortex in vivo, we used intrinsic signal optical imaging (Grinvald et al., 1986; Frostig et al., 1990; Ts'o et al., 1990) to image through fully intact skull (Prakash and Frostig, 1997) the functional representations of individual whiskers in the primary somatosensory cortex of adult ephrin-A5 knock-out mice (Frisen et al., 1998). Intrinsic signal optical imaging allows for high-resolution imaging of evoked activity across large areas of cortex. This technique has thus far been used to discern the functional organization of the somatosensory cortex of normal animals (Grinvald et al., 1986; Masino et al., 1993; Narayan et al., 1994; Peterson and Goldreich, 1994; Dowling et al., 1996; Mayhew et al., 1996; Nemoto et al., 1997; Sheth et al., 1998); here we exploit the advantages of the technique to image the functional consequences of deletion of the ephrin-A5 gene in mice. In addition, postimaging injections of retrograde tracers into the location of functional representations of individual whiskers or into adjacent cortical areas were used to study whether the gross organization of the thalamic projections to the cortex was similar to control mice. This enabled us to assess whether changes in the point-to-point thalamocortical connection rules in ephrin-A5 knock-out mice could explain potential malformations of the functional organization of their somatosensory cortex.
MATERIALS AND METHODS
Intrinsic signal optical imaging. 16 non-littermate, age-matched mice [eight ephrin-A5 knock-out (112 ± 27-d-old) and eight control (111 ± 23-d-old)] from a mixed C57BL/6 and 129/SvEv strain population (Frisen et al., 1998; Vanderhaeghen et al., 2000) were imaged without experimenter knowledge of the mouse's genotype. The imaging equipment was described previously (Masino et al., 1993). Mice were anesthetized with sodium pentobarbital (50 mg/kg, i.p.) and placed in a stereotactic apparatus (Kopf, Tuzunga, CA). Anesthetic supplements were given throughout the experiment such that reflexes, temperature (36.0 ± 0.5°C), and respiration rate (1.2 ± 0.2 Hz) were constant. Stimulus-related light-reflectance changes at 630 nm were recorded with a 12-bit slow scan CCD camera (Photometrics, Tucson, AZ) through a petroleum jelly well filled with saline and sealed with a coverslip over the fully intact parietal bone after incision of the overlying scalp. The camera was aligned with the sagittal suture of every mouse (therefore the midline was always at the top of every image). An imaging trial consisted of recording light reflectance in 21 consecutive 500 msec frames from a 6.8 × 5.1 mm (192 × 144 pixels) region of cortex. Images were collected 1 sec before and continued until 8.5 sec after computer-controlled, mechanical stimulation (Bakin Systems II, Irvine, CA) for 1 sec of a contralateral whisker 3° rostrocaudally at 5 Hz. In all mice the spatial extent and magnitude of light reflectance changes for whiskers E1, E4, and C2 were measured (i.e., the whisker functional representations (WFRs) of E1, E4, and C2). In 8 of the 16 mice the WFR for α was also measured. In the other eight mice, C4 was also measured. In initial animals, additional WFRs were also measured (A4, D2, or B2), however because of the small sample, these data are not presented here. The order of presentation of whisker deflections was randomized in all mice.
Quantitative analysis of a whisker functional representation. Data files were created from the summation of 64 imaging trials with an intertrial interval of 16 sec. Ratio values for a data file were computer-calculated for each pixel by dividing the reflectance values of the images 0.5–2.5 sec after stimulation by the images 1.0–0.0 sec before stimulation. Before analysis, a Gaussian filter (half-width, 5) was applied to the raw ratio values to filter out high-frequency noise. The peak location of a WFR is defined as the pixel with the most negative ratio value, and this ratio value minus the median ratio value is the peak height of a WFR, which indicates the maximal magnitude of evoked activity. The size of a WFR, measured as the area at half-height, is the area bounded by the threshold that contains pixels 50% of the peak height; other areas (“isolevels”), such as those 65, 80, and 95% of the peak height were also calculated and typically showed the same trends as the area at half-height (Fig.1b,c). The size of a WFR is an indication of the amount of cortical territory activated by a single-whisker deflection. Shape of a WFR was calculated by dividing the area contained within each isolevel into eight 45° sectors (with the peak location as the origin, 0° defined as caudal and 90° as medial) and comparing the areas contained within each sector. Statistically significant differences between any sectors indicated a skew in the shape of a WFR. Horizontal separation of two WFRs is the horizontal distance on the cortical surface between the two peak locations. Horizontal overlap of two WFRs is the distance between the two borders of their areas at half-height, along the line segment connecting the two peaks (see illustrations on sides of Fig.3b). Positive overlap values indicate the amount of shared cortical territory between the borders of the two WFRs, and negative overlap values indicate the amount of intervening cortical territory between the borders of the two WFRs. Graphs were created with SigmaPlot 5.0 (SPSS, Chicago, IL), statistical analysis was performed with SigmaStat 2.03 (SPSS), and image processing was performed with Photoshop 5.02 (Adobe, San Jose, CA).
Fig. 1.
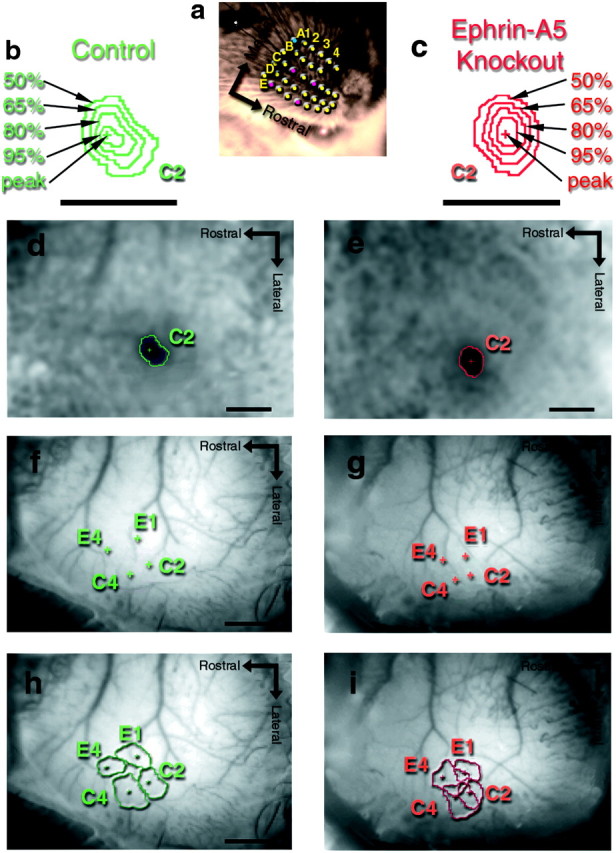
The WFRs of single whiskers in ephrin-A5 knock-out mice are qualitatively normal, but the functional organization of four medial WFRs is malformed. a, This image depicts the whiskers stimulated on the array of a mouse's snout. The dots represent the matrix-like arrangement of the largest whiskers, arranged into five rostrocaudal “rows” named A–E, and mediolateral “arcs” numbered 1–4 (or more), and thus the most mediocaudal whisker is denoted A1. Additionally, four “straddler” whiskers lie between the rows, just caudal to arc-1, and are named “α, β, γ, and δ”. The WFRs are mapped in the contralateral somatosensory cortex and are arranged such that laterocaudal whiskers (e.g., E1) are functionally mapped roughly mediocaudally. b andc are magnifications of the C2-WFRs taken from the images in d and e from control mice (green) and ephrin-A5 knock-out mice (red) with the polygons depicting the areas at 50, 65, 80, and 95% of the peak. d,e, Grayscale functional images obtained with 630 nm illumination depicting the WFR evoked by C2-whisker stimulation in, d, a representative control mouse primary somatosensory cortex and, e, a representative ephrin-A5 knock-out mouse. The peaks of activity of the C2-WFRs are denoted by the crosses, the sizes measured as areas at half-height (50% of the peak) are denoted by thepolygons. Dark pixels denote highest activity, and gray pixels denote baseline activity. All images presented here were obtained through the intact skull. All scale bars, 1 mm. f, g, The same mice as in band c with the functional peaks of the E4, E1, C4, and C2 WFR superimposed on the structural images of the cortex and vasculature taken with 540 nm illumination. h, i, The same images as f and g, but now with the areas at half-height added.
Fig. 3.
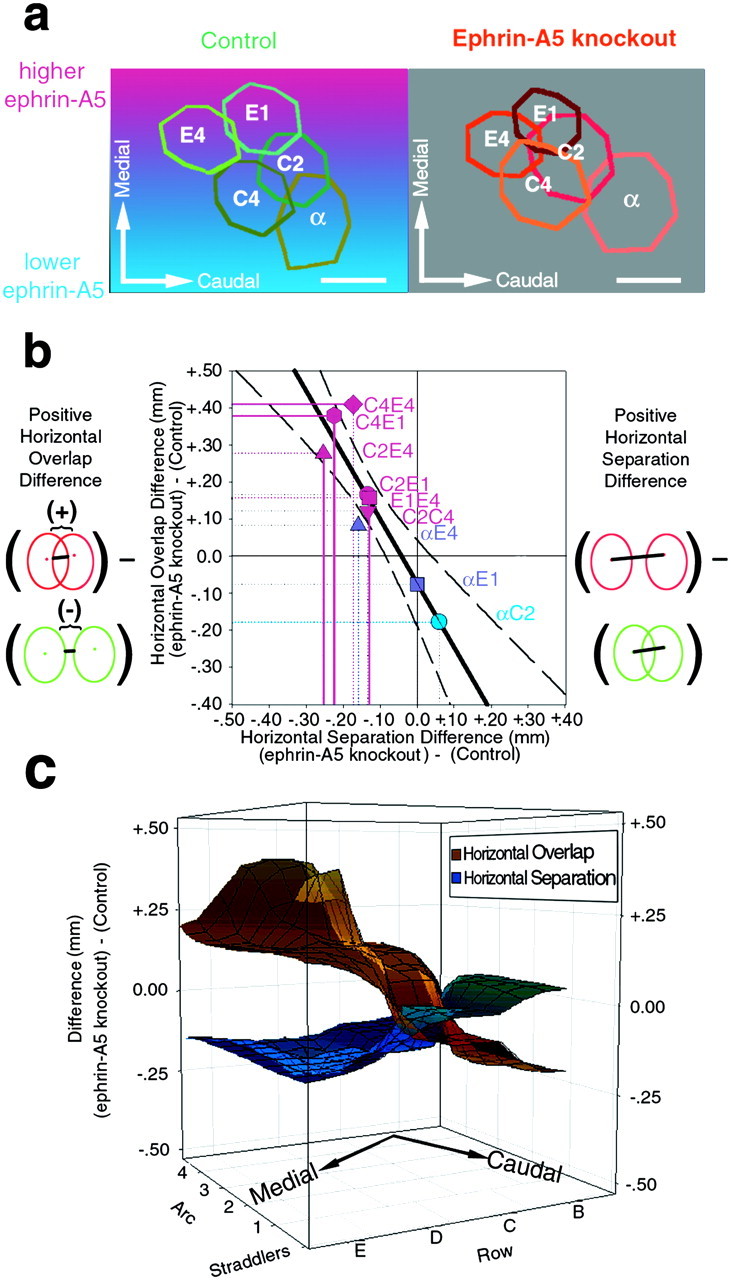
Malformations in the functional organization of the cortex of ephrin-A5 knock-out mice are related to the mediolateral axis of the barrel cortex. a, This image depicts the average overlap of WFRs for control and ephrin-A5 knock-out mice. Eachcolored polygon represents the average shape of the indicated WFR sizes (measured as areas at half-height) and in their average separation and angular orientations, as from Figure 2. The colored background approximates the gradient of ephrin-A5 expression pattern along the mediolateral axis of the primary somatosensory cortex during cortical development (Vanderhaeghen et al., 2000). This image suggests that ephrin-A5 deficiency is related to the observed malformations in the functional organization of the cortex. Scale bars, 500 μm. b, This plot depicts the difference between the ephrin-A5 knock-out and control values of overlap and separation for pairs of WFRs (denoted in text near eachsymbol). The symbol colors are the same as ina and denote the mediolateral position in the primary somatosensory cortex of the pair of WFRs. To the sides of the graph are illustrations of a positive horizontal overlap difference (left) and a positive horizontal separation difference (right) between ephrin-A5 knock-out mice (red) and control mice (green). Comparing the best-fit regression line (black diagonal line, dashed lines are the 95% confidence intervals) with the symbol colors illustrates that WFRs in the medial-primary somatosensory cortex are less separated and more overlapping in ephrin-A5 knock-out mice (pink points), whereas a pair of WFRs in the lateral-primary somatosensory cortex shows the opposite (blue point), and points that span the length of the primary somatosensory cortex show intermediate amounts of overlap/separation (violet points). The drop lines indicate the statistical significance of the corresponding value:colored, solid lines denote p < 0.05 (t test); colored, dotted linesdenote 0.05 < p < 0.15; and black dotted lines denote p > 0.15.c, Gradient of malformation of the functional organization across the primary somatosensory cortex. This plot was created with the same data as from b converted into two separate three-dimensional meshes interpolated around the averages for the horizontal overlap differences (copper mesh) and the horizontal separation differences (blue mesh). Thex- and y-axes denote the typical arrangement of WFRs in the somatosensory cortex along the row and arc axes, respectively, such that the row axis is half the distance of the arc axis, and the straddler arc is staggered between the other arcs. The positions of the points that define the meshes were determined by the average location between the WFRs (e.g., theC4E4 difference is plotted at D4 andC2C4 at C3). In bhorizontal separation and horizontal overlap were found to be inversely related, here the gradient of malformation in the functional organization across the primary somatosensory cortex is readily apparent by the inverse slopes of these two meshes and their crossing-over along the row-axis. The best-fit regression planes (data not shown) for both of these meshes are significantly different from zero and both have significant slopes across the mediolateral axis, which lies ∼18° off the row axis.
Thalamocortical anatomy. After each imaging experiment one or two retrograde tracers, fast DiI (Molecular Probes, Eugene, OR) and/or fast blue (Sigma, St. Louis, MO), were injected into precise locations, as defined by the imaging experiments, 500 μm below the pial surface, which corresponded to layer IV, using a Picospritzer II (General Valve, Brookshire, TX). One to three days later animals were killed with an overdose of sodium pentobarbital and fixed by perfusion with 4% paraformaldehyde. The left, injected cortex was then dissected from the rest of the brain, flattened to 1.2 mm, cut in 100 μm tangential sections and stained for cytochrome oxidase (Wong-Riley and Welt, 1980) to visualize barrels and the injection site. The rest of the brain was cut in 150 μm coronal sections to visualize retrogradely labeled cells in the thalamus with fluorescence microscopy (Olympus, Melville, NY).
Genetic identification. After overdose of sodium pentobarbital, but before fixation, a tail segment from each mouse was collected for genetic analysis. As described elsewhere (Frisen et al., 1998), genomic-PCR analysis of the tissue verified the genotype (ephrin-A5 knock-out or control) of the imaged mice.
RESULTS
The largest whiskers on a mouse's snout are arranged in a matrix-like spatial array (Fig. 1a) that is isomorphically mapped both anatomically (layer IV barrels) (Woolsey and Van der Loos, 1970) and functionally (Axelrad et al., 1976) to the contralateral posterior medial barrel subfield (PMBSF) in primary somatosensory cortex. We assessed the functional representation of multiple individual whiskers by measuring the location of maximal activity, size, shape, and the peak height of the WFR evoked by stimulation of individual whiskers. Two of these parameters are correlated with different aspects of the functional organization of the cortex: (1) the location of maximal activity (“peak location”) has been shown to correspond precisely with the location of maximally evoked single-unit activity in rats (Masino et al., 1993; Hodge et al., 1997; Peterson et al., 1998; Sheth et al., 1998), as well as the with the location of the corresponding anatomical layer IV barrel in rats (Masino et al., 1993;Sheth et al., 1998) and mice (Prakash and Frostig, 1997). Accordingly, peak location is correlated with the thalamocortical aspect of the functional organization. (2) The size of a WFR has been shown to correlate well with single-unit activity (Peterson et al., 1998; Sheth et al., 1998; Polley et al., 1999), which spreads intracortically after whisker stimulation in the rat (Armstrong-James et al., 1991; Fox, 1994) and in mice (Axelrad et al., 1976; Glazewski et al., 1996). Accordingly, the size correlates with the intracortical aspect of the functional organization (Goldreich et al., 1999). Therefore, measuring these parameters for multiple whiskers in ephrin-A5 knock-out mice and control mice enabled us to estimate which aspects of functional organization, i.e., thalamocortical versus intracortical, were affected by the gene deletion. In addition to these measures, we also measured the peak height of the WFR, which relates to the maximal magnitude of the evoked cortical response, and the shape of the WFR, which determines any spatial asymmetries in the evoked cortical response.
Ephrin-A5 is expressed in a mediolateral gradient across the PMBSF, with the medial region containing higher levels than the lateral regions (Vanderhaeghen et al., 2000). Therefore, we initially studied four WFRs that are located medially in the primary somatosensory cortex, specifically, E1, E4, C2, and C4.
Qualitatively, we found noticeable differences in the functional organization of ephrin-A5 knock-out mice versus age-matched, control mice. Specifically, the four WFRs appeared more compressed and more overlapping in ephrin-A5 knock-out mice (Fig. 1d–g) compared to control mice. The precise sources of these malformations were then quantified by measuring: (1) the horizontal separation (the distance along the cortical surface) between the peak locations of the WFRs, (2) the size and shape of individual WFRs, and (3) the amount of overlap between WFRs. The details of these three measurements are presented in the following three paragraphs.
Quantification of the horizontal separation between the peak locations of the E1, E4, C2, and C4 WFRs revealed that these WFRs were closer together in ephrin-A5 knock-out mice than in control mice (Figs.1d,e, 2b,3). The horizontal separation between the peak locations of the E1 and E4 WFRs (denoted “hsE1E4,” henceforth) in ephrin-A5 knock-out mice was 77% of control mice [0.59 ± 0.12 vs 0.77 ± 0.04 mm (mean ± SEM); p < 0.01; t test]; hsC2E4 was 81% of controls (0.91 ± 0.04 vs 1.12 ± 0.06 mm; p < 0.01; ttest); hsC4E1 was 72% of controls (0.59 ± 0.06 vs 0.81 ± 0.06 mm; p < 0.05; t test). The other horizontal separations were also decreased, but not statistically significant: hsC4E4 was 79% of controls (0.65 ± 0.05 vs 0.82 ± 0.07 mm; p = 0.09; t test); hsC2C4 was 79% of controls (0.38 ± 0.03 vs 0.48 ± 0.08 mm;p = 0.15; t test); hsC2E1 was 86% of controls (0.56 ± 0.05 vs 0.65 ± 0.04 mm; p= 0.26; t test). Additionally, the average area contained within the quadrangle formed by the peak locations of these WFRs in ephrin-A5 knock-out mice was 63% that of control mice (0.29 ± 0.03 vs 0.46 ± 0.08 mm2;p < 0.01; t test). Finally, there were no statistical differences between the average angular orientations for these pairs of points relative to the midline (Fig. 2b), thus suggesting that the orientation on the cortex for these medial WFRs were not altered. Overall, these results demonstrated decreases in the horizontal separations, without alterations in angular orientations, between the peaks of WFRs in the medial primary somatosensory cortex of ephrin-A5 knock-out mice. Because the peak locations were localized above the layer IV barrel-locations (this study and Masino et al., 1993; Prakash and Frostig, 1997), this result suggested that the thalamocortical aspects of the functional organization were distorted.
Fig. 2.
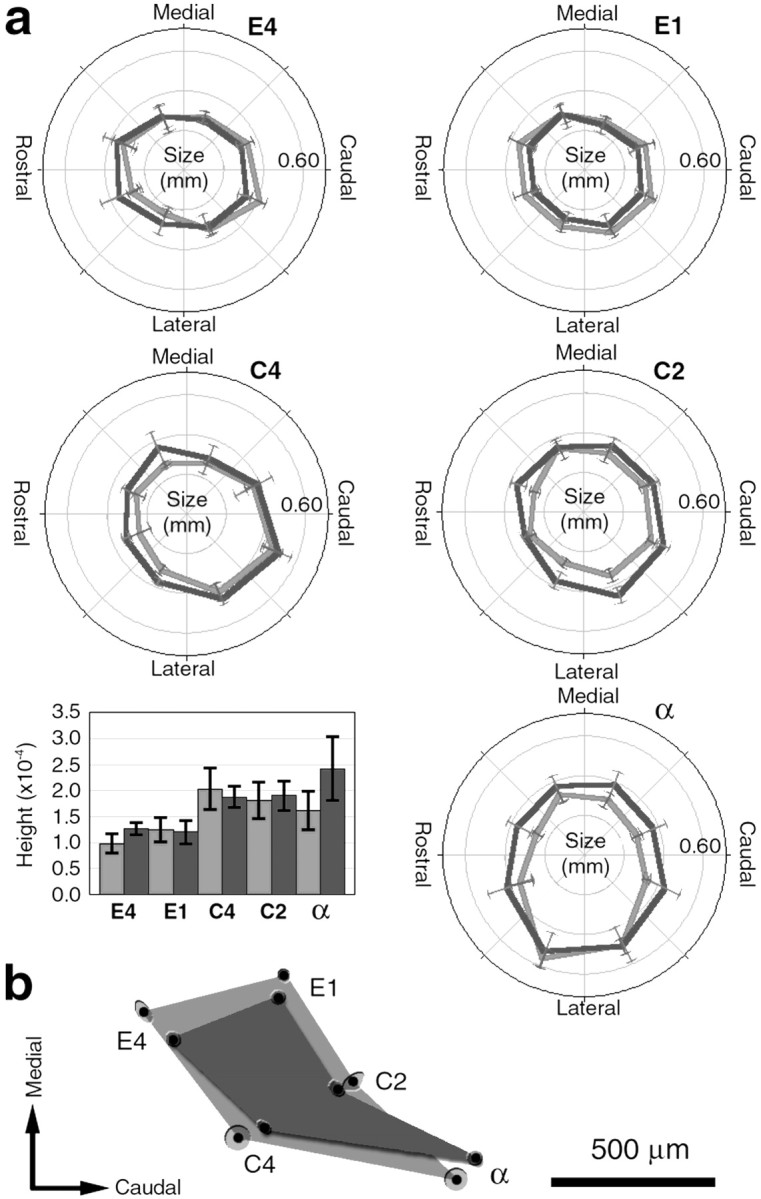
Compared to control mice, the sizes and shapes of individual WFRs were not different in ephrin-A5 knock-out mice, but their cortical locations changed. a, The polar graphs depict the areas at half-height (50% of peak) within eight quadrants for the E4, E1, C4, C2, and α WFRs (areas at 65, 80, and 95% of peaks omitted for clarity; their general shapes and trends between genotypes were largely similar to the 50%). Control averages are depicted in light gray, and ephrin-A5 knock-outs are indark gray. In the background grids, each gray circle depicts 0.20 mm; and all error bars indicate SEM. All WFRs except E1 were skewed, such that the largest sector was statistically different than the smallest sector. There were no statistically significant differences between the total size of the WFR, at any measured threshold between ephrin-A5 knock-out and control mice. The bar graph compares the average peak heights of the different WFRs. There were no differences between control and ephrin-A5 knock-out mice. b, A depiction of the average separation and angles of the five points for control (light gray) and ephrin-A5 knock-out (dark gray) mice aligned along the C-row. On average, ephrin-A5 knock-out mice had smaller distances between the peak locations and smaller overall area as defined by the peak locations for the E1, E4, C2, and C4 WFRs (black dots, halo around dots depicts SEM). There were no significant average angular differences between these points. The α-WFR tended to be more separated from the other WFRs in ephrin-A5 knock-out mice. Scale bars, 500 μm.
To assess whether this change in the functional organization was also associated with potential intracortical changes, we next examined the size, peak height, and shape of each WFR (Fig. 2). The size of the WFR is an indication of the amount of cortex activated by a single-whisker deflection. For both control and ephrin-A5 knock-out mice, the size included within any threshold <95% of peak activity was generally larger than the tangential size of an anatomical barrel in layer IV (Woolsey and Van der Loos, 1970). At a threshold 50% of the peak (area at half-height), the WFR was ∼10 times larger than an anatomical barrel. This is in agreement with previous observations in the mouse (Prakash and Frostig, 1997) and the rat (Masino et al., 1993; Chen-Bee and Frostig, 1996; Chen-Bee et al., 1996; Prakash et al., 1996), and this spread of intracortical activity is likely related to activation of horizontal intracortical connections (Hoeflinger et al., 1995;Gottlieb and Keller, 1997; Kim and Ebner, 1999) beyond the corresponding barrel (Armstrong-James et al., 1991, 1992; Fox, 1994;Glazewski et al., 1996). For both genotypes, the shapes of most WFRs (all but E1) were skewed, such that they were not circular, but elliptical. Only the C2-WFR had a statistically significant difference in shape in the lateral by lateral/caudal quadrant of the 50% isolevel between control and ephrin-A5 knock-out mice (p< 0.05; two-way repeated-measures ANOVA), but not total area (p = 0.08), however this difference was not found in the other isolevels of the C2-WFR. All other WFRs were not statistically different between genotypes. In addition, there were no differences in the peak heights (which are a result of the vertical summation of the strongest evoked activity across the layers of the cortex) of a WFR between ephrin-A5 knock-out and control mice. Thus, the maximal strength of activity evoked by any of the measured whiskers was the same for both genotypes, although the peak heights of C2 and C4 were larger than E1 and E4, for both genotypes. Overall, these results suggest that at the level of an individual WFR, the size, skewness, and peak height are generally unaffected in ephrin-A5 knock-out mice. However, because in ephrin-A5 knock-out mice, compared to control mice, the locations of the peaks of activity were closer together, whereas the spatial extent of cortex activated by individual whiskers was not different, these observations implied that at least one intracortical component was affected in the knock-out mice. Specifically, there should have been a higher degree of overlapping territory between the WFRs within the cortex, as indeed suggested qualitatively in Figure 1,h and i.
To quantify this implication, we measured the amount of horizontal overlap of different WFRs. Horizontal overlap of two WFRs is defined here as the distance between the borders of their sizes measured as areas at half-height. Positive overlap values indicate the extent of shared cortical territory between the two WFR borders, and negative overlap values indicate the extent of intervening cortical territory between the WFR borders. We found that the average sum of the four overlap values between the quadrangle formed by the C2, C4, E1, and E4 WFRs of ephrin-A5 knock-out mice was significantly larger than control mice [1.17 ± 0.22 vs 0.04 ± 0.06 mm; p < 0.05; t test; Fig. 3 (percentages are not used with the overlap differences because both positive and negative values are possible)]. Individual pairs of WFRs also showed differences between the two genotypes: the horizontal overlap of C4E1 in ephrin-A5 knock-out mice was greater than controls (0.16 ± 0.08 vs −0.22 ± 0.03 mm; p < 0.01; t test), as was that of C4E4 (0.32 ± 0.10 vs −0.09 ± 0.04 mm;p < 0.05; t test). The other pairs also exhibited a trend of greater overlap in ephrin-A5 knock-out mice but exhibited a trend of p values between 0.05 and 0.30, which were similar to the trends reported above for the separation differences (Fig. 3b). In summary, the functional organization of the medial-primary somatosensory cortex of ephrin-A5 knock-out mice was such that WFRs were more overlapping compared to the functional organization in control mice, suggesting that more cortical tissue was shared between the representations of these four whiskers.
During development, there is an ephrin-A5 expression gradient in normal mice that is most pronounced along the mediolateral axis (Vanderhaeghen et al., 2000). To assess whether the medial-primary somatosensory cortex functional malformations we observed here in the adult were part of a mediolateral gradient of functional malformations, we pooled the eight mice in which the α, C2, E1, and E4 WFRs were imaged with the eight mice in which the C4, C2, E1, and E4 WFRs were imaged (Fig. 3; there were no statistically significant differences between identical parameters of the pooled groups). This allowed for a comparison of functional horizontal overlap and separation across much of the PMBSF portion of the primary somatosensory cortex. We found a significant inverse correlation between horizontal overlap and horizontal separation (y = −1.73x − 0.07 mm; r = 0.89; p < 0.01). Had there been no difference between the two genotypes, there would have been a clustering of all values around zero, and had there been a uniform functional malformation, all values would be clustered in one direction. Neither of these possibilities was realized as the slope of the regression line and correlation coefficient are significantly different from zero and thus is suggestive of a mediolateral gradient (Fig. 3b). To relate more quantitatively this result to the mediolateral axis, we next performed two different three-dimensional correlations, which related the approximate spatial coordinates in the primary somatosensory cortex of the pairs of WFRs to either the horizontal overlap differences or horizontal separation differences. We found a significant gradient of differences across the mediolateral axis [Fig. 3c, horizontal overlap difference between genotypes: z = −6.75x − 2.57y + 0.58 mm; r = 0.89; p< 0.01 for the x–z slope (mediolateral axis),p = 0.11 for y–z slope (rostrocaudal axis); horizontal separation between genotypes: z = +3.10x + 1.24y − 0.33 mm;r = 0.81; p < 0.05 for thex–z slope (mediolateral axis); p = 0.23 for the y–z slope (rostrocaudal axis)] of the PMBSF of ephrin-A5 knock-out mice, such that representations in the medial region were more compressed and overlapping than representations in the lateral region. Overall, in adult ephrin-A5 knock-out mice there is a gradient of functional malformation that is suggestive of being spatially correlated to the normal gradient of ephrin-A5 expression during development in control mice.
Previous studies demonstrated that in the visual system these ephrin-A5 knock-out mice have disrupted retinal projections (Feldheim et al., 1998; Frisen et al., 1998). Elsewhere we report that in young ephrin-A5 mice the connectivity between the ventrobasal thalamus and somatosensory cortex is grossly preserved (Vanderhaeghen et al., 2000). To establish whether the functional malformations we observed here in the adult somatosensory cortex were related to finer changes in the barreloid-to-barrel patterns of thalamocortical connections, at the end of each imaging experiment, we injected retrograde tracer(s) via a micropipette into the cortical areas we imaged. Penetration of the micropipette to a depth of 500 μm below the pial surface resulted in localization of the tracer predominantly to cortical layer IV. Tracer was then retrogradely transported to the thalamus, as seen in Figure4, a and b. In both ephrin-A5 knock-out mice and control mice there was a normal pattern of barreloid-like staining in the ventral posteriomedial nucleus of the thalamus (VPM) (Keller et al., 1985), as well as staining in the posterior medial nucleus of the thalamus (PoM) thalamus (Lu and Lin, 1993) after small injections into barrels (Fig. 4). Furthermore, the normal spatial topography of the barreloids was preserved. For example, injection of tracer into the E1 barrel yielded a corresponding barreloid that was more rostrodorsolateral than the C2-barreloid (data not shown). Additionally, injections outside the PMBSF, into dysgranular medial parietal cortex, also resulted in a normal pattern of staining in the VPL and PoM thalamus and the zona incerta (Lin et al., 1997) (Fig. 4c) for either genotype. Finally, injection into the primary auditory cortex resulted in a normal pattern of staining in the auditory thalamus (data not shown). Our qualitative observations therefore provide no indications of gross abnormalities in the point-to-point (barrel-to-barreloid or region-to-region) specificity of thalamic connections associated with the functional distortions seen in the primary somatosensory cortex. However, we cannot rule out that there are finer abnormalities undetected by our methods.
Fig. 4.

The connectivity of the thalamus to the parietal cortex is topographically normal in adult ephrin-A5 knock-out mice. After each imaging experiment, one or two retrograde tracers (fast DiI and/or fast blue) were injected into the somatosensory cortex.A, In the PMBSF of this ephrin-A5 knock-out mouse fast DiI (red spot by white arrow) was injected into the left B2 barrel (this figure shows the deepest extent of the injection). All scale bars, 100 μm. B, The ipsilateral thalamus showed the expected pattern of fast DiI labeling, with a barreloid-like morphology in the VPM nucleus and a few scattered cells in the PoM nucleus (white arrows). Thewhite dotted lines indicate the approximate shapes of the thalamic nuclei in this section. C, In a different ephrin-A5 knock-out mouse, two injections further illustrate the normal point-to-point and region-to-region connectivity of the thalamus and cortex. In this mouse fast DiI was injected into the B2-barrel, and fast blue was injected into dysgranular cortex just medial to the E1 barrel. The ipsilateral thalamus showed fast DiI labeling in a barreloid-like pattern in VPM and fast blue labeling in the PoM, VPL, and a few scattered cells in the zona incerta (not easily seen here, just ventrolateral to the VPL).
DISCUSSION
Summary of results
Our results demonstrate that in ephrin-A5 knock-out mice the functional organization of primary somatosensory cortex is malformed. The features of individual functional representations within the barrel cortex and the point-to-point mapping rules of anatomical connectivity between the thalamus and the somatosensory cortex do not appear to be influenced by disruption of the ephrin-A5 gene. However, local spatial relations of the functional organization appear to be influenced by the deficiency of ephrin-A5 as they correlate with the expression gradient of ephrin-A5 during development in control mice (Vanderhaeghen et al., 2000). We found that the functional organization in the barrel cortex was malformed, such that medial functional representations were closer together and more overlapping and lateral representations tended toward the opposite. These results suggest involvement of ephrin-A5 in the functional organization of thalamic inputs to the cortex and potentially also some aspects of intracortical functional organization in the somatosensory cortex. Finally, the findings reported here on the functional consequences of gene deletion are, to the best of our knowledge, the first to combine gene manipulation with in vivo functional imaging and underscore the advantage of combining both approaches to the study of gene function.
Interpretation of developmental malformations in adults
One difficulty in assessing adult knock-out mice that have a developmental malformation is that the state of the adult animal might reflect either developmental adaptations or normal or compensatory mechanisms of plasticity during maturation. For example, in young ephrin-A5 knock-out mice there might exist a period of structural and functional disruptions at all levels of cortex. Although we have seen no evidence that directly supports this idea (this study; Vanderhaeghen et al., 2000), such a model could be consistent with the proposition that ephrin-A5 may differentially affect axonal growth and sprouting across cortical layers (Castellani et al., 1998). During maturation, normal use of whiskers could initiate compensatory mechanisms in the ephrin-A5 knock-out mice, which act to reduce or eliminate only certain functional intracortical differences between the genotypes but are unable to change the thalamocortical and other intracortical differences. This interpretation is supported by the findings that structural plasticity in layer IV barrels, the predominant site of thalamocortical inputs, can occur only within few days after birth (for review, see Purves et al., 1994), whereas plasticity in the functional organization of the somatosensory cortex can occur throughout adulthood (for review, see Ebner et al., 1997).
Anatomical versus functional organization
Our results demonstrate that the mediolateral aspect of the cortical functional organization is malformed. However, as the general layout of the whiskers' functional representations within the somatosensory cortex is preserved, it suggests that ephrin-A5 is one of potentially several yet-to-be-identified mapping labels that influence the final functional layout of the somatosensory cortex in the mouse. Furthermore, if ephrin-A5 serves as an axonal guidance label in the development of the somatosensory cortex, then the functional changes in cortical organization could be related to anatomical changes that are induced by its removal. In this study, we did not detect major disruptions in the anatomical structure of layer IV, or aberrant point-to-point-connectivity of the thalamus to cortex. However, mediolateral anatomical malformations qualitatively and quantitatively similar to the functional malformations reported here were found in studies of layer IV barrels in juvenile and adult ephrin-A5 knock-out mice, specifically, medial barrels were smaller than control mice's and lateral barrels were larger than control mice's (Vanderhaeghen et al., 2000). However, the correlation between changes in the thalamocortical projections and evoked thalamocortical activity does not predict the effect on evoked intracortical activity. For example, in the case of the adenylyl cyclase I mutant mouse (also known as the “barrelless mouse”) there is a major disruption of the anatomical structure of layer IV, such that are no obvious anatomical barrels and thalamocortical afferents project aberrantly, and yet the functional organization of the cortex as assessed by 2-deoxyglucose uptake appears normal (Welker et al., 1996; Abdel-Majid et al., 1998).
In contrast to thalamocortical changes, our results suggest that at the level of individual WFRs there are no detectable intracortical changes. This may suggest that ephrin-A5 does not play a role in the development of intracortical aspects of single WFRs within primary somatosensory cortex, but only in thalamocortical aspects. However, this interpretation may be too simplistic, because when coupled with the changes in the sizes of their inputs, the layer IV barrels (Vanderhaeghen et al., 2000), the lack of a detectable change in the size of WFRs suggests that their size may have changed relative to their inputs. The exact meaning of such a relative size change of a WFR to its input remains to be determined but may represent a compensation of activity in the intracortical component caused by an altered thalamocortical input. This point is highlighted by the fact that there are at least nine hypothetical possibilities related to changes in the thalamocortical and intracortical components of functional organization: the thalamic inputs could shrink, remain unchanged, or expand; whereas independently, the intracortical components could expand, shrink, or remain unchanged. In the ephrin-A5 knock-out mice we found that the functional organization was more complex than either of these possibilities. Specifically, the thalamocortical component had agradient of change, with the medial barrels being smaller and the lateral barrels being larger (Vanderhaeghen et al., 2000), whereas the intracortical component of the WFRs remained unchanged across the somatosensory cortex.
Implications of overlapping representations
The individual WFRs in ephrin-A5 knock-out mice were largely indistinguishable from control mice, however, at the level of multiple WFRs, there was a noticeable difference. Specifically, we found that there was a mediolateral gradient of change in the amount of overlap of WFRs across the primary somatosensory cortex of ephrin-A5 knock-out mice. This finding has several implications related to the neuronal response properties of these mice. Two scenarios could explain the changes observed in the level of overlap. (1) In regions of overlap of two WFRs, any given neuron can be activated by stimulation of either whisker. Therefore an increase in overlap implies an increase in the number of neurons that are activated by stimulation of either whisker, and the opposite for a decrease in overlap. An alternative scenario is that, (2) regions of overlap consist of two distinct, but intermingled populations of neurons: one population that responds to stimulation of one whisker, and the other population that responds to stimulation of the other whisker. In this scenario an increase in overlap implies an increase in the amount of intermingled neurons, and the opposite for a decrease in overlap. These scenarios are not mutually exclusive, and a mixture of both scenarios is also conceivable. However, electrophysiological studies suggest that the first scenario is more likely, because neurons in the barrel cortex typically respond to stimulation of several whiskers, whereas cells that respond to only one whisker are a minority, except perhaps in layer IV (Axelrad et al., 1976; Welker, 1976; Simons, 1978; Armstrong-James et al., 1992;Ghazanfar and Nicolelis, 1997; Moore and Nelson, 1998; Ghazanfar and Nicolelis, 1999; Zhu and Connors, 1999). Accordingly, the mediolateral gradient of change in the amount of cortical tissue shared by WFRs across the primary somatosensory cortex of ephrin-A5 knock-out mice implies that there is an underlying mediolateral gradient of change in the responsiveness of individual neurons across the primary sensory cortex. Such a gradient would mean that neurons within the medial part of primary somatosensory cortex respond to stimulation of more whiskers than neurons in the lateral primary somatosensory cortex. These findings may also have behavioral implications. In particular, because normally behaving animals use their entire whisker array and not single whiskers, the gradient of changes in overlap across the primary somatosensory cortex between WFRs suggests that ephrin-A5 deficient mice process information differentially for medial versus lateral whiskers. Further investigation may reveal whether these functional changes correlate to behavioral changes in the ephrin-A5 knock-out mice.
Footnotes
This work was supported in part by National Institutes of Health Grants EY-11912 (S.C-.C.), NS-34519 and NS-39760 (R.D.F.), and HD-29417 and EY-11559 (J.G.F); the National Science Foundation Grant IBN 9507936 (R.D.F.); the University of California, Irvine Medical Scientist Training Program (N.P.); the Sloan Foundation and Beckman Foundation (S.C-.C.); the Klingenstein Foundation (J.G.F); the Swedish Medical Research Council (J.F.); and the NATO/Belgian-American Education Foundation and the Belgian Fonds National de la Recherche Scientifique (P.V.).We thank Cynthia Chen-Bee for her helpful comments on this manuscript.
Correspondence should be addressed to Ron D. Frostig, Department of Neurobiology and Behavior, University of California at Irvine, Irvine, CA 92697-4550. E-mail: rfrostig@uci.edu.
REFERENCES
- 1.Abdel-Majid RM, Leong WL, Schalkwyk LC, Smallman DS, Wong ST, Storm DR, Fine A, Dobson MJ, Guernsey DL, Neumann PE. Loss of adenylyl cyclase I activity disrupts patterning of mouse somatosensory cortex. Nat Genet. 1998;19:289–291. doi: 10.1038/980. [DOI] [PubMed] [Google Scholar]
- 2.Armstrong-James M, Callahan CA, Friedman MA. Thalamo-cortical processing of vibrissal information in the rat. I Intracortical origins of surround but not centre-receptive fields of layer IV neurones in the rat S1 barrel field cortex. J Comp Neurol. 1991;303:193–210. doi: 10.1002/cne.903030203. [DOI] [PubMed] [Google Scholar]
- 3.Armstrong-James M, Fox K, Das-Gupta A. Flow of excitation within rat barrel cortex on striking a single vibrissa. J Neurophysiol. 1992;68:1345–1358. doi: 10.1152/jn.1992.68.4.1345. [DOI] [PubMed] [Google Scholar]
- 4.Axelrad H, Verley R, Edith F. Response evoked in mouse and rat SI cortex by vibrissa. Neurosci Lett. 1976;3:265–274. doi: 10.1016/0304-3940(76)90053-7. [DOI] [PubMed] [Google Scholar]
- 5.Castellani V, Yue Y, Gao PP, Zhou R, Bolz J. Dual action of a ligand for Eph receptor tyrosine kinases on specific populations of axons during the development of cortical circuits. J Neurosci. 1998;18:4663–4672. doi: 10.1523/JNEUROSCI.18-12-04663.1998. [DOI] [PMC free article] [PubMed] [Google Scholar]
- 6.Chen-Bee CH, Frostig RD. Variability and interhemispheric asymmetry of single-whisker functional representations in rat barrel cortex. J Neurophysiol. 1996;76:884–894. doi: 10.1152/jn.1996.76.2.884. [DOI] [PubMed] [Google Scholar]
- 7.Chen-Bee CH, Kwon MC, Masino SA, Frostig RD. Areal extent quantification of functional representations using intrinsic signal optical imaging. J Neurosci Methods. 1996;68:27–37. [PubMed] [Google Scholar]
- 8.Crair MC. Neuronal activity during development: permissive or instructive? Curr Opin Neurobiol. 1999;9:88–93. doi: 10.1016/s0959-4388(99)80011-7. [DOI] [PubMed] [Google Scholar]
- 9.Crowley JC, Katz LC. Development of ocular dominance columns in the absence of retinal input. Nat Neurosci. 1999;2:1125–1130. doi: 10.1038/16051. [DOI] [PubMed] [Google Scholar]
- 10.Dowling JL, Henegar MM, Liu D, Rovainen CM, Woolsey TA. Rapid optical imaging of whisker responses in the rat barrel cortex. J Neurosci Methods. 1996;66:113–122. doi: 10.1016/0165-0270(96)00007-6. [DOI] [PubMed] [Google Scholar]
- 11.Drescher U, Bonhoeffer F, Muller BK. The Eph family in retinal axon guidance. Curr Opin Neurobiol. 1997;7:75–80. doi: 10.1016/s0959-4388(97)80123-7. [DOI] [PubMed] [Google Scholar]
- 12.Ebner FF, Rema V, Sachdev R, Symons FJ. Activity-dependent plasticity in adult somatic sensory cortex. Semin Neurosci. 1997;9:47–58. [Google Scholar]
- 13.Feldheim DA, Vanderhaeghen P, Hansen MJ, Frisen J, Lu Q, Barbacid M, Flanagan JG. Topographic guidance labels in a sensory projection to the forebrain. Neuron. 1998;21:1303–1313. doi: 10.1016/s0896-6273(00)80650-9. [DOI] [PubMed] [Google Scholar]
- 14.Flanagan JG, Vanderhaeghen P. The ephrins and Eph receptors in neural development. Annu Rev Neurosci. 1998;21:309–345. doi: 10.1146/annurev.neuro.21.1.309. [DOI] [PubMed] [Google Scholar]
- 15.Fox K. The cortical component of experience-dependent synaptic plasticity in the rat barrel cortex. J Neurosci. 1994;14:7665–7679. doi: 10.1523/JNEUROSCI.14-12-07665.1994. [DOI] [PMC free article] [PubMed] [Google Scholar]
- 16.Frisen J, Yates PA, McLaughlin T, Friedman GC, O'Leary DD, Barbacid M. Ephrin-A5 (AL-1/RAGS) is essential for proper retinal axon guidance and topographic mapping in the mammalian visual system. Neuron. 1998;20:235–243. doi: 10.1016/s0896-6273(00)80452-3. [DOI] [PubMed] [Google Scholar]
- 17.Frostig RD, Lieke EE, Ts'o DY, Grinvald A. Cortical functional architecture and local coupling between neuronal activity and the microcirculation revealed by in vivo high-resolution optical imaging of intrinsic signals. Proc Natl Acad Sci USA. 1990;87:6082–6086. doi: 10.1073/pnas.87.16.6082. [DOI] [PMC free article] [PubMed] [Google Scholar]
- 18.Gao PP, Yue Y, Zhang JH, Cerretti DP, Levitt P, Zhou R. Regulation of thalamic neurite outgrowth by the Eph ligand ephrin-A5: implications in the development of thalamocortical projections. Proc Natl Acad Sci USA. 1998;95:5329–5334. doi: 10.1073/pnas.95.9.5329. [DOI] [PMC free article] [PubMed] [Google Scholar]
- 19.Ghazanfar AA, Nicolelis MA. Nonlinear processing of tactile information in the thalamocortical loop. J Neurophysiol. 1997;78:506–510. doi: 10.1152/jn.1997.78.1.506. [DOI] [PubMed] [Google Scholar]
- 20.Ghazanfar AA, Nicolelis MA. Spatiotemporal properties of layer V neurons of the rat primary somatosensory cortex. Cereb Cortex. 1999;9:348–361. doi: 10.1093/cercor/9.4.348. [DOI] [PubMed] [Google Scholar]
- 21.Glazewski S, Chen CM, Silva A, Fox K. Requirement for alpha-CaMKII in experience-dependent plasticity of the barrel cortex. Science. 1996;272:421–423. doi: 10.1126/science.272.5260.421. [DOI] [PubMed] [Google Scholar]
- 22.Goldreich D, Kyriazi HT, Simons DJ. Functional independence of layer IV barrels in rodent somatosensory cortex. J Neurophysiol. 1999;82:1311–1316. doi: 10.1152/jn.1999.82.3.1311. [DOI] [PubMed] [Google Scholar]
- 23.Gottlieb JP, Keller A. Intrinsic circuitry and physiological properties of pyramidal neurons in rat barrel cortex. Exp Brain Res. 1997;115:47–60. doi: 10.1007/pl00005684. [DOI] [PubMed] [Google Scholar]
- 24.Grinvald A, Lieke E, Frostig RD, Gilbert CD, Wiesel TN. Functional architecture of cortex revealed by optical imaging of intrinsic signals. Nature. 1986;324:361–364. doi: 10.1038/324361a0. [DOI] [PubMed] [Google Scholar]
- 25.Hodge CJ, Jr, Stevens RT, Newman H, Merola J, Chu C. Identification of functioning cortex using cortical optical imaging. Neurosurgery. 1997;41:1137–1144. doi: 10.1097/00006123-199711000-00023. [DOI] [PubMed] [Google Scholar]
- 26.Hoeflinger BF, Bennett-Clarke CA, Chiaia NL, Killackey HP, Rhoades RW. Patterning of local intracortical projections within the vibrissae representation of rat primary somatosensory cortex. J Comp Neurol. 1995;354:551–563. doi: 10.1002/cne.903540406. [DOI] [PubMed] [Google Scholar]
- 27.Hornberger MR, Dutting D, Ciossek T, Yamada T, Handwerker C, Lang S, Weth F, Huf J, Wessel R, Logan C, Tanaka H, Drescher U. Modulation of EphA receptor function by coexpressed ephrinA ligands on retinal ganglion cell axons. Neuron. 1999;22:731–742. doi: 10.1016/s0896-6273(00)80732-1. [DOI] [PubMed] [Google Scholar]
- 28.Katz LC, Shatz CJ. Synaptic activity and the construction of cortical circuits. Science. 1996;274:1133–1138. doi: 10.1126/science.274.5290.1133. [DOI] [PubMed] [Google Scholar]
- 29.Keller A, White EL, Cipolloni PB. The identification of thalamocortical axon terminals in barrels of mouse Sml cortex using immunohistochemistry of anterogradely transported lectin (Phaseolus vulgaris-leucoagglutinin). Brain Res. 1985;343:159–165. doi: 10.1016/0006-8993(85)91171-0. [DOI] [PubMed] [Google Scholar]
- 30.Kim U, Ebner FF. Barrels and septa: separate circuits in rat barrels field cortex. J Comp Neurol. 1999;408:489–505. [PubMed] [Google Scholar]
- 31.Lin RC, Nicolelis MA, Chapin JK. Topographic and laminar organizations of the incertocortical pathway in rats. Neuroscience. 1997;81:641–651. doi: 10.1016/s0306-4522(97)00094-8. [DOI] [PubMed] [Google Scholar]
- 32.Lu SM, Lin RC. Thalamic afferents of the rat barrel cortex: a light- and electron- microscopic study using Phaseolus vulgaris leucoagglutinin as an anterograde tracer. Somatosens Mot Res. 1993;10:1–16. doi: 10.3109/08990229309028819. [DOI] [PubMed] [Google Scholar]
- 33.Mackarehtschian K, Lau CK, Caras I, McConnell SK. Regional differences in the developing cerebral cortex revealed by ephrin-A5 expression. Cereb Cortex. 1999;9:601–610. doi: 10.1093/cercor/9.6.601. [DOI] [PubMed] [Google Scholar]
- 34.Masino SA, Kwon MC, Dory Y, Frostig RD. Characterization of functional organization within rat barrel cortex using intrinsic signal optical imaging through a thinned skull. Proc Natl Acad Sci USA. 1993;90:9998–10002. doi: 10.1073/pnas.90.21.9998. [DOI] [PMC free article] [PubMed] [Google Scholar]
- 35.Mayhew JE, Askew S, Zheng Y, Porrill J, Westby GW, Redgrave P, Rector DM, Harper RM. Cerebral vasomotion: a 0.1-Hz oscillation in reflected light imaging of neural activity. NeuroImage. 1996;4:183–193. doi: 10.1006/nimg.1996.0069. [DOI] [PubMed] [Google Scholar]
- 36.Moore CI, Nelson SB. Spatio-temporal subthreshold receptive fields in the vibrissa representation of rat primary somatosensory cortex. J Neurophysiol. 1998;80:2882–2892. doi: 10.1152/jn.1998.80.6.2882. [DOI] [PubMed] [Google Scholar]
- 37.Narayan SM, Santori EM, Toga AW. Mapping functional activity in rodent cortex using optical intrinsic signals. Cereb Cortex. 1994;4:195–204. doi: 10.1093/cercor/4.2.195. [DOI] [PubMed] [Google Scholar]
- 38.Nemoto M, Nomura Y, Tamura M, Sato C, Houkin K, Abe H. Optical imaging and measuring of local hemoglobin concentration and oxygenation changes during somatosensory stimulation in rat cerebral cortex. Adv Exp Med Biol. 1997;428:521–531. doi: 10.1007/978-1-4615-5399-1_74. [DOI] [PubMed] [Google Scholar]
- 39.Peterson BE, Goldreich D. A new approach to optical imaging applied to rat barrel cortex. J Neurosci Methods. 1994;54:39–47. doi: 10.1016/0165-0270(94)90158-9. [DOI] [PubMed] [Google Scholar]
- 40.Peterson BE, Goldreich D, Merzenich MM. Optical imaging and electrophysiology of rat barrel cortex. I Responses to small single-vibrissa deflections. Cereb Cortex. 1998;8:173–183. doi: 10.1093/cercor/8.2.173. [DOI] [PubMed] [Google Scholar]
- 41.Polley DB, Chen-Bee CH, Frostig RD. Two directions of plasticity in the sensory-deprived adult cortex. Neuron. 1999;24:623–637. doi: 10.1016/s0896-6273(00)81117-4. [DOI] [PubMed] [Google Scholar]
- 42.Prakash N, Frostig RD. Characterization of the functional organization in mouse barrel cortex using intrinsic signal optical imaging through intact skull. Soc Neurosci Abstr. 1997;23:2343. [Google Scholar]
- 43.Prakash N, Cohen-Cory S, Frostig RD. Rapid and opposite effects of BDNF and NGF on the functional organization of the adult cortex in vivo. Nature. 1996;381:702–706. doi: 10.1038/381702a0. [DOI] [PubMed] [Google Scholar]
- 44.Purves D, Riddle DR, White LE, Gutierrez-Ospina G. Neural activity and the development of the somatic sensory system. Curr Opin Neurobiol. 1994;4:120–123. doi: 10.1016/0959-4388(94)90041-8. [DOI] [PubMed] [Google Scholar]
- 45.Sheth BR, Moore CI, Sur M. Temporal modulation of spatial borders in rat barrel cortex. J Neurophysiol. 1998;79:464–470. doi: 10.1152/jn.1998.79.1.464. [DOI] [PubMed] [Google Scholar]
- 46.Simons Response properties of vibrissa units in rat SI somatosensory neocortex. J Neurophysiol. 1978;41:798–820. doi: 10.1152/jn.1978.41.3.798. [DOI] [PubMed] [Google Scholar]
- 47.Ts'o DY, Frostig RD, Lieke EE, Grinvald A. Functional organization of primate visual cortex revealed by high resolution optical imaging. Science. 1990;249:417–420. doi: 10.1126/science.2165630. [DOI] [PubMed] [Google Scholar]
- 48.Vanderhaeghen P, Lu Q, Prakash N, Frisen J, Walsh CA, Frostig RD, Flanagan JG. A mapping label required for normal scale of body representation in the cortex. Nat Neurosci. 2000;3:358–365. doi: 10.1038/73929. [DOI] [PubMed] [Google Scholar]
- 49.Welker C. Receptive fields of barrels in the somatosensory neocortex of the rat. J Comp Neurol. 1976;166:173–189. doi: 10.1002/cne.901660205. [DOI] [PubMed] [Google Scholar]
- 50.Welker E, Armstrong-James M, Bronchti G, Ourednik W, Gheorghita-Baechler F, Dubois R, Guernsey DL, Van der Loos H, Neumann PE. Altered sensory processing in the somatosensory cortex of the mouse mutant barrelless. Science. 1996;271:1864–1867. doi: 10.1126/science.271.5257.1864. [DOI] [PubMed] [Google Scholar]
- 51.Wong-Riley MT, Welt C. Histochemical changes in cytochrome oxidase of cortical barrels after vibrissal removal in neonatal and adult mice. Proc Natl Acad Sci USA. 1980;77:2333–2337. doi: 10.1073/pnas.77.4.2333. [DOI] [PMC free article] [PubMed] [Google Scholar]
- 52.Woolsey TA, Van der Loos H. The structural organization of layer IV in the somatosensory region (SI) of mouse cerebral cortex. The description of a cortical field composed of discrete cytoarchitectonic units. Brain Res. 1970;17:205–242. doi: 10.1016/0006-8993(70)90079-x. [DOI] [PubMed] [Google Scholar]
- 53.Zhu JJ, Connors BW. Intrinsic firing patterns and whisker-evoked synaptic responses of neurons in the rat barrel cortex. J Neurophysiol. 1999;81:1171–1183. doi: 10.1152/jn.1999.81.3.1171. [DOI] [PubMed] [Google Scholar]