

Abstract
In severe hypoxia the breathing frequency is modulated in a biphasic manner: an initial increase (augmentation) is followed by a depression and cessation of breathing (apnea). Using a mouse slice preparation that contains the functional respiratory network, we aimed at identifying the neurons responsible for this frequency modulation. Whole-cell patch recordings revealed that expiratory neurons become tonically active during anoxia, indicating that these neurons cannot be responsible for the respiratory frequency modulation. Inspiratory neurons tended to depolarize (by 6.9 mV; n = 9), and the frequency of rhythmic activity was significantly increased during anoxia (from 0.16 to 0.4 Hz; n = 9). After the blockade of network activity with 6-cyano-7-nitroquinoxaline-2,3-dione, most inspiratory neurons became tonically active (72%; n = 25, non-pacemaker). In anoxia, the membrane potential of these non-pacemaker neurons did not change (−0.26 mV; n = 6), and their tonic activity ceased. Only a subpopulation of inspiratory neurons remained rhythmically active in the absence of network activity (pacemaker neurons, 28%, 7 of 25 inspiratory neurons). In anoxia two subgroups of pacemaker neurons were differentiated; one group showed a transient increase in the bursting activity, followed by a decrease and cessation of rhythmic activity. These neurons tended to depolarize (by 10.3 mV) during anoxia. The second group remained rhythmic during the entire anoxic exposure and exhibited no depolarization. The time course of the frequency modulation in all pacemaker neurons resembled that of the intact network. We conclude that pacemaker neurons are primarily responsible for the frequency modulation in anoxia and that in the respiratory network there is a strict separation between rhythm- and pattern-generating mechanisms.
Keywords: pacemaker neurons, hypoxic response, respiratory, apnea, augmentation, anoxia
The mammalian respiratory system responds to severe hypoxia (anoxia) in a biphasic manner (Lawson and Long, 1983; Bureau et al., 1984; St. John and Bianchi, 1985; Richter et al., 1991; Haddad and Jiang, 1993). An initial increase in the breathing frequency (augmentation) is followed by a frequency decline (depression) and a complete cessation of respiratory activity (apnea). The characterization of the activity of respiratory neurons within the medulla revealed an unexpected finding. Despite the pronounced frequency increase, a significant proportion of bulbospinal neurons showed no change or even a decline in their spiking activity during hypoxia. Only a few neurons in the ventral respiratory group (VRG) increased their activity (St. John and Wang, 1977; St. John and Bianchi, 1985). Similarly, in chemodeafferented animals, as well as in the brainstem–spinal cord preparation, many inspiratory and expiratory VRG neurons ceased their activity during augmentation (Richter et al., 1991; Ballanyi et al., 1994; England et al., 1995). This was surprising because it is generally believed that the VRG contains the rhythm-generating neural network. These findings suggest that the initial frequency augmentation is not caused by a general excitation of the entire respiratory network. However, the mechanisms underlying the frequency increase remain unresolved.
An important step toward a more rigorous cellular analysis of the hypoxic response was the demonstration that the respiratory network isolated in a medullary slice preparation still responds to anoxia with an initial augmentation of respiratory frequency followed by a depression and apnea (Ramirez et al., 1997, 1998; Telgkamp and Ramirez, 1999). This slice preparation contains the pre-Bötzinger complex (PBC), a VRG region that is essential for respiratory rhythm generation (Smith et al., 1991; Schwarzacher et al., 1995; Koshiya and Guyenet, 1998; Ramirez et al., 1998). Neurons that are activated in phase with XII and VRG population activity are inspiratory neurons. Neurons that are inhibited during VRG activity are expiratory neurons. In the absence of synaptic inhibition, expiratory neurons discharged tonically or in phase with inspiratory activity (Ramirez and Richter, 1996;Ramirez et al., 1997; Shao and Feldman, 1997). These findings suggest that respiratory rhythm generation originates from rhythmic inspiratory activity, which is derived from a subpopulation of inspiratory neurons with pacemaker properties (Smith et al., 1995). Pacemaker neurons that could contribute to this activity have been identified in the respiratory network (Smith et al., 1991; Johnson et al., 1994; Koshiya and Smith, 1999). It has been proposed that the endogenous rhythmicity in pacemaker neurons is synchronized via glutamatergic [6-cyano-7-nitroquinoxaline-2,3-dione (CNQX)-sensitive] mechanisms and transformed in the presence of synaptic inhibition into the respiratory rhythm, which consists of inspiration and expiration (Johnson et al., 1994; Smith et al., 1995; Rekling and Feldman, 1998;Butera et al., 1999a,b; Koshiya and Smith, 1999).
In this study we examined the hypothesis that the anoxia-induced frequency increase is attributable to a specific activation of pacemaker neurons. To test this hypothesis, we compared the anoxic effect on the activity of respiratory neurons in the presence and absence of network activity. We demonstrate that after isolation from the network all pacemaker neurons exhibited an increase in bursting frequency. In contrast, pharmacologically isolated non-pacemaker neurons became rapidly inactive in anoxia. We conclude that pacemaker neurons are primarily responsible for the generation of the anoxic augmentation in respiratory activity.
MATERIALS AND METHODS
Preparation of slices. Experiments were performed on male and female mice (6–13 d old) that were deeply anesthetized with ether and decapitated at the C3–C4 level. The procedure will be summarized only briefly here (for details, see Ramirez et al., 1996). The brainstem was isolated in an ice-cold artificial CSF (ACSF) bubbled with carbogen (95% oxygen and 5% CO2). The ACSF contained (in mm): 128 NaCl, 3 KCl, 1.5 CaCl2, 1 MgSO4, 24 NaHCO, 0.5 NaH2PO4, and 30d-glucose, pH of 7.4. The brainstem was then glued onto an agar block with its rostral end up and mounted into a vibratome. Thin slices were serially sectioned from rostral to caudal until the rostral boundary of the PBC became visible. This area was recognized by specific landmarks such as the inferior olive, the nucleus ambiguus, and the hypoglossal nucleus (XII) (Fig.1). Slices that contained the PBC (500–600 μm thick) were immediately transferred into a recording chamber and maintained at a temperature of 29°C. After 30 min the potassium concentration was raised from 3 to 8 mm over another 30 min to obtain spontaneous rhythmic activity. Anoxia was induced by switching the gas used to bubble the incoming ACSF from carbogen to nitrogen (95% N2–5% CO2). In all of the experiments, anoxic conditions were maintained for 4 min.
Fig. 1.

Experimental model and cellular recordings of respiratory neurons. Left panel, Schematic representation of a brainstem slice preparation obtained from mice. This slice contains the pre-Bötzinger complex (PBC), the hypoglossal nucleus (XII), the inferior olive (IO), the nucleus ambiguus (NA), the nucleus tractus solitarius (NTS), and the spinal trigeminal nucleus (Sp5). Extracellular population recordings of respiratory activity from the PBC (PBC int: integrated trace) were obtained simultaneously with intracellular recordings from an expiratory neuron (middle panel) or inspiratory neuron (right panel).
Recordings. Extracellular recordings were obtained with suction electrodes placed on the surface of the PBC. The signal that was collected was amplified 2000 times, filtered (low-pass 1.5 kHz, high-pass 250 Hz), rectified, and integrated using an electronic filter (time constant 30–50 msec). Integrated population activity from the PBC is in phase with integrated XII activity (Telgkamp and Ramirez, 1999). Therefore, we will use this extracellularly recorded PBC activity as a marker for inspiratory population activity (Fig. 1).
Intracellular patch-clamp recordings were obtained from PBC neurons with the blind-patch technique. Respiratory neurons were identified according to their anatomical location (Fig. 1) and with respect to their discharge characteristics in relation to the population respiratory activity. Inspiratory neurons were activated in phase with population activity (Fig. 1, right panel). Expiratory neurons were activated out of phase with population activity (Fig. 1,middle panel). The recordings were obtained using patch electrodes manufactured from borosilicate glass tubes containing a filament (Clarke GC 150TF) filled with a solution containing (in mm): 140 K-gluconic acid, 1 CaCl2*6H2O, 10 EGTA, 2 MgCl2*6H2O, 4 Na2ATP, 10 HEPES. The recorded membrane potentials were corrected for junctional potentials as described byNeher (1992). All recordings were stored with a personal computer on Axotape (Version 2.0, Axon Instruments). All substances were obtained from Sigma (St. Louis, MO), except for CNQX (Tocris, Ballwin, MO). CNQX was diluted in ACSF and bath-applied at the final concentration of 20 μm.
Graphs containing population data were obtained by measuring in individual slices for each experiment the mean values for inspiratory frequency, action potential (AP) frequency, and/or the amplitude of phasic synaptic inhibition. The mean values were obtained by averaging each parameter during consecutive respiratory cycles over a period of 10 sec. The mean values obtained from different individual slices for any given experiment were averaged and used for the final graph.
Statistical values are given as mean value ± SEM. Significance was assessed with the one-way ANOVA test; values were assumed to be significant at p < 0.05.
RESULTS
Anoxic response of expiratory neurons in the intact network
As described previously (Ramirez et al., 1998; Telgkamp and Ramirez, 1999), anoxia caused an initial increase in the frequency of rhythmic population activity (augmentation) (Figs.2A, top trace, 3A). This frequency increase was accompanied by a gradual cessation of spiking activity of expiratory neurons (Figs. 2A,bottom trace, B, 3B) and a gradual suppression of synaptic inhibition received by expiratory neurons (Figs. 2A, bottom trace, B,3C). During the depression period there was no tonic activity in three of nine expiratory neurons.
Fig. 2.

Anoxic response of an expiratory neuron in the intact network. A, Simultaneous recording of integrated population activity from the PBC (top trace) and an expiratory neuron during anoxia (bottom trace). Thetop gray bar represents the time of the anoxic exposure. Action potentials have been truncated to better illustrate the anoxic suppression of phasic synaptic inhibition (fast downward deflections). The large inspiratory burst generated during anoxia represents a sigh burst, which is followed by a brief burst of apnea. This activity has been characterized by Lieske et al. (2000). B, The three examples were obtained at the times indicated by 1,2, and 3 in A. The examples shown in an extended time scale represent control conditions obtained at time 20 sec (1), the anoxic augmentation obtained at time 90 sec (2), and the depression period obtained at time 150 sec (3). The action potentials were not truncated in these recordings. Recordings were obtained from an 8-d-old animal.
Fig. 3.
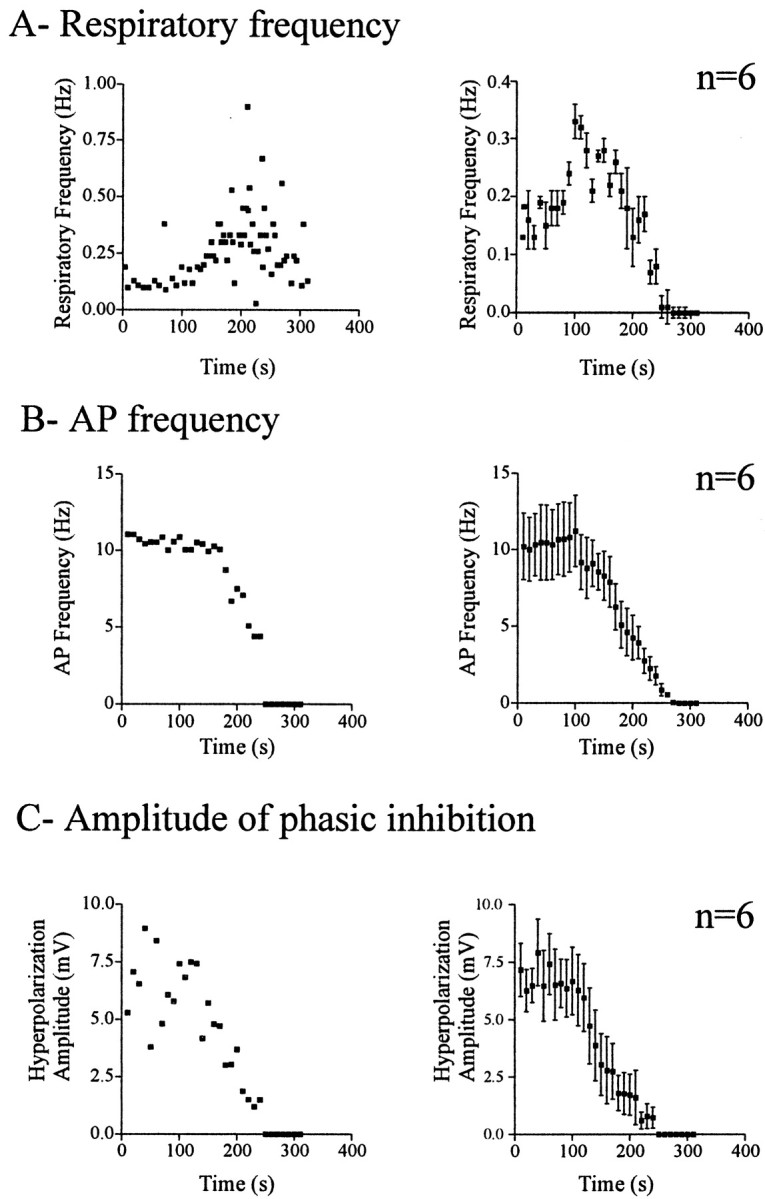
Graphs representing the changes induced by anoxia in respiratory frequency (A), action potential frequency in expiratory neurons (B), and the amplitude of the phasic inhibition of expiratory neurons (C) over time. The left panels represent measurements obtained from the same neuron illustrated in Figure 2. The right panels represent pooled data obtained from six different experiments. Time 0 was set at the onset of anoxia exposure. Data were obtained from 7- to 13-d-old animals.
A quantitative analysis of nine expiratory neurons revealed a slight depolarization during anoxia (by 1.5 ± 0.9 mV); however, the average membrane potential measured for nine expiratory cells did not significantly change from −62 ± 1.6 mV under control conditions to −60 ± 1.9 mV (p > 0.05) during the anoxic augmentation and then to −61.1 ± 1.8 mV (p > 0.05) during depression. These membrane potential values were determined during the expiratory periods at the time of the maximal augmentation and the maximal depression, as was evident in the maximal and minimal frequency of respiratory rhythmic activity. The anoxia-induced depolarization was not accompanied by an increase in spiking frequency. Instead, expiratory neurons showed a significant decrease in the rate of AP generation from 10.44 ± 1.53 Hz under control conditions to 7.22 ± 0.7 Hz (p > 0.05) during the anoxic augmentation, and to 1.46 ± 0.6 Hz (p < 0.01) during the depression period. The AP frequency was measured during four consecutive expiratory periods in control conditions and during the anoxic augmentation and depression. The amplitude of the phasic inhibition decreased from −6.9 ± 1 mV in control conditions to −5.2 ± 1.5 mV (p > 0.05) during the maximal augmentation and to −0.5 ± 0.3 (p< 0.01) during the maximal depression. To better illustrate the time course of these changes, we obtained the mean respiratory frequency (Fig. 3A, right panel), the mean AP frequency (Fig. 3B, right panel), and the mean amplitude of phasic inhibition (Fig. 3C, right panel) for consecutive intervals of 10 sec. Figure 3,left panels, shows the time course obtained from one individual expiratory neuron (the same neuron as illustrated in Fig.2); the right panels show the time course averaged from six recordings of expiratory neurons.
Anoxic response of inspiratory neurons in the intact network
We also examined the anoxic response of inspiratory neurons. Nine inspiratory neurons were analyzed using the same procedure as described for the expiratory neurons. During the anoxic augmentation, inspiratory neurons tended to depolarize but remained rhythmically active (Fig.4A,B2). During the depression phase, inspiratory neurons discharged sporadically with weak (amplitude of the oscillation <20% of the control bursts) and rare bursts (Fig. 4B3). Six of nine inspiratory neurons became inactive during this phase. Figure4C illustrates the time course of the instantaneous inspiratory bursting frequency for the same neuron shown in Figure4A. The time course averaged from seven neurons is illustrated on Figure 4D; C andD were obtained as described for the expiratory neurons and demonstrate a biphasic frequency modulation in response to anoxia.
Fig. 4.

Anoxic response of inspiratory neurons in the intact network. A, Simultaneous recording of integrated population activity from the PBC (top trace) and an inspiratory neuron during anoxia (bottom trace). Thetop gray bar represents the time of the anoxic exposure.B, The three examples were obtained at the times indicated by 1, 2, and 3in A. The examples shown in an extended time scale represent control conditions at time 20 sec (1), the anoxic augmentation at time 90 sec (2), and the anoxic depression at time 150 sec (3). As in Figure 2, the large inspiratory bursts represent in vitro sighs. C, Instantaneous inspiratory frequency plotted against time obtained from the recording illustrated in A. Time 0 is set at the onset of anoxia. Thefilled squares represent strong inspiratory bursts;open squares represent weak inspiratory bursts. Recordings obtained from a postnatal day 8 (P8) animal.D, Mean plot of the instantaneous inspiratory frequency versus time obtained from seven neurons. Data were obtained from 6- to 13-d-old animals.
The anoxic response was quantified for nine inspiratory neurons. The most hyperpolarized membrane potential values that were generated after each inspiratory burst were measured both in control and under anoxic conditions. The average amplitude of the anoxia-induced depolarization was 6.8 ± 1.7 mV. The membrane potential mean value tended to depolarize from −62.5 ± −1.7 mV in control to −55.6 ± 3 mV (p > 0.05) during the maximal augmentation and to −57.6 ± 1.5 mV (p > 0.05) during the maximal depression phase. Both burst duration and intraburst AP frequency were altered during anoxia. The burst duration decreased from 0.82 ± 0.04 sec under control conditions to 0.74 ± 0.04 sec (p > 0.05) during the maximal augmentation and to 0.23 ± 0.04 sec (p < 0.01) during the maximal depression. The intraburst frequency of AP decreased from 38.1 ± 2.4 Hz under control conditions to 33.09 ± 2.5 Hz (p > 0.05) during the maximal augmentation and to 11.96 ± 2.2 Hz (p < 0.01) during the maximal depression.
Blockade of respiratory network activity reveals pacemaker and non-pacemaker inspiratory neurons
To assess more directly the anoxic effect on individual respiratory neurons, we blocked glutamatergic synaptic activity with CNQX, which eliminated rhythmic population activity. In the absence of respiratory network activity, 18 of 25 inspiratory neurons ceased to discharge rhythmically and became tonically active. These neurons are referred to as non-pacemaker neurons (Fig.5A). In contrast, seven inspiratory neurons remained rhythmically active in the absence of respiratory network activity. These neurons are referred to as pacemaker neurons according to Koshiya and Smith (1999) (Fig.5B).
Fig. 5.

Blockade of respiratory network activity reveals non-pacemaker and pacemaker inspiratory neurons. A1,B1, Two examples of inspiratory neurons recorded simultaneously with integrated population activity from the PBC in control conditions. A2, B2, After elimination of network activity by blocking glutamatergic synaptic transmission with CNQX (20 μm), the non-pacemaker neuron became tonically active (A2), whereas pacemaker neuron remained rhythmically active (B2). Recordings were obtained from P9 and P7 animals, respectively.
Anoxic response of non-pacemaker inspiratory neurons
Six of 18 non-pacemaker neurons were tested for their sensitivity to anoxia. On application of anoxic conditions, none of the inspiratory non-pacemaker neurons showed a significant increase in their discharge frequency. One recording is illustrated in Figure6A. Ninety seconds after the onset of anoxia, which is equivalent to the augmentation phase in the intact network, the neuron continued to generate some action potentials. However, the example in Figure 6B2shows at an extended time scale a significant decrease in the AP frequency compared with control (Fig. 6B1). The AP activity ceased completely during prolonged anoxia (Fig.6B3). The instantaneous AP frequency of this neuron was plotted against time (Fig. 6C). The mean plot obtained for six neurons recorded in six different slices is illustrated in Figure 6D. The biphasic character of the anoxic response, as was evident in the intact network (Figs. 3A,4D), was abolished in the pharmacologically isolated non-pacemaker neurons. Instead these neurons exhibited only a rapid depression in their AP frequency.
Fig. 6.

Anoxic response of isolated non-pacemaker inspiratory neurons. A, Recording of integrated population activity indicating the absence of rhythmic activity in the PBC (top trace) and a non-pacemaker neuron (bottom trace) in the presence of CNQX (20 μm). The top gray bar represents the time of the anoxic exposure. B, The three examples were obtained at the times indicated by 1, 2, and 3 in A. The examples shown in an extended time scale represent control conditions at time 20 sec (1), the anoxic augmentation at time 90 sec (2), and the depression period at time 150 sec (3). C, Instantaneous inspiratory frequency plotted against time obtained from the recording illustrated in A. Time 0 is set at the onset of anoxia. Recordings were obtained from a P9 animal. D, Mean plot of the instantaneous inspiratory frequency versus time obtained from six neurons. Note the absence of a significant excitation. Data were obtained from 7- to 9-d-old animals.
Anoxia did not alter the membrane potential of non-pacemaker neurons. The membrane potential values for six neurons were −56.6 ± 1.2 mV under control conditions, −56.3 ± 1.4 mV during the time corresponding to the maximal augmentation in the intact network, and −57.3 ± 1.4 mV during the time corresponding to the maximal depression. During the initial time of the anoxic exposure (90 sec), there was no significant change in the AP frequency (from 3.6 ± 0.7 Hz under control conditions to 3.3 ± 0.7 Hz in anoxia;p > 0.05); however, the AP frequency decreased significantly to 1.3 ± 0.6 Hz during prolonged anoxia (110 sec;p < 0.01). These values were obtained during intervals of 15 sec at 90 and 110 sec, respectively.
Anoxic response of pacemaker inspiratory neurons
Seven pacemaker neurons that were rhythmically active in phase with inspiration under control conditions and remained rhythmically active after perfusion of CNQX were exposed to anoxic conditions. As in the intact network they responded in a biphasic manner; however, we found two different types of responses. For three pacemaker neurons, application of anoxic conditions led first to an increase in bursting frequency corresponding in time to the augmentation phase of the intact network (Fig.7A,B2). During prolonged anoxia, bursting became irregular and not as pronounced compared with the control conditions, and these neurons generated only weak bursts after 3 min in anoxia (Fig. 7B3). Figure 7C shows the instantaneous bursting frequency of the same neuron shown in Figure 7A. The mean histogram obtained for the three pacemaker neurons with this type of response is illustrated in Figure 7D. Both graphs show response properties resembling the biphasic response of the intact network. This is better illustrated by superimposing the response of the pacemaker neurons (Fig. 7D, filled squares) on the response of the intact network (Fig. 7D, open circles). Like the intact network, these neurons became inactive after 3 min in anoxia. Because our recordings were obtained with the conventional whole-cell patch-clamp technique, the anoxia-induced suppression of pacemaker bursts after 3 min in anoxia could be caused by a washout of bursting properties. However, this is unlikely because bursting properties reappeared 10 min after the return to normoxic conditions (Fig. 7A, right panel).
Fig. 7.

Anoxic response of isolated pacemaker inspiratory neurons. A, Simultaneous recording of integrated population activity from the PBC (top trace) and an inspiratory pacemaker neuron (bottom trace) during anoxia in the presence of CNQX (20 μm) obtained from a P6 animal. The top gray bar represents the time of the anoxic exposure. The right part of the recording illustrates the bursting activity 10 min after a return to normoxic conditions. B, Samples from A presented in an extended time scale and representing control conditions at time 20 sec (1), anoxic augmentation at time 90 sec (2), and the depression period at time 150 sec (3). C, Instantaneous inspiratory frequency plotted against time. Time 0 was set at the onset of anoxia. The filled squares represent strong inspiratory bursts;open squares represent weak inspiratory bursts.D, Mean plot of the instantaneous inspiratory frequency versus time obtained from three neurons (filled squares). The mean plot obtained from seven neurons in an intact network has been added in this graph for comparison (open circles). The pacemaker neurons showed an anoxic response, which is qualitatively similar to the network response, despite the fact that the increase in the bursting frequency is more pronounced for pacemaker neurons. Data were obtained from 6- to 11-d-old animals.
The three pacemaker neurons tended to depolarize from −59.6 ± 5.8 mV under control conditions to −49.3 ± 8 mV during the maximal augmentation (p > 0.05). The membrane potential returned to −60 ± 4.9 mV during the maximal depression (p > 0.05). The burst duration changed insignificantly from 0.70 ± 0.23 sec in control conditions to 0.45 ± 0.29 sec during the maximal augmentation (p > 0.05) and significantly to 0.04 ± 0.15 sec during the maximal depression (p < 0.01). The intraburst AP frequency changed significantly from 53.2 ± 2.8 Hz in control conditions to 21.36 ± 13.1 Hz during the maximal augmentation (p < 0.05) and to 6.7 ± 3.6 Hz during the maximal depression (p < 0.01). Measurements were performed for six consecutive bursts in control conditions, maximal augmentation, and maximal depression.
In contrast to these neurons, four pacemaker neurons remained rhythmically active during the entire time of anoxic exposure (Fig.8A,B) and exhibited a transient increase in bursting frequency (Fig.8B2). The two graphs representing the time course of the bursting frequency for one neuron (Fig. 8C) and for a group of four cells (Fig. 8D) show a typical biphasic response to anoxia without a cessation of rhythmic activity. The bursting activity persisted after returning to normoxic conditions, as illustrated on Figure 8A (right panel).
Fig. 8.

Anoxic response of isolated pacemaker inspiratory neurons. A, Simultaneous recording of integrated population activity from the PBC (top trace) and an inspiratory pacemaker neuron (bottom trace) during anoxia in the presence of CNQX (20 μm) obtained from a P10 animal. The top gray bar represents the time of the anoxic exposure. The right part of the recording illustrates the bursting activity 10 min after a return to normoxic conditions. B, Samples from A presented in an extended time scale and representing control conditions at time 20 sec (1), anoxic augmentation at time 90 sec (2), and the depression period at time 150 sec (3). C, Instantaneous inspiratory frequency plotted against time. Time 0 was set at the onset of the anoxic exposure. D, Mean plot of the instantaneous inspiratory frequency versus time obtained from four neurons (filled squares). The mean plot obtained from seven neurons in an intact network has been added in this graph for comparison (open circles). Note that these pacemaker neurons remained rhythmically active for a longer time than the network. Data were obtained from 7- to 13-d-old animals.
Anoxia induced also no significant change in the membrane potential of these four pacemaker neurons. Membrane potential values were −60 ± 3.9 mV during control conditions, −56.5 ± 2.6 mV during the maximal augmentation (p > 0.05), and −59 ± 3.4 mV during the maximal depression (p > 0.05). The burst duration was not significantly altered from 0.49 ± 0.06 sec under control conditions to 0.44 ± 0.04 sec during the maximal augmentation (p > 0.05) and to 0.37 ± 0.05 sec during the maximal depression (p > 0.05). The intraburst AP frequency remained constant during the augmentation phase (from 28 ± 2.9 Hz in control conditions to 26.4 ± 1.9 Hz during the maximal augmentation; p > 0.05) and during the maximal depression (to 34.7 ± 2.4 Hz; p > 0.05). Measurements were obtained for six consecutive bursts in control conditions, maximal augmentation, and maximal depression.
DISCUSSION
This study intended to identify the neurons responsible for the generation of the increased respiratory frequency in anoxia. Therefore, we compared the anoxic effects on different types of respiratory neurons: expiratory, inspiratory non-pacemaker, and inspiratory pacemaker. Expiratory neurons were slightly depolarized during anoxia and became tonically active during augmentation. This suggests that expiratory neurons are not responsible for generating the increased respiratory frequency. This is consistent with previous in vitro studies, which have demonstrated that anoxia suppresses synaptic inhibition in expiratory neurons (Ballanyi et al., 1994;Ramirez et al., 1998).
In contrast to the expiratory neurons, rhythmic activity persisted in inspiratory neurons during the augmentation phase. During this time their bursting frequency was increased, which is also consistent with previous in vitro experiments (Ramirez et al., 1998). Here we showed that most inspiratory non-pacemaker neurons cannot contribute to this frequency increase. In the absence of rhythmic population activity, the non-pacemaker neurons ceased to discharge rhythmically, they were not depolarized, and the tonic activity present in the absence of network activity did not increase during the augmentation phase.
Only a few neurons remained rhythmically active in the absence of network activity. These neurons are referred to as pacemaker neurons. The increase in bursting frequency exhibited by these pacemaker neurons resembled the frequency increase as observed in the intact network. Therefore we conclude that the anoxia-induced increase in respiratory activity is caused by a direct modulation of pacemaker activity. This will drive the remaining respiratory network at a higher frequency. To our knowledge, this is the first demonstration that anoxic effects on the respiratory frequency are mediated by pacemaker inspiratory neurons.
We found two types of pacemaker neurons: those that generated bursts of activity during the entire exposure to anoxia and those that lost their bursting activity during prolonged anoxia. It is known that the amplitude of some membrane conductances shows an irreversible rundown when the conventional patch-clamp technique is used. This raises the possibility that during prolonged anoxia the loss of bursting properties in one group of pacemaker neurons could be caused by an anoxia-induced washout of pacemaker properties. However, this is unlikely to be the case because pacemaker bursting properties recovered on return to normoxic conditions.
The role of synaptic inhibition in modulating the anoxic response of the respiratory system
As described previously in vivo (Richter et al., 1991;England et al., 1995; Schmidt et al., 1995) and in vitro(Ballanyi et al., 1994; Ramirez et al., 1998), synaptic inhibition is significantly suppressed during anoxia. This suppression was most evident in the pattern of expiratory neuronal activity. Because of the decline in synaptic inhibition, expiratory neurons became initially tonic and then inactive during anoxia. It is possible that expiratory neurons influence tonically the respiratory network and that a decreased tonic activation of these neurons could lead to the anoxic augmentation; however, there is no experimental evidence for this possibility. Furthermore, if these neurons provide an inhibitory input on the remainder of the respiratory network, other mechanisms have to be considered to explain the depression of respiratory activity during prolonged anoxia, because these neurons are inactive during this phase.
Although the suppression of expiratory activity may not be responsible for the generation of the increased respiratory frequency, it may be important for reconfiguring the respiratory network. During severe hypoxia, normal respiratory activity is transformed into gasping. This transformation is associated with a cessation of rhythmic expiratory activity (St. John, 1998) and a suppression of synaptic inhibition (Lieske et al., 2000).
Role of pacemaker activity in regulating the frequency of respiratory activity during anoxia
We have demonstrated that pacemaker neurons exhibited an increased bursting frequency in anoxia. The frequency changes observed in the pharmacologically isolated pacemaker neurons were qualitatively similar to those observed in the intact respiratory network. In contrast, non-pacemaker neurons exhibited no intrinsic excitation during anoxia. The absence of an anoxia-induced excitation is very interesting, because it indicates that anoxia could not cause an increased transmitter release from these neurons. It is therefore very unlikely that the non-pacemaker neurons could contribute to the increased frequency of the intact network. This leads to the conclusion that the anoxia-induced frequency modulation is entirely dependent on the anoxic modulation of pacemaker neurons. During anoxia, these pacemaker neurons would provide a faster rhythmic drive to the non-pacemaker neurons. Like the expiratory neurons, non-pacemaker neurons therefore may play no role in the frequency modulation but rather may play a role in the transformation of the respiratory motor pattern from normal respiration into gasping. It has been proposed that during normal respiration, concurrent inhibition and excitation in inspiratory neurons is responsible for the augmenting activity that characterizes eupneic inspiratory activity (Ramirez et al., 1997; Lieske et al., 2000). In severe anoxia, the suppression of inhibition in inspiratory neurons results in a decrementing activation, which is typical for gasping (Lieske et al., 2000).
Our findings therefore suggest that there is a strict separation into neurons associated with rhythm generation (pacemaker neurons) and those associated with pattern generation (expiratory and non-pacemaker inspiratory neurons). A further functional separation of the pattern-generating mechanisms seems to occur at the motor output. The anoxic augmentation is characterized by a dramatic increase in the amplitude of XII motor activity, which was not caused by an increased synaptic drive from the pre-Bötzinger complex (Telgkamp and Ramirez, 1999). Instead, the motor output was modulated by a mechanism that was functionally separate from the modulation of the frequency and shape of respiratory activity within the pre-Bötzinger complex. A separation into rhythm- and pattern-generating mechanisms has been proposed previously by Feldman and co-workers (1990). Our conclusions are also remarkably consistent with the model by Smith et al. (1995), who proposed that pacemaker neurons provide rhythmic drive to the remainder of the network, which is primarily responsible for the generation of the respiratory motor pattern.
Ionic mechanisms leading to the frequency modulation of pacemaker neurons
To understand the anoxic effect on the respiratory rhythm, it will be essential to investigate the conductances that characterize pacemaker activity in respiratory neurons. However, so far only one study has experimentally investigated the conductances underlying respiratory pacemaker activity (Thoby-Brisson et al., 2000). This study demonstrated that pacemaker inspiratory neurons express the hyperpolarization-activated current (Ih) and that this current plays a crucial role in determining their bursting frequency. It is well established that the Ih current is modulated by anoxia (Erdemli and Crunelli, 1998). Therefore, a modulation of this current may indeed play an important role in the anoxia-induced increase in the respiratory frequency. In fact, the absence of an increase in intraburst frequency during anoxia suggests that anoxia affects primarily the interval between two bursts. This interval is highly affected by the Ihcurrent; however, additional experiments will be necessary to examine whether this is the case.
Are the pacemaker neurons the chemosensors for oxygen?
Our data have demonstrated that in response to anoxia the bursting frequency of pacemaker neurons is altered in the absence of respiratory network activity. Although these neurons may well be the chemosensors of the respiratory network, the synaptic isolation does not provide sufficient evidence for this. It is conceivable that under these conditions anoxia still caused the release of neuromodulators, such as serotonin (Richter et al., 1999), adenosine (Schmidt et al., 1995), or substance P (Gray et al., 1999). These neuromodulators could then alter pacemaker activity even in the absence of respiratory network activity. The resulting mechanism may be complicated further, because these neuromodulators are not released simultaneously and therefore may modulate pacemaker activity in a differential and time-dependent manner (Richter et al., 1999). Thus, it is likely that the modulation of pacemaker activity is caused by a combination of direct and indirect anoxic effects. Examination of these possibilities will be an important next step in understanding the cellular mechanisms that lead to the frequency modulation during anoxia.
Footnotes
This study was supported by National Institutes of Health Grant HL60120 (J.M.R.).
Correspondence should be addressed to Dr. Jan-Marino Ramirez, Department of Organismal Biology and Anatomy, Committee on Neurobiology, The University of Chicago, 1027 East 57th Street, Chicago, IL 60637. E-mail:Jramire@midway.uchicago.edu.
REFERENCES
- 1.Ballanyi K, Völker A, Richter DW. Anoxia induced functional inactivation of neonatal respiratory neurons in vitro. NeuroReport. 1994;30:165–168. doi: 10.1097/00001756-199412300-00042. [DOI] [PubMed] [Google Scholar]
- 2.Bureau MA, Zinman R, Foulon P, Begin R. Diphasic ventilatory response to hypoxia in newborn lambs. J Appl Physiol. 1984;56:84–90. doi: 10.1152/jappl.1984.56.1.84. [DOI] [PubMed] [Google Scholar]
- 3.Butera RJ, Rinzel JJ, Smith JC. Model of respiratory rhythm generation in the pre-Bötzinger complex. I. Bursting pacemaker neurons. J Neurophysiol. 1999a;81:382–397. doi: 10.1152/jn.1999.82.1.382. [DOI] [PubMed] [Google Scholar]
- 4.Butera RJ, Rinzel JJ, Smith JC. Model of respiratory rhythm generation in the pre-Bötzinger complex. II. Population of coupled pacemaker neurons. J Neurophysiol. 1999b;81:398–415. doi: 10.1152/jn.1999.82.1.398. [DOI] [PubMed] [Google Scholar]
- 5.England SJ, Melton JE, Douse MA, Duffin J. Activity of respiratory neurons during hypoxia in the chemodenervated cat. J Appl Physiol. 1995;78:856–861. doi: 10.1152/jappl.1995.78.3.856. [DOI] [PubMed] [Google Scholar]
- 6.Erdemli G, Crunelli V. Response of thalamocortical neurons to hypoxia: a whole-cell patch-clamp study. J Neurosci. 1998;18:5212–5224. doi: 10.1523/JNEUROSCI.18-14-05212.1998. [DOI] [PMC free article] [PubMed] [Google Scholar]
- 7.Feldman JL, Smith JC, Ellenberger HH, Connelly CA, Liu GS, Greer JJ, Lindsay AD, Otto MR. Neurogenesis of respiratory rhythm and pattern: emerging concepts. Am J Physiol. 1990;259:R879–886. doi: 10.1152/ajpregu.1990.259.5.R879. [DOI] [PubMed] [Google Scholar]
- 8.Gray PA, Rekling JC, Biocharro CM, Feldman JL. Modulation of respiratory frequency by peptidergic input to rhythmogenic neurons in the preBotzinger complex. Science. 1999;286:1566–1568. doi: 10.1126/science.286.5444.1566. [DOI] [PMC free article] [PubMed] [Google Scholar]
- 9.Haddad GG, Jiang C. O2-deprivation in the central nervous system: on mechanisms of neuronal response, differential sensitivity and injury. Prog Neurobiol. 1993;40:277–318. doi: 10.1016/0301-0082(93)90014-j. [DOI] [PubMed] [Google Scholar]
- 10.Johnson SM, Smith JC, Funk GD, Feldman JL. Pacemaker behavior of respiratory neurons in medullary slices from neonatal rat. J Neurophysiol. 1994;72:2598–2608. doi: 10.1152/jn.1994.72.6.2598. [DOI] [PubMed] [Google Scholar]
- 11.Koshiya N, Guyenet PG. Tonic sympathetic chemoreflex after blockade of respiratory rhythmogenesis in the rat. J Physiol (Lond) 1998;491:859–869. doi: 10.1113/jphysiol.1996.sp021263. [DOI] [PMC free article] [PubMed] [Google Scholar]
- 12.Koshiya N, Smith JC. Neuronal pacemaker for breathing visualized in vitro. Nature. 1999;400:360–363. doi: 10.1038/22540. [DOI] [PubMed] [Google Scholar]
- 13.Lawson EE, Long WA. Central origin of breathing pattern during hypoxia in newborns. J Appl Physiol. 1983;55:483–488. doi: 10.1152/jappl.1983.55.2.483. [DOI] [PubMed] [Google Scholar]
- 14.Lieske SP, Thoby-Brisson M, Telgkamp P, Ramirez JM. Reconfiguration of the neural network controlling multiple breathing patterns: eupnea, sighs and gasps. Nat Neurosci. 2000;3:600–607. doi: 10.1038/75776. [DOI] [PubMed] [Google Scholar]
- 15.Neher E. Correction for liquid junction potentials in patch clamp experiments. Methods Enzymol. 1992;207:123–131. doi: 10.1016/0076-6879(92)07008-c. [DOI] [PubMed] [Google Scholar]
- 16.Ramirez JM, Richter DW. The neuronal mechanisms of respiratory rhythm generation. Curr Opin Neurobiol. 1996;6:817–825. doi: 10.1016/s0959-4388(96)80033-x. [DOI] [PubMed] [Google Scholar]
- 17.Ramirez JM, Quellmalz UJA, Richter DW. Postnatal changes in the mammalian respiratory network as revealed by the transverse brainstem slice preparation of mice. J Physiol (Lond) 1996;491:799–812. doi: 10.1113/jphysiol.1996.sp021258. [DOI] [PMC free article] [PubMed] [Google Scholar]
- 18.Ramirez JM, Telgkamp P, Elsen FP, Quellmalz UJA, Richter DW. Respiratory rhythm generation in mammals: synaptic and membrane properties. Respir Physiol. 1997;110:71–85. doi: 10.1016/s0034-5687(97)00074-1. [DOI] [PubMed] [Google Scholar]
- 19.Ramirez JM, Quellmalz UJA, Wilken B, Richter DW. The hypoxic response of neurons within the in vitro mammalian respiratory network. J Physiol (Lond) 1998;507:571–582. doi: 10.1111/j.1469-7793.1998.571bt.x. [DOI] [PMC free article] [PubMed] [Google Scholar]
- 20.Rekling JC, Feldman JL. PreBötzinger complex and pacemaker neurons: hypothesized site and kernel for respiratory rhythm generation. Annu Rev Physiol. 1998;60:385–405. doi: 10.1146/annurev.physiol.60.1.385. [DOI] [PubMed] [Google Scholar]
- 21.Richter DW, Bischoff A, Anders K, Bellingham M, Windhorst U. Response of the medullary respiratory network of the cat to hypoxia. J Physiol (Lond) 1991;443:231–256. doi: 10.1113/jphysiol.1991.sp018832. [DOI] [PMC free article] [PubMed] [Google Scholar]
- 22.Richter DW, Schmidt-Garcon P, Pierrefiche O, Bischoff AM, Lalley PM. Neurotransmitters and neuromodulators controlling the hypoxic respiratory response in anaesthetized cats. J Physiol (Lond) 1999;514:567–578. doi: 10.1111/j.1469-7793.1999.567ae.x. [DOI] [PMC free article] [PubMed] [Google Scholar]
- 23.Schmidt C, Bellingham MC, Richter DW. Adenosinergic modulation of respiratory neurons and hypoxic responses in the anaesthetized cat. J Physiol (Lond) 1995;483:769–778. doi: 10.1113/jphysiol.1995.sp020621. [DOI] [PMC free article] [PubMed] [Google Scholar]
- 24.Schwarzacher SW, Smith JC, Richter DW. Pre-Bötzinger complex in the cat. J Neurophysiol. 1995;73:1452–1461. doi: 10.1152/jn.1995.73.4.1452. [DOI] [PubMed] [Google Scholar]
- 25.Shao XM, Feldman JL. Respiratory rhythm generation and synaptic inhibition of expiratory neurons in the preBotzinger complex: differential roles of glycinergic and GABAergic neural transmission. J Neurophysiol. 1997;77:1853–1860. doi: 10.1152/jn.1997.77.4.1853. [DOI] [PubMed] [Google Scholar]
- 26.Smith JC, Ellenberger HH, Ballanyi K, Richter DW, Feldman JL. Pre-Bötzinger complex: a brainstem region that may generate respiratory rhythm in mammals. Science. 1991;254:726–729. doi: 10.1126/science.1683005. [DOI] [PMC free article] [PubMed] [Google Scholar]
- 27.Smith JC, Funk GD, Johnson SM, Feldman JL. Cellular and synaptic mechanisms generating respiratory rhythm: insights from in vitro and computational studies. In: Trouth CO, Millis R, Kiwull-Schone H, Schlaefke M, editors. Ventral brainstem mechanisms and control of respiration and blood pressure. Marcel Dekker; New York: 1995. pp. 463–496. [Google Scholar]
- 28.St. John WM. Alterations in respiratory neuronal activities in the medullary “pre-Bötzinger” region in hypocapnia. Respir Physiol. 1998;114:119–131. doi: 10.1016/s0034-5687(98)00088-7. [DOI] [PubMed] [Google Scholar]
- 29.St. John WM, Bianchi AL. Responses of bulbospinal and laryngeal respiratory neurons to hypercapnia. J Appl Physiol. 1985;59:1201–1207. doi: 10.1152/jappl.1985.59.4.1201. [DOI] [PubMed] [Google Scholar]
- 30.St. John WM, Wang SC. Alteration from apneusis to more regular rhythmic respiration in decerebrate cats. Respir Physiol. 1977;31:91–106. doi: 10.1016/0034-5687(77)90068-8. [DOI] [PubMed] [Google Scholar]
- 31.Telgkamp P, Ramirez JM. Differential responses of respiratory nuclei to anoxia in rhythmic brainstem slices of mice. J Neurophysiol. 1999;82:2163–2170. doi: 10.1152/jn.1999.82.5.2163. [DOI] [PubMed] [Google Scholar]
- 32.Thoby-Brisson M, Telgkamp P, Ramirez JM. The role of the hyperpolarization-activated current in modulating rhythmic activity in the isolated respiratory network of mice. J Neurosci. 2000;20:2994–3005. doi: 10.1523/JNEUROSCI.20-08-02994.2000. [DOI] [PMC free article] [PubMed] [Google Scholar]