Abstract
Amyloid-β (Aβ) appears critical to Alzheimer's disease. To clarify possible mechanisms of Aβ action, we have quantified Aβ-induced gene expression in vitro by using Aβ-treated primary cortical neuronal cultures and in vivo by using mice transgenic for the Aβ precursor (AβP). Here, we report that aggregated, but not nonaggregated, Aβ increases the level of the mRNAs encoding tissue plasminogen activator (tPA) and urokinase-type plasminogen activator (uPA). Moreover, tPA and uPA were also upregulated in aged AβP overexpressing mice. Because others have reported that Aβ aggregates can substitute for fibrin aggregates in activating tPA post-translationally, the result of tPAinduction by Aβ would be cleavage of plasminogen to the active protease plasmin. To gain insights into the possible actions of plasmin, we evaluated the hypotheses that tPA and plasmin may mediate Aβ in vitro toxicity or, alternatively, that plasmin activation may lead to Aβ degradation. In evaluating these conflicting hypotheses, we found that purified plasmin degrades Aβ with physiologically relevant efficiency, i.e., ∼1/10th the rate of plasmin on fibrin. Mass spectral analyses show that plasmin cleaves Aβ at multiple sites. Electron microscopy confirms indirect assays suggesting that plasmin degrades Aβ fibrils. Moreover, exogenously added plasmin blocks Aβ neurotoxicity. In summation, we interpret these results as consistent with the possibility that the plasmin pathway is induced by aggregated Aβ, which can lead to Aβ degradation and inhibition of Aβ actions.
Keywords: amyloid, plasmin, tissue plasminogen activator, apoptosis, gene induction, Alzheimer's disease, proteolysis
Neocortical Aβ deposits are a hallmark of Alzheimer's disease (AD). That Aβ accumulation is critical to AD is suggested by findings that mutations in several genes associated with familial AD (FAD) increase amyloidogenic Aβ production (for review, see Selkoe, 1997; Price and Sisodia, 1998). In sporadic AD, increased Aβ may result from enhanced Aβ production, which has been the subject of intense scrutiny, or from decreased Aβ clearance, which has been studied relatively little.
Although the plasmin proteolytic cascade is traditionally considered in terms of fibrinolysis and cell migration, the plasmin system may also be relevant to Aβ clearance. The principal components of this system include plasminogen/plasmin, tissue plasminogen activator (tPA), urokinase-type plasminogen activator (uPA), plasminogen activator inhibitor (PAI-1), and α-2-antiplasmin (α2-AP) (for review, seeHenkin et al., 1991; Reuning et al., 1998). This proteolytic cascade begins with localized synthesis and secretion of tPA and uPA. After post-translational activation, tPA and uPA cleave plasminogen to yield the active serine protease plasmin, which then proteolyzes its target proteins. The activity of plasminogen activators and plasmin is kept highly localized by their primary inhibitors, PAI-1 and α2-AP, respectively. In fibrinolysis, tPA binds to fibrin aggregates, leading to a conformational change in tPA that dramatically increases its affinity for plasminogen, resulting in proteolytic cleavage of plasminogen to active plasmin. Recent work has shown that Aβ aggregates can substitute for fibrin aggregates in activating tPA (Kingston et al., 1995; Wnendt et al., 1997), suggesting that tPA may be activated by Aβ in AD.
The role of the plasmin system in neuronal death is under intense scrutiny. In the brain, tPA, uPA, and plasminogen are synthesized in neurons, and tPA is synthesized by microglia as well (Tsirka et al., 1997). In ischemia and excitotoxicity models, tPA induction and subsequent plasmin generation have been implicated in neuronal loss (Chen and Strickland, 1997; Tsirka et al., 1997; Wang et al., 1998). This neuronal loss may be induced by extracellular matrix degradation because plasmin may degrade laminin directly or indirectly by activation of extracellular metalloproteases (Lijnen et al., 1998). Indeed, matrix degradation has been implicated in apoptosis in vitro (Basbaum and Werb, 1996) and stroke (Romanic et al., 1998). However, the neurotoxic role of the plasmin system has been challenged by reports that direct tPA infusion does not cause neuronal loss (Tsirka et al., 1996) and, moreover, that tPA may be directly neuroprotective in excitotoxicity models both in vitro andin vivo (Kim et al., 1999).
Here, we evaluate the role of the plasmin system in the cellular response to Aβ. We report that Aβ accumulation inducestPA and uPA expression in vitro andin vivo. Whether the product of tPA action, plasmin, is neurotoxic by degrading neuronal extracellular proteins, or neuroprotective by degrading Aβ, was evaluated by quantifying plasmin-mediated Aβ degradation and modulation of Aβ neurotoxicity. Our results indicate that plasmin degrades Aβ and blocks Aβ toxicity. We discuss the potential physiological and therapeutic implications of these results.
MATERIALS AND METHODS
Primary rat cortical neuron preparations. Primary rat cortical neuron cultures were established from embryonic day 18 (E18) rat fetuses as described previously (Estus et al., 1997). Briefly, cell suspensions were plated at 0.75–1.25 × 10⁵ cells per polyethyleneimine-coated 6.4 mm well in 100 μl of DMEM/B27 (Life Technologies, Rockville, MD) supplemented with 100 U/ml penicillin, 100 μg/ml streptomycin, and B27 (Life Technologies). Cells were plated onto either 96 well microtiter plates or 16 well chamber slides (Nalge Nunc International, Rochester, NY). Serum replacement with B27 supplement yields nearly pure neuronal cultures as judged by immunocytochemistry for glial fibrillary acidic protein (GFAP) and neuron-specific enolase (NSE) (Brewer et al., 1993).
Neuronal treatments. Neuronal preparations were treated with Aβ1–40 in the presence or absence of plasmin as indicated. For experiments involving aggregated Aβ, stock Aβ solutions (lot number ZK840; Bachem, Torrance, CA; or lot number MF-0641; California Peptide Research, Napa, CA) (1 mm) were prepared in sterile, double-distilled water and frozen at −80°C until use. For experiments comparing aggregated and nonaggregated Aβ treatments, Aβ1–40 (lot number ZM605; Bachem) was either prepared as above (aggregated) or dissolved to 7.5 mm in dimethylsulfoxide (DMSO), sonicated for 30 min in a bath sonicator, and filtered through a 3 mm Teflon membrane filter (pore size, 0.2 μm) (nonaggregated). Purified human plasmin (American Diagnostica, Greenwich, CT) was dissolved in 100 mm Tris, pH 7.4, 0.1% Tween 20, 0.1 mm EDTA, and 20% glycerol to generate stock solutions. These were then aliquoted and stored at −80°C until use. After initially observing lot-to-lot variation in the plasmin-specific activity, all plasmin was subsequently normalized to the manufacturer's indicated plasmin specific activity, i.e., because 20 μg of active plasmin should generate a colorimetric change of 0.2 AU/min in a standard reaction containing 0.1 mmSpectrozyme-PL, we used plasmin protein sufficient to generate this amount of Spectrozyme-PL conversion, and considered this equivalent to 20 μg of active plasmin.
Rat cortical neurons cultured 2 d in vitro were exposed to Aβ by removing the culture medium and replacing it with DMEM supplemented with 100 U/ml penicillin, 100 μg/ml streptomycin, and N2 medium supplement (Life Technologies). Aβ and plasmin, alone or in the indicated combinations, was then added to the indicated final concentrations. Experiments involving plasmin pretreatment were initiated on neurons after 1 d in vitro. For experiments involving DMSO solvated, nonaggregated Aβ, possible solvent-confounding effects were minimized by adding an equal volume of DMSO to control and aggregated Aβ-treated wells such that the final DMSO concentrations were equivalent in all samples.
Neurotoxicity assays. After the indicated treatments, neuronal cultures were maintained for 48 hr before neuronal survival was assessed by scoring for chromatin condensation by an observer “blinded” as to the cellular treatments. Briefly, neurons were fixed with 4% paraformaldehyde, rinsed with PBS, stained with Hoechst 33258 at 1 μg/ml in PBS for 10 min, and chromatin then visualized by fluorescence microscopy. Neurons manifesting condensed chromatin were scored as “apoptotic” whereas those with uniformly distributed chromatin were scored as “normal”. At least 250 neurons were scored in each well of 16 well chamber slides, and experiments were typically performed in triplicate. Where indicated, statistical analysis was performed in consultation with the Sanders-Brown Center on Aging Biostatistics Core; a mixed linear model was used with random effects caused by replicates, replicates by treatment combination, and individual treatments. Post hoc analysis was by Fisher's PLSD procedure on least squares means produced by the mixed linear model to account for incomplete blocks and on Satterthwaite's procedure for estimating the degrees of freedom. Computations were done by using the Statistical Analysis System (Littell et al., 1996).
Chromatin fragmentation was assessed by using a fluorescent DNA end-labeling technique, i.e., terminal deoxynucleotidyl transferase-mediated biotinylated UTP nick end labeling (TUNEL), as described previously (Estus et al., 1997).
Murine model of Aβ accumulation. Three mice transgenic for the human Aβ precursor protein (AβP) (Hsiao et al., 1996) and three strain-matched (C57B6/SJL) control mice were maintained for equivalent periods, i.e., 22 ± 2 months (mean ± SD). After euthanasia, their brains were rapidly removed and flash-frozen in liquid nitrogen.
Gene expression assays. For the analyses of gene expressionin vitro, total RNA was purified and reverse-transcribed as described previously (Estus et al., 1997). For the analyses of gene expression in vivo, total RNA was isolated from one cortical hemisphere (Chomczynski and Sacchi, 1987), and 1 μg aliquots were subjected to reverse transcription. Gene expression was analyzed by using PCR to incorporate radioactive tracer into cDNA corresponding to specific mRNAs, as described and validated previously (Estus, 1997;Estus et al., 1997). After amplification, the cDNAs were separated by PAGE and visualized and quantified by phosphorimaging technology (Fuji, Stamford, CT). Differences between mouse brain samples were analyzed by a Student's t test (StatView; Abacus Concepts, Calabasas, CA).
The primer sequences used in this study were either reported previously (Estus et al., 1997) or were: tPA sense primer: 5′ GGGCTCTGACTTCGTSTGCC 3′, tPA antisense primer: 5′ CCTTGCACTGTAGGGCTTCTA 3′ (185 bp product); uPA sense primer: 5′ CTCTTACCGAGGAAAGGCCA 3′, uPA antisense primer: 5′ TGTCGGGGTTCCTGCAGTAA 3′(151 bp product);timp1 sense primer: 5′ GAAATCATCGAGACCACCTT 3′,timp1 antisense primer: 5′ AACCGGATATCTGTGGCATT 3′ (97 bp product); timp2 sense primer: 5′ CCCTGTGACACGCTTAGCAT 3′,timp2 antisense primer: 5′ TGGTGCCCATTGATGCTCTT 3′ (166 bp product); timp3A sense primer: 5′ GCCTCAAGCTAGAAGTCAA 3′, and timp3A antisense primer: 5′ TGTGAGGTGGTCCCACCTCT 3′ (109 bp product). The identity of the amplified cDNAs was confirmed by direct sequencing.
Immunofluorescence. The integrity of the neuronal cytoskeleton was visualized by anti-neurofilament immunofluorescence. Neurons were treated as indicated, fixed with 4% paraformaldehyde, and permeabilized with 0.05% Triton X-100 in PBS. Nonspecific antibody binding was then blocked with 5% goat serum in PBS, and neurofilaments labeled with a cocktail of anti-neurofilament L, M, and H monoclonal antibodies (purchased individually from Sigma, St. Louis, MO) diluted in blocking buffer (1/250). Primary antibodies were then visualized with a Cy3-conjugated secondary antibody (Jackson ImmunoResearch, West Grove, PA). After counterstaining with Hoechst 33258, cells were examined by fluorescence microscopy.
Analysis of Aβ degradation. To assay Aβ proteolysis, solutions of Aβ and plasmin, prepared as described above, were incubated at 37°C in a 25 μl reaction volume containing 100 mm Tris, pH 7.4, 0.1% Tween 20, and 0.1 mmEDTA, as we described previously for other plasmin substrates (Tucker et al., 1995). At the end of the incubation, the reaction was stopped by the addition of 25 μl of 0.1% trifluoroacetic acid (TFA) and frozen on dry ice. Intact Aβ was then detected and quantified by HPLC methodology. Briefly, 25 μl aliquots of the stopped reaction volumes were loaded onto a C18 reverse-phase HPLC column (Vydac, Hisperia, CA) in 2% acetonitrile, 0.1% TFA, and eluted with an acetonitrile gradient (2–55% over 30 min). Peptides were detected and quantified by absorbance at 215 nm. Kinetics were analyzed as we described previously (Vijayaragahaven et al., 1995); Kcat values were determined from the time required for plasmin to reduce Aβ levels by 50%. The identity of the Aβ degradation fragments was determined by using matrix-assisted laser desorption ionization time-of-flight mass spectrometry (Ciphergen Biosystems, Palo Alto, CA) to analyze HPLC-purified Aβ fragments.
Electron microscopy. Aβ-containing solutions (100 μm) were allowed to aggregate for 6 hr at 37°C and then analyzed directly or treated with plasmin (70 nm) for 6 hr, as described above. For electron microscopy, 0.5 μl of Aβ-containing solution was applied to a formvar–carbon-coated copper grid, allowed to dry, and stained with 2% uranyl acetate. The aggregates were then visualized on a Zeiss 902 electron microscope at 80 kV. Similar results were obtained when samples were fixed with a 1% glutaraldehyde and 4% paraformaldehyde mixture before application to the grid. Magnification was determined by reference to a standard calibration grid (Ted Pella, Redding, CA) that was imaged and photographed in parallel with the Aβ samples.
RESULTS
Aggregated but not nonaggregated Aβ induces tPA, uPA,and timp1 in vitro
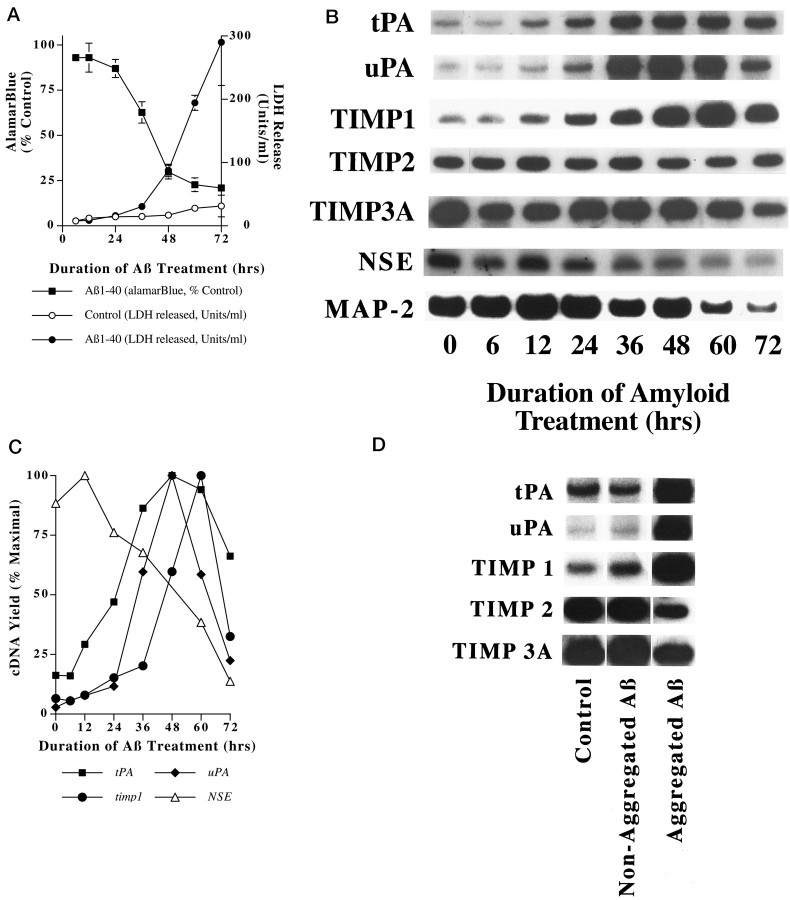
To begin to evaluate the hypothesis that Aβ-induced gene expression may modulate the extracellular proteolytic milieu, we quantified Aβ effects on the expression of several relevant genes. Aβ effects were analyzed in an in vitro model of Aβ neurotoxicity described previously (Estus et al., 1997). In this model, primary cortical neurons treated with Aβ (20 μm) begin to undergo apoptosis after 36 hr of treatment (Fig. 1A). Previously, we and others reported that Aβ markedly induces the mRNA encoding the extracellular matrix protease transin (MMP-9) (Deb and Gottschall, 1996; Estus et al., 1997), and others reported that Aβ induces MMP-2 as well (Deb and Gottschall, 1996).
Fig. 1.
Selective gene induction accompanies Aβ toxicity. Rat cortical neurons were treated with Aβ1–40 (20 μm, lot number ZK840) for the indicated intervals, and cell viability was assayed by AlamarBlue reduction and LDH release (A, reprinted with permission from Estus et al., 1997).tPA, uPA, and timp1 are induced by Aβ treatment (B). RNA was isolated from neurons treated in parallel with those depicted in A, and changes in gene expression were analyzed by RT-PCR. Results from this representative experiment are depicted graphically (C). These gene inductions occur only in cultures treated with aggregated Aβ (D). Each of these experiments were confirmed in at least two separate neuronal preparations.
Because Aβ treatment leads to c-jun induction beginning at 12 hr (Estus et al., 1997), and tPA is known to be induced by c-Jun (Arts et al., 1997), we began by quantifying Aβ effects ontPA and the related uPA. To evaluate the balance in the extracellular proteolytic milieu, we also quantified three mRNAs that encode tissue inhibitors of matrix proteases (TIMP), includingtimp1, timp2, and timp3a. RNA was prepared from cells treated in parallel with those described in Figure1A and changes in gene expression quantified by RT-PCR (Fig. 1B,C). As we described previously (Estus et al., 1997), Aβ treatment causes a generalized decrease in mRNAs unique to neurons, including NSE and map-2. In contrast to these declining patterns of expression, Aβ-treatment induced tPA, beginning with 12 hr of treatment, as well asuPA and timp1, beginning at 36 and 48 hr, respectively (Fig. 1B,C). As neuronal membrane integrity was breached, especially at 72 hr, each of the mRNAs declined. tPA was induced roughly concurrent withc-jun, whereas uPA and timp1 were induced well after c-jun (Estus et al., 1997), consistent with the possibility that c- Jun may contribute to their induction. In contrast to the robust upregulation of tPA,uPA, and timp1, the mRNAs encoding TIMP2 and TIMP3A were unchanged by Aβ treatment, suggesting a degree of specificity in these gene inductions.
Because Aβ neurotoxicity depends on the ability of Aβ to aggregate (Pike et al., 1991; Simmons et al., 1994; Estus et al., 1997), we next compared the abilities of aggregated and nonaggregated Aβ to regulate gene expression. Aβ was solvated in either water (to promote subsequent aggregation) or DMSO (to inhibit subsequent aggregation), and then diluted into medium and used to treat cells. DMSO was added to the water-solvated Aβ such that the final DMSO concentration was equivalent between the two Aβ treatments. After 48 hr of treatment, the water-solvated Aβ had induced a dramatic decrease in cellular viability, as assessed by AlamarBlue reducing potential, which declined to 15.4 ± 1.0% of vehicle-treated control neuronal preparations (mean ± SD; n = 3). In contrast, DMSO-solvated Aβ did not alter AlamarBlue reduction significantly from vehicle-treated controls (99.7 ± 2.9% of control; mean ± SD; n = 3; Estus et al., 1997). Examination of gene expression in neurons treated in parallel showed that aggregated, but not nonaggregated, Aβ treatment led to the induction of tPA, uPA, and timp1 (Fig. 1D). In summary,tPA, uPA and timp1 were induced by Aβ in a time- and aggregation-dependent fashion.
Aβ accumulation correlates with tPA and uPA inductionin vivo
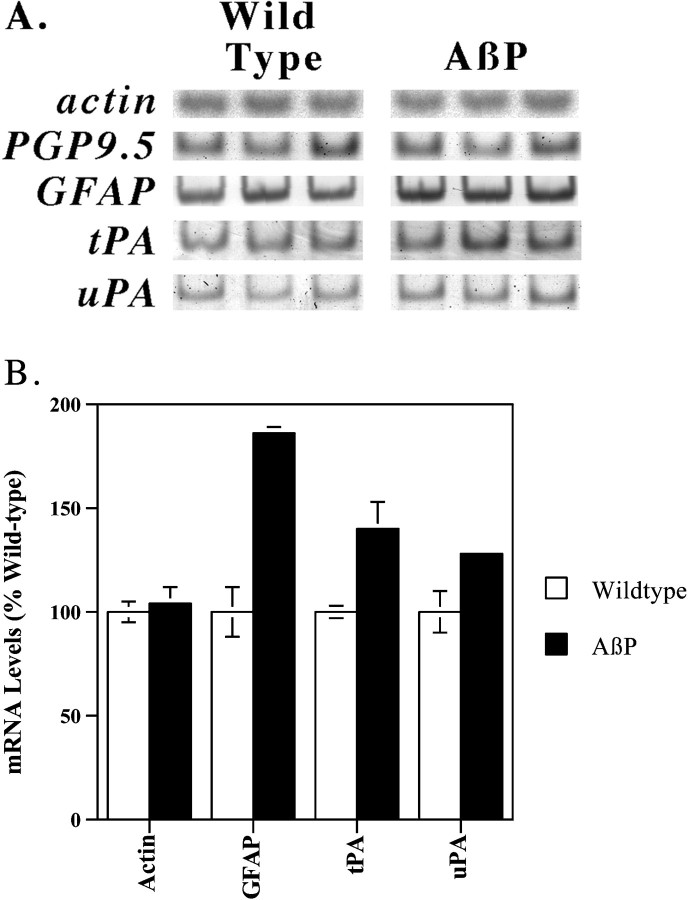
To evaluate whether the plasmin system may also be activated by Aβ accumulation in vivo, we quantified the expression oftPA and uPA in mice transgenic for AβP expression (Hsiao et al., 1996). RNA was isolated from Aβ-overproducing mice or from congenic control mice of equivalent age. We first quantified the expression of actin andpgp9.5, which are expressed constitutively by all cells and by neurons, respectively (Fig.2A). The expression of these genes was equivalent among the various samples. We next quantified the expression of GFAP, an mRNA upregulated in reactive astrocytes described in these mice (Hsiao et al., 1996). The mRNA encoding GFAP was increased nearly twofold in the Aβ producing mice (Fig. 2A,B; p < 0.005; Student's t test). We then quantified the expression of the mRNAs encoding tPA and uPA. Each of these mRNAs was also increased significantly in the Aβ-overproducing mice (Fig.2A,B; p < 0.04). Hence, Aβ accumulation in vivo is also associated with increasedtPA and uPA expression.
Fig. 2.
tPA and uPA are induced by Aβ accumulation in vivo. Aged mice transgenic for AβP expression or matched control mice were killed, and their brains were analyzed for altered gene expression by RT-PCR. The results are presented both as autoradiographs (A) and, for selected genes, graphically (mean ± SE, n = 3) (B). Equivalent results were obtained in two separate PCR analyses of these samples.
Plasmin efficiently degrades Aβ
Because the active protease plasmin results from Aβ-inducingtPA expression as well as activating tPA post-translationally (Kingston et al., 1995; Wnendt et al., 1997), and because plasmin is known to degrade another aggregated protein and tPA cofactor, fibrin (Henkin et al., 1991), we hypothesized that plasmin may degrade Aβ. Therefore, we established an assay for Aβ clearance wherein the ability of purified human plasmin to degrade Aβ1–40 was monitored by using reverse-phase HPLC to separate Aβ fragments, which were then detected by UV absorbance. Figure3 shows chromatograms reflecting freshly solvated Aβ (40 μm) that was incubated 30 min in the absence (Fig. 3A) or presence of plasmin (70 nm; Fig. 3B). Plasmin cleaves Aβ, as discerned by the disappearance of Aβ and the appearance of eight new peaks (plasmin is not detectable at these concentrations, and elutes after Aβ when added in excess). The identity of these peaks was determined by mass spectral analysis (Table1); each fragment is consistent with the known specificity of plasmin to cleave after the basic amino acids lysine or arginine. These results confirm and dramatically extend those of others (Van Nostrand and Porter, 1999), who reported quite recently that plasmin degrades Aβ largely at position five, i.e., the predominant fragment was DAEFR. The more complete Aβ degradation that we report here may reflect that we standardized the purified plasmin relative to a synthetic colorimetric plasmin substrate, and hence may have used a higher level of active plasmin than others (Van Nostrand and Porter, 1999).
Fig. 3.
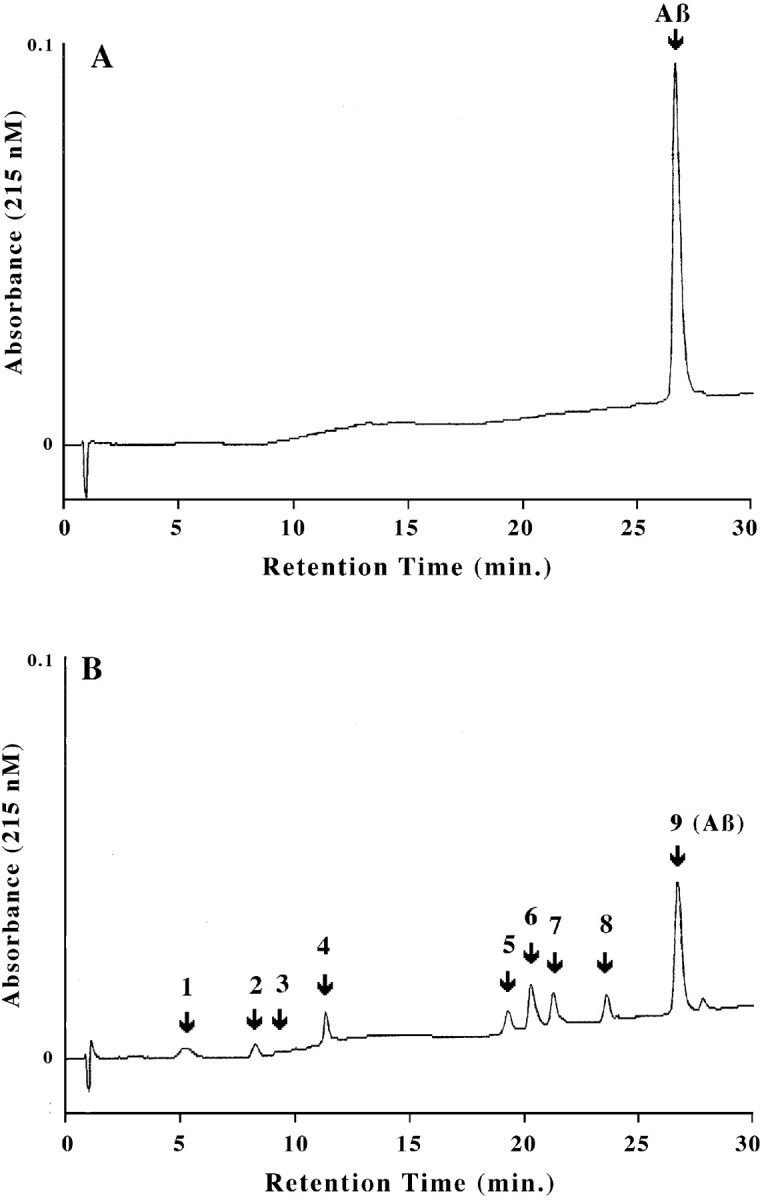
Plasmin proteolyzes Aβ into multiple fragments. These HPLC chromatograms depict Aβ (40 μm) treated without (A) or with (B) plasmin (70 nm) for 30 min at 37°C. After the reaction was stopped, the proteins were separated by C18 reverse-phase HPLC, and Aβ fragments were detected by their absorbance at 215 nm.
Table 1.
The identity of Aβ fragments depicted in Figure 3
| Peak # | Cleavage product (inbold) |
|---|---|
| 1 | DAEFRHDSGYEVHHQKLVFFAEDVGSNKGAIIGLMVGGVV |
| 2 | DAEFRHDSGYEVHHQKLVFFAEDVGSNKGAIIGLMVGGVV |
| 3 | DAEFRHDSGYEVHHQKLVFFAEDVGSNKGAIIGLMVGGVV |
| 4 | DAEFRHDSGYEVHHQKLVFFAEDVGSNKGAIIGLMVGGVV |
| 5 | DAEFRHDSGYEVHHQKLVFFAEDVGSNKGAIIGLMVGGVV (deaminated E) |
| 6 | DAEFRHDSGYEVHHQKLVFFAEDVGSNKGAIIGLMVGGVV |
| 7 | DAEFRHDSGYEVHHQKLVFFAEDVGSNKGAIIGLMVGGVV |
| 8 | DAEFRHDSGYEVHHQKLVFFAEDVGSNKGAIIGLMVGGVV |
| 9 | DAEFRHDSGYEVHHQKLVFFAEDVGSNKGAIIGLMVGGVV |
The identity of each fragment was determined by mass spectral analysis. The identity of each peak is consistent with the known specificity of plasmin to cleave after basic amino acids. After plasmin digestion, peak 9 actually contained a trace of Aβ6-40 along with Aβ1-40; in experiments wherein this mixture was resolved by using an exceedingly shallow acetonitrile gradient in the HPLC, the proportion of Aβ6-40 present in this peak was <1% after 5, 10, 15, or 20 min of reaction time (data not shown).
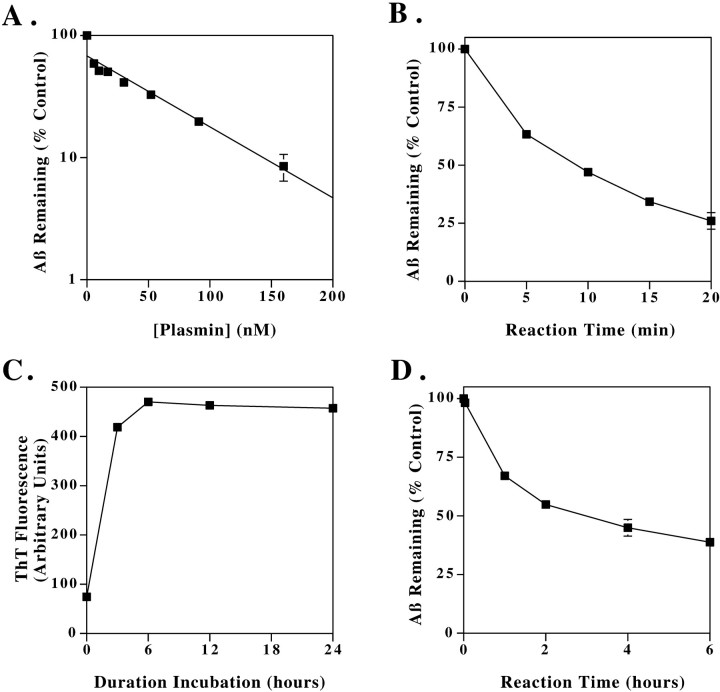
We next examined the plasmin concentration dependence of Aβ cleavage. Aβ (40 μm) was incubated with increasing concentrations of plasmin (0–160 nm) for 30 min, and the amount of remaining Aβ1–40 was quantified. These data, shown in Figure4A, indicate that plasmin degrades Aβ in a concentration-dependent manner. Although plasminogen is synthesized constitutively in CNS neurons (Tsirka et al., 1997), CSF concentrations of plasminogen have not been reported. However, these plasmin concentrations used here are much less than the reported serum plasminogen concentration of 2 μm (Kwaan, 1992).
Fig. 4.
Kinetics of Aβ degradation by plasmin. Plasmin concentration dependence of Aβ cleavage (A). Aβ (40 μm) was incubated with plasmin at the indicated concentrations for 30 min, and the amount of remaining Aβ1–40 was quantified by HPLC. The data represent the mean ± range of two separate experiments. Time dependence of plasmin cleavage of Aβ (B). Aβ1–40 (40 μm) and plasmin (70 nm) were incubated for the indicated times, and the remaining intact Aβ1–40 was quantified. The data represent the mean ± SE, n = 4. Time course of Aβ aggregation (C). Aβ solutions (100 μm) were incubated at 37°C for the indicated times, and changes in aggregation were assessed simultaneously by ThT fluorescence. Time dependence of plasmin degradation of aggregated Aβ (D). After aggregating for 6 hr at 100 μm, Aβ was diluted to 40 μm and incubated in the absence or presence of 70 nm plasmin for up to 6 hr. The quantity of intact Aβ remaining was then quantified by HPLC. These data represent the mean ± SE of three independent experiments.
We proceeded to examine the time course of Aβ clearance by plasmin (Fig. 4B). Aβ1–40 (40 μm) and plasmin (70 nm) were incubated together for the indicated times, and the remaining intact Aβ1–40 was quantified. Under these conditions, Aβ was 75% cleared within 20 min. From these experiments, we calculated an apparent Kcat of plasmin for nonaggregated Aβ of 0.48/sec, i.e., one molecule of plasmin cleaves 0.48 molecule of nonaggregated Aβ per second. This calculation assumes that the Aβ concentration is sufficiently above theKm so that plasmin is functioning at or near Vmax; this is likely because the Km of plasmin for fibrin is 6 μm, and the Aβ is present in a 550-fold excess relative to plasmin. By comparison, the Kcat of nonaggregated fibrin cleavage by plasmin is 7/sec (Kastrikina et al., 1986).
Because Aβ aggregates accumulate in AD, and because the natural plasmin substrate is aggregated fibrin, we next examined the ability of plasmin to cleave aggregated Aβ. Aβ was allowed to aggregate by incubating an Aβ solution (100 μm) at 37°C for 6 hr. thioflavin T (ThT) assays demonstrate that 6 hr is sufficient for maximal aggregation of this Aβ lot with these conditions (Fig.4C). The Aβ was then diluted to 40 μm and incubated in the absence or presence of 0.8 μm plasmin for up to 6 hr. The quantity of intact Aβ remaining was then quantified by HPLC (Fig.4D). Aggregated Aβ was cleared at a much slower rate than nonaggregated Aβ, reaching ∼60% clearance after 6 hr of reaction time. From these experiments, we calculated an apparent Kcat of plasmin for aggregated Aβ of 0.003/sec. In comparison, plasmin cleaves aggregated fibrin with a Kcat of 0.064/sec (Kastrikina et al., 1986). Hence, the rate of aggregated Aβ cleavage is ∼1/20th the rate of cleavage of aggregated fibrin. Interestingly, substrate aggregation reduces the kcat of plasmin ∼100-fold for both fibrin and Aβ.
To gain an understanding of the actions of plasmin on Aβ aggregates at the ultrastructural level, we performed electron microscopy on aggregated Aβ before and after plasmin treatment (Fig.5). Before plasmin treatment, the predominant Aβ aggregate was a fibril with an approximate diameter of 10 nm, consistent with previous reports regarding synthetic Aβ fibrils in vitro as well as Aβ fibrils in AD (Roher et al., 1986; Kirschner et al., 1987); very occasional polymers of Aβ with a diameter of 100 nm were found as well (data not shown), which have also been reported previously in vitro (Stine et al., 1996). After plasmin treatment, although occasional 100 nm fibrils were still present, the predominant 10 nm fibrils were much reduced and were replaced with an amorphous deposit that likely reflects dried down Aβ fragments (Fig. 5B). Hence, plasmin treatment appears capable of degrading a class of Aβ fibrils corresponding to the most common fibrils.
Fig. 5.
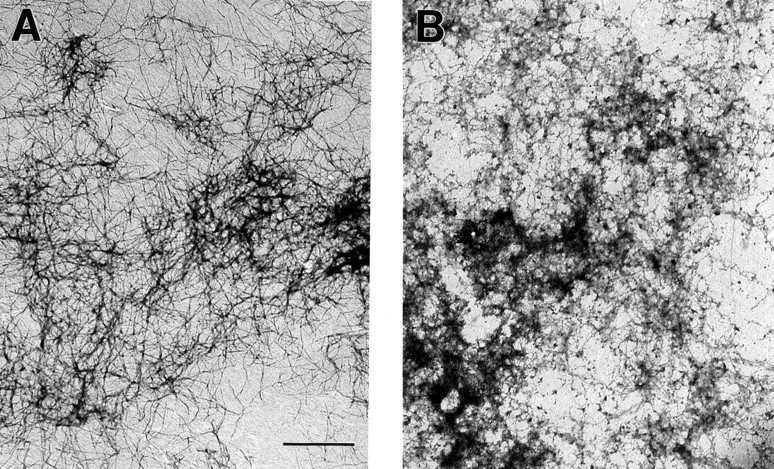
Electron microscopy reveals that plasmin clears 10 nm diameter Aβ fibrils. Before plasmin treatment, the vast majority of Aβ fibrils had a diameter of ∼10 nm (A). After plasmin treatment, these fibrils were largely replaced by amorphous deposits that likely reflected dried down Aβ fragments (B). These results were replicated in two separate Aβ preparations. Scale bar, 1 μm.
The plasmin system and Aβ neurotoxicity
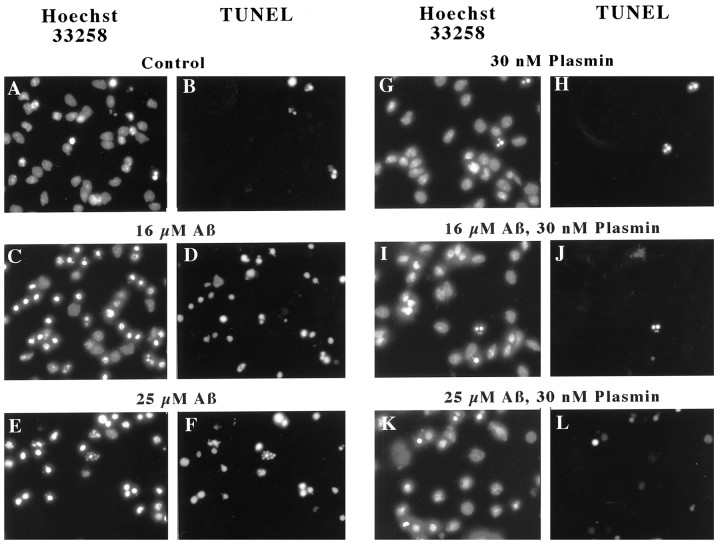
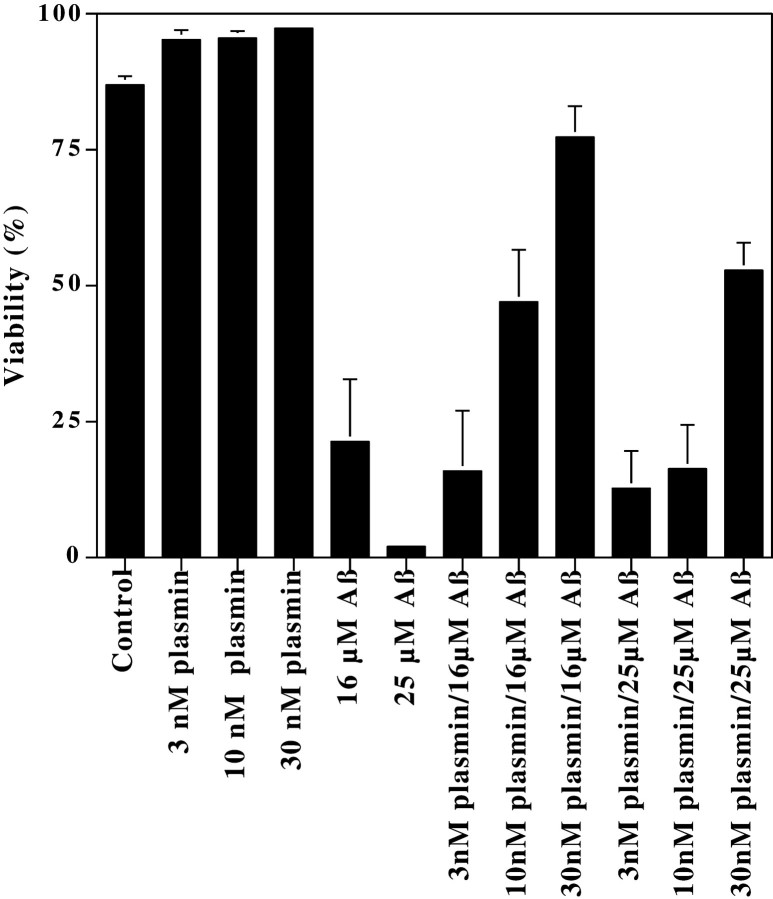
Plasmin generated from enhanced tPA activity could contribute to Aβ neurotoxicity by attacking cell surface proteins, in a manner analogous to how plasmin has been suggested to contribute to neuronal loss in ischemia or excitotoxicity (Chen and Strickland, 1997; Tsirka et al., 1997). Alternatively, because plasmin degrades Aβ, plasmin may block Aβ toxicity. We evaluated these conflicting hypotheses by comparing Aβ toxicity in the presence and absence of plasmin. Briefly, rat cortical neurons were treated with (1) plasmin at concentrations as high as 30 nm, (2) Aβ at concentrations that induce moderate (16 μm) or high (25 μm) levels of toxicity, or (3) both plasmin and Aβ. Forty-eight hours later, the neurons were fixed, and subjected to Hoechst 33258 staining to detect chromatin condensation (Fig.6A,C,E,G,I,K) and DNA endlabeling to detect chromatin fragmentation (Fig.6B,D,F,H,J,L). These fluorescent micrographs depict representative images of neurons treated with Aβ (16 or 25 μm) and/or the highest concentration of plasmin (30 nm). Inspection of these images shows that Aβ treatment induced frequent chromatin condensation and DNA fragmentation (Fig. 6C–F). Plasmin treatment alone (Fig. 6G,H) was indistinguishable from control cultures (Fig. 6A,B). When neurons were exposed to Aβ and plasmin, they closely resembled the control cultures (Fig.6I–L), in sharp contrast to the effects of Aβ alone. When the frequency of neurons manifesting chromatin condensation was quantified by an observer “blinded” as to cell treatment, plasmin was markedly neuroprotective (Fig.7). This protection was robust and dependent on the plasmin concentration (Fig. 7). Hence, at plasmin concentrations that are capable of degrading Aβ and effectively blocking Aβ toxicity, plasmin shows no overt neurotoxicity. We interpret these results as suggesting that plasmin does not contribute to Aβ toxicity but rather may contribute to Aβ degradation.
Fig. 6.
Plasmin effects on Aβ-induced chromatin condensation and fragmentation. Rat cortical neurons were treated with the indicated concentrations of Aβ for 48 hr in the presence or absence of plasmin (30 nm). Aβ induced chromatin condensation (Hoechst 33258 staining) and DNA fragmentation (TUNEL staining). These effects were largely reduced in cultures treated with plasmin and Aβ. These results are representative of those obtained in at least six separate neuronal preparations.
Fig. 7.
Plasmin protects neurons from Aβ toxicity. Neurons were treated with Aβ, plasmin, or the indicated combinations of Aβ and plasmin for 48 hr. The cultures were then fixed and analyzed for the frequency of apoptosis by an observer “blinded” as to cell treatment. There is a clear trend for the concentration-dependent ability of plasmin to protect neurons from Aβ toxicity. These protective effects reached statistical significance (p < 0.05) for the 16 μm Aβ samples treated with 10 and 30 nm plasmin and for the 25 μm Aβ samples treated with 30 nm plasmin. At least 250 neurons were scored for each treatment. These results represent the mean ± SE of at least four separate Aβ treatments.
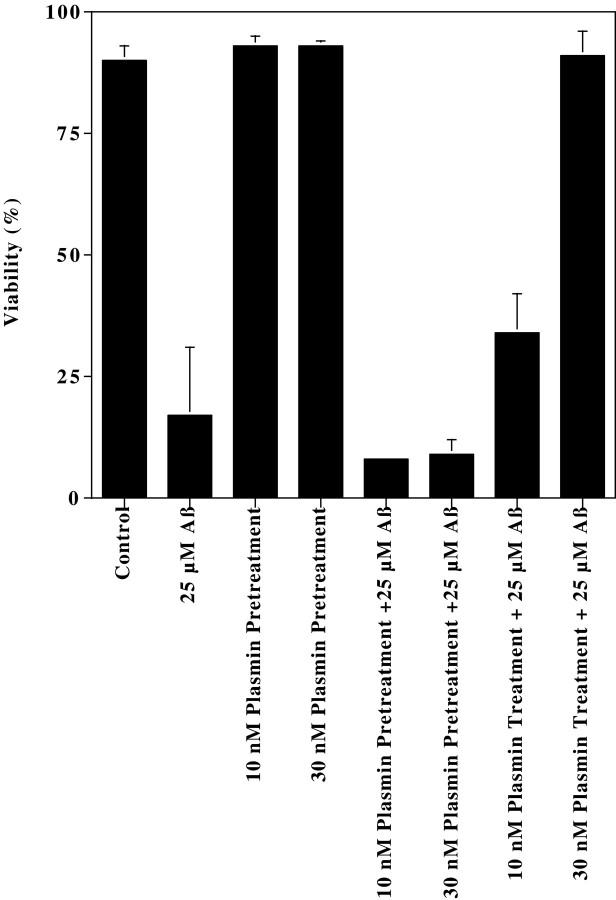
An alternative interpretation of the plasmin neuroprotection is that plasmin acts by removing cell surface receptor proteins suggested to mediate Aβ toxicity, e.g., RAGE (Yan et al., 1996). If this were the case, we hypothesized that treating with plasmin before Aβ would be at least partially protective. To address this possibility, we compared the neuroprotective effects of plasmin when neurons were pretreated with plasmin for 18 hr before Aβ treatment versus neurons treated with plasmin concurrent with Aβ. As observed previously, 25 μm Aβ caused a marked decline in viability, and concurrent plasmin treatment provided concentration-dependent protection (Fig. 8). In contrast, plasmin treatment before Aβ afforded no protection. We interpret this observation as supporting the possibility that the neuroprotective effects of plasmin are likely attributable to direct Aβ degradation.
Fig. 8.
Treating neurons with plasmin before Aβ does not protect neurons from Aβ toxicity. The frequency of apoptosis in neurons treated with plasmin before or during Aβ treatment was quantified. These results represent the mean ± range of two separate neuronal preparations.
To evaluate whether the protective effects of plasmin extended to the cytoskeleton, neurons were treated with plasmin, Aβ, or the combination of plasmin and Aβ, and cytoskeletal integrity assessed by neurofilament immunofluorescence (Fig.9B,D,F,H); chromatin was stained in parallel with Hoechst 33258 (Fig. 9A,C,E,G). Inspection of these images reveals that Aβ treatment largely ablated neurofilament staining (Fig. 9C,D) relative to control cultures (Fig. 9A,B). Plasmin treatment alone (Fig.9E,F) was indistinguishable from control cultures. The neurofilament network of neurons exposed to Aβ and plasmin was markedly protected from Aβ toxicity (Fig. 9G,H), closely resembling control cultures. Hence, these results suggest that plasmin has little discernable effect on the cytoskeleton itself and, moreover, maintains cytoskeletal integrity in the presence of Aβ.
Fig. 9.
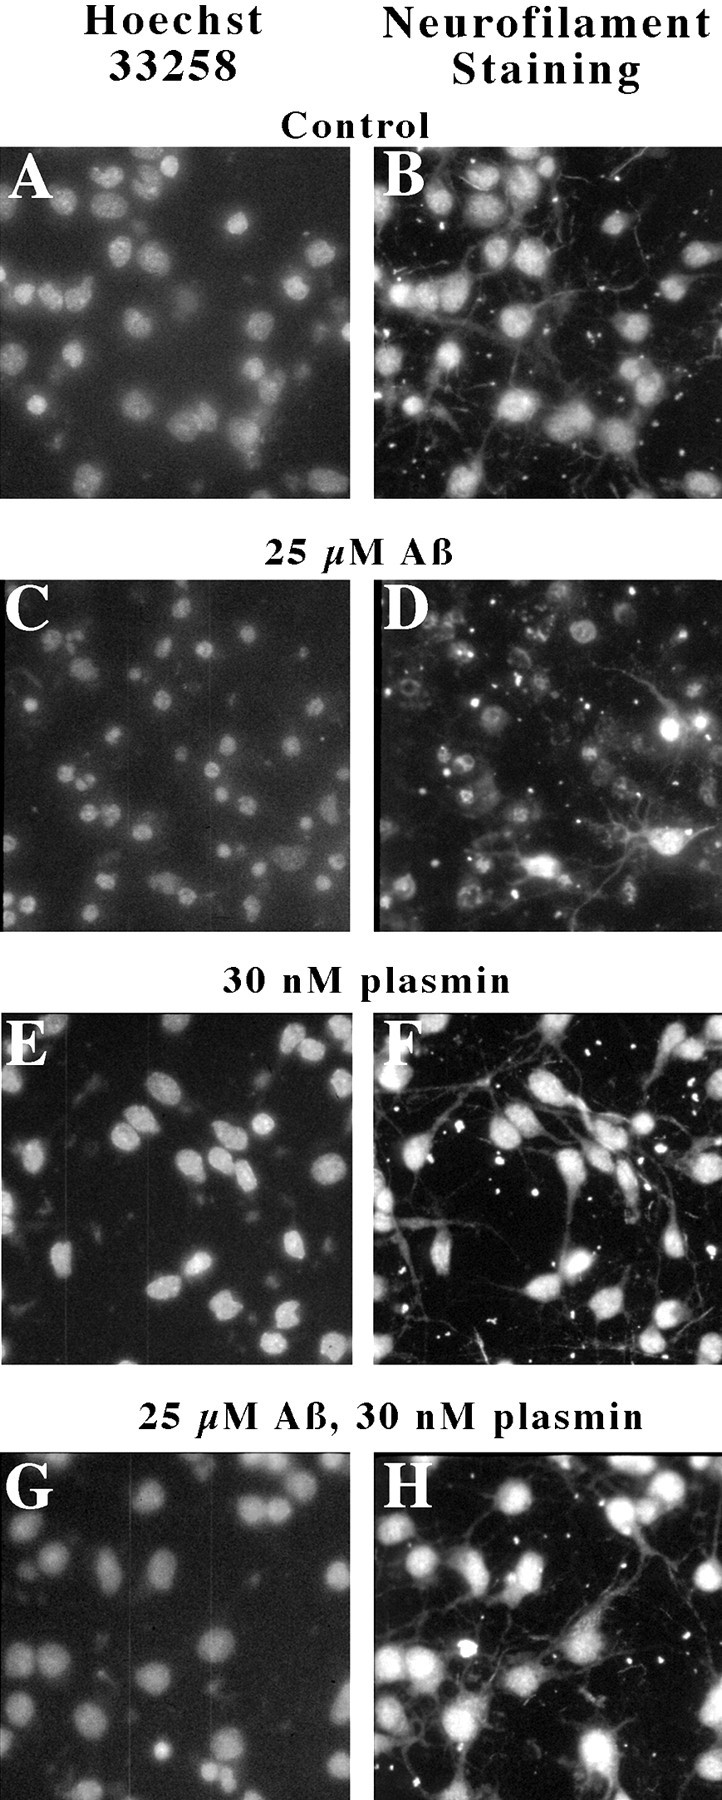
Plasmin treatment maintains neuronal cytoskeleton. Neurons were treated with plasmin, Aβ, or the combination of plasmin and Aβ as indicated, and cytoskeletal integrity was assessed by neurofilament immunofluorescence; chromatin was stained in parallel with Hoechst 33258. Similar results were obtained in two separate experiments.
DISCUSSION
The primary findings reported here are threefold. First, Aβ leads to the induction of tPA and uPA in vitro and in vivo. Second, plasmin degrades nonaggregated Aβ as well as Aβ fibrils at rates that are comparable to the rates of plasmin toward its physiological substrate, fibrin. Third, plasmin is effective at blocking Aβ toxicity in vitro while manifesting little direct neurotoxicity. Hence, these results indicate that Aβ accumulation leads to the activation of the plasmin system. In this model, plasmin activation results not in neurotoxicity but rather in protection from Aβ, apparently via Aβ degradation. Although formal evaluation of this scenario awaits the maturation of mice transgenic for AβP and wild-type or deficient in tPA, the results presented here are remarkable in that they describe the induction of the plasmin protease system by Aβ and describe plasmin as the first physiological protease capable of degrading Aβ aggregates.
Two primary mechanisms of Aβ clearance have been studied, including receptor-mediated cellular internalization and extracellular proteolysis. In sharp contrast to the attention directed at elucidating the pathways of Aβ generation (for review, see Selkoe, 1997; Price and Sisodia, 1998), the pathways responsible for Aβ clearance have received little study until recently. Receptor-mediated cellular internalization has received much interest, because in vitrostudies have found that Aβ may be cleared as a result of its association with either apolipoprotein E or with α-2-macroglobulin (A2M) followed by internalization of the complex via low-density lipoprotein receptor-related protein (LRP) (Narita et al., 1997;Hughes et al., 1998). Alternatively, Aβ may be cleared directly via the scavenger receptor (Paresce et al., 1996). That at least the former pathway may be physiologically significant is supported by recent studies implicating A2M and LRP in FAD (Kang et al., 1997; Blacker et al., 1998). Interestingly, because tPA has also been shown to bind to A2M and subsequently be internalized as a complex via LRP (Bu et al., 1992), genetic studies linking A2M and LRP with AD may be relevant to the plasmin proteolytic cascade as well.
The second proposed mechanism of Aβ clearance is extracellular proteolysis by resident proteases. Screens for proteases capable of degrading Aβ have identified a metalloprotease secreted by macrophages (Qiu et al., 1996, 1997) and an unknown serine protease (Mentlein et al., 1998). These proteases were apparently incapable of degrading Aβ aggregates (Qiu et al., 1996, 1997; Mentlein et al., 1998). These screens likely did not identify the plasmin system because the plasminogen and tPA concentrations in the conditioned medium were insufficient for the necessary bimolecular reaction between tPA and plasminogen. Van Nostrand and Porter (1999) recently reported that plasmin cleaves Aβ between amino acids 5 and 6, but did not report the further Aβ degradation described here or that plasmin degrades Aβ fibrils with physiological efficiency. Indeed, the only protease previously reported as capable of degrading Aβ fibrils is the bacterial protease mixture pronase, which was described as capable of degrading nonaggregated Aβ, aggregated Aβ, and, more slowly, Aβ purified from plaque cores (Tennent et al., 1995). Hence, the identification of plasmin here as a physiologically relevant protease capable of degrading Aβ aggregates is highly significant.
The results presented and discussed here suggest a possible model for the actions of the plasmin system relative to Aβ, i.e., Aβ aggregates lead to the activation of a proteolytic cascade that degrades Aβ. More specifically, we propose that Aβ accumulation upregulates the expression of tPA, and that Aβ then serves as an activating cofactor for tPA (Kingston et al., 1995; Wnendt et al., 1997) to produce a localized conversion of plasminogen to the active protease, plasmin. Plasmin then cleaves Aβ with physiological efficiency, protecting neurons from any deleterious actions of Aβ in the process. Interestingly, PAI-1, the principal physiological inhibitor of tPA, as well as the less prominent PAI-2, are both increased during inflammation (Henkin et al., 1991) and have both been reported to be increased in AD (Akiyama et al., 1993; Sutton et al., 1994). Hence, we interpret these results as suggesting a feedforward model in AD in which inflammation increases the expression of the plasminogen activator inhibitors, which in turn inhibit tPA, thereby reducing plasmin activity, and allowing Aβ levels to increase, which may then fuel further inflammation. In ongoing experiments, we are performing a critical test of this hypothesis, i.e., quantifying Aβ levels in mice overexpressing Aβ and lacking tPA. Hence, the work presented here, in conjunction with that previously in the literature, supports a “testable” hypothesis that the plasmin system regulates Aβ levels.
Mice with deficiencies in the plasmin system have been used to assess the role of the plasmin system in the CNS. Mice deficient in tPA, uPA, or PAI-1 develop with only modest deficits, whereas mice deficient in plasminogen develop and reproduce normally but suffer from thrombotic emboli and typically die by 6 months of age (for review, see Carmeliet et al., 1995). Although such mice have been used to implicate the plasminogen system as contributing to neuronal loss in ischemia or excitoxicity models (Chen and Strickland, 1997; Tsirka et al., 1997;Wang et al., 1998), other reports have suggested that tPA may be either nontoxic or directly neuroprotective (Tsirka et al., 1996; Kim et al., 1999). Additional events may occur in ischemia or excitotoxicity that enhance susceptibility to plasmin-mediated neuronal loss. For example, plasmin activates extracellular matrix metalloproteases (Lijnen et al., 1998), and matrix degradation can modulate apoptosis (Basbaum and Werb, 1996; Romanic et al., 1998). Interestingly, we observe here that Aβ induces timp1 expression, which we speculate may minimize matrix degradation in response to Aβ.
In summary, we interpret the data presented here as supporting the hypothesis that the plasmin system may contribute to the regulation of Aβ levels and actions. One potential ramification of this work is that plasmin or a related recombinant protease might be used to clear amyloid deposits in vivo. That amyloid deposits may be cleared naturally in vivo is supported by observations that amyloid resulting from systemic amyloidoses regresses slowly if amyloid production is inhibited (Holmgren et al., 1993) and that pre-existing Aβ deposits can be reduced by subsequent “Aβ vaccination” in a mouse model of Aβ accumulation (Schenk et al., 1999). Hence, these results suggest that amyloid deposits may be amenable to clearance. If Aβ clearance proves to ameliorate AD, proteases such as the plasmin system described here may contribute to disease treatment.
Footnotes
This work was supported by grants from the American Health Assistance Foundation and National Institutes of Health Grant NS-35607 (S.E.), as well as the French Foundation for Alzheimer's Disease (H.M.T.). We thank Richard Kyruscio for statistical analysis and Pamela S. Keim for help with the mass spectral analysis of Aβ fragments. We also thank Steven Younkin for helpful discussion.
M.T., T.K., and S.E. conducted the studies using the AβP transgenic mice.
Correspondence should be addressed to Drs. H. Michael Tucker or Steven Estus, 800 South Limestone, Lexington, KY 40536-0230. E-mail:mtucker@pop.uky.edu or sestus@aging.coa.uky.edu.
REFERENCES
- 1.Akiyama H, Ikeda K, Kondo H, Kato M, McGeer PL. Microglia express the type 2 plasminogen activator inhibitor in the brain of control subjects and patients with Alzheimer's disease. Neurosci Lett. 1993;164:233–235. doi: 10.1016/0304-3940(93)90899-v. [DOI] [PubMed] [Google Scholar]
- 2.Arts J, Herr I, Lansink M, Angel P, Kooistra T. Cell-type specific DNA-protein interactions at the tissue-type plasminogen activator promoter in human endothelial and HeLa cells in vivo and in vitro. Nucleic Acids Res. 1997;25:311–317. doi: 10.1093/nar/25.2.311. [DOI] [PMC free article] [PubMed] [Google Scholar]
- 3.Basbaum CB, Werb Z. Focalized proteolysis: spatial and temporal regulation of extracellular matrix degradation at the cell surface. Curr Opin Cell Biol. 1996;8:731–738. doi: 10.1016/s0955-0674(96)80116-5. [DOI] [PubMed] [Google Scholar]
- 4.Blacker D, Wilcox MA, Laird NM, Rodes L, Horvath SM, Go RC, Perry R, Watson BJ, Bassett SS, McInnis MG, Albert MS, Hyman BT, Tanzi RE. Alpha-2 macroglobulin is genetically associated with Alzheimer disease. Nat Genet. 1998;19:357–360. doi: 10.1038/1243. [DOI] [PubMed] [Google Scholar]
- 5.Brewer GJ, Torricelli JR, Evege EK, Price PJ. Optimized survival of hippocampal neurons in B27-supplemented Neurobasal, a new serum-free medium combination. J Neurosci Res. 1993;35:567–576. doi: 10.1002/jnr.490350513. [DOI] [PubMed] [Google Scholar]
- 6.Bu G, Williams S, Strickland DK, Schwartz AL. Low density lipoprotein receptor-related protein/alpha 2-macroglobulin receptor is an hepatic receptor for tissue-type plasminogen activator. Proc Natl Acad Sci USA. 1992;89:7427–7431. doi: 10.1073/pnas.89.16.7427. [DOI] [PMC free article] [PubMed] [Google Scholar]
- 7.Carmeliet P, Bouche A, De Clercq C, Janssen S, Pollefeyt S, Wyns S, Mulligan RC, Collen D. Biological effects of disruption of the tissue-type plasminogen activator, urokinase-type plasminogen activator, and plasminogen activator inhibitor-1 genes in mice. Ann NY Acad Sci. 1995;748:367–381. doi: 10.1111/j.1749-6632.1994.tb17333.x. [DOI] [PubMed] [Google Scholar]
- 8.Chen ZL, Strickland S. Neuronal death in the hippocampus is promoted by plasmin-catalyzed degradation of laminin. Cell. 1997;91:917–925. doi: 10.1016/s0092-8674(00)80483-3. [DOI] [PubMed] [Google Scholar]
- 9.Chomczynski P, Sacchi N. Single-step method of RNA isolation by acid guanidinium thiocynate-phenol-chloroform extraction. Anal Biochem. 1987;162:156–159. doi: 10.1006/abio.1987.9999. [DOI] [PubMed] [Google Scholar]
- 10.Deb S, Gottschall PE. Increased production of matrix metalloproteinases in enriched astrocyte and mixed hippocampal cultures treated with beta-amyloid peptides. J Neurochem. 1996;66:1641–1647. doi: 10.1046/j.1471-4159.1996.66041641.x. [DOI] [PubMed] [Google Scholar]
- 11.Estus S. Optimization and validation of RT-PCR as a tool to analyze apoptotic gene expression. In: Poirier J, editor. NeuroMethods 29: apoptosis techniques and protocols. Humana; Totowa, NJ: 1997. pp. 67–84. [Google Scholar]
- 12.Estus S, Tucker HM, van Rooyen C, Wright S, Brigham E, Wogulis M, Rydel R. Aggregated amyloid-β protein induces cortical neuronal apoptosis and concomitant “apoptotic” pattern of gene induction. J Neurosci. 1997;17:7736–7745. doi: 10.1523/JNEUROSCI.17-20-07736.1997. [DOI] [PMC free article] [PubMed] [Google Scholar]
- 13.Henkin J, Marcotte P, Yang HC. The plasminogen-plasmin system. Prog Cardiovasc Dis. 1991;34:135–164. doi: 10.1016/0033-0620(91)90010-j. [DOI] [PubMed] [Google Scholar]
- 14.Holmgren G, Ericzon BG, Groth CG, Steen L, Suhr O, Andersen O, Wallin BG, Seymour A, Richardson S, Hawkins PN, Pepys MB. Clinical improvement and amyloid regression after liver transplantation in hereditary transthyretin amyloidosis. Lancet. 1993;341:1113–1116. doi: 10.1016/0140-6736(93)93127-m. [DOI] [PubMed] [Google Scholar]
- 15.Hsiao K, Chapman P, Nilsen S, Eckman C, Harigaya Y, Younkin S, Yang F, Cole G. Correlative memory deficits, Aβ elevation, and amyloid plaques in transgenic mice. Science. 1996;274:99–102. doi: 10.1126/science.274.5284.99. [DOI] [PubMed] [Google Scholar]
- 16.Hughes SR, Khorkova O, Goyal S, Knaeblein J, Heroux J, Riedel NG, Sahasrabudhe S. Alpha2-macroglobulin associates with beta-amyloid peptide and prevents fibril formation. Proc Natl Acad Sci USA. 1998;95:3275–3280. doi: 10.1073/pnas.95.6.3275. [DOI] [PMC free article] [PubMed] [Google Scholar]
- 17.Kang DE, Saitoh T, Chen X, Xia Y, Masliah E, Hansen LA, Thomas RG, Thal LJ, Katzman R. Genetic association of the low-density lipoprotein receptor-related protein gene (LRP), an apolipoprotein E receptor, with late-onset Alzheimer's disease. Neurology. 1997;49:56–61. doi: 10.1212/wnl.49.1.56. [DOI] [PubMed] [Google Scholar]
- 18.Kastrikina TF, Taran LD, Kudinov SA. Kinetic characteristics of fibrinogen and fibrin hydrolysis by plasmin 1 and 2 and miniplasmin. Thromb Res. 1986;41:681–688. doi: 10.1016/0049-3848(86)90365-8. [DOI] [PubMed] [Google Scholar]
- 19.Kim YH, Park JH, Hong SH, Koh JY. Nonproteolytic neuropro-tection by human recombinant tissue plasminogen activator. Science. 1999;284:647–650. doi: 10.1126/science.284.5414.647. [DOI] [PubMed] [Google Scholar]
- 20.Kingston IB, Castro MJ, Anderson S. In vitro stimulation of tissue-type plasminogen activator by Alzheimer amyloid beta-peptide analogues. Nat Med. 1995;1:138–142. doi: 10.1038/nm0295-138. [DOI] [PubMed] [Google Scholar]
- 21.Kirschner DA, Inouye H, Duffy LK, Sinclair A, Lind M, Selkoe DJ. Synthetic peptide homologous to beta protein from Alzheimer disease forms amyloid-like fibrils in vitro. Proc Natl Acad Sci USA. 1987;84:6953–6957. doi: 10.1073/pnas.84.19.6953. [DOI] [PMC free article] [PubMed] [Google Scholar]
- 22.Kwaan HC. The plasminogen-plasmin system in malignancy. Cancer Metastasis Rev. 1992;11:291–311. doi: 10.1007/BF01307184. [DOI] [PubMed] [Google Scholar]
- 23.Lijnen HR, Silence J, Lemmens G, Frederix L, Collen D. Regulation of gelatinase activity in mice with targeted inactivation of components of the plasminogen/plasmin system. Thromb Haemost. 1998;79:1171–1176. [PubMed] [Google Scholar]
- 24.Littell RC, Milliken GA, Stroup WW, Wolfsinger RD. SAS system for mixed models. SAS; Cary, NC: 1996. [Google Scholar]
- 25.Mentlein R, Ludwig R, Martensen I. Proteolytic degradation of Alzheimer's disease amyloid beta-peptide by a metalloproteinase from microglia cells. J Neurochem. 1998;70:721–726. doi: 10.1046/j.1471-4159.1998.70020721.x. [DOI] [PubMed] [Google Scholar]
- 26.Narita M, Holtzman DM, Schwartz AL, Bu G. Alpha2-macroglobulin complexes with and mediates the endocytosis of beta-amyloid peptide via cell surface low-density lipoprotein receptor-related protein. J Neurochem. 1997;69:1904–1911. doi: 10.1046/j.1471-4159.1997.69051904.x. [DOI] [PubMed] [Google Scholar]
- 27.Paresce DM, Ghosh RN, Maxfield FR. Microglial cells internalize aggregates of the Alzheimer's disease amyloid beta-protein via a scavenger receptor. Neuron. 1996;17:553–565. doi: 10.1016/s0896-6273(00)80187-7. [DOI] [PubMed] [Google Scholar]
- 28.Pike C, Walencewicz A, Glabe C, Cotman C. In vitro aging of β-amyloid protein causes peptide aggregation and neurotoxicity. Brain Res. 1991;563:311–314. doi: 10.1016/0006-8993(91)91553-d. [DOI] [PubMed] [Google Scholar]
- 29.Price DL, Sisodia SS. Mutant genes in familial Alzheimer's disease and transgenic models. Annu Rev Neurosci. 1998;21:479–505. doi: 10.1146/annurev.neuro.21.1.479. [DOI] [PubMed] [Google Scholar]
- 30.Qiu WQ, Borth W, Ye Z, Haass C, Teplow DB, Selkoe DJ. Degradation of amyloid beta-protein by a serine protease-alpha2-macroglobulin complex. J Biol Chem. 1996;271:8443–8451. doi: 10.1074/jbc.271.14.8443. [DOI] [PubMed] [Google Scholar]
- 31.Qiu WQ, Ye Z, Kholodenko D, Seubert P, Selkoe DJ. Degradation of amyloid beta-protein by a metalloprotease secreted by microglia and other neural and non-neural cells. J Biol Chem. 1997;272:6641–6646. doi: 10.1074/jbc.272.10.6641. [DOI] [PubMed] [Google Scholar]
- 32.Reuning U, Magdolen V, Wilhelm O, Fischer K, Lutz V, Graeff H, Schmitt M. Multifunctional potential of the plasminogen activation system in tumor invasion and metastasis [review]. Int J Oncol. 1998;13:893–906. doi: 10.3892/ijo.13.5.893. [DOI] [PubMed] [Google Scholar]
- 33.Roher A, Wolfe D, Palutke M, KuKuruga D. Purification, ultrastructure, and chemical analysis of Alzheimer disease amyloid plaque core protein. Proc Natl Acad Sci USA. 1986;83:2662–2666. doi: 10.1073/pnas.83.8.2662. [DOI] [PMC free article] [PubMed] [Google Scholar]
- 34.Romanic AM, White RF, Arleth AJ, Ohlstein EH, Barone FC. Matrix metalloproteinase expression increases after cerebral focal ischemia in rats: inhibition of matric metalloproteinase-9 reduces infarct size. Stroke. 1998;29:1020–1030. doi: 10.1161/01.str.29.5.1020. [DOI] [PubMed] [Google Scholar]
- 35.Schenk D, Barbour R, Dunn W, Gordon G, Grajeda H, Guido T, Hu K, Huang J, Johnson-Wood K, Khan K, Kholodenko D, Lee M, Liao Z, Lieberburg I, Motter R, Mutter L, Soriano F, Shopp G, Vasquez N, Vandevert C, Walker S, Wogulis M, Yednock T, Games D, Seubert P. Immunization with amyloid-beta attenuates Alzheimer-disease-like pathology in the PDAPP mouse. Nature. 1999;400:173–177. doi: 10.1038/22124. [DOI] [PubMed] [Google Scholar]
- 36.Selkoe DJ. Alzheimer's disease: genotypes, phenotype, and treatments. Science. 1997;275:630–631. doi: 10.1126/science.275.5300.630. [DOI] [PubMed] [Google Scholar]
- 37.Simmons LK, May PC, Tomaselli KJ, Rydel RE, Fuson KS, Brigham EF, Wright S, Lieberburg I, Becker GW, Brems DN. Secondary structure of amyloid beta peptide correlates with neurotoxic activity in vitro. Mol Pharmacol. 1994;45:373–379. [PubMed] [Google Scholar]
- 38.Stine WBJ, Snyder SW, Ladror US, Wade WS, Miller MF, Perun TJ, Holzman TF, Krafft GA. The nanometer-scale structure of amyloid-beta visualized by atomic force microscopy. J Protein Chem. 1996;15:193–203. doi: 10.1007/BF01887400. [DOI] [PubMed] [Google Scholar]
- 39.Sutton R, Keohane ME, VanderBerg SR, Gonias SL. Plasminogen activator inhibitor-1 in the cerebrospinal fluid as an index of neurological disease. Blood Coagul Fibrinolysis. 1994;5:167–171. doi: 10.1097/00001721-199404000-00002. [DOI] [PubMed] [Google Scholar]
- 40.Tennent GA, Lovat LB, Pepys MB. Serum amyloid P component prevents proteolysis of the amyloid fibrils of Alzheimer's disease and systemic amyloidosis. Proc Natl Acad Sci USA. 1995;92:4299–4303. doi: 10.1073/pnas.92.10.4299. [DOI] [PMC free article] [PubMed] [Google Scholar]
- 41.Tsirka SE, Rogove AD, Strickland S. Neuronal cell death and tPA. Nature. 1996;384:123–124. doi: 10.1038/384123b0. [DOI] [PubMed] [Google Scholar]
- 42.Tsirka SE, Rogove AD, Bugge TH, Degen JL, Strickland S. An extracellular proteolytic cascade promotes neuronal degeneration in the mouse hippocampus. J Neurosci. 1997;17:543–552. doi: 10.1523/JNEUROSCI.17-02-00543.1997. [DOI] [PMC free article] [PubMed] [Google Scholar]
- 43.Tucker HM, Mottonen J, Goldsmith EJ, Gerard RD. Engineering of plasminogen activator inhibitor-1 to reduce the rate of latency transition. Nat Struct Biol. 1995;2:442–445. doi: 10.1038/nsb0695-442. [DOI] [PubMed] [Google Scholar]
- 44.Van Nostrand WE, Porter M. Plasmin cleavage of the amyloid beta-protein: alteration of secondary structure and stimulation of tissue plasminogen activator activity. Biochemistry. 1999;38:11570–11576. doi: 10.1021/bi990610f. [DOI] [PubMed] [Google Scholar]
- 45.Vijayaragahaven J, Tucker M, Fehrentz JA, Isbell D, Hersh LB. Reaction of neprilysin (neutral endopeptidase) and thermolysin with cyclic peptides. Arch Biochem Biophys. 1995;322:405–409. doi: 10.1006/abbi.1995.1481. [DOI] [PubMed] [Google Scholar]
- 46.Wang YF, Tsirka SE, Strickland S, Stieg PE, Soriano SG, Lipton SA. Tissue plasminogen activator (tPA) increases neuronal damage after focal cerebral ischemia in wild-type and tPA-deficient mice. Nat Med. 1998;4:228–231. doi: 10.1038/nm0298-228. [DOI] [PubMed] [Google Scholar]
- 47.Wnendt S, Wetzels I, Gunzler WA. Amyloid beta peptides stimulate tissue-type plasminogen activator but not recombinant prourokinase. Thromb Res. 1997;85:217–224. doi: 10.1016/s0049-3848(97)00006-6. [DOI] [PubMed] [Google Scholar]
- 48.Yan SD, Chen X, Fu J, Chen M, Zhu H, Roher A, Slattery T, Zhao L, Nagashima M, Morser J, Migheli A, Nawroth P, Stern D, Schmidt AM. RAGE and amyloid-beta peptide neurotoxicity in Alzheimer's disease. Nature. 1996;382:685–691. doi: 10.1038/382685a0. [DOI] [PubMed] [Google Scholar]


