Abstract
The cellular mechanisms of spike-frequency adaptation during prolonged discharges and of the slow afterhyperpolarization (AHP) that follows, as occur in vivo with contrast adaptation, were investigated with intracellular recordings of cortical neurons in slices of ferret primary visual cortex. Intracellular injection of 2 Hz sinusoidal or constant currents for 20 sec resulted in a slow (τ = 1–10 sec) spike-frequency adaptation, the degree of which varied widely among neurons. Reducing either [Ca2+]o or [Na+]o reduced the rate of spike-frequency adaptation. After the prolonged discharge was a slow (12–75 sec) AHP that was associated with an increase in membrane conductance and a rightward shift in the discharge frequency versus injected current relationship. The reversal potential of the slow AHP was sensitive to changes in [K+]o, indicating that it was mediated by a K+ current. Blockade of transmembrane Ca2+ conductances did not reduce the slow AHP. In contrast, reductions of [Na+]o reduced the slow AHP, even in the presence of pronounced Ca2+ spikes. We suggest that the activation of Na+-activated and Ca2+-activated K+ currents plays an important role in prolonged spike-frequency adaptation and therefore may contribute to contrast adaptation and other forms of adaptation in the visual system in vivo.
Keywords: plasticity, vision, K+ currents, pyramidal cell, receptive field, dynamics
Adaptation, the property of reduced neuronal activity in response to repetitive or constant stimulation, is a common feature of sensory responses. In the visual system, exposure to a high-contrast stimulus results in adaptation on both the psychophysical (Blakemore and Campbell, 1969; Lorenceau, 1987) and neurophysiological levels, a phenomenon that has a large cortical component. It is characterized by a progressive decrease of neuronal responses over seconds to the high-contrast stimulus and a reduced response to low-contrast stimuli that requires tens of seconds to recover (Maffei et al., 1973; Movshon and Lennie, 1979; Dean, 1983;Albrecht et al., 1984; Ohzawa et al., 1985; Saul and Cynader, 1989;Sclar et al., 1989; Bonds, 1991; Allison et al., 1993) (see companion paper, introductory remarks).
Recent intracellular recordings of cat primary visual cortical neuronsin vivo reveal that adaptation to a high-contrast stimulus is associated with a hyperpolarization (Carandini and Ferster, 1997) that is proportional to the reduction of firing rate (Sanchez-Vives et al., 2000), suggesting that intrinsic neuronal properties may contribute to contrast adaptation. Indeed, the induction of firing by intracellular current injection results in a long-lasting hyperpolarization and a decrease in the response to visual stimuli, mimicking the adaptation induced by high-contrast visual stimuli. Reciprocally, high-contrast visual stimulation leads to a decrease in neuronal responsiveness to the intracellular injection of current (Sanchez-Vives et al., 2000).
What might be the mechanisms underlying the generation of such a hyperpolarization in cortical neurons? Previous investigations of cortical pyramidal cells have implicated Ca2+ and/or voltage-sensitive K+ currents such asIM andIAHP in spike-frequency adaptation and hyperpolarization lasting from tens of milliseconds to seconds (Madison and Nicoll, 1984; Pennefather et al., 1985; Constanti and Sim, 1987;Schwindt et al., 1988, 1989, 1992, 1997; Avoli and Olivier, 1989;Storm, 1993; Sah, 1996; Ahmed et al., 1998). In addition, after prolonged current injections (seconds or longer), long-lasting decreases in neuronal responsiveness and hyperpolarization have been attributed to the activation of a Na+-activated K+ current (Foehring et al., 1989;Schwindt et al., 1989; Kubota and Saito, 1991; Safronov and Vogel, 1996; Kim and McCormick, 1998), or the activation of electrogenic ionic pumps, such as the Na+/K+ ATPase (Gustafsson and Wigström, 1983; Thompson and Prince, 1986; Inoue and Matsui, 1990).
In the present study, we examined in visual cortical neurons maintainedin vitro the presence, properties, and mechanisms for spike-frequency adaptation and for generation of prolonged hyperpolarizations in response to neuronal activation similar to that generated during typical visual adaptation protocols in vivo. Our results show that the activation of Ca2+, and particularly Na+,activated-K+ currents may be essential to contrast adaptation in vivo.
A preliminary report of these results was presented in abstract form (Sanchez-Vives et al., 1997).
MATERIALS AND METHODS
Ferrets were cared for and used in accordance with all appropriate regulatory guidelines. For the preparation of slices, 2- to 4-month-old ferrets of either sex were deeply anesthetized with sodium pentobarbital (40 mg/kg) and killed by decapitation. The forebrain was rapidly removed, and the hemispheres were separated with a midline incision. Four hundred-micrometer-thick coronal slices of the primary visual cortex were cut on a vibratome (DSK Microslicer; Ted Pella, Redding, CA). A modification of the technique developed by Aghajanian and Rasmussen (1989) was used to increase tissue viability: during preparation of slices, the tissue was placed in a solution in which NaCl was replaced with sucrose while maintaining an osmolarity of 307 mOsm. After preparation, slices were placed in an interface-style recording chamber (Fine Sciences Tools, Foster City, CA). Cortical slices were superfused for the first 10 min with an equal mixture in volume of the normal bathing medium and the sucrose-substituted solution. After this, normal bathing medium was switched into the chamber throughout the experiment. Bath temperature was maintained at 34–35°C.
Intracellular recordings were initiated after 2 hr of recovery. The normal bathing medium contained (in mm): NaCl, 124; KCl, 2.5; MgSO4, 2; NaHPO4, 1.25; CaCl2, 2; NaHCO3, 26; and dextrose, 10, and was aerated with 95% O2, 5% CO2 to a final pH of 7.4. In experiments that required reduction of [Na+]o, all or part of NaCl was replaced with choline-Cl in equimolar concentrations. When NaCl was replaced with choline-Cl, [NaHCO3]o was not changed, giving a solution containing at least 26 mm[Na+]o. Block of transmembrane Ca2+ currents was achieved by replacing CaCl2 with either MnCl2 or CoCl2, and sodium phosphate was omitted from the bathing medium to avoid precipitation.
Sharp intracellular recording electrodes were formed on a Sutter Instruments (Novato, CA) P-80 micropipette puller from medium-walled glass (1BF100; World Precision Instruments, Sarasota, FL) and beveled on a Sutter Instruments beveller to final resistances of 50–100 MΩ. Micropipettes were filled with either 2 m KAc and, in some cases, 2% biocytin was added for intracellular labeling of recorded neurons. Biocytin-filled neurons were visualized through standard avidin–biotin–horseradish peroxidase reaction with diaminobenzidine (Horikawa and Armstrong, 1988).
Drugs were obtained from Research Biochemicals (Natick, MA) or Sigma (St. Louis, MO) and were applied either in the bath or locally via pressure ejection from a micropipette (1–4 μm tip diameter) after being dissolved in the bathing solution. After the micropipette was positioned in proximity to a target cell in the slice, a brief pulse of pressure (10–250 msec; 200–350 kPa) was applied to the back of the microelectrode to extrude 1–20 pl of solution per pulse.
Sinusoidal current injection was used to induce spikes (except when mentioned). To mimic simple cell activation by sinusoidal drifting gratings that we used in the accompanying in vivoinvestigation (Sanchez-Vives et al., 2000), a low-high-low intensity pattern of current was used. The duration of high-intensity current injection was always of 20 sec and the frequency of 2 Hz. The low-intensity sinusoidal current injection was replaced by negative or positive square pulses of 120–300 msec to determine changes in input resistance or changes in firing frequency after the high-current intensity injection. The response of cortical neurons to sinusoidal current injection was quantified as spikes per cycle or per second using Spike-2 software (Cambridge Electronic Design, Cambridge, UK).
Ionic currents underlying the afterhyperpolarization (AHP) and afterdepolarization (ADP) were examined with the hybrid current–voltage-clamp protocol in which the cell was induced to discharge prolonged trains of action potentials by intracellular injection of current in the current-clamp recording mode. After current injection, the recording was switched to the voltage-clamp mode and held at various membrane potentials. Voltage clamp was achieved with an Axoclamp-2B amplifier (Axon Instruments, Foster City, CA) through the use of discontinuous single electrode voltage-clamp protocols in which the gain was 0.5–2.5 nA/mV and the switching frequency was 2–4 kHz. The output of the headstage was continuously monitored to insure adequate settling in between the current injection portions of the duty cycle. Data are reported as mean ± SD.
RESULTS
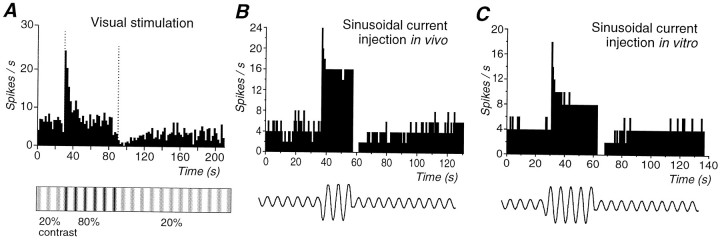
As reported in the companion paper (Sanchez-Vives et al., 2000), presentation of a high (30–80%)-contrast sinewave drifting grating for 30–60 sec resulted in pronounced adaptation of action potential discharge in primary visual cortical neurons in vivo (Fig.1A). After adaptation to a high contrast, the return to a low-contrast (5–20%) grating revealed a significantly reduced action potential response (with respect to the preadaptation period) in 56% (22 of 39) of the cortical neurons. Recovery to preadaptation firing rate was achieved after 5–82 sec (19.3 ± 16.3 sec; n = 22; Fig.1A).
Fig. 1.
Comparison of action potential adaptation generated in response to a visual stimulus in vivo, intracellular injection of sinusoidal current in vivo, and intracellular injection of sinusoidal current in vitro. A, Presentation of an 80% contrast sinusoidal grating for a period of 1 min to this cortical neuron resulted in a strong adaptation of action potential discharge. After return to the 20% contrast grating, the action potential discharge was strongly suppressed and slowly recovered. B, Response of a cortical neuron to the intracellular injection of different amplitude sinusoidal currentsin vivo. Increasing the amplitude of the sinusoidal current from 0.15 to 1 nA peak-to-peak resulted in an increase in discharge rate as well as adaptation of action potential discharge. Returning the amplitude of the current injection to control reveals a marked depression in action potential discharge rate, which recovered slowly over the next minute. C, Similarly, the intracellular injection of sinusoidal currents of two distinct amplitudes (0.12 and 0.9 nA) into cortical neurons in vitro results in adaptation of action potential discharge rate followed by a marked decrease in neuronal responsiveness to the lower amplitude sinewave. The bottom part of the figure is a schematic representation of the protocol used for the current injections: low-high-low intensity, and it does not correspond to the actual intensity or frequency. The frequency of the injected sinewave was always 2 Hz. Data in A and B were collected using methods that are described in the companion paper (Sanchez-Vives et al., 2000).
Intracellular injection of sinusoidal current in vivo, which was adjusted in frequency and amplitude to mimic the response of visual cortical neurons to visual stimuli, also resulted in a long-lasting (14.0 ± 10.5 sec) postadaptation reduction of the action potential discharge in 74% of the cells, in a very similar way to the postadaptation observed after a high-contrast visual stimulus (Fig.1B). Furthermore, high-frequency firing evoked by current injection induced a decrease in neuronal responsiveness that was sufficient to reduce the response to subsequent visual stimulation (Sanchez-Vives et al., 2000, their Fig. 13). These observations suggest that intrinsic mechanisms may play an important role in the generation of contrast adaptation.
The possible intrinsic mechanisms that underlie contrast adaptation were therefore investigated with intracellular recording techniques in visual cortical neurons maintained in slices in vitro. Intracellular recordings were obtained from 173 neurons located in layers 2/3 or 4 of coronal slices of the ferret visual cortex (area 17). A representative sample (n = 24) of cortical neurons exhibited an average resting membrane potential of −64.6 ± 5.4 mV, overshooting action potentials and an apparent input resistance of 49.6 ± 23.9 MΩ.
To mimic high-contrast visual stimulation and its consequence on the response to low-contrast stimulation with in vitrotechniques, we injected a low-high-low intensity pattern of 2 Hz sinusoidal currents in 24 cortical neurons. The first cycle of the high-intensity current induced 7–15 action potentials (average of 14–30 Hz), whereas the lower intensity current evoked 3–6 spikes (6–12 Hz).
Similarly to what was observed in vivo, adaptation of action potential discharge took place during the injection of high (±0.4 to ± 1.2 nA)-intensity current for 20 sec with time constants of <1–10 sec (Figs. 1C,2). Returning the current amplitude to the control level revealed a pronounced decrease in neuronal excitability that persisted for 12–75 sec (Figs. 1C,2A,B), similar to cells that exhibit postadaptation suppression of action potential activity (which we refer to as “postadapting” cells) in vivo (Fig.1A).
Fig. 2.
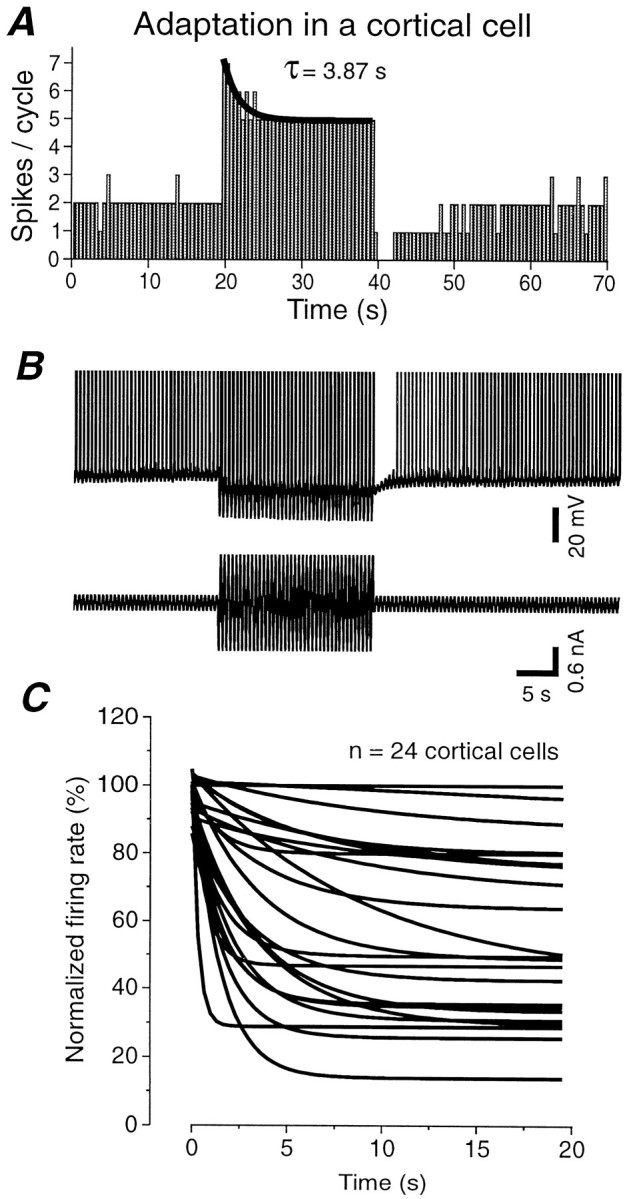
The time course and strength of firing rate adaptation varies widely between cortical neurons. A,Spikes per cycle versus time in response to the injection of a low- and high-amplitude sinewave current. During high-current intensity injection, the rate of action potential generation decreases with an exponential time constant of 3.87 sec. B, Example of the raw recording and injected current corresponding to the histogram shown in A. Spikes have been truncated. C, Plot of the rate of the decay (fit by a single exponential) in 24 cortical neurons. The firing rates have been normalized such that 100% corresponds to the firing rate at the beginning of the high-intensity current injection. Notice the wide variation in both the degree and time course of adaptation. Fast time constants of decay (in the order of milliseconds) could not be measured with this method, because only one value (spikes/cycle) every 0.5 sec was used for the exponential fitting.
The retention of adaptation and the postadaptation decrease in firing with simple sinewave current injection in vitro (Fig.1C) indicates that this preparation can be used to investigate the ionic mechanisms of the general phenomenon of neuronal adaptation during and after prolonged activation.
Cortical neurons vary in their amplitude and speed of adaptation
The time constant of adaptation during the high-intensity current injection was measured in 24 cortical cells by fitting a single exponential function (Fig. 2A). The amplitude of adaptation was estimated as the firing rate at the end of the current injection relative to that at the beginning and expressed as a percentage [100 × (spikes per cycle at the end of high intensity)/(spikes per cycle at the beginning of high intensity)]. Cortical neurons varied widely in the rate and amplitude of adaptation during high-amplitude sinusoidal current injection (Fig.2C). Five of the 24 cells showed little or no decay in their firing rate, whereas several other cells decreased their firing to <40% of their initial discharge. Between these extremes there was a continuum for both the time course and amplitude of adaptation. The firing rate decayed to an average of 54.7 ± 26.5% of the initial value (median, 50.0%; n = 24). The mean value for the adaptation decay time constant was 3.3 ± 2.5 sec (n = 19 cells exhibiting a significant decay; median, 3.0 sec). This corresponds to a slow adaptation of action potential discharge, which has to be distinguished from a faster and more commonly studied (Koike et al., 1970; Stafstrom et al., 1984; Ahmed et al., 1998) type of adaptation that displays time constant of the order of tens of milliseconds.
The time constant of the decay and the rate of adaptation were independent from the number of spikes in the first cycle. The firing rate adaptation was not associated with any appreciable change in action potential threshold. Thus, the injection of depolarizing ramps (180 msec at 5.5 nA/sec) revealed that the threshold for action potential generation was the same before and after the performance of the high-intensity adaptation protocol (n = 6; data not shown).
In the companion paper, we report that the adaptation of the firing rate of dorsal lateral geniculate nucleus (dLGN) neurons during high-contrast visual stimulation is considerably less than in cortical cells (Sanchez-Vives et al., 2000). We examined here the possibility that similar differences between cortical and dLGN neurons may also be expressed in vitro with sinusoidal current injection. Intracellular injection of sinusoidal current into 11 electrophysiologically identified thalamocortical cells in the A-laminae of the LGNd (Pape and McCormick, 1995) demonstrated an average reduction to only 77.3 ± 11.5% (median, 77.8%; Fig.3), with no cells decaying to >60%. LGN cells therefore exhibited a significantly less pronounced amplitude of adaptation than cortical neurons (t = 2.68;p = 0.011). The average time constant of decay in dLGN neurons was 6.4 ± 3.4 sec (median, 5.1), which is significantly slower than for cortical neurons (t = 2.83;p = 0.008).
Fig. 3.
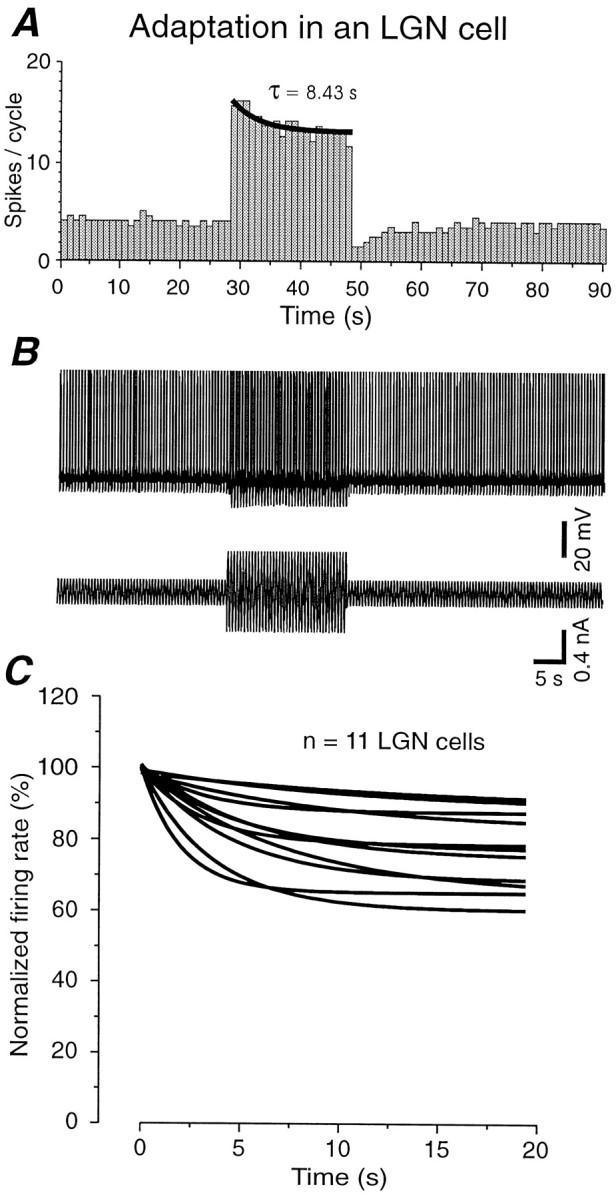
Thalamocortical neurons in the dorsal lateral geniculate nucleus in vitro exhibit significantly less adaptation than cortical neurons. A,B,Intracellular injection of sinusoidal current into a thalamocortical neuron in the dLGN results in adaptation to ∼80% with a time constant of 8.43 sec. B, Raw recording and injected current corresponding to the histogram shown in A.C, Comparison of the time courses and amplitudes of adaptation during the high-intensity current injection in 11 thalamocortical neurons. The decay in the number of spikes per cycle have been normalized as in Figure 2C.
Properties of the postadaptation period: variability between different neurons
In cortical cells, the adaptation period (20 sec of high-intensity sinusoid) was followed in all cases by a long-lasting AHP (Fig.2B), even if spike-frequency adaptation during the high-intensity current injection was not apparent. This AHP was associated with a reduction or suppression of the response to the low-intensity sinusoidal current.
Protocols in which no low-intensity sinusoids followed the high-intensity were used to study the AHP in isolation (see Fig. 5). This AHP had an average peak amplitude of 10.8 ± 4.0 mV (range, 4–16.8 mV; n = 24) and a duration that varied between 12 and 75 sec (mean, 32.4 ± 16.3 sec, median, 27 sec;n = 24). For lack of a better term we call this hyperpolarization a slow AHP, but it should be stressed that it is considerably longer than the slow AHP previously described in hippocampal neurons (<10 sec; for review, see Sah, 1996).
Fig. 5.
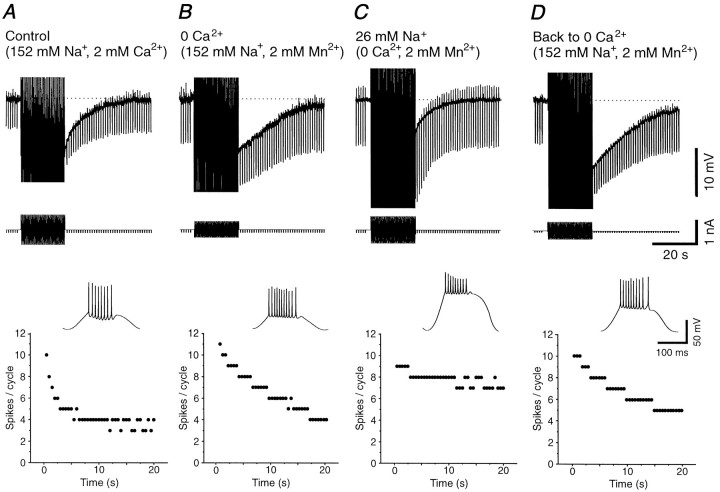
The slow AHP is reduced by lowering [Na+]o but not [Ca2+]o in the bathing medium.A, Intracellular injection of sinusoidal current results in the generation of a prolonged AHP that is associated with an increase in membrane conductance. The time course of the slow firing adaptation during the 20 sec of sinusoidal current injection is shown in the scattergram below. The inset represents the expanded voltage during the second of the 40 cycles of sinusoidal current injection. B, Replacement of Ca2+ in the bathing medium with Mn2+ not only does not abolish the slow AHP, but actually enhances it. Note that Ca2+-dependent K+ currents may be too fast to be visible with this time scale. The time course of firing adaptation is also slowed (see scattergram). C, Reducing the extracellular concentration of Na+ from 152 to 26 mmresults in a substantial reduction in the amplitude of the slow AHP as well as a marked decrease in the rate of spike-frequency adaptation.D, Washing in normal Na+ enhances the AHP and adaptation. Note that in each case the amplitude of the sinusoidal current injection was adjusted to generate ∼9–11 action potentials during the initial cycle of the sinusoidal current.
Significant correlations were found between the adaptation of the firing rate during the high-intensity period and the duration (r = 0.51; p = 0.01), amplitude (r = 0.68; p < 0.001), and increase in membrane conductance (r = 0.64; p < 0.001) of the subsequent slow AHP (Fig.4A–C). These correlations suggest that spike-frequency adaptation during the high-intensity current injection and the AHP that follows share common signals or mechanisms for their generation.
Fig. 4.
Relationship between adaptation strength during high-intensity current injection and slow AHP duration and peak amplitude and change in input conductance during the slow AHP after high-intensity current injection. The percentage of reduction in the number of spikes during adaptation is significantly correlated with the duration of the AHP (A; r = 0.51;p = 0.01), the peak amplitude of the AHP (B; r = 0.68; p= 0.0002), and the input conductance at 20 sec during the AHP (C; r = 0.64; p= 0.0008). The input conductance has been normalized with respect to control (preadaptation) value. We found changes in input conductance measured 20 sec after the AHP peak to better correlate with the adaptation of the firing than those measured at the peak, probably because of a better isolation of the Na+-dependent K+ current at this time. Each data point represents a different cell. Experimental protocol for induction of spike adaptation was similar to that of Figure 5.
One possible explanation for the heterogeneity in adaptation strength and AHP size is that they are differently expressed in different morphological classes of neurons. Although this possibility will need to be examined extensively in the future, we noted that firing rate adaptation during high-intensity sinusoidal current injection in morphologically identified layer 4 spiny stellate cells (n = 6), which averages 36.8 ± 7.8%, was significantly stronger (p < 0.0001,t test) than in morphologically identified layer 2/3 pyramidal neurons (n = 7), for which the firing rate adapted only to 89.1 ± 8.7%. Likewise, the amplitude and duration of the AHP after high-intensity current injection were both significantly larger in spiny stellate cells: spiny stellate cells had an AHP amplitude of 12.76 ± 3.2 mV, versus 7.7 ± 2.3 mV in layer 2/3 pyramidal cells; the AHP lasted 37.1 ± 15.4 sec in spiny stellate cells, compared to 17.4 ± 5.8 sec in layer 2/3 pyramids. These differences may be the consequence of differential distribution of conductances between layers or cell types, of different mechanisms for intracellular ion regulation and coupling to ionic channels, or of the morphological differences themselves.
Ionic basis for firing rate adaptation and slow AHP
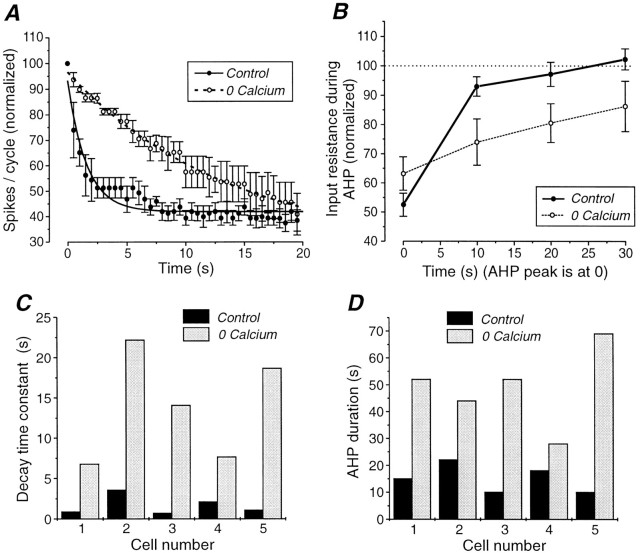
The intracellular injection of high-amplitude sinewaves at 2 Hz for 20 sec were used to examine the voltage and ion dependence of the slow firing rate adaptation and of the subsequent slow AHP and to uncover the underlying currents. Previous investigations have emphasized the role of Ca2+-activated K+ currents in spike-frequency adaptation and AHP (for review, see Sah, 1996). Here, block of transmembrane Ca2+ currents by removing Ca2+ from the bathing medium and replacing it with either Mn2+ (n = 11) or Co2+ (n = 2) not only did not block the slow AHP, but actually lengthened it (Fig.5B). In 11 cells studied with Mn2+ substitution, the duration of the AHP increased from 19.9 ± 8.0 sec in control to 48.0 ± 14.5 sec in 0 mm[Ca2+]o (pairedt test; t = 7.14; p < 0.0001; Fig. 6D).
Fig. 6.
Blockage of Ca2+ currents results in a slowing of firing rate adaptation and in an enhancement of AHP duration. A, Spikes per cycle versus time before and after block of Ca2+ currents through the substitution of Ca2+ with 2 mmMn2+. The number of spikes per cycle have been normalized with respect to the number in the first cycle and averaged for five different cells. The error bars represent the SEM. A single exponential has been fitted for both conditions. The average time constant of the decay was 1.56 sec in control and 13.78 sec in 0 mm [Ca2+]o.B, Plot of the input resistance during the AHP in 2.5 and 0 mm [Ca2+]o. The changes in input resistance have been averaged for the same five cells as in A, the error bars representing the SEM. The decrease in input resistance has a time course similar to that of the AHP. In 0 mm[Ca2+]o, the decrease in input resistance is less at time 0 but larger afterwards with a slower return to control value. C, D, Bath application of medium containing 0 mm Ca2+ and 2 mm Mn2+ results in a lengthening of the duration of the AHP (D) as well as a lengthening of the time constant of firing rate adaptation (C). In both cases there was a statistically significant difference (p = 0.002). Results from five different cells are shown.
The consequences of 20 sec of high-intensity sinewave injections were also studied with the calcium chelator BAPTA (25–100 mm) in the recording electrode (n = 5). The slow AHP was not suppressed after the infusion of BAPTA into the neurons for 5–40 min, and its duration was 43.6 ± 15.0 sec, which is similar to that obtained in 0 mm[Ca2+]o.
The block of transmembrane Ca2+ currents also resulted in a substantial lengthening of the decay time constant of firing rate adaptation during the injection of the high-intensity sine waves (Figs. 5B,6A,C; the intensity of the current injection was adjusted to keep the initial firing rate similar to the control value). Figure 6 shows the effects of eliminating extracellular calcium in five cells. The decay of the number of spikes per cycle during high-intensity current injection was consistently slower in 0 mm[Ca2+]o (Fig.6A). Accordingly, the exponential time constant of the decay became longer in every case (Fig. 6C).
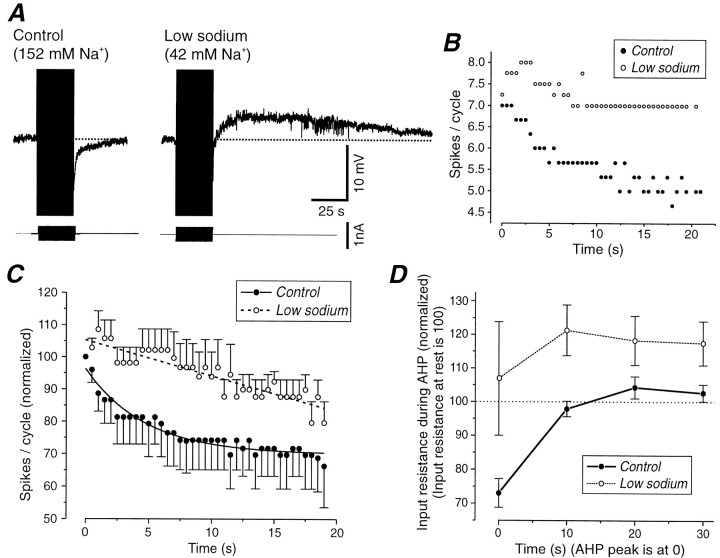
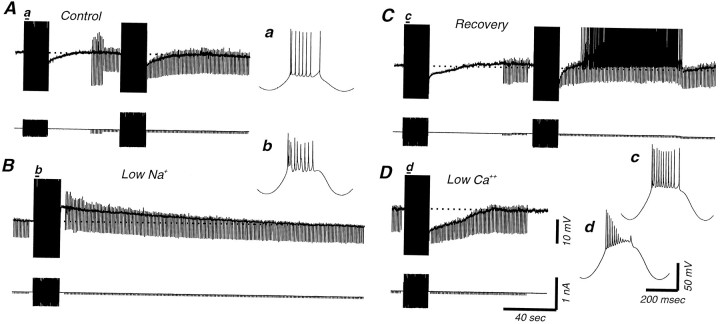
Once transmembrane Ca2+ currents were blocked, [Na+]owas reduced from 152 to 42–26 mm by substituting choline-Cl for NaCl in the bathing medium. In low [Na+]o, action potentials were still generated, although their amplitude was reduced and their duration increased (Fig. 5C, inset). In these conditions the size and duration of the AHP were reduced (Fig.5C, top panel). In parallel, the strength of the firing rate adaptation during high-intensity current injection was decreased (Figs. 5C, bottom panel,7C). Returning [Na+]o to normal reinstated the slow AHP as well as spike-frequency adaptation during the period of sinusoidal current injection (Fig. 5D). The reduction of the slow AHP was not attributable to the action of choline on muscarinic receptors because the block of the slow AHP in low [Na+]o was not prevented by including the muscarinic antagonist scopolamine (10 μm) in the bath (n = 2).
In similarity to the effects of lowering [Na+]o in 0 mm[Ca2+]o solution, lowering [Na+]o in the presence of 2 mm[Ca2+]o also resulted in a block of the slow AHP. However, in these conditions, the slow AHP was usually replaced by a pronounced slow ADP (n = 10; Figs. 7A,8B). The slow ADP appeared to be a Ca2+-dependent event because it was blocked after reduction of [Ca2+]o to 0 mm (n = 6). Figure 8,A and C, illustrates one recording in which a slow AHP is visible in normal bath solution. Lowering [Na+]o unveils a slow ADP (Fig. 8B), which disappears almost completely after returning to normal sodium levels. However, after recovery, the slow AHP was followed by a slow ADP. Block of transmembrane Ca2+ currents with the bath application of low [Ca2+]o (0.5 mm) and elevated Mg2+ (10 mm) resulted in an increase in the amplitude and duration of the slow AHP and a block of the slow ADP (Fig. 8D).
Fig. 7.
Reducing [Na+]oresults in the block of the slow AHP and in the appearance of a slow ADP. A, The intracellular injection of sinusoidal current (2 Hz) results in the generation of a slow AHP in normal solution, but of a slow ADP after the reduction of [Na+]o from 152 to 42 mm.B, Plot of spikes per cycle versus time for the two conditions represented in A reveals that reducing sodium concentration results in a marked decrease in the strength of slow firing rate adaptation. C, Spikes per cycle versus time in control and low sodium. The number of spikes per cycle have been normalized with respect to that in the first cycle and averaged for five different cells. The error bars represent the SEM. A single exponential has been fitted for both conditions. The average time constant of the decay is 4.7 sec in control solution and very slow (several minutes) and almost linear in low sodium. D,Plot of the apparent input resistance during the AHP (normal sodium) and ADP (low sodium). The changes in input resistance have been averaged for the same five cells as in C. The apparent input resistance of the cell decreases during the AHP, but increases during the ADP.
Fig. 8.
Both a slow afterhyperpolarization and a slow afterdepolarization can follow the repetitive discharge of action potentials in cortical neurons. A, Intracellular injection of sinusoidal current into this cortical neuron results in a slow AHP. B, Reducing [Na+]o to 26 mm results in the replacement of the slow AHP by a large and prolonged ADP.C, Returning to normal [Na+]o reinstates the slow AHP, although it is now followed by a remnant ADP that could activate action potentials (the cell was slightly depolarized after the first sinusoidal current injection by DC injection). D,Blocking transmembrane Ca2+ currents through the bath application of 0.5 mm Ca2+ and 10 mm Mg2+ results in a block of the slow ADP, leaving a large, slow AHP. For each of the four conditions the second cycle of the sinusoidal current injection is expanded to illustrate action potentials.
In the presence of 2 mm[Ca2+]o, the rate of adaptation of action potential discharge also was markedly reduced after reduction of extracellular sodium concentration (Fig.7B,C). In some cases, reduction of [Na+]o while keeping 2 mm[Ca2+]o even resulted in an increase of firing rate, which reached a peak several seconds after the beginning of the sinusoidal current injections (Fig.7B), presumably because of the same mechanisms that generate the slow ADP.
The afterhyperpolarization is mediated by a K+ current
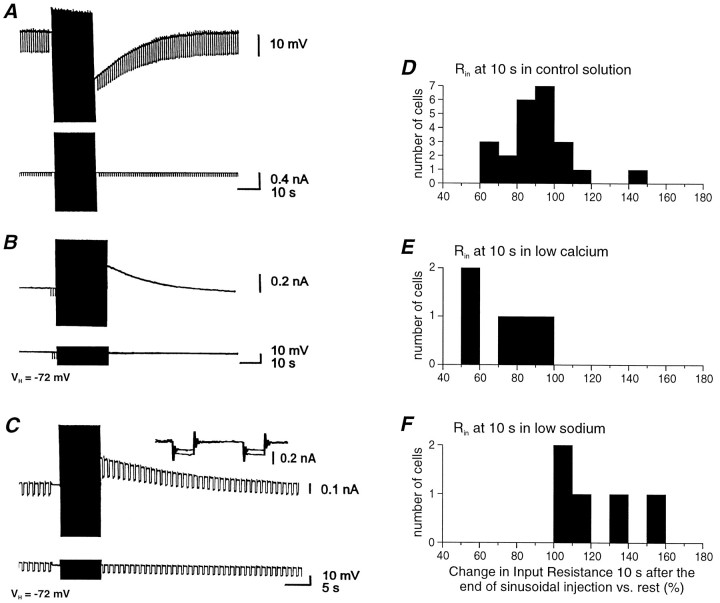
Two mechanisms could account for the sodium-dependent slow AHP. The first one is the activation of a sodium-dependent current, which should be associated with changes in membrane conductance. The other is the activation of electrogenic ionic pumps, such as the Na+/K+ATPase, which should not be associated with changes in conductance (Gustafsson and Wigström, 1983; Thompson and Prince, 1986). Whether or not the slow afterhyperpolarization was associated with an increase in membrane conductance was examined with a hybrid current–voltage clamp mode in which cells were induced to generate prolonged series of action potentials in current-clamp mode and then voltage-clamped to various membrane potentials (Fig.9). In Figure 9A–C, recordings were performed in 0 Ca2+ and 2 mm Mn2+ to isolate the slow AHP. The slow AHP after a sinusoidal current injection is shown in current-clamp mode in Figure 9A. The outward current underlying it was subsequently recorded in voltage-clamp mode (Fig. 9B) and the conductance tested during this period (Fig. 9C). The conductance thus measured in five cells increased to 162.5 ± 30.0% during the tail current with respect to rest.
Fig. 9.
The slow AHP is associated with an increase in membrane conductance. A, Intracellular injection of sinusoidal current results in the generation of a prolonged AHP (current clamp). B, In hybrid current and voltage clamp, the injection of a similar series of sinusoidal current is associated with the generation of a prolonged outward current. C,The intracellular injection of hyperpolarizing voltage steps reveals that the outward current is associated with a 46% increase in membrane conductance. D, Apparent input resistance measured 10 sec after the end of sinusoidal injection in normal solution, expressed as a percentage of the resistance observed before the sinusoidal current injection. E, F, Change in apparent input resistance 10 sec after current injection varies with recordings conditions. The decrease is larger on average in low calcium-containing medium (E) than in normal solution (D). In low sodium (26 mm), there is an increase in apparent input resistance (F).
When in current-clamp mode, the intracellular injection of hyperpolarizing current pulses also revealed that the slow AHP is often associated with a substantial increase in membrane conductance (Figs.5, 6B, 7D, 9A), even after compensation for the change in membrane potential (n = 7; data not shown). In normal solution this increase in conductance lasted 10–20 sec, whereas in low calcium the membrane conductance remained increased for >30 sec (n = 8; Fig.6B). On the other hand, the slow afterdepolarization after reduction of [Na+]o was associated with a decrease in apparent input conductance in current-clamp recordings (n = 10; Fig. 7D,8B).
As a consequence, the change in apparent input resistance in current clamp, 10 sec after the peak of the AHP with respect to rest, showed different distributions between control (89.7 ± 17.2%;n = 23; Fig. 9D), low calcium (73.9 ± 17.7%; n = 5; Fig. 9E), and low sodium (121.2 ± 20.8%; n = 5; Fig. 9F). These observations suggest that the variability of changes in conductance shown by neurons in control solution (Fig. 9D) may be attributed to a differential distribution or density for the membrane conductances sustaining the slow ADP and the slow AHP.
To determine the type of ionic channels that were opening during the slow AHP, we measured the reversal potential of the current underlying the slow AHP in either current-clamp or voltage-clamp mode (Fig.10). The average reversal potential of the slow AHP current was determined to be −108.9 ± 12.4 mV in 2.5 mm[K+]o(n = 10). Increasing [K+]o from 2.5 to 7.5 mm resulted in a shift of the reversal potential to more depolarized levels (average of −86.7 ± 2.8 mV;n = 3), giving a 45 mV/10-fold change in [K+]o. This value is somewhat less than expected from the Nernst equation (61 mV/10-fold change at 35° C). In the cell shown in Figure 10, the reversal potential of the tail current after 20 sec of sinusoidal current injection was measured in both 2.5 and 10 mm[K+]o after transmembrane Ca2+ currents were blocked by bathing the slices in 0.1 mmCa2+ and 1.9 mmMn2+. The reversal potential of this tail current shifted from −113 to −77 mV, a 36 mV change that is as predicted by the Nernst equation.
Fig. 10.
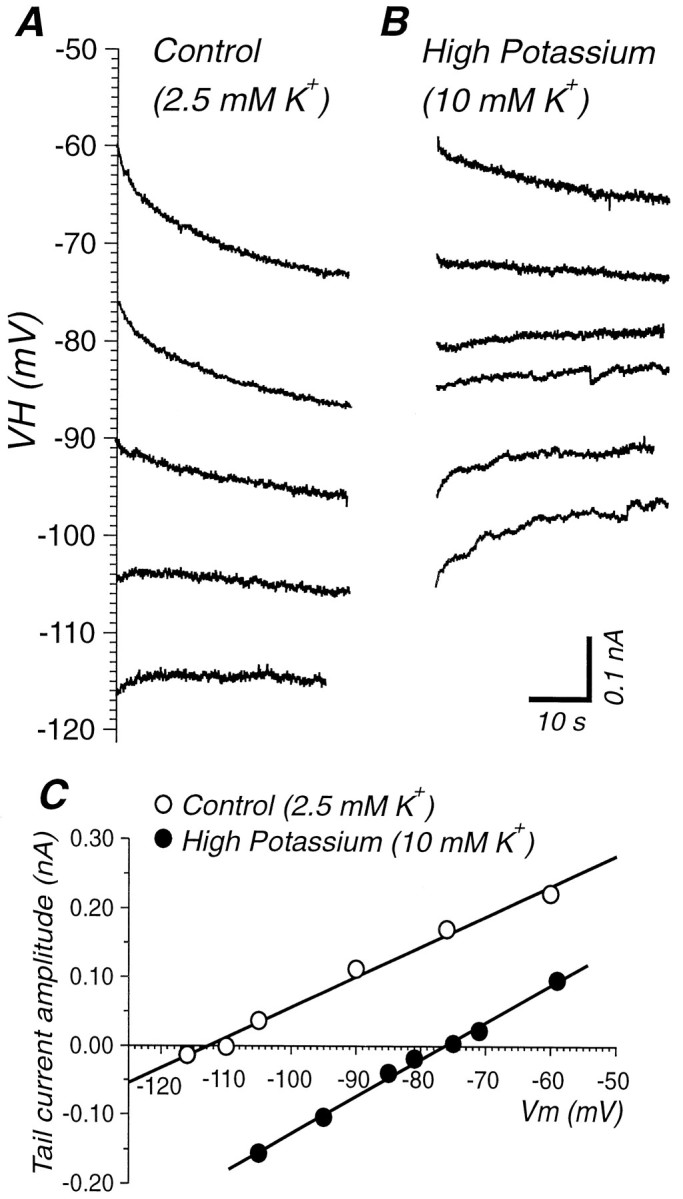
The slow AHP is mediated by a K+ current. A, Outward tail currents were recorded after 20 sec of sinusoidal current injection in current clamp while holding the cell at different holding potential (hybrid current–voltage clamp) in 2.5 mm[K+]o. B, Same protocol in 10 mm [K+]o.C, Amplitude of peak tail current after repetitive firing for 20 sec as a function of holding potential. The slow AHP current exhibits a reversal potential of −113 mV in 2.5 mm[K+]o. Increasing [K+]o to 10 mm results in a shift in the reversal potential to −77 mV, indicating that the slow AHP current is carried by K+.
We have not yet found any evidence to support a role for a Na+/K+ ionic pump in the generation of the slow AHP. Local application of strophanthidin in concentrations (200 μm in micropipette) exceeding those previously reported to block the Na+/K+ pump in hippocampal pyramidal cells (Thompson and Prince, 1986) or in the bath (10 μm) did not block the slow AHP after repetitive firing in cortical neurons (n = 7; data not shown).
The increase in conductance during the slow AHP recorded in low or 0 mm[Ca2+]o, and the reversal potential in different potassium levels for the underlying current indicate that the slow AHP and the slow firing rate adaptation are largely attributable to the activation of a sodium-dependent potassium conductance.
Block of voltage-dependent Na+ currents abolishes the slow AHP
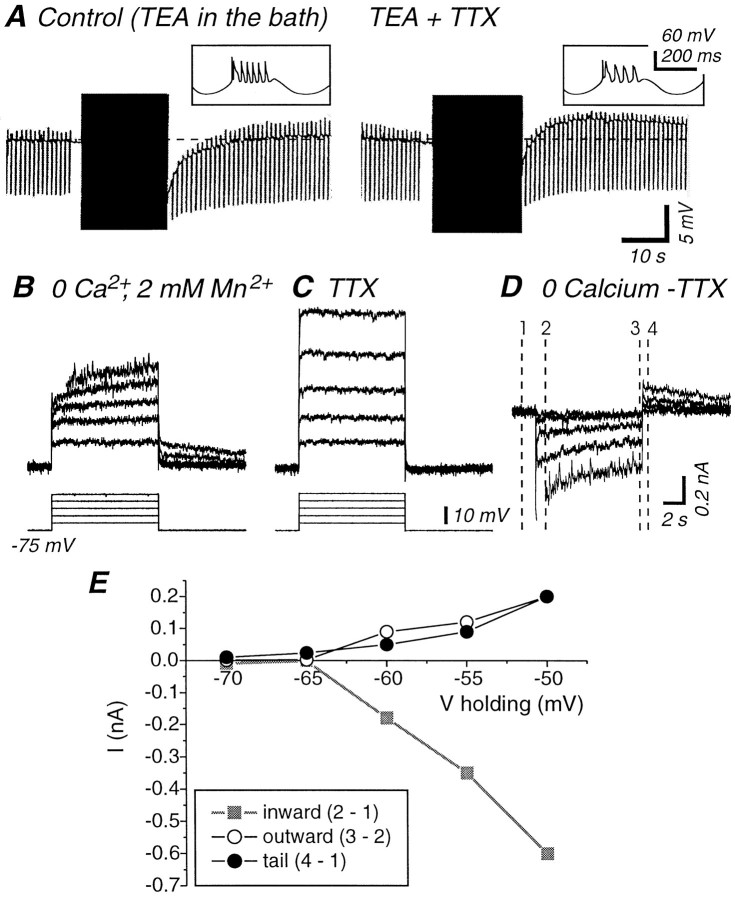
The slow AHP generated by 40 cycles of sinewave current injections in 0 mm[Ca2+]o was immediately abolished by block of fast action potentials through either the local (10 μm) or bath (1 μm) application of the Na+ channel blocker tetrodotoxin (TTX) (n = 4; data not shown). However, the interpretation of this experiment is complicated by the fact that tetrodotoxin blocks all action potential generation in these cells. Therefore it changes the trajectory of the membrane voltage, and it could reduce the influx of Ca2+ as well as Na+. To control for this possibility, we recorded cells in the presence of the K+channel blocker tetraethylammonium (TEA) so that they generated robust Ca2+-mediated action potentials before and after the application of TTX (Fig.11A;n = 5). Under these circumstances, the local application of tetrodotoxin (10–20 μm in the micropipette) resulted in a strong reduction in the amplitude of the slow AHP and could be associated with the appearance of a slow ADP (Fig. 11A; TEA + TTX). Similarly, the simultaneous bath application of TEA (2–5 mm) and TTX (1–2 μm) resulted in an abolition of fast Na+-dependent action potentials, the generation of repetitive Ca2+ spikes, and the reduction or elimination of the slow AHP (n = 3; data not shown). These effects are similar to those that occurred in low-sodium solution with normal calcium concentration.
Fig. 11.
The slow AHP is not supported by the generation of Ca2+ spikes alone and is blocked by TTX.A, In the presence of TEA (4 mm in the bath), intracellular injection of sinusoidal current results in the activation of fast Na+ and slow Ca2+-mediated action potentials (left trace). Block of voltage-gated Na+ channels with local application of TTX (20 μm) results in an abolition of the slow AHP and in its replacement by a slow afterdepolarization (right trace) despite the firing of Ca2+ spikes. Expanded traces illustrate action potential features before and after application of TTX.B, Depolarizing voltage steps (10 sec) are followed by a slowly decaying outward current. C, Local application of TTX (10 μm) blocks the slow outward tail current.D, The traces obtained after the application of TTX (C) were subtracted from the ones obtained before TTX application (B). These traces are consistent with the depolarization activating a TTX-sensitive inward current and a slowly developing outward current. The four vertical lines indicate the time at which the current values were measured to build the I–V graph shown inE. E,I–V representation of the putative inward and outward currents activated during and after depolarizing voltage steps exhibit a very similar voltage dependence. The apparent input resistance of the cell in B–E was 38 MΩ, which is normal for cortical pyramidal cells (McCormick et al., 1985).
To further examine the possible role of TTX-sensitive currents in the generation of the slow AHP, we examined the ionic currents activated by subthreshold voltage steps before and after the application of TTX (Fig. 11B). Stepping from a holding potential of −75 mV to membrane potentials of up to −50 mV for 10 sec in 0 [Ca2+]o and 2 mm[Mn2+]o resulted in the activation of a slow outward current that slowly deactivated after return to −75 mV (Fig. 11B). The local application of tetrodotoxin (10 μm) resulted in a block of this slowly activating outward current (Fig. 11C;n = 5). Subtracting the current traces obtained after the application of TTX from those obtained before reveals traces that are consistent with the generation of an inward current (blocked by TTX) superimposed on the generation of a slowly developing outward current. Plotting the amplitude of both the apparent inward and outward currents versus the step potential reveals a similar voltage dependence (Fig. 11D,E). The properties of the apparent inward current, including its rapid activation with depolarization, its amplitude (0.1–1 nA at −65 to −50 mV), and its block by tetrodotoxin are consistent with its mediation by the persistent Na+ current (Stafstrom et al., 1985;Schwindt et al., 1989) (for review, see Crill, 1996). The properties of the outward current that follow the cessation of the depolarizing voltage step are consistent with its mediation by a Na+-dependent K+ current (Schwindt et al., 1989).
Functional effects of the slow AHP
During presentation of a high-contrast sinewave grating, cortical neurons in vivo receive barrages of synaptic potentials that vary from being “sinusoidal” for simple cells, to a more-or-less steady depolarization for complex neurons (Sanchez-Vives et al., 2000). Similarly, the intracellular injection of either sinusoidal (Fig.12A, left), constant (Fig. 12A, right; n = 10) or “noisy” stimuli that lead to a general depolarization of the cell (Nowak et al., 1997; Liu et al., 1999) (data not shown) in vitro all resulted in substantial spike adaptation and in the generation of a slow AHP.
Fig. 12.
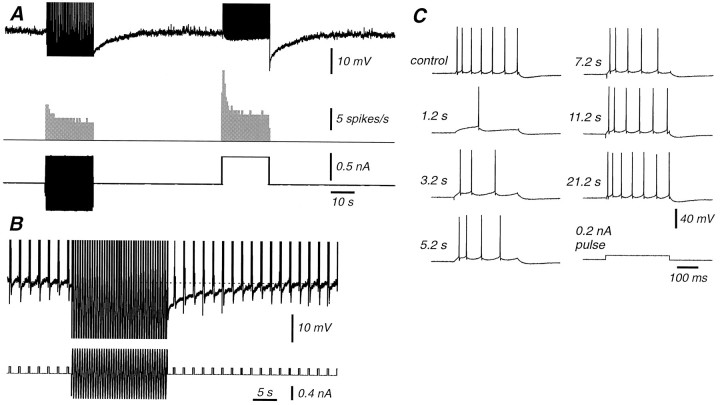
The slow AHP leads to a prolonged decrease in neuronal responsiveness. A, The AHP evoked by the injection of a sinusoidal current for 20 sec is compared with the AHP induced by a square pulse of 20 sec duration (top trace). In both cases, the depolarizing intensity is 0.5 nA (bottom trace). The sinusoidal injection was −0.5 to 0.5 nA at 2 Hz. Both the total number of spikes and the frequency were higher with a square pulse as the hyperpolarizing part of the sinusoids prevented firing (middle trace). B,Intracellular injection of a depolarizing current pulse every 2 sec was used to test the excitability of this neuron. The intracellular injection of a sinusoidal current results in a prolonged AHP, which is associated with a marked decrease in the number of action potentials generated in response to each depolarizing current pulse.C, Examples of neuronal responses to the depolarizing current pulses at the times indicated after the end of sinusoidal current injection. Control data were obtained just before injection of the sinusoidal current.
Functionally, the slow AHP was associated with a marked decrease in response of the neuron to the intracellular injection of depolarizing current pulses (Fig. 12B,C; n = 10), such that current pulses that were able to generate a train of action potentials before adaptation could become completely subthreshold or generated only one action potential. As the AHP lessened, the neuronal response slowly recovered, with an average recovery time of 13.95 ± 13.62 sec (n = 10) in normal solution (Fig.12B,C). This decrease in excitability presumably results from both the hyperpolarization of the membrane potential as well as the increase in membrane conductance associated with the slow AHP.
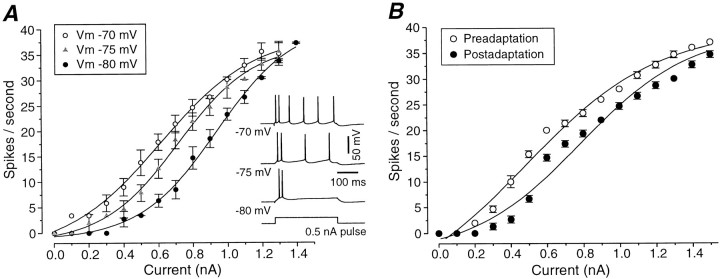
Examination of the frequency versus current (f–I) relationship revealed that hyperpolarization of cortical neurons with the intracellular injection of current resulted in a rightward shift of the f–I curve (n = 7; Fig.13A). Similarly, thef–I relationship studied before and after adaptation to prolonged sinusoidal current injections showed a displacement to the right (n = 6), even for slow AHPs of relatively small amplitudes (the cell in Fig. 13B had an AHP of only 4 mV). These results indicate that after adaptation, the hyperpolarization of the membrane potential is sufficient to result in a significant shift in the f–I relationship of cortical neurons. This result is qualitatively similar to the rightward shift in contrast–response functions for visual cortical neurons after contrast adaptation (Movshon and Lennie, 1979; Dean, 1983; Albrecht et al., 1984; Ohzawa et al., 1985; Sclar et al., 1989; Bonds, 1991).
Fig. 13.
Shifts of the frequency versus current (f–I) relationship with different membrane potentials (A) and during the slow AHP (B). A, Frequency versus intensity curves at three different membrane potentials. Membrane potential was maintained at different values by means of intracellular injection of DC. Firing was induced by 300 msec depolarizing pulses of intensities indicated. The sigmoidal functions are the result of fitting a Boltzmann equation to the data. Error bars correspond to the SD for three to eight repetitions of the current pulse. Points without an error bar exhibited an SD of zero. The inset on theright shows the response to a 0.5 nA pulse at the three different membrane potentials. B,f–Iplot for different amplitude of sinusoidal current injections in a neuron before (solid dots) and after (open dots) injection of a high-intensity (± 1.2 nA) sinusoidal current for 20 sec. Frequency is the average frequency of discharge in the five cycles before high intensity and the five cycles after it. Note that the f–I relationship is shifted to the right along the current axis after adaptation.
DISCUSSION
Contrast adaptation is associated with a slow (τ of seconds) reduction (“fading”) in the perceived contrast during prolonged viewing of a high-contrast stimulus (Blakemore et al., 1973; Hammett et al., 1994) and a decrease in evoked discharge of visual cortical neurons (Maffei et al., 1973; Vautin and Berkley, 1977; Albrecht et al., 1984; Ohzawa et al., 1985; Marlin et al., 1988). Contrast adaptation is followed by a prolonged (tens of seconds) period of reduced contrast sensitivity (Blakemore and Campbell, 1969; Dealy and Tolhurst, 1974; Swift and Smith, 1982; Georgeson and Harris, 1984;Lorenceau, 1987; Berkley, 1990; Määtänen and Koenderink, 1991; Hammett et al., 1994) and reduction in evoked discharge in visual cortical neurons (Maffei et al., 1973; Movshon and Lennie, 1979; Dean, 1983; Albrecht et al., 1984; Ohzawa et al., 1985;Saul and Cynader, 1989; Sclar et al., 1989; Allison et al., 1993), which is associated with a membrane hyperpolarization (Carandini and Ferster, 1997; Sanchez-Vives et al., 2000) (but see, Ahmed et al., 1997).
Both components of contrast adaptation may result, at least in part, from the intrinsic properties of cortical neurons; in other words, the propensity of these cells to exhibit a slow spike-frequency adaptation during prolonged stimulus presentation and a long-lasting hyperpolarization after stimulus presentation (Sanchez-Vives et al., 2000). Thalamocortical neurons in the lateral geniculate nucleus exhibit significantly less slow spike-frequency adaptation than cortical neurons (present study) and significantly less contrast adaptation (Shou et al., 1996; Sanchez-Vives et al., 2000). Our present results, obtained with in vitro techniques, suggest that both slow adaptation and slow AHP in cortical neurons are mediated largely through the activation of a Na+-activated K+ current.
Ionic basis of the slow AHP and slow firing rate adaptation
The prolonged activation of cortical neurons is followed by a slow (12–75 sec) AHP that is most likely mediated by a K+ conductance, because it is associated with an increase in conductance (Fig. 9) and reversed at the expected reversal potential of K+ in 2.5 mm[K+]o and was sensitive to changes in [K+]o (Fig. 10). Although the activation of a Na+/K+ ionic pump may contribute to this slow AHP (Thomas, 1972; Glynn and Karlish, 1975; Gustafsson and Wigström, 1983; Thompson and Prince, 1986), it is not a major contributor, because we could reverse the slow AHP with hyperpolarization and application of the Na+/K+ pump blocker strophanthidin did not prevent the occurrence of the slow AHP.
Previous studies have emphasized the importance of Ca2+-sensitive K+ currents in both the generation of spike-frequency adaptation and slow AHPs in many different types of neurons (Madison and Nicoll, 1984; Pennefather et al., 1985; Constanti and Sim, 1987; Llinás and Lopez-Barneo, 1988; Schwindt et al., 1988,1992; Avoli and Olivier, 1989; Sah, 1996; Pineda et al., 1998). In the present study, we found that the block of transmembrane Ca2+ currents resulted in a slowing of the rate of firing rate adaptation, indicating a role for Ca2+-activated K+ currents in the slow spike-frequency adaptation (Figs. 5, 6).
However, after block of transmembrane Ca2+currents, the amplitude of the AHP that follows these prolonged trains of action potentials did not change, and its duration actually increased (Figs. 5, 6). This prolonged AHP, as well as the remaining spike-frequency adaptation, were reduced after reduction of [Na+]o (Fig. 5,7). This suggests that both the slowest component of firing rate adaptation and the slow AHP are mediated by a Na+-activated K+ current (IK(Na)).
Several investigations have demonstrated prolonged afterhyperpolarizations after repetitive action potential generation that may be mediated by Na+-activated K+ currents (Constanti and Sim, 1987;Schwindt et al., 1989; Kubota and Saito, 1991; Safronov and Vogel, 1996; Kim and McCormick, 1998). The possibility that these currents are residual Ca2+-activated K+ currents that are activated by Na+-dependent intracellular Ca2+ release (Lowe et al., 1976) has been controlled for by chelating intracellular Ca2+ with appropriate buffers (Schwindt et al., 1989; present study).
Na+-dependent K+ channels were first recorded in heart cells (Kameyama et al., 1984) and later in a variety of different neurons, including pyramidal cells from the rodent primary visual cortex (Egan et al., 1992a). In both whole-cell and excised membrane patches, these large conductance K+channels are activated by increases in [Na+]i in the range of 10–20 mm (Egan et al., 1992b; Dryer, 1994; Koh et al., 1994; Safronov and Vogel, 1996; Bischoff et al., 1998). Intracellular levels of Na+ in neurons are 4–16 mm (Grafe et al., 1982; Galvan et al., 1984), whereas prolonged discharge of action potential results in increases in [Na+]i on the order of only a few millimolar concentration (Bergman, 1970;Grafe et al., 1982). These results predict, therefore, thatIK(Na) would only be weakly activated by prolonged neuronal activity. Nevertheless, significant activation of Na+-activated K+ channels is likely to occur with low increases of [Na+]i if additional factors are taken into account. First, increases in [Na+]i may be tightly localized in the submembrane space (e.g., axon hillock) and may locally reach levels high enough to strongly activate Na+-dependent K+ channels (Koh et al., 1994). Second, the sensitivity of Na+-activated K+ to increases in [Na+]i may be under the regulation of intracellular factors and therefore larger in intact cells than in cell-free membrane patches (Haimann et al., 1992;Rodrigo, 1993).
Ionic basis of the slow ADP
In addition to the generation of AHPs after prolonged activation of cortical neurons, we also observed, in low Na+ and occasionally in control conditions, a prolonged ADP that was associated with an apparent decrease in membrane conductance (Figs. 7, 8). This ADP was abolished by block of transmembrane Ca2+ currents and therefore presumably is activated by increases in intracellular calcium, in similarity to the ADP described by Schwindt et al. (1988). Hippocampal and cortical pyramidal cells possess Ca2+-activated nonselective cation conductances that are strongly voltage-dependent and that may generate prolonged ADPs (Friedman et al., 1992; Haj-Dahmane and Andrade, 1998). The voltage-dependent nature of this afterdepolarizing current may allow it to generate an apparent decrease in membrane conductance when neurons are injected with constant current pulses in current-clamp recording mode (Haj-Dahmane and Andrade, 1998). However, we cannot rule out other possible underlying mechanisms, such as the closure of a K+ channel.
The increased duration of the slow AHP after block of calcium influx suggests that the slow ADP participates in membrane potential repolarization in normal conditions. On a long time scale, the membrane potential and firing rate of cortical neurons appears to be under the influence of at least three separate slow ionic currents: a Ca2+-activated K+ current, a Na+-activated K+ current, and a current generating the slow ADP.
Although the adaptation we observed in vitro was very similar to that observed in vivo (Sanchez-Vives et al., 2000), the amplitude in vitro of both the adaptation and the slow AHP was larger. This difference may be explained by differences in the cell types examined (in vitro was limited to layers 2/3 and 4 neurons), the lack of spontaneous activity in vitro, or differences in the presence of modulatory neurotransmitters (Foehring et al., 1989).
Cellular mechanisms of contrast adaptation
A simple cellular model for the phenomenon of contrast adaptation can be proposed: presentation of a high-contrast stimulus results in the increased activation of synaptic and action potentials in cortical neurons, resulting in an increase in intracellular concentration of sodium and calcium ions, which then leads to the activation of calcium- and sodium-dependent potassium currents. The activation of these outward currents has two main consequences: a decrease in firing rate during high-contrast stimulation, such that the same stimulus produces less activity within a few seconds of presentation (perhaps the neuronal basis for the “fading” effect), and the production of a long-lasting hyperpolarization after high-contrast stimulation, such that more contrast is required to bring the neurons membrane potential to firing threshold (perhaps the neuronal basis for the decreased contrast sensitivity).
This simple model, however, does not explain the small part of contrast adaptation that is specific to the properties of the adapting stimulus (e.g., spatial frequency; Movshon et al., 1979; Albrecht et al., 1984;Saul and Cynader, 1989; Carandini et al., 1997). We hypothesize that the intrinsically generated hyperpolarization might account for the large, general decrease in neuronal responsiveness, whereas decreases in the activity of presynaptic neurons that are strongly activated by the adapting stimulus might provide the stimulus specific aspect of contrast adaptation.
This model of contrast adaptation does not exclude the participation of synaptic mechanisms. In addition, because neurons are highly connected, changes produced by intrinsic membrane properties in some neurons can be propagated as changes in synaptic drive in other neurons. Synaptic interactions also are likely to lead to the amplification (Douglas and Martin, 1991) of the changes that were initiated by intrinsic membrane properties.
In conclusion, we suggest that the membrane potential of cortical neurons is constantly being adjusted through the activation of Na+- and Ca2+-dependent K+ currents, in an effort to regulate neuronal excitability. This regulation of neuronal excitability will have numerous important consequences on cortical processing, including alterations in the spatial and temporal dynamics of receptive field properties (Barlow, 1990, 1997; Gilbert, 1998). These potential and important effects remain to be explored.
Footnotes
This work was supported by grants from National Science Foundation and the National Institute of Health. We thank Drs. Ehud Kaplan, Jean Bullier, and Joshua Brumberg for their comments on this manuscript and Drs. Anita Luthi and Uhnoh Kim for helpful discussions. Additional information about these and related findings may be obtained athttp://www.mccormicklab.org.
Correspondence should be addressed to David McCormick, Section of Neurobiology, Yale University School of Medicine, 333 Cedar Street, New Haven, CT 06510. E-mail: david.mccormick@yale.edu.
Dr. Sanchez-Vives' present address: Instituto de Neurociencias, Universidad Miguel Hernández, Apartado 18, 03550 San Juan de Alicante, Spain. E-mail: mavi.sanchez@umh.es.
REFERENCES
- 1.Aghajanian GK, Rasmussen K. Intracellular studies in the facial nucleus illustrating a simple new method for obtaining viable motorneurons in adult rat brain slices. Synapse. 1989;3:331–338. doi: 10.1002/syn.890030406. [DOI] [PubMed] [Google Scholar]
- 2.Ahmed B, Allison JD, Douglas RJ, Martin KAC. An intracellular study of the contrast-dependence of neuronal activity in cat visual cortex. Cereb Cortex. 1997;7:559–570. doi: 10.1093/cercor/7.6.559. [DOI] [PubMed] [Google Scholar]
- 3.Ahmed B, Anderson JC, Douglas RJ, Martin KAC, Whitteridge D. Estimates of the net excitatory currents evoked by visual stimulation of identified neurons in cat visual cortex. Cereb Cortex. 1998;8:462–476. doi: 10.1093/cercor/8.5.462. [DOI] [PubMed] [Google Scholar]
- 4.Albrecht DG, Farrar SB, Hamilton DB. Spatial contrast adaptation characteristics of neurones recorded in cat's visual cortex. J Physiol (Lond) 1984;347:713–739. doi: 10.1113/jphysiol.1984.sp015092. [DOI] [PMC free article] [PubMed] [Google Scholar]
- 5.Allison JD, Casagrande VA, DeBruyn EJ, Bonds AB. Contrast adaptation in striate cortical neurons of the nocturnal primate bush baby (Galago crassicaudatus). Vis Neurosci. 1993;10:1129–1139. doi: 10.1017/s0952523800010233. [DOI] [PubMed] [Google Scholar]
- 6.Avoli M, Olivier A. Electrophysiological properties and synaptic responses in the deep layers of the human epileptogenic neocortex in vitro. J Neurophysiol. 1989;61:589–606. doi: 10.1152/jn.1989.61.3.589. [DOI] [PubMed] [Google Scholar]
- 7.Barlow HB. A theory about the functional role and synaptic mechanisms of visual after-effects. In: Blakemore C, editor. Vision: coding and efficiency. Cambridge UP; Cambridge: 1990. pp. 363–375. [Google Scholar]
- 8.Barlow HB. The knowledge used in vision and where it comes from. Philos Trans R Soc Lond B Biol Sci. 1997;352:1141–1147. doi: 10.1098/rstb.1997.0097. [DOI] [PMC free article] [PubMed] [Google Scholar]
- 9.Berkley MA. Behavioral determination of the spatial selectivity of contrast adaptation in cats: some evidence for a common plan in the mammalian visual system. Vis Neurosci. 1990;4:413–426. doi: 10.1017/s0952523800005174. [DOI] [PubMed] [Google Scholar]
- 10.Blakemore CB, Campbell FW. On the existence of neurones in the human visual system selectively sensitive to the orientation and size of retinal images. J Physiol (Lond) 1969;203:237–260. doi: 10.1113/jphysiol.1969.sp008862. [DOI] [PMC free article] [PubMed] [Google Scholar]
- 11.Blakemore C, Muncey JP, Ridley RM. Stimulus specificity in the human visual system. Vision Res. 1973;13:1915–1931. doi: 10.1016/0042-6989(73)90063-1. [DOI] [PubMed] [Google Scholar]
- 12.Bergman C. Increase of sodium concentration near the inner surface of the nodal membrane. Pflügers Arch. 1970;317:287–302. doi: 10.1007/BF00586578. [DOI] [PubMed] [Google Scholar]
- 13.Bischoff U, Vogel W, Safronov BV. Na+-activated K+ channels in small dorsal root ganglion neurones of rat. J Physiol (Lond) 1998;510:743–754. doi: 10.1111/j.1469-7793.1998.743bj.x. [DOI] [PMC free article] [PubMed] [Google Scholar]
- 14.Bonds AB. Temporal dynamics of contrast gain in single cells of the cat striate cortex. Vis Neurosci. 1991;6:239–255. doi: 10.1017/s0952523800006258. [DOI] [PubMed] [Google Scholar]
- 15.Carandini M, Ferster D. A tonic hyperpolarization underlying contrast adaptation in cat visual cortex. Science. 1997;276:949–952. doi: 10.1126/science.276.5314.949. [DOI] [PubMed] [Google Scholar]
- 16.Carandini M, Barlow HB, O'Keefe LP, Poirson AB, Movshon JA. Adaptation to contingencies in macaque primary visual cortex. Philos Trans R Soc Lond B Biol Sci. 1997;352:1149–1154. doi: 10.1098/rstb.1997.0098. [DOI] [PMC free article] [PubMed] [Google Scholar]
- 17.Constanti A, Sim JA. Calcium-dependent potassium conductance in guinea-pig olfactory cortex neurons in vitro. J Physiol (Lond) 1987;387:173–194. doi: 10.1113/jphysiol.1987.sp016569. [DOI] [PMC free article] [PubMed] [Google Scholar]
- 18.Crill WE. Persistent sodium current in mammalian central neurons. Annu Rev Physiol. 1996;58:349–362. doi: 10.1146/annurev.ph.58.030196.002025. [DOI] [PubMed] [Google Scholar]
- 19.Dealy RS, Tolhurst DJ. Is spatial adaptation an after-effect of prolonged inhibition? J Physiol (Lond) 1974;241:261–270. doi: 10.1113/jphysiol.1974.sp010652. [DOI] [PMC free article] [PubMed] [Google Scholar]
- 20.Dean AF. Adaptation-induced alteration of the relation between response amplitude and contrast in cat striate cortical neurones. Vision Res. 1983;23:249–256. doi: 10.1016/0042-6989(83)90113-x. [DOI] [PubMed] [Google Scholar]
- 21.Douglas RJ, Martin KAC. A functional microcircuit for cat visual circuit. J Physiol (Lond) 1991;440:735–769. doi: 10.1113/jphysiol.1991.sp018733. [DOI] [PMC free article] [PubMed] [Google Scholar]
- 22.Dryer SE. Na+-activated K+ channels: a new family of large-conductance ion channels. Trends Neurosci. 1994;17:155–160. doi: 10.1016/0166-2236(94)90093-0. [DOI] [PubMed] [Google Scholar]
- 23.Egan TM, Dagan D, Kupper J, Levitan IB. Na+-activated K+ channels are widely distributed in rat CNS and Xenopus oocytes. Brain Res. 1992a;584:319–321. doi: 10.1016/0006-8993(92)90913-t. [DOI] [PubMed] [Google Scholar]
- 24.Egan TM, Dagan D, Kupper J, Levitan IB. Properties and rundown of sodium-activated potassium channels in rat olfactory bulb neurons. J Neurosci. 1992b;12:1964–1976. doi: 10.1523/JNEUROSCI.12-05-01964.1992. [DOI] [PMC free article] [PubMed] [Google Scholar]
- 25.Foehring RC, Schwindt PC, Crill WE. Norepinephrine selectively reduces slow Ca2+- and Na+ mediated K+ currents in cat neocortical neurons. J Neurophysiol. 1989;61:245–256. doi: 10.1152/jn.1989.61.2.245. [DOI] [PubMed] [Google Scholar]
- 26.Friedman A, Arens J, Heinemann U, Gutnick MJ. Slow depolarizing afterpotentials in neocortical neurons are sodium and calcium dependent. Neurosci Lett. 1992;135:13–17. doi: 10.1016/0304-3940(92)90125-q. [DOI] [PubMed] [Google Scholar]
- 27.Galvan M, Dorge A, Beck F, Rick R. Intracellular electrolyte concentrations in rat sympathetic neurones measured with an electron microprobe. Pflügers Arch. 1984;400:274–279. doi: 10.1007/BF00581559. [DOI] [PubMed] [Google Scholar]
- 28.Georgeson MA, Harris MG. Spatial selectivity of contrast adaptation: model and data. Vision Res. 1984;24:729–741. doi: 10.1016/0042-6989(84)90214-1. [DOI] [PubMed] [Google Scholar]
- 29.Gilbert CD. Adult cortical dynamics. Physiol Rev. 1998;78:467–485. doi: 10.1152/physrev.1998.78.2.467. [DOI] [PubMed] [Google Scholar]
- 30.Glynn IM, Karlish SJD. The sodium pump. Annu Rev Physiol. 1975;37:13–55. doi: 10.1146/annurev.ph.37.030175.000305. [DOI] [PubMed] [Google Scholar]
- 31.Grafe P, Rimpel J, Reddy MM, Bruggencate G. Changes of intracellular sodium and potassium ion concentrations in frog spinal motoneurons induced by repetitive synaptic stimulation. Neuroscience. 1982;7:2113–3220. doi: 10.1016/0306-4522(82)90243-3. [DOI] [PubMed] [Google Scholar]
- 32.Gustafsson B, Wigström H. Hyperpolarization following long-lasting tetanic activation of hippocampal pyramidal cells. Brain Res. 1983;275:159–163. doi: 10.1016/0006-8993(83)90429-8. [DOI] [PubMed] [Google Scholar]
- 33.Haimann C, Magistretti J, Pozzi B. Sodium-activated potassium current in sensory neurons: a comparison of cell-attached and cell-free single-channel activities. Pflügers Arch. 1992;422:287–294. doi: 10.1007/BF00376215. [DOI] [PubMed] [Google Scholar]
- 34.Haj-Dahmane S, Andrade R. Ionic mechanism of the slow afterdepolarization induced by muscarinic receptor activation in rat prefrontal cortex. J Neurophysiol. 1998;80:1197–1210. doi: 10.1152/jn.1998.80.3.1197. [DOI] [PubMed] [Google Scholar]
- 35.Hammett ST, Snowden RJ, Smith AT. Perceived contrast as a function of adaptation duration. Vision Res. 1994;34:31–40. doi: 10.1016/0042-6989(94)90254-2. [DOI] [PubMed] [Google Scholar]
- 36.Horikawa K, Armstrong WE. A versatile means of intracellular labeling: injection of biocytin and its detection with avidin conjugates. J Neurosci Methods. 1988;25:1–11. doi: 10.1016/0165-0270(88)90114-8. [DOI] [PubMed] [Google Scholar]
- 37.Inoue N, Matsui H. Activation of a brain type Na pump after glutamate excitation of cerebral neurons. Brain Res. 1990;534:309–312. doi: 10.1016/0006-8993(90)90146-3. [DOI] [PubMed] [Google Scholar]
- 38.Kameyama M, Kakei M, Sato R, Shibasaki T, Matsuda H, Irisawa H. Intracellular Na+ activates a K+ channel in mammalian cardiac cells. Nature. 1984;369:354–356. doi: 10.1038/309354a0. [DOI] [PubMed] [Google Scholar]
- 39.Kim U, McCormick DA. Functional and ionic properties of a slow afterhyperpolarization in ferret perigeniculate neurons in vitro. J Neurophysiol. 1998;80:1222–1235. doi: 10.1152/jn.1998.80.3.1222. [DOI] [PubMed] [Google Scholar]
- 40.Koh D-S, Jonas P, Vogel W. Na+-activated K+ channels localized in the nodal region of myelinated axons of Xenopus. J Physiol (Lond) 1994;479:183–197. doi: 10.1113/jphysiol.1994.sp020287. [DOI] [PMC free article] [PubMed] [Google Scholar]
- 41.Koike H, Mano N, Okada Y, Oshima T. Repetitive impulses generated in fast and slow pyramidal tract cells by intracellularly applied current steps. Exp Brain Res. 1970;11:263–281. doi: 10.1007/BF01474386. [DOI] [PubMed] [Google Scholar]
- 42.Kubota M, Saito N. Sodium- and calcium-dependent conductances of neurones in the zebra finch hyperstriatum ventrale pars caudale in vitro. J Physiol (Lond) 1991;440:131–142. doi: 10.1113/jphysiol.1991.sp018700. [DOI] [PMC free article] [PubMed] [Google Scholar]
- 43.Liu Y, Wang X-J, Sanchez-Vives MV, McCormick DA. Intrinsic membrane properties contribute to temporal de-correlation by single neurons in the visual cortex: model and experiment. Soc Neurosci Abstr. 1999;25:277. [Google Scholar]
- 44.Llinás R, Lopez-Barneo J. Electrophysiology of tectal neurons in vitro. II. Long term adaptation. J Neurophysiol. 1988;60:869–878. doi: 10.1152/jn.1988.60.3.869. [DOI] [PubMed] [Google Scholar]
- 45.Lorenceau J. Recovery from contrast adaptation: effects of spatial and temporal frequency. Vision Res. 1987;27:2185–2191. doi: 10.1016/0042-6989(87)90133-7. [DOI] [PubMed] [Google Scholar]
- 46.Lowe DA, Richardson BP, Taylor P, Donatsch P. Increasing sodium triggers calcium release from bound pools. Nature. 1976;260:337–338. doi: 10.1038/260337a0. [DOI] [PubMed] [Google Scholar]
- 47.Määttänen LM, Koenderink JJ. Contrast adaptation and contrast gain control. Exp Brain Res. 1991;87:205–212. doi: 10.1007/BF00228521. [DOI] [PubMed] [Google Scholar]
- 48.Madison DV, Nicoll RA. Control of the repetitive discharge of rat CA1 pyramidal neurones in vitro. J Physiol (Lond) 1984;354:319–331. doi: 10.1113/jphysiol.1984.sp015378. [DOI] [PMC free article] [PubMed] [Google Scholar]
- 49.Maffei L, Fiorentini A, Bisti S. Neural correlate of perceptual adaptation to gratings. Science. 1973;182:1036–1038. doi: 10.1126/science.182.4116.1036. [DOI] [PubMed] [Google Scholar]
- 50.Marlin SG, Hasan SJ, Cynader MS. Direction-selective adaptation in simple and complex cells in cat striate cortex. J Neurophysiol. 1988;59:1314–1330. doi: 10.1152/jn.1988.59.4.1314. [DOI] [PubMed] [Google Scholar]
- 51.McCormick DA, Connors BW, Lighthall JW, Prince DA. Comparative electrophysiology of pyramidal and sparsely spiny neurons of the neocortex. J Neurophysiol. 1985;54:782–806. doi: 10.1152/jn.1985.54.4.782. [DOI] [PubMed] [Google Scholar]
- 52.Movshon JA, Lennie P. Pattern-selective adaptation in visual cortical neurones. Nature. 1979;278:850–852. doi: 10.1038/278850a0. [DOI] [PubMed] [Google Scholar]
- 53.Nowak LG, Sanchez-Vives MV, McCormick DA. Influence of low and high frequency fluctuations on spike timing in visual cortical neurons. Cereb Cortex. 1997;7:487–501. doi: 10.1093/cercor/7.6.487. [DOI] [PubMed] [Google Scholar]
- 54.Ohzawa I, Sclar G, Freeman RD. Contrast gain control in cat's visual system. J Neurophysiol. 1985;54:651–667. doi: 10.1152/jn.1985.54.3.651. [DOI] [PubMed] [Google Scholar]
- 55.Pape HC, McCormick DA. Electrophysiological and pharmacological properties of interneurons in the cat dorsal lateral geniculate nucleus. Neuroscience. 1995;68:1105–1125. doi: 10.1016/0306-4522(95)00205-w. [DOI] [PubMed] [Google Scholar]
- 56.Pennefather P, Lancaster B, Adams PR, Nicoll RA. Two distinct Ca-dependent K currents in bullfrog sympathetic ganglion cells. Proc Natl Acad Sci USA. 1985;82:3040–3044. doi: 10.1073/pnas.82.9.3040. [DOI] [PMC free article] [PubMed] [Google Scholar]
- 57.Pineda JC, Waters RS, Foehring RC. Specificity in the interaction of HVA Ca2+ channel types with Ca2+-dependent AHPs and firing behavior in neocortical pyramidal neurons. J Neurophysiol. 1998;79:2522–2534. doi: 10.1152/jn.1998.79.5.2522. [DOI] [PubMed] [Google Scholar]
- 58.Rodrigo GC. The Na+-dependence of Na+-activated K+-channels (IK(Na)) in guinea pig ventricular myocytes, is different in excised inside/out patches and cell attached patches. Pflügers Arch. 1993;422:530–532. doi: 10.1007/BF00375082. [DOI] [PubMed] [Google Scholar]
- 59.Safronov BV, Vogel W. Properties and functions of Na(+)-activated K+ channels in the soma of rat motoneurones. J Physiol (Lond) 1996;497:727–734. doi: 10.1113/jphysiol.1996.sp021803. [DOI] [PMC free article] [PubMed] [Google Scholar]
- 60.Sah P. Ca2+ activated K+ currents in neurons: types, physiological roles and modulation. Trends Neurosci. 1996;19:150–154. doi: 10.1016/s0166-2236(96)80026-9. [DOI] [PubMed] [Google Scholar]
- 61.Sanchez-Vives MV, Nowak LG, McCormick DA. Cellular and network mechanisms generating adaptation to contrast in the visual cortex: an in vivo and in vitro study. Soc Neurosci Abstr. 1997;23:1944. [Google Scholar]
- 62.Sanchez-Vives MV, Nowak LG, McCormick DA. Membrane mechanisms underlying contrast adaptation in cat area 17 in vivo. J Neurosci. 2000;20:4267–4285. doi: 10.1523/JNEUROSCI.20-11-04267.2000. [DOI] [PMC free article] [PubMed] [Google Scholar]
- 63.Saul AB, Cynader M. Adaptation in single units in the visual cortex: the tuning of aftereffects in the spatial domain. Vis Neurosci. 1989;2:609–620. doi: 10.1017/s0952523800003539. [DOI] [PubMed] [Google Scholar]
- 64.Schwindt PC, Spain WJ, Foehring RC, Stafstrom CE, Chubb MC, Crill WE. Multiple potassium conductances and their functions in neurons from cat sensorimotor cortex in vitro. J Neurophysiol. 1988;59:424–449. doi: 10.1152/jn.1988.59.2.424. [DOI] [PubMed] [Google Scholar]
- 65.Schwindt PC, Spain WJ, Crill WE. Long-lasting reduction of excitability by a sodium-dependent potassium current in cat neocortex neurons. J Neurophysiol. 1989;61:233–244. doi: 10.1152/jn.1989.61.2.233. [DOI] [PubMed] [Google Scholar]
- 66.Schwindt PC, Spain WJ, Crill WE. Calcium-dependent potassium currents in neurons in cat sensorimotor cortex. J Neurophysiol. 1992;67:216–226. doi: 10.1152/jn.1992.67.1.216. [DOI] [PubMed] [Google Scholar]
- 67.Schwindt P, O'Brien JA, Crill WE. Quantitative analysis of firing properties of pyramidal neurons from layer 5 of rats sensorimotor cortex. J Neurophysiol. 1997;77:2484–2498. doi: 10.1152/jn.1997.77.5.2484. [DOI] [PubMed] [Google Scholar]
- 68.Sclar G, Lennie P, DePriest DD. Contrast adaptation in striate cortex of macaque. Vision Res. 1989;29:747–755. doi: 10.1016/0042-6989(89)90087-4. [DOI] [PubMed] [Google Scholar]
- 69.Shou T, Li X, Zhou Y, Hu B. Adaptation of visually evoked responses of relay cells in the dorsal lateral geniculate nucleus of the cat following prolonged exposure to drifting gratings. Vis Neurosci. 1996;13:605–613. doi: 10.1017/s0952523800008518. [DOI] [PubMed] [Google Scholar]
- 70.Storm JF. Functional diversity of K+ currents in hippocampal pyramidal neurons. Semin Neurosci. 1993;5:79–92. [Google Scholar]
- 71.Stafstrom CE, Schwindt PC, Crill WE. Repetitive firing in layer V neurons from cat neocortex in vitro. J Neurophysiol. 1984;52:264–277. doi: 10.1152/jn.1984.52.2.264. [DOI] [PubMed] [Google Scholar]
- 72.Stafstrom CD, Schwindt PC, Chubb MC, Crill WE. Properties of persistent sodium conductance and calcium conductance of layer V neurons from cat sensorimotor cortex in vitro. J Neurophysiol. 1985;53:153–170. doi: 10.1152/jn.1985.53.1.153. [DOI] [PubMed] [Google Scholar]
- 73.Swift DJ, Smith RA. An action spectrum for spatial-frequency adaptation. Vision Res. 1982;22:235–246. doi: 10.1016/0042-6989(82)90123-7. [DOI] [PubMed] [Google Scholar]
- 74.Thomas RC. Electrogenic sodium pump in nerve and muscle cells. Physiol Rev. 1972;52:563–594. doi: 10.1152/physrev.1972.52.3.563. [DOI] [PubMed] [Google Scholar]
- 75.Thompson SM, Prince DA. Activation of electrogenic sodium pump in hippocampal CA1 neurons following glutamate-induced depolarization. J Neurophysiol. 1986;56:507–522. doi: 10.1152/jn.1986.56.2.507. [DOI] [PubMed] [Google Scholar]
- 76.Vautin RG, Berkley MA. Responses of single cells in cat visual cortex to prolonged stimulus movement: neural correlates of visual aftereffects. J Neurophysiol. 1977;40:1051–1065. doi: 10.1152/jn.1977.40.5.1051. [DOI] [PubMed] [Google Scholar]


