

Abstract
The cone signal reaches the cat's On-β (X) ganglion cell via several parallel circuits (bipolar cell types b1, b2, and b3). These circuits might convey different regions of the cone's temporal bandwidth. To test this, I presented a step of light that elicited a transient depolarization followed by a sustained depolarization. The contribution of bipolar cells to these response components was isolated by blocking action potentials with tetrodotoxin and by blocking inhibitory synaptic potentials with bicuculline and strychnine. Stationary fluctuation analysis of the sustained depolarization gave the rate of quantal bombardment: ∼5100 quanta sec−1 for small central cells and ∼45,000 quanta sec−1 for large peripheral cells. Normalizing these rates for the vastly different numbers of bipolar synapses (150–370 per small cell vs 2000 per large cell), quantal rate was constant across the retina, ∼22 quanta synapse−1 sec−1. Nonstationary fluctuation analysis gave the mean quantal EPSP amplitude: ∼240 μV for the transient depolarization and 30 μV for the sustained depolarization. The b1 bipolar cell is known from noise analysis of the On-α ganglion cell to have a near-maximal sustained release of only approximately two quanta synapse−1 sec−1. This implies that the other bipolar types (b2 and b3) contribute many more quanta to the sustained depolarization (≥46 synapse−1 sec−1). Type b1 probably contributes large quanta to the transient depolarization. Thus, bipolar cell types b1 and b2/b3 apparently constitute parallel circuits that convey, respectively, high and low frequencies.
Keywords: quantal rate, ganglion cell, vesicular release, retina, parallel pathways, ribbon synapse
Commonly in the CNS, a signal is transmitted forward by multiple pathways operating in parallel. The function of such parallelism is rarely apparent, and thus the pathways are often considered merely “redundant.” Yet redundancy is an unlikely explanation because there is selective pressure for the brain to use space efficiently (Panico and Sterling, 1995; Hsu et al., 1998). Possibly, parallel pathways might carry different components of the overall signal. Here, I explore this hypothesis for a system of parallel circuits in cat retina that connect cones to the On-β (X) ganglion cell.
Seventy percent of the synapses to the β cell, known for its linear response to light, are of the “ribbon” type from cone bipolar cells (Kolb, 1979; McGuire et al., 1986). Three types of bipolar cell contribute substantially; roughly half of the contacts are from type b1, and the rest are from types b2 and b3 (Cohen and Sterling, 1992). All three bipolar types collect from the same patch of cones, so they must carry the same spatial and spectral information (Cohen and Sterling, 1990). However, they might carry different temporal information. Indeed, the response of the β cell does exhibit two temporal components, transient and sustained, that make it sensitive, respectively, to high and low frequencies (Cleland et al., 1973; Victor and Shapley, 1979; Frishman et al., 1987).
Type b1 is thought to convey the transient component of the β cell because b1 provides nearly all of the bipolar input to the On-α ganglion cell, whose transient component is large (Freed and Sterling, 1988). Types b2 and b3 are hypothesized to convey the sustained component of the β cell because they do not contribute to the α cell but do contribute to the β cell, whose sustained component is large. To test this hypothesis, I analyzed the voltage noise of the β cell in response to a light step. This analysis provided an estimate of the rate and size of quantal EPSPs. Under the experimental conditions, glutamatergic bipolar synapses provide virtually all of the response, and a basic assumption of noise analysis, which asynchronous quanta follow Poisson statistics, is well supported (Matsui et al., 1998; Freed, 2000). Noise analysis of the α ganglion cell had already given the sustained quantal rate of the b1 bipolar cell (Freed, 2000). Therefore, this rate could be subtracted to give a lower limit of average sustained rate for types b2 and b3: ∼20-fold higher than for type b1. Thus, types b2 and b3 provide nearly all quanta during the sustained response, supporting the idea that parallel circuits convey different temporal components of the overall signal.
MATERIALS AND METHODS
Detailed methods of intracellular recording have been described previously (Freed, 2000). A cat, anesthetized with ketamine and pentobarbital, was enucleated and then overdosed with pentobarbital. A portion of the back of the eye, including neural retina, pigment epithelium, and sclera, was excised and placed in a chamber. The retina was kept in tissue culture medium (minimal essential medium; Life Technologies, Grand Island, NY), which was bubbled with a mixture of 95% oxygen–5% carbon dioxide, maintained at 34°C, and flowed at 1–2 ml/min. Pharmacological agents were introduced into the medium; these included tetrodotoxin (Sigma, St. Louis, MO), bicuculline methobromide (Research Biochemicals, Natick, MA), and strychnine (Research Biochemicals).
Recording and staining. Intracellular electrodes were pulled to tip resistances of 100–400 MΩ and filled with 2% neurobiotin in 3 m KCl buffered with 0.1 m Tris, pH 7.3, or 3% horseradish peroxidase (HRP) in 1 m KCl buffered with 0.05 m Tris, pH 8.6. Membrane voltages were obtained using an electrometer and stored on an instrumental recorder. Recordings were low-pass filtered (four-pole, Bessel, fc = 500) and digitized at 1000 Hz. A high gain (1V/mV) was used during recording to ensure that voltage noise (∼400 μV) ranged over approximately seven bits. The baseline voltage in the dark was subtracted from each response to keep voltages within the ranges of the recorder and digitizer (10 V). Digitized voltages were analyzed using a personal computer and scientific analysis software (IGOR; Wavemetrics, Lake Oswego, OR). To compute power density spectra, time intervals of 512–2048 digitized points were multiplied by a Hanning window and were fast-Fourier transformed.
After recording, a cell was iontophoresed with either neurobiotin using a pulsed +2 nA current (10 Hz, 50% duty cycle, 15 min) or HRP using a continuous +5 nA current (1 min). The retina was then fixed with 4% paraformaldehyde in phosphate buffer. Neurobiotin and HRP were converted into dark reaction products using standard methods (Adams, 1977; Vaney, 1991, 1992), and filled cells were drawn using a camera lucida and a 100× objective.
Photic stimulation. Light from a mercury or xenon arc lamp illuminated a rectangular aperture that was focused on the retina. Light intensity was adjusted with neutral density filters and interrupted by an electromagnetic shutter. Light was monochromatic because of an interference filter (650 ± 15 nm). Light intensity was ∼106 photons μm−2 sec−1, which caused ∼5000 R* sec−1 rod−1 (Freed, 2000) and saturated the rod response (half saturation, 100 R* rod−1 sec−1) (Schneeweis and Schnapf, 1999). This stimulus was presented for 1–2 sec every 3–6 sec. Between stimuli, the retina was in dim red light (termed “dark” in Results) (Kodak Safelight 1A, 440 nm cutoff; Eastman Kodak, Rochester, NY), which allowed the rod response to recover. Under these conditions, the initial 100–300 msec of the response has both rod and cone components; the remaining response had only a cone component (Freed et al., 1996).
Potential sources of error. Several sources of noise upstream of the bipolar terminal might modulate its quantal release and thus contribute voltage noise to the On-β cell. This would cause overestimates of quantal size and underestimates of quantal rate (Wong and Knight, 1980). Fluctuations in the current supplying the illuminator caused small fluctuations in intensity but have been shown to be insignificant (Freed, 2000). Poisson arrival of photons and release of transmitter quanta from the photoreceptor terminals also added noise but can be calculated (below) to be negligible.
Photon noise was calculated as follows. For shot noise (Rice, 1954), the relationship between the mean v, duration of the shot event T, event rate n, and variance ς2 is
| Equation 1 |
Small central β cells had the smallest light-evoked variances, so their estimated quantal rates would be most affected by photon noise (Table 1). Their sustained responses (i.e., change in mean, Δv) from the receptive field center averaged 1 mV. The photon capture rate nR* was calculated from the number of photoreceptors in the receptive field center; the stimulus was an elongated bar that covered a 60 μm strip through the center of a 400-μm-wide receptive field center (4 ∗ rc, where rc is measured as described by Freed and Nelson, 1994). Thus, this strip had an area of ∼24,000 μm2 and contained ∼10,800 rods and ∼144 cones (for photoreceptor densities see Steinberg et al., 1973). In the dark, photon noise is negligible, and during the stimulus, the rod response is saturated. Thus, virtually all photon noise in the ganglion cell response comes from cones in the light. For a stimulus intensity of 106 photons μm−2sec−1, the photon capture rate by a single cone is ∼2 × 10⁵ R* sec−1 (for details of calculation, see Freed, 2000). Thus, the total capture rate for all stimulated cones (nR* = photon capture rate ∗ number of cones) is ∼107. The duration of the photon event, TR*, is ∼100 msec (Baylor et al., 1984). Thus, from Equation 1, the light-evoked voltage variance attributable to photon events (ςR*2) is ∼10−12 V2, which is negligible compared with the total light-evoked variance measured in central neurons (∼10−8 V2).
Table 1.
Fluctuation analysis of 13 On-β cells
| Cell (#) | ecc (°) | dfd* (μm) | Δv (mV) | ςd2 (nV2) | ςl2 (nV2) | Δς2 (nV2) | τ (msec) | k | T(msec) | ntotalτ (103sec−1) | ntotalT (103sec−1) | ntotalavg (103sec−1) | #syn | nsyn (sec−1 syn−1) | a (μV) |
|---|---|---|---|---|---|---|---|---|---|---|---|---|---|---|---|
| Central cells | |||||||||||||||
| 1 | 3 | 30 | 0.5 ± 0.1 | 11 ± 2 | 16 ± 4 | 6 ± 2 | 6 | 2.2 | 14 | 4.3 | 3.7 | 4.0 | 150 | 27 | 19 |
| 2 | 5 | — | 1.3 ± 0.1 | 14 ± 1 | 41 ± 3 | 27 ± 3 | 6 | 1.4 | 6 | 6.5 | 4.9 | 5.7 | 260 | 22 | 33 |
| 3 | 5 | 70 | 0.9 ± 0.6 | 23 ± 1 | 36 ± 4 | 15 ± 3 | 8 | 0.8 | 13 | 4.2 | 5.2 | 4.7 | 260 | 18 | 12 |
| 4 | 7 | — | 1.1 ± 1.0 | 11 ± 1 | 31 ± 3 | 20 ± 3 | 5 | 1.2 | 16 | 7.6 | 4.7 | 6.1 | 370 | 17 | 29 |
| Mean | 50 ± 20 | 1.0 ± 0.2 | 15 ± 3 | 31 ± 5 | 17 ± 4 | 6 ± 1 | 1.4 ± 0.3 | 15 ± 1 | 5.7 ± 0.8 | 4.6 ± 0.3 | 5.1 ± 0.5 | 21 ± 2 | 23 ± 5 | ||
| Peripheral cells | |||||||||||||||
| 5 | 14 | 150 | 6.0 ± 0.1 | 197 ± 14 | 269 ± 44 | 72 ± 40 | 4 | 1.4 | 11 | 78 | 57 | 67 | 2000 | 34 | 19 |
| 6 | 18 | 200 | 4.9 ± 0.5 | 223 ± 17 | 326 ± 32 | 102 ± 21 | 3 | 1.0 | 8 | 49 | 37 | 43 | 2000 | 21 | 33 |
| 7 | 18 | — | 2.9 ± 0.1 | 156 ± 7 | 297 ± 6 | 141 ± 8 | 2 | 1.1 | 6 | 19 | 12 | 16 | 2000 | 8 | 78 |
| 8 | 23 | 290 | 7.8 ± 0.2 | 248 ± 10 | 474 ± 25 | 226 ± 29 | 3 | 1.0 | 8 | 56 | 42 | 49 | 2000 | 25 | 46 |
| 9 | 23 | 230 | 6.9 ± 0.4 | 427 ± 21 | 548 ± 34 | 121 ± 30 | 4 | 1.1 | 5 | 61 | 98 | 80 | 2000 | 40 | 28 |
| 10 | 28 | — | 2.6 ± 0.4 | 69 ± 12 | 87 ± 14 | 18 ± 7 | 7 | 1.3 | 14 | 34 | 34 | 34 | 2000 | 17 | 11 |
| 11 | 28 | — | 1.8 ± 0.1 | 25 ± 3 | 42 ± 7 | 17 ± 4 | 5 | 1.6 | 8 | 24 | 30 | 27 | 2000 | 13 | 15 |
| 12 | 28 | — | 4.8 ± 0.1 | 410 ± 17 | 571 ± 28 | 161 ± 20 | 19 | 0.7 | 12 | 5 | 15 | 10 | 2000 | 5 | 54 |
| 13 | 37 | 240 | 3.0 ± 0.7 | 51 ± 2 | 67 ± 2 | 16 ± 3 | 4 | 1.2 | 10 | 88 | 70 | 79 | 2000 | 40 | 9 |
| Mean | 222 ± 23 | 4.5 ± 0.7 | 201 ± 49 | 298 ± 68 | 97 ± 25 | 6 ± 2 | 1.2 ± 0.2 | 9 ± 1 | 46 ± 9 | 44 ± 9 | 45 ± 9 | 23 ± 4 | 33 ± 8 | ||
| Mean for all cells | 6 ± 1 | 1.2 ± 0.1 | 11 ± 1 | 22 ± 3 | 30 ± 6 | ||||||||||
ecc, Distance from area centralis (calculated from 1° = 227 μm; Bishop et al., 1962); dfd, dendritic field diameter; Δv, sustained response; ςd2, variance in dark; ςl2, variance in light during sustained depolarization; Δς2, light-evoked variance; τ, time constant for decay; k, exponent from fit to power spectrum; T, quantal duration from autocorrelation; ntotalτ, ntotalT, total quantal rate for all bipolar synapses using τ or T (corrected for quantal variation, see Materials and Methods); ntotalavg, average of ntotalτ and ntotalT;
syn, number of bipolar synapses; nsyn, quantal rate at single bipolar cell synapse; ± denotes SEM; * omitted where staining was incomplete.
Noise from quantal release from photoreceptor terminals in the dark was also calculated using Equation 1. Again small, central cells would be most affected. The lower bound of quantal rate, nrc, which results in an upper bound for variance, was calculated from the number of photoreceptor synapses within the receptive field center of the On-β cell and their estimated quantal rates. Because the stimulus rate was low enough (∼0.3 Hz) to allow rod responses to recover (see above), rods contributed as well as cones. Because there were ∼10,800 stimulated rods (each with 1 synapse) (Rao et al., 1995) and ∼144 cones (each with 12 synapses) (Sterling and Harkins, 1990), ∼12,500 stimulated photoreceptor synapses provide input to bipolar cells that converge upon the On-β cell. The sustained quantal rate of a photoreceptor ribbon synapse is between 20 and 100 sec−1 (Ashmore and Copenhagen, 1983; Rao et al., 1994; Rieke and Schwartz, 1996), so the total quantal rate was >250,000 sec−1. Because of filtering by membrane capacitance, these quantal events have the same duration, Trc, as events from quantal release at bipolar terminals, ∼10 msec. This results in a total variance, ςrc2, of <10−10 V2, which is negligible.
Another potential source of error is synaptic saturation, which can occur if total quantal conductance approaches the cell's input conductance (Koch et al., 1982; Freed et al., 1992). Then the response would be reduced more than the associated change in voltage variance, causing an underestimate of quantal rate. In the present study, response saturation was minimized by holding the stimulus intensity within the linear range.
The final potential source of error is a linear trend in the data as a result of electrode drift or a gradual decline in the cell's sustained depolarization. Uncorrected, a linear trend would add to the voltage variance, causing an underestimate of quantal rate and an overestimate of quantal amplitude. Linear trends were corrected by calculating a regression fit to the data and then subtracting the regression slope from this data. For analysis of stationary fluctuations, this correction was applied to short intervals independently (see Results). Thus, each interval was fully corrected for the particular linear trend that it contained. For ensemble analysis, however, the regression fit from the baseline data in the dark was applied to data during the response. If the linear trend in baseline and response differed, then correction of the response was incomplete. This caused an artifactual increase in variance. Consequently, although ensemble analysis inflated quantal size, it did give relative size between transient and sustained responses (see Results).
Adjustment for variation in quantal size. The greatest source of error is variation in quantal size (Freed, 2000). The coefficient of variation in ganglion cells is ∼50% (Taylor et al., 1995). This would cause the quantal rate to be underestimated and the quantal amplitude to be overestimated by ∼25% (Katz and Miledi, 1972). Thus, the calculated quantal rates and amplitudes were adjusted by this factor.
RESULTS
Voltage noise from bipolar cell synapses
On-β ganglion cells were identified by their medium somas (∼25 μm diameter in peripheral retina, ∼15 μm near the central area) and their bushy dendritic arbors (Fig.1A). Thirteen cells were analyzed in detail (Table 1); all were selected for their large action potentials (>35 mV) and resting membrane potentials more negative than −50 mV. The stimulus was a 1 sec, 400-μm-wide bar that stimulated all the bipolar cells presynaptic to the β cell (because their receptive fields are in register) (Cohen and Sterling, 1990). Stimulus intensity was adjusted (while observing the oscilloscope trace) to produce a near-maximal center response. This response consisted of a transient depolarization and a burst of spikes, followed by a sustained depolarization and a train of spikes (Fig.1B). The membrane voltage fluctuated between spikes, and when these were blocked with TTX (30 nm), this voltage noise could be seen more clearly (Fig. 1C).
Fig. 1.
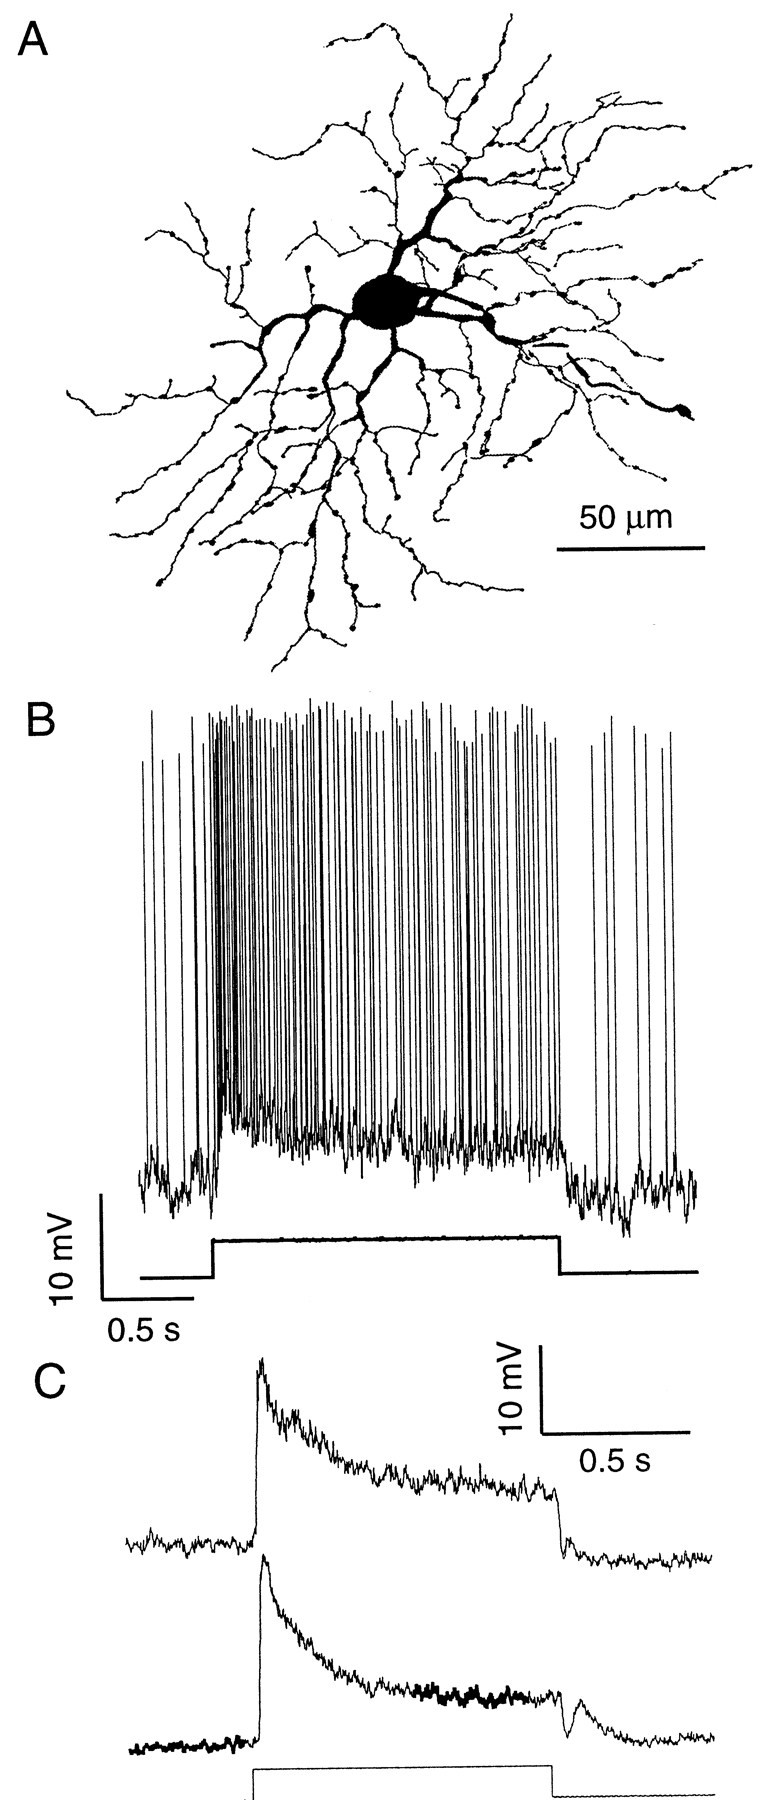
Fluctuation analysis of synaptic noise in On-β cell. A, Camera lucida drawing of stained cell 13. B, Response to step of light. C, Responses during application of TTX (cell 6). Top trace, Application of only TTX; bottom trace, application of TTX plus bicuculline and strychnine. Note that light increases voltage noise. Heavy line shows intervals used for fluctuation analysis. This cell had a relatively large transient depolarization; all other cells had a smaller transient (B) (Fig. 4A).
To isolate noise caused by bipolar input, amacrine input was blocked with the GABAA antagonist bicuculline (50 μm) and the glycine receptor antagonist strychnine (0.5 μm). This caused a nonspecific decrease in voltage noise both in darkness and during the sustained response to light (Fig. 1C). However, these antagonists did not significantly affect the light-evoked noise, nor did they significantly affect the magnitude of the sustained response (as has been found before for this cell type) (Caldwell et al., 1978; Saito, 1981, 1983; Bolz et al., 1985). GABAB and GABAC antagonists were omitted because the On-β cell lacks the corresponding receptors (Cohen et al., 1994).
Fluctuation analysis of sustained depolarization
The sustained response and its accompanying light-evoked noise were analyzed to obtain the sustained rate of quantal bombardment on a ganglion cell. As an example, consider cell 13, whose morphology and response are shown in Figure 1. The sustained depolarization of this cell (Δv) was 3.0 mV, and the variance averaged over 1 sec intervals was 5.1 10−2 mV2 in the dark (ςd2) and 6.7 × 10⁻² mV2 in the light (ςl2). The difference between these two variances, i.e. the variance evoked by light (Δς2), was 1.6 × 10⁻²mV2. The time constant of the postsynaptic event, τ, was derived from the power spectrum of the light-evoked noise (Fig. 2), which was fit with a Lorentzian function taken to the power k:
| Equation 2 |
The parameter A is a scaling constant. The best fit to the spectrum resulted in τ of 4.3 msec and k = 1.2. With these parameters, Equation 2 approximates a simple Lorentzian function (i.e., K = 1). Thus, they are consistent with a quantum whose decay is exponential and whose form is f(t) = ae−t/τ, where a is the peak amplitude (Katz and Miledi, 1972). Given this form of quantal event, one can calculate the total quantal rate upon the β cell (Katz and Miledi, 1972) as
| Equation 3 |
The calculated light-evoked rate, adjusted for variation in quantal size by multiplying by 1.25 (see Materials and Methods), was 88,000 quanta sec−1.
Fig. 2.

Spectral analysis. A. Power spectra from cell 4 of noise before stimulus (○) and during sustained depolarization (●). B, Power spectrum of light-evoked noise. This is the difference between two spectra in A,smoothed by averaging over three points below 20 Hz and otherwise over five points. The spectrum is fit with Equation 2 (solid line; see Results), which resulted in k = 1.2,thus approximating a Lorentzian. C, D, Spectra for cells 8 and 10.
An alternative method of estimating quantal rate makes no assumption about the shape of the quantal event (Wong and Knight, 1980). According to this method, the spectrum of the light-evoked noise was inverse-Fourier transformed to give the autocorrelation function, which was then normalized to its value at t = 0 (Fig.3). The integral of this function estimates the quantal duration T to be 10 msec. The rate was then calculated as
| Equation 4 |
and multiplied by 1.25 to adjust for variation in quantal size (see Materials and Methods). The result was 70,000 quanta sec−1, close to the rate calculated from Equation 3.
Fig. 3.

Normalized autocorrelation function of light-evoked quanta. This is the inverse-Fourier transform of the light-evoked spectrum in Fig. 2D, normalized to its value at t = 0.
Analyzing 13 cells, I found that both methods invariably gave similar values (t test, df = 12, p = 0.68) (Table 1). Therefore, in the following description, the results of both methods are averaged for each cell. For all cells (except cell 1), Equation 2 was best fit to the power spectrum of the light-evoked noise when the parameter k was close to one, justifying the assumption of exponential quantal decay.
Small dendritic arbors have lower total quantal rates
Cell 13, analyzed above, was located in peripheral retina and had a relatively broad dendritic arbor (240 μm diameter) (Fig. 1, Table1). Eight additional cells from the periphery also had broad arbors and similar rates of sustained, quantal bombardment. The average for all nine cells was ∼45,000 quanta sec−1 (Table 1). Four cells were located in central retina and had much smaller dendritic arbors (30–70 μm diameter) (Table 1). These small central arbors had quantal rates that were similar to each other, averaging ∼5100 quanta sec−1. Thus, the rate for small arbors was lower by approximately ninefold.
Sustained release rate at a bipolar cell synapse is invariant across retina
The density of bipolar synapses on the β arbor is invariant across the retina (28/100 μm2 membrane area), and thus the number of synapses on a β arbor depends on its size (McGuire et al., 1986; Cohen and Sterling, 1992; Kier et al., 1995). In the present study, small central (3–7°) arbors had diameters of 30–70 μm (Boycott and Wässle, 1974) (Table 1) and consequently received 150–370 bipolar synapses (Cohen and Sterling, 1992; Kolb and Nelson, 1993). Large peripheral (18–35°) arbors had diameters of 150–290 μm (Fig. 1A, Table 1), ∼7000 μm2 of membrane area (Kier et al., 1995), and consequently received ∼2000 bipolar synapses. Dividing the total sustained rates for small and large cells by their respective numbers of synapses gave average rates per synapse, respectively, of 21 and 23 quanta synapse−1 sec−1. Thus, the average rate per synapse (nsyn) for central and peripheral cells was not significantly different (t test, df = 11, p = 0.76).
Quantal amplitude during the sustained response is invariant across retina
The sustained response and accompanying noise were analyzed to obtain the amplitude of a single quantal response. Since the power spectra show that a quantum follows a simple exponential decay, its amplitude can be calculated (Katz and Miledi, 1972):
| Equation 5 |
The result was divided by 1.25 to adjust for variation in quantal size (see Materials and Methods). For central and peripheral cells quantal amplitudes were, respectively, 23 ± 5 and 33 ± 8 μV. These amplitudes were similar (t test, df = 11, p = 0.33), suggesting that quantal amplitude for bipolar cell synapses is constant across the retina. The average quantal amplitude for both center and periphery was 30 ± 6 μV.
To compare this quantal voltage to the spontaneous EPSCs in other mammalian ganglion cells, I calculated the integral of the quantal current (Freed, 2000):
| Equation 6 |
where Ri is the input resistance, ∼36 MΩ for the On-β cell (Freed and Nelson, 1994), and E is the synaptic voltage for glutamate at the dark potential, ∼50 mV. Because a averaged 30 μV and τ averaged 6 msec (Table1), the resulting conductance integral (∫g(t)dt) is 100 pS-msec. Spontaneous EPSCs in mouse ganglion cells have a peak conductance of 100 pS (Tian et al., 1998) and a decay time constant of 1–6 msec (Protti et al., 1997; Tian et al., 1998). Thus, their conductance integral is 100–600 pS-msec, similar to the conductance integral calculated here for the On-β cell.
Quantal amplitude is larger during the transient depolarization
Quantal amplitudes during the transient and sustained depolarizations were compared by analysis of nonstationary fluctuation (“ensemble analysis”) (Sigworth, 1981). Consider cell 7 as an example; the average response (Δv) was computed from 41 responses to a repeated stimulus (Fig.4A). The transient depolarization (t ≈ 1 sec) was 5.5 mV, and the sustained depolarization (t = 1.8–2.0 sec) was ∼3.5 mV. The light-evoked ensemble variance (Δς2) at each of these time points was computed across responses, which resulted in a value for the transient of 4.2 mV2 and for the sustained depolarization of 0.27 mV2 (Fig.4B). Substituting these values into Equation 5 and dividing by 1.25 to adjust for variation in quantal size gave quantal amplitudes for the transient and sustained depolarizations of 1.2 mV and 120 μV (Fig. 4C). This analysis, repeated for three additional peripheral cells, gave average values for the transient and sustained quantal amplitudes of 1.1 ± 0.3 mV and 130 ± 10 μV.
Fig. 4.
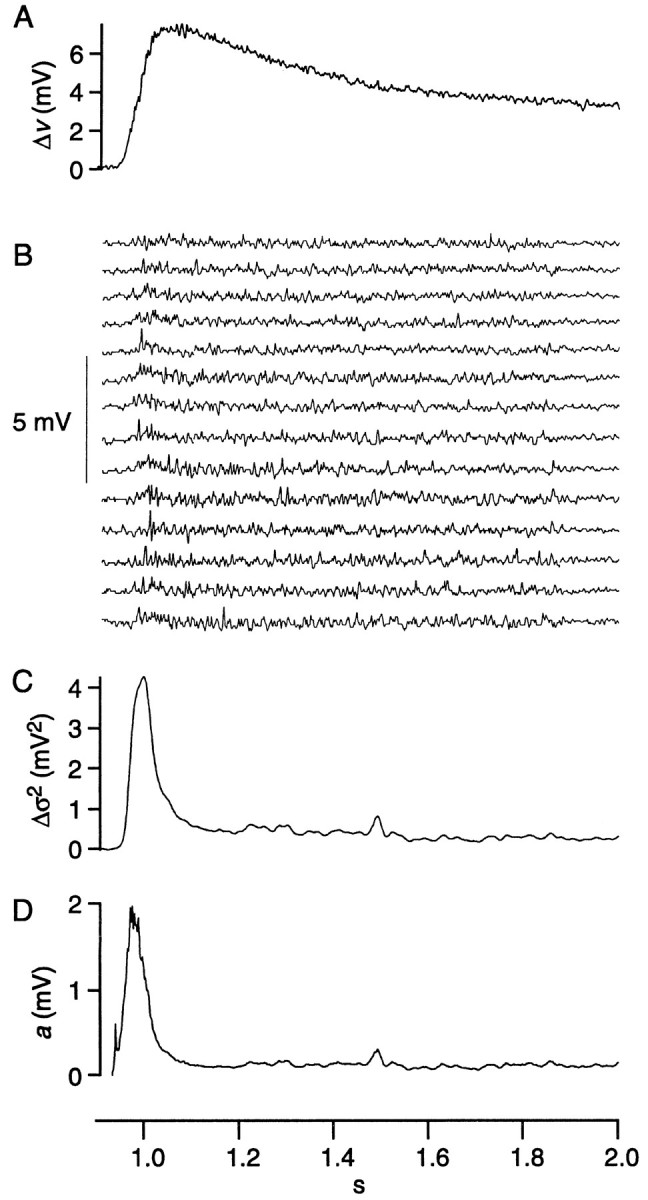
Analysis of nonstationary fluctuations from cell 7. A, The average of 41 responses minus the average baseline voltage in the dark (Δv). B, The difference between individual responses and the average response (14 of 41 responses shown). C, Point-by-point calculation of the variance minus the average baseline variance in the dark and smoothed over 101 points (Δς2). D, Point-by-point calculation from Equation 5 of quantal amplitude (a).
By ensemble analysis, quantal amplitude during the sustained depolarization is approximately fourfold larger than by fluctuation analysis. The difference is attributable to incomplete correction for linear trends in the ensemble data (see Materials and Methods). Although ensemble analysis is inaccurate for the absolute quantal size, it does give relative quantal size for the transient and sustained depolarizations. Because the quantal amplitude during the transient is greater by approximately eightfold, its absolute value can be estimated as eight times the absolute value of the sustained quantal amplitude (8 × 30 μV), ∼240 μV. In theory, ensemble analysis could also be used to calculate quantal rate during the transient depolarization. However, the transient proved too brief to allow accurate calculation of the necessary decay time constant from a power spectrum.
DISCUSSION
The fluctuation and ensemble analyses applied here assume that quanta arrive at the ganglion cell with Poisson statistics. Supporting this assumption, spontaneous quanta from both amacrine and bipolar cell synapses in the presence of TTX show an exponential distribution of intervals (Gao and Wu, 1998; Matsui et al., 1998; Dr. Masao Tachibana, personal communication). In addition, for sustained EPSPs from bipolar cells, the ratio of mean to variance remains constant (Freed, 2000). An exponential distribution of intervals and a constant ratio of mean to variance are hallmarks of Poisson statistics; therefore, the assumption of Poisson arrival seems justified.
It is natural to wonder whether Poisson processes upstream of the bipolar-to-ganglion cell synapse might contribute significantly to the voltage noise of the ganglion cell. Such processes include photon absorption and quantal transmitter release from photoreceptors, shown to be insignificant for the On-β cell (see Materials and Methods). Such processes also include quantal release from amacrine cells onto ganglion cells and amacrine feedback control of bipolar cell release, analyzed in detail for the On-α cell and also shown to be insignificant (Freed, 2000). This suggests that most of the voltage noise of the β cell was caused by Poisson release at the bipolar ribbon synapse.
An empirical test of the present approach is whether the calculated amplitude of the quantal EPSP matches the amplitude of the quantal inward current EPSC that caused it. An approximate comparison was made by calculating the time integral of the quantal current based on previous measurements of input resistance and dark potential. There was a good match to published values of glutamatergic quantal EPSCs in mouse and rat (Protti et al., 1997; Tian et al., 1998). Given that the key assumptions for the fluctuation and ensemble analyzes are justified and that a key result is corroborated by a more direct method, I now consider the possible matches of quantal size and rate with different types of cone bipolar cell (Fig. 5).
Fig. 5.
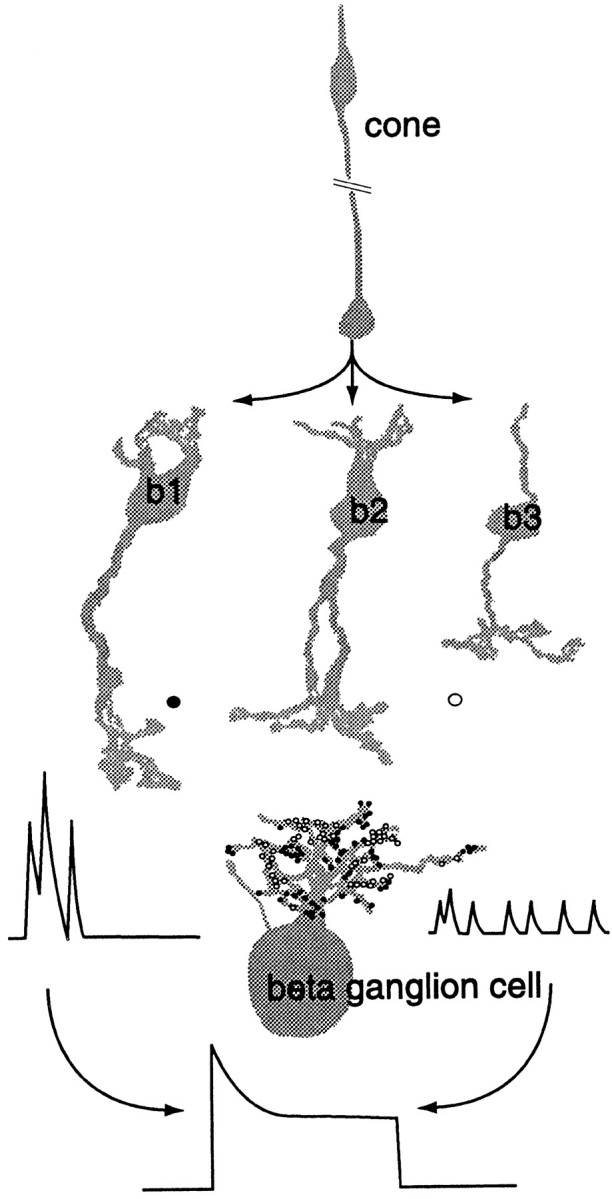
Bipolar cell types b1, b2, and b3 form parallel circuits from cone to On-β ganglion cell. Type b1 contributes ∼55% of bipolar synapses (●) to the On-β cell, and types b2 and b3 contribute the rest (○). Present results indicate that type b1 contributes large quantal EPSPs in the ganglion cell during initial transient depolarization of ganglion cell and thus contributes to high-frequency responses. Types b2 and b3 cause small quantal EPSPs during subsequent sustained depolarization and thus contribute to low-frequency responses (diagram after Cohen and Sterling, 1992).
Transient and sustained release from different bipolar types
The mean quantal amplitude is eightfold larger during the transient depolarization than during the sustained depolarization. This suggests that different bipolar types might predominate for each component. Type b1, which contributes half of the bipolar synapses of the On-β cell (Cohen and Sterling, 1992), is known to depolarize transiently to a light step (Nelson and Kolb, 1983). Furthermore, it releases quanta at a low rate during the sustained depolarization (∼2 quanta synapse−1 sec−1) and a much higher rate during the transient (Freed, 2000). It follows that the type b1 may contribute a quantal EPSP that is larger than those from the other bipolar types.
Quanta comprising the sustained component probably arise mainly from b2 and b3 bipolar cells because the b1 release rate during a sustained stimulus is less than 2 quanta synapse−1sec−1 (Freed, 2000). Given that b2 and b3 contribute only about half of the bipolar synapses to the β cell, their sustained rate must be higher than 22 synapse−1sec−1 calculated for the whole population. If quanta from different cell types had different amplitudes (Gao and Wu, 1998), the average rate would be weighted by the quantal size for each type and its proportion of synapses. Using the average rate from fluctuation analysis (nsyn = 22), it is possible to calculate (see ; Fig. 6) that the sustained quantal rate for b2 and b3 must be at least 46 quanta synapse−1 sec−1 and might be higher.
Fig. 6.

Determining minimum value for b2 and b3 average quantal rate per synapse (n2). Curve was generated from Equation 10 substituted as follows: nsyn = 22, quanta sec−1, p1 = 0.55, p2 = 0.45. The average quantal rate per synapse for b2 and b3 (n2) has a minimum when c = 1, i.e., when quantal sizes for b1 and b2/b3 are equal, but any disparity in quantal size makes n2 larger. Thus, n2 is at least 46 quanta sec−1synapse−1, but may be higher.
This value for sustained quantal release (≥46 quanta synapse−1 sec−1) resembles sustained rates obtained by other methods at other ribbon synapses. Thus, capacitance measurements show that a salamander rod terminal containing seven ribbons (Townes-Anderson et al., 1985) releases ∼400 quanta sec−1 (Rieke and Schwartz, 1996), for a sustained rate of 60 quanta synapse−1 sec−1. Similarly, noise analysis shows that an Off bipolar cell in turtle retina is bombarded by 9200 quanta sec−1 from cones estimated to contain ∼500 ribbons (Ashmore and Copenhagen, 1983). Thus, the turtle cone can sustain release of greater than 20 quanta synapse−1sec−1. Optical measurements of goldfish bipolar cell terminals indicate a sustained release rate of ∼900−1sec−1 (Rouze and Schwartz, 1998) from ∼50 ribbons (von Gersdorff et al., 1996), indicating ∼18 quanta synapse−1 sec−1.
Ganglion cell bandwidth and the function of parallel bipolar circuits
That a given patch of cones connects to the β cell via multiple types of bipolar cell (McGuire et al., 1986; Cohen and Sterling, 1992) is puzzling because the bipolar cells apparently convey the same spectral and spatial information. Similarly, in primate retina, bipolar types DB2 and DB3 both contact the Off parasol cell (Calkins et al., 1995). To explain parallel bipolar pathways, it was proposed that these bipolar cell types convey different temporal information (Cohen and Sterling, 1992). This hypothesis receives support from the present results.
The response of the β cell to a time-varying light peaks at ∼10 Hz but persists at lower frequencies (Cleland et al., 1973; Victor and Shapley, 1979; Derrington and Lennie, 1982; Frishman et al., 1987). The high-frequency response is apparently carried by large amplitude EPSPs evoked transiently from the b1 bipolar cell, whereas the low-frequency response is probably carried by smaller EPSPs evoked at high sustained rates from b2 and b3 bipolar cells. The α ganglion cell also responds optimally at ∼10 Hz, probably because of its strong input from b1 (Freed and Sterling, 1988). However, it responds more weakly at lower frequencies, probably because it lacks input from b2 and b3. It will be interesting to learn whether broad bandwidth requires multiple, parallel lines in other neural circuits.
Some bipolar types apparently cause larger quantal EPSPs than others. Because all three types of synapse distribute evenly across the dendritic tree (Cohen and Sterling, 1992), the difference cannot be explained by differential electrotonic attenuation, and because they are received in the same neuron, they cannot be attributable to differences in input resistance. Perhaps the synaptic vesicles of b1 release more glutamate, or the postsynaptic receptors are more numerous or have a greater single-channel conductance. It will be interesting to learn which of these strategies has been selected to accomplish the extra boost required to create the transient response.
The sensitivity of the β cell to a point stimulus is highest for small cells in the central area and falls ∼10-fold as the cells enlarge toward periphery (Linsenmeier et al., 1982). The density of the dendritic arbor of the β cell (membrane per unit area of retina) is also highest for small central cells and declines similarly toward the periphery (Kier et al., 1995). This suggested that the denser central arbor catches a denser accumulation of synapses, so more are activated by a point stimulus (Kier et al., 1995). If quantal rate or voltage were vastly different for small and large cells, this would alter the relationship between dendritic density and sensitivity. Thus, the present finding that quantal rate and quantal voltage are nearly constant for small and large cells supports the hypothesis that dendritic pattern sets sensitivity.
To derive an expression for the average quantal rate for the synapses of b2 and b3, these types and the b1 can be treated as two separate classes. Each class contributes a portion of the synapses of the On-β cell (px), response (Δvx), and light-evoked variance (Δςx2); each class has an average peak quantal amplitude (ax) and rate (Δnx). Because power spectra of the light-evoked noise lacked obvious inflections and were fit by single Lorentzians (Fig. 3), the two classes have quanta with the same time constant (t).
The measured response and light-evoked variance is the simple sum of responses and variances from individual bipolar cell classes, so the estimated average quantal rate at a single synapse is
| Equation 7 |
where subscripts 1 and 2 refers to the b1 bipolar cell and the remaining types, respectively.
Campbell's theorem (Rice, 1954) specifies that v = n∫f(t)dt and that ς2 = n∫f2(t)dt. The quanta have the form f(t) = ae−t/τ, therefore ∫f(t)dt = at and ∫f2(t)dt = a2t. Substituting these expressions into Equation 7 gives
| Equation 8 |
Substituting the expression c = a1/a2 into this equation gives
| Equation 9 |
Solving this last equation for Δn2gives
| Equation 10 |
Footnotes
This work was supported by National Institutes of Health Grants EY11138, EY00828, and MH48168. I thank Ralph Nelson and Robert Smith for technical advice and support and Peter Sterling for thoughtful editorial suggestions. I am grateful to Sharron Fina for preparing this manuscript.
Correspondence should be addressed to Dr. Michael A. Freed, Department of Neuroscience, University of Pennsylvania, Philadelphia, PA 19104-6058. E-mail:michael@retina.anatomy.upenn.edu.
REFERENCES
- 1.Adams JC. Technical considerations on the use of horseradish peroxidase as a neuronal marker. Neuroscience. 1977;2:141–145. doi: 10.1016/0306-4522(77)90074-4. [DOI] [PubMed] [Google Scholar]
- 2.Ashmore JF, Copenhagen D. An analysis of transmission from cones to hyperpolarizing bipolar cells in the retina of the turtle. J Physiol (Lond) 1983;340:569–597. doi: 10.1113/jphysiol.1983.sp014781. [DOI] [PMC free article] [PubMed] [Google Scholar]
- 3.Baylor DA, Nunn BJ, Schnapf JL. The photocurrent, noise and spectral sensitivity of rods of the monkey Macaca fascicularis. J Physiol (Lond) 1984;357:575–607. doi: 10.1113/jphysiol.1984.sp015518. [DOI] [PMC free article] [PubMed] [Google Scholar]
- 4.Bishop PO, Kozak W, Vakkur GJ. Some quantitative aspects of the cat's eye: axis and plane of reference, visual field co-ordinates and optics. J Physiol (Lond) 1962;163:466–502. doi: 10.1113/jphysiol.1962.sp006990. [DOI] [PMC free article] [PubMed] [Google Scholar]
- 5.Bolz J, Frumkes T, Voigt T, Wässle H. Action and localization of gamma-aminobutyric acid in the cat retina. J Physiol (Lond) 1985;362:369–393. doi: 10.1113/jphysiol.1985.sp015684. [DOI] [PMC free article] [PubMed] [Google Scholar]
- 6.Boycott BB, Wässle H. The morphological types of ganglion cells of the domestic cat's retina. J Physiol (Lond) 1974;240:397–419. doi: 10.1113/jphysiol.1974.sp010616. [DOI] [PMC free article] [PubMed] [Google Scholar]
- 7.Caldwell JH, Daw NW, Wyatt HJ. Effects of picrotoxin and strychnine on rabbit retinal ganglion cells: lateral interactions for cells with more complex receptive fields. J Physiol (Lond) 1978;276:277–298. doi: 10.1113/jphysiol.1978.sp012233. [DOI] [PMC free article] [PubMed] [Google Scholar]
- 8.Calkins DJ, Schein SJ, Sterling P. Cone inputs to three types of non-midget ganglion cell in macaque fovea. Invest Ophthalmol Vis Sci. 1995;36:S15. [Google Scholar]
- 9.Cleland BG, Levick WR, Sanderson KJ. Properties of sustained and transient ganglion cells in the cat retina. J Physiol (Lond) 1973;228:649–680. doi: 10.1113/jphysiol.1973.sp010105. [DOI] [PMC free article] [PubMed] [Google Scholar]
- 10.Cohen E, Sterling P. Convergence and divergence of cones onto bipolar cells in the central area of cat retina. Philos Trans R Soc Lond B Biol Sci. 1990;330:323–328. doi: 10.1098/rstb.1990.0202. [DOI] [PubMed] [Google Scholar]
- 11.Cohen E, Sterling P. Parallel circuits from cones to the on-beta ganglion cell. Eur J Neurosci. 1992;4:506–520. doi: 10.1111/j.1460-9568.1992.tb00901.x. [DOI] [PubMed] [Google Scholar]
- 12.Cohen ED, Zhou ZJ, Fain GL. Ligand-gated currents of alpha and beta ganglion cells in the cat retinal slice. J Neurophysiol. 1994;72:1260–1269. doi: 10.1152/jn.1994.72.3.1260. [DOI] [PubMed] [Google Scholar]
- 13.Derrington AM, Lennie P. The influence of temporal frequency and adaptation level on receptive field organization of retinal ganglion cells in cat. J Physiol (Lond) 1982;333:343–366. doi: 10.1113/jphysiol.1982.sp014457. [DOI] [PMC free article] [PubMed] [Google Scholar]
- 14.Freed MA. Rate of quantal excitation to a retinal ganglion cell evoked by sensory input. J Neurophysiol. 2000;83:2956–2966. doi: 10.1152/jn.2000.83.5.2956. [DOI] [PubMed] [Google Scholar]
- 15.Freed MA, Nelson R. Conductances evoked by light in the ON-beta ganglion cell of the cat retina. Vis Neurosci. 1994;11:261–269. doi: 10.1017/s0952523800001620. [DOI] [PubMed] [Google Scholar]
- 16.Freed MA, Sterling P. The ON-alpha ganglion cell of the cat retina and its presynaptic cell types. J Neurosci. 1988;8:2303–2320. doi: 10.1523/JNEUROSCI.08-07-02303.1988. [DOI] [PMC free article] [PubMed] [Google Scholar]
- 17.Freed MA, Smith RG, Sterling P. Computational model of the on-alpha ganglion cell receptive field based on bipolar circuitry. Proc Natl Acad Sci USA. 1992;89:236–240. doi: 10.1073/pnas.89.1.236. [DOI] [PMC free article] [PubMed] [Google Scholar]
- 18.Freed MA, Pflug R, Kolb H, Nelson R. ON-OFF amacrine cells in the cat retina. J Comp Neurol. 1996;364:556–566. doi: 10.1002/(SICI)1096-9861(19960115)364:3<556::AID-CNE12>3.0.CO;2-N. [DOI] [PubMed] [Google Scholar]
- 19.Frishman LJ, Freeman AW, Troy JB, Schweitzer-Tong DE, Enroth-Cugell C. Spatiotemporal frequency responses of cat retinal ganglion cells. J Gen Physiol. 1987;89:599–628. doi: 10.1085/jgp.89.4.599. [DOI] [PMC free article] [PubMed] [Google Scholar]
- 20.Gao F, Wu SM. Characterization of spontaneous inhibitory synaptic currents in salamander retinal ganglion cells. J Neurophysiol. 1998;80:1752–1764. doi: 10.1152/jn.1998.80.4.1752. [DOI] [PubMed] [Google Scholar]
- 21.Hsu A, Tsukamoto Y, Smith RG, Sterling P. Functional architecture of primate cone and rod axons. Vision Res. 1998;38:2539–2549. doi: 10.1016/s0042-6989(97)00370-2. [DOI] [PubMed] [Google Scholar]
- 22.Katz B, Miledi R. The statistical nature of the acetylcholine potential and its molecular components. J Physiol (Lond) 1972;224:665–669. doi: 10.1113/jphysiol.1972.sp009918. [DOI] [PMC free article] [PubMed] [Google Scholar]
- 23.Kier CK, Buchsbaum G, Sterling P. How retinal microcircuits scale for ganglion cells of different size. J Neurosci. 1995;15:7673–7683. doi: 10.1523/JNEUROSCI.15-11-07673.1995. [DOI] [PMC free article] [PubMed] [Google Scholar]
- 24.Koch C, Poggio T, Torre V. Retinal ganglion cells: a functional interpretation of dendritic morphology. Philos Trans R Soc Lond B Biol Sci. 1982;298:227–264. doi: 10.1098/rstb.1982.0084. [DOI] [PubMed] [Google Scholar]
- 25.Kolb H. The inner plexiform layer in the retina of the cat: electron microscopic observations. J Neurocytol. 1979;8:295–329. doi: 10.1007/BF01236124. [DOI] [PubMed] [Google Scholar]
- 26.Kolb H, Nelson R. OFF-alpha and OFF-beta ganglion cells in cat retina. II. Neural circuitry as revealed by electron microscopy of HRP stains. J Comp Neurol. 1993;329:85–110. doi: 10.1002/cne.903290107. [DOI] [PubMed] [Google Scholar]
- 27.Linsenmeier RA, Frishman LJ, Jakiela HG, Enroth-Cugell C. Receptive field properties of X and Y cells in the cat retina derived from contrast sensitivity measurements. Vision Res. 1982;22:1173–1183. doi: 10.1016/0042-6989(82)90082-7. [DOI] [PubMed] [Google Scholar]
- 28.Matsui K, Hosoi N, Tachibana M. Excitatory synaptic transmission in the inner retina: paired recordings of bipolar cells and neurons of the ganglion cell layer. J Neurosci. 1998;18:4500–4510. doi: 10.1523/JNEUROSCI.18-12-04500.1998. [DOI] [PMC free article] [PubMed] [Google Scholar]
- 29.McGuire BA, Stevens JK, Sterling P. Microcircuitry of beta ganglion cells in cat retina. J Neurosci. 1986;6:907–918. doi: 10.1523/JNEUROSCI.06-04-00907.1986. [DOI] [PMC free article] [PubMed] [Google Scholar]
- 30.Nelson R, Kolb H. Synaptic patterns and response properties of bipolar and ganglion cells in the cat retina. Vision Res. 1983;23:1183–1195. doi: 10.1016/0042-6989(83)90032-9. [DOI] [PubMed] [Google Scholar]
- 31.Panico J, Sterling P. Retinal neurons and vessels are not fractal but space filling. J Comp Neurol. 1995;361:479–490. doi: 10.1002/cne.903610311. [DOI] [PubMed] [Google Scholar]
- 32.Protti DA, Gerschenfeld HM, Llano I. GABAergic and glycinergic IPSCs in ganglion cells of rat retinal slices. J Neurosci. 1997;17:6075–6085. doi: 10.1523/JNEUROSCI.17-16-06075.1997. [DOI] [PMC free article] [PubMed] [Google Scholar]
- 33.Rao R, Buchsbaum G, Sterling P. Rate of quantal transmitter release at the mammalian rod synapse. Biophys J. 1994;67:57–63. doi: 10.1016/S0006-3495(94)80454-0. [DOI] [PMC free article] [PubMed] [Google Scholar]
- 34.Rao MR, Harkins AB, Buchsbaum G, Sterling P. Mammalian rod terminal: architecture of a binary synapse. Neuron. 1995;14:561–569. doi: 10.1016/0896-6273(95)90312-7. [DOI] [PubMed] [Google Scholar]
- 35.Rice SO. Mathematical analysis of random noise. In: Wax N, editor. Selected papers on noise and stochastic processes. Dover; New York: 1954. pp. 133–294. [Google Scholar]
- 36.Rieke F, Schwartz EA. Asynchronous transmitter release: control of exocytosis and endocytosis at the salamander rod synapse. J Physiol (Lond) 1996;493:1–8. doi: 10.1113/jphysiol.1996.sp021360. [DOI] [PMC free article] [PubMed] [Google Scholar]
- 37.Rouze NC, Schwartz EA. Continuous and transient vesicle cycling at a ribbon synapse. J Neurosci. 1998;18:8614–8624. doi: 10.1523/JNEUROSCI.18-21-08614.1998. [DOI] [PMC free article] [PubMed] [Google Scholar]
- 38.Saito H. The effects of strychnine and bicuculline on the responses of X- and Y-cells of the isolated eye-cup preparation of the cat. Brain Res. 1981;212:243–248. doi: 10.1016/0006-8993(81)90061-5. [DOI] [PubMed] [Google Scholar]
- 39.Saito H. Pharmacological and morphological differences between X- and Y-type ganglion cells in the cat's retina. Vision Res. 1983;23:1299–1308. doi: 10.1016/0042-6989(83)90105-0. [DOI] [PubMed] [Google Scholar]
- 40.Schneeweis DM, Schnapf JL. The photovoltage of Macaque cone photoreceptors: adaptation, noise, and kinetics. J Neurosci. 1999;19:1203–1216. doi: 10.1523/JNEUROSCI.19-04-01203.1999. [DOI] [PMC free article] [PubMed] [Google Scholar]
- 41.Sigworth FJ. Covariance of nonstationary sodium current fluctuations at the node of Ranvier. Biophys J. 1981;34:111–133. doi: 10.1016/S0006-3495(81)84840-0. [DOI] [PMC free article] [PubMed] [Google Scholar]
- 42.Steinberg RH, Reid M, Lacy PL. The distribution of rods and cones in the retina of the cat. J Comp Neurol. 1973;148:229–248. doi: 10.1002/cne.901480209. [DOI] [PubMed] [Google Scholar]
- 43.Sterling P, Harkins AB. Ultrastructure of the cone pedicle in cat retina. Invest Ophthalmol Vis Sci. 1990;31:S177. [Google Scholar]
- 44.Taylor WR, Chen E, Copenhagen DR. Characterization of spontaneous excitatory synaptic currents in salamander retinal ganglion cells. J Physiol (Lond) 1995;486:207–221. doi: 10.1113/jphysiol.1995.sp020803. [DOI] [PMC free article] [PubMed] [Google Scholar]
- 45.Tian N, Hwang TN, Copenhagen DR. Analysis of excitatory and inhibitory spontaneous synaptic activity in mouse retinal ganglion cells. J Neurophysiol. 1998;80:1327–1340. doi: 10.1152/jn.1998.80.3.1327. [DOI] [PubMed] [Google Scholar]
- 46.Townes-Anderson E, MacLeish PR, Raviola E. Rod cells dissociated from mature salamander retina: ultrastructure and uptake of horseradish peroxidase. J Cell Biol. 1985;100:175–188. doi: 10.1083/jcb.100.1.175. [DOI] [PMC free article] [PubMed] [Google Scholar]
- 47.Vaney DI. Many diverse types of retinal neurons show tracer coupling when injected with biocytin or Neurobiotin. Neurosci Lett. 1991;125:187–190. doi: 10.1016/0304-3940(91)90024-n. [DOI] [PubMed] [Google Scholar]
- 48.Vaney DI. Photochromic intensification of diaminobenzidine reaction product in the presence of tetrazolium salts: applications for intracellular labeling and immunohistochemistry. J Neurosci Methods. 1992;44:217–223. doi: 10.1016/0165-0270(92)90013-4. [DOI] [PubMed] [Google Scholar]
- 49.Victor JD, Shapley RM. Receptive field mechanisms of cat X and Y retinal ganglion cells. J Gen Physiol. 1979;74:275–298. doi: 10.1085/jgp.74.2.275. [DOI] [PMC free article] [PubMed] [Google Scholar]
- 50.von Gersdorff H, Vardi E, Matthews G, Sterling P. Evidence that vesicles on the synaptic ribbon of retinal bipolar neurons can be rapidly released. Neuron. 1996;16:1221–1227. doi: 10.1016/s0896-6273(00)80148-8. [DOI] [PubMed] [Google Scholar]
- 51.Wong F, Knight BW. Adapting bump model for eccentric cells of Limulus. J Gen Physiol. 1980;76:539–557. doi: 10.1085/jgp.76.5.539. [DOI] [PMC free article] [PubMed] [Google Scholar]