

Abstract
We have used site-directed mutagenesis in conjunction with homologous recombination to generate two mouse lines carrying point mutations in the glycine binding site of the NMDAR1 subunit (Grin1). Glycine concentration–response curves from acutely dissociated hippocampal neurons revealed a 5- and 86-fold reduction in receptor glycine affinity in mice carryingGrin1D481N andGrin1K483Qmutations, respectively, whereas receptor glutamate affinity remained unaffected. Homozygous mutant Grin1D481Nanimals are viable and fertile and appear to develop normally. However, homozygous mutant Grin1K483Qanimals are significantly lighter at birth, do not feed, and die within a few days. No gross abnormalities in CNS anatomy were detected in either Grin1D481NorGrin1K483Qmice. Interestingly,in situ hybridization and Western blot analysis revealed changes in the expression levels of NMDA receptor subunits inGrin1D481Nmice relative to wild type that may represent a compensatory response to the reduction in receptor glycine affinity. Grin1D481Nmice exhibited deficits in hippocampal theta burst-induced long-term potentiation (LTP) and spatial learning and also a reduction in sensitivity to NMDA-induced seizures relative to wild-type controls, consistent with a reduced activation of NMDA receptors. Mutant mice exhibited normal prepulse inhibition but showed increased startle reactivity. Preliminary analysis indicated that the mice exhibit a decreased natural aversion to an exposed environment. The lethal phenotype of Grin1K483Qanimals confirms the critical role of NMDA receptor activation in neonatal survival. A milder reduction in receptor glycine affinity results in an impairment of LTP and spatial learning and alterations in anxiety-related behavior, providing further evidence for the role of NMDA receptor activation in these processes.
Keywords: NMDA receptor, glycine site, NMDAR1, Grin1, LTP, spatial memory
The NMDA receptor is unique among ligand-gated ion channels in its requirement for two co-agonists, acting at the glutamate and glycine recognition sites, for receptor activation (Johnson and Ascher, 1987; Kleckner and Dingledine, 1988). The physiological role of the glycine site in the modulation of NMDA receptor activity remains unclear. Although both co-agonists are required for receptor activation, it is glutamate that appears to play the neurotransmitter role, being released from presynaptic terminals in an activity-dependent manner, whereas glycine is apparently present at a more constant level, indicating a more modulatory function (Kemp and Leeson, 1993). Measurements of glycine concentration in the extracellular and cerebrospinal fluids suggest that it is present at low micromolar levels (Westergren et al., 1994), concentrations that have been considered to be saturating for NMDA receptors. However, glycine transporters (Smith et al., 1992; Borowsky et al., 1993; Zafra et al., 1995) might reduce the glycine concentration to well below 1 μm in the local microenvironment of NMDA receptors (Supplisson and Bergman, 1997; Berger et al., 1998; Bergeron et al., 1998), and populations of native NMDA receptors with relatively low affinity for glycine have been described (mKD = ∼800 nm) (Kew et al., 1998).
Native NMDA receptors are thought to be composed of NMDAR1 and at least one of the NR2 subunits (Kutsuwada et al., 1992; Monyer et al., 1992) assembled in various combinations as heteromers predicted to contain four (Laube et al., 1998) or five (Ferrer-Montiel and Montal, 1996; Premkumar and Auerbach, 1997; Hawkins et al., 1999) subunits. Earlier electrophysiological studies have demonstrated that NMDA receptor activation requires occupation of two independent glycine sites and two independent glutamate sites (Benveniste and Mayer, 1991;Clements and Westbrook, 1991). Thus, the minimal requirement for a functional receptor would seem to be two NMDAR1 and two NR2 subunits, which contain the glycine (Kuryatov et al., 1994; Wafford et al., 1995;Hirai et al., 1996) and glutamate (Laube et al., 1997; Anson et al., 1998) binding sites, respectively.
The essential role of the NMDAR1 subunit in NMDA receptor function has been confirmed by targeted disruption of the Nmdar1 gene (Grin1 according to the Mouse Genome Database) in vivo (Forrest et al., 1994; Li et al., 1994). Mice homozygous for the disrupted Nmdar1 (Grin1) allele die shortly after birth, apparently because of respiratory failure (Forrest et al., 1994).
To investigate the physiological role of the NMDA receptor glycine site, we have used site-directed mutagenesis in conjunction with homologous recombination in mouse embryonic stem cells to generate two novel mouse lines carrying point mutations in the glycine binding site of NMDAR1, D481N, and K483Q [numbering according to Wafford et al. (1995)]. In vitro, these point mutations have been shown to result in 7- and 125-fold reductions in receptor glycine affinity in recombinant NMDAR1/NR2A receptors (Wafford et al., 1995). In targeted mutant mice, glycine concentration–response curves from acutely dissociated hippocampal neurons reveal similar reductions in NMDA receptor glycine affinity. HomozygousGrin1D481Nmice are viable and fertile and appear to develop normally; however, homozygousGrin1K483Qanimals are significantly lighter at birth and die within a few days.
MATERIALS AND METHODS
Targeting vector construction
Screening of the mouse genomic library for the Nmdar1 (Grin1) gene was described previously (Forrest et al., 1994). Clones encompassing exon 12 and surrounding regions were analyzed in detail by restriction mapping and exon-specific oligonucleotide hybridization. A 6 kb EcoRI–SalI fragment containing a 4 kb intron sequence between exons 10 and 11 together with exons 11–18 was chosen for targeting vector construction. A 3 kbXbaI–SpeI fragment consisting of tandomly arranged neomycin and herpes simplex virus–thymidine kinase (HSV-tk) genes flanked 3′ and 5′ by loxP sites was inserted into the unique XbaI site located in the noncoding region between exons 10 and 11. The indicativeSpeI restriction site was created by insertion of aSpeI site-containing oligonucleotide into a uniqueSalI site 3′ of the loxP site. Correct integration and orientation of the loxP sites were confirmed by sequencing. The point mutations D481N and K483Q were introduced by PCR-based mutagenesis along with a MscI-indicative restriction site, using a 5′ oligonucleotide containing the corresponding mutation. PCR amplification of the corresponding gene region yielded a 1 kb HincII–AvrII fragment that was used to replace the native gene fragment. All restriction enzymes were obtained from New England Biolabs (Beverly, MA) or Roche Diagnostics (Rotkreuz, Switzerland).
Generation of Grin1 D481N and Grin1K483Q mutant mice
E14–129/Ola embryonic stem (ES) cells were cultured and transfected with NotI-linearized targeting vectors carrying the D481N or K483Q point mutation, respectively, as described previously (Wurst and Joyner, 1993). Correctly targeted ES cell clones were subsequently subjected to Cre recombination to excise the drug resistance gene flanked by loxP sites. ES cell clones were propagated to 2 × 10⁷ cells and electroporated (Bio-Rad Gene Pulser, Bio-Rad, Glattbrugg, Switzerland) with 20 μg supercoiled pMC-Cre (Gu et al., 1993). After electroporation, 105 cells were plated on a 25 cm2 dish and selected 24 hr later with 2 μm ganciclovir for 3 d. Single resistant colonies were picked and screened by Southern blot analysis for site-specific recombination.
Correctly targeted clones carrying either the D481N or K483Q point mutation in the Grin1 allele were used for injection into C57BL/6J host blastocysts. Chimeric males born after implantation of injected blastocysts into foster mothers were mated with C57BL/6 females, and offspring were analyzed for germline transmission of theGrin1D481NorGrin1K483Qmutation, respectively, by Southern blot analysis. HeterozygousGrin1D481N/+mice were intercrossed to obtain a homozygous Grin1D481Nline, whereas Grin1K483Q/+mice were maintained as heterozygotes because of their postnatal lethality as homozygotes. Wild-type littermates from these crosses, or offspring thereof, were used as control animals.
Southern blot analysis
Purified genomic DNA (10 μg) from ES cells or mouse tail biopsies was digested with SpeI or MscI, respectively. DNA samples were fractionated by 0.7% agarose gel electrophoresis, transferred to Hybond N+ membrane (Amersham, Zurich, Switzerland), and hybridized with a radiolabeled external 5′ (1.9 kbSpeI fragment) or 3′ (0.8 kbBamHI–MscI fragment) probe.
Northern blot analysis and RT-PCR
Total RNA was isolated from whole brain of wild-type, heterozygous, and homozygous mutantGrin1D481NandGrin1K483Qanimals (Chirgwin et al., 1979). For Northern blot analysis, 15 μg total RNA was separated on a denaturing agarose gel and transferred to Hybond N+ membrane (Amersham). A radiolabeled 2.8 kb Grin1 cDNA fragment was used as a probe.
Reverse transcriptase reaction and subsequent PCR were performed with total RNA from mouse brains with Expand reverse transcriptase (Roche Diagnostics) and HotStar Taq from Qiagen (Hilden, Germany) according to manufacturers' instructions. For PCR amplification of Grin1cDNA, the following specific primers were used: 5′coding 5′-GCTCATCAAGCTGGCACGGACC-3′ and 3′noncoding 5′-CCACACCATGCCTAGGATACGAGC-3′. The resulting fragment was subjected to restriction analysis with MscI to check for the presence of the desired mutation. Additionally, the generated fragments were sequenced to confirm the mutation.
Histology
For histological analysis,Grin1D481Nmice (n = 3) and Grin1K483Qmice (n = 2) were killed at day 28 and day 13 after birth, respectively, and compared with wild-type control animals of the same age (n = 7 and 3, respectively). Urethane-anesthetized 28-d-old mice were fixed by transcardiac perfusion (5 ml/min) with 4% paraformaldehyde in PBS. The brains were removed, halved, and immersed for 24 hr with agitation in the same fixative at room temperature. Brains from urethane-anesthetized 13-d-old mice were simply removed and fixed by immersion for 24 hr with agitation in the same fixative at room temperature. One-half was cryoprotected in 20% sucrose in PBS (overnight), then frozen in dry ice, and the other half was dehydrated in ethanol, cleared in xylol, and embedded in paraffin wax. Cryostat or paraffin sections (10 μm) were mounted on untreated slides and then stored at 4°C until they were used. Deparaffinized sections were routinely stained with hematoxylin/eosin or cresyl violet.
In situ hybridization histochemistry
Brains from urethane-anesthetized 28-d-old Grin1D481N mice (n = 9) and controls (n = 8) were removed, frozen in dry ice, and stored at −80°C until they were used. Cryostat sections (10 μm) were mounted on Superfrost Plus slides (Menzel-Gläser, Germany) and either fixed in 4% paraformaldehyde in PBS for 20 min, rinsed three times in PBS, and dried, or stored, unfixed, at −20°C until they were used (the latter for use in binding studies). The following 60-mer oligonucleotide probes, selective for NMDA receptor subunits, were used for hybridization experiments: NMDAR1 (pan), nucleotides 2060–2120 (Sugihara et al., 1992; Hollmann et al., 1993); NR2A, 211–271; NR2B, −86 to −27; NR2C, 20–80 (Monyer et al., 1994). Probe labeling and hybridization were performed as described previously (Kew et al., 1998).
In vitro binding
Cryostat sections of fresh-frozen brains were preincubated at 22°C (2 × 10 min) in 130 ml of Tris-HCl buffer (50 mm, pH 7.4) with 10 mm EDTA, and then incubated in buffer plus 5 nm [3H]Ro 25-6981 (Fischer et al., 1997; Mutel et al., 1998) (final volume, 130 ml) for 90 min at 4°C. This was followed by three rinses at 4°C (2 × 5 min + 15 min) in 130 ml of buffer alone; nonspecific binding was determined in the presence of 10 μm Ro 04-5595. After a quick dip in ice-cold distilled water, the sections were rapidly dried in a stream of cold air.
Quantitative radioautography and image analysis
Sections were exposed, together with tritium microscales, to tritium-sensitive imaging plates (BAS-TR2025) for 4 d and subsequently to Hyperfilm Tritium (Amersham) for 4 weeks at 4°C. The plates were scanned in a Fuji film BAS-5000 high-resolution PhosphorImager and measured with an MCID M2 image analysis system (Imaging Research, St. Catherines, Ontario, Canada).
Western blot analysis
Brain tissues were dissected from control and mutant mice and membrane preparation, and Western blot analysis was performed as previously described (Kew et al., 1998). After blotting, filters were blocked in PBS containing 5% skimmed milk powder and incubated with a solution containing 1 μg/ml of an antibody to NMDA R1 (AB 1516), or 1 μg/ml of an antibody to NR2A (AB 1555P), or 1 μg/ml of an antibody to NR2B (AB 1557P) (all from Chemicon, Lucerne, Switzerland).
Acute hippocampal neuronal dissociation
Brain slices (400 μm) from 5- to 12-d-old control,Grin1D481NorGrin1K483Qmice were cut with a vibratome in an ice-cold solution that contained (in mm): NaCl 125, KCl 2.5, CaCl2 2, MgCl2 1, NaH2PO4 1.25, NaHCO3 26, d-glucose 25, pH adjusted to 7.4 with oxycarbon (95% O2, 5% CO2), and were subsequently incubated at 20°C in the same solution. When needed for electrophysiological experiments, the hippocampus was dissected out of each slice, and neurons were dissociated as previously described (Kew et al., 1998).
Whole-cell voltage-clamp recordings
Whole-cell voltage-clamp recordings were performed as previously described (Kew et al., 1998).
Equilibrium concentration–response curves
Best fit lines were computed for equilibrium concentration–response data using a two-equivalent binding site model:
| Equation 1 |
where mKD is the microscopic dissociation constant (equivalent to an EC25) and [A] = agonist concentration. However, a baseline contamination of glycine was present in all solutions, illustrated by a consistent, small response evoked by the application of NMDA to wild-type neurons in the absence of added glycine. To correct for this glycine contamination where relevant (i.e., where application of NMDA alone yielded an inward current), glycine concentration–response data for each neuron were initially fitted with a modified version of the two-equivalent binding-site model incorporating a variable,g, representing the basal contaminating glycine concentration:
| Equation 2 |
This derived contaminating glycine concentration was then added to each glycine concentration used in the concentration–response curve to give the true glycine concentrations. The concentration–response curve was then replotted using the true glycine concentrations and fitted with the two-equivalent binding-site model (Eq. 1). Plotting the current evoked by NMDA in the absence of added glycine against the predicted contaminating glycine concentration provided a control for the accuracy of this correction procedure. The mean calculated contaminating glycine concentration was 26 ± 3.3 nm(mean ± SE, n = 7).
Calcium imaging
Cortical neurons from genotyped single mouse embryos (embryonic day 18) were cultured on astrocyte feeder layers for 12 d in DMEM (Life Technologies, Gaithersburg, MD) + 10% horse serum (Boehringer Mannheim, Rotkreuz, Switzerland) as previously described (Fischer et al., 1997). For dye loading, cells were incubated with 20 μm fura-2 AM (Molecular Probes, Leiden, The Netherlands) for 40 min at room temperature with 20 min postincubation in HBSS. Cells were stimulated at room temperature with NMDA (100 μm) plus variable concentrations of glycine as indicated for 30 sec in artificial CSF. Stimuli were separated by 5 min washes. Imaging measurements were made on an inverted microscope with a long distance 40× objective (Axiovert 405 m, Zeiss, Thornwood, NY). A cooled CCD camera (CH-250, Photometrics, Tucson, AZ) was used to acquire image pairs at 340 and 380 nm excitation wavelengths (with dark correction) to computer. Exposure time was 400 msec. The intrinsic fluorescence in cells not dye-loaded was <5% and did not contribute a significant error to the measurements. Fluorescence ratio values were calculated as previously described (Grynkiewicz et al., 1985).
Long-term potentiation
Hippocampal slices (400 μm) were cut from 21–38 gm mice with a Sorvall tissue chopper. Slices were maintained in an interface chamber and perfused at 35°C with a simple salt solution containing (in mm): NaCl 124, KCl 2.5, MgSO4 2, CaCl2 2.5, KH2PO4 1.25, NaHCO3 26, glucose 10, sucrose 4, gassed with 95% O2/5% CO2, pH 7.4. The CA1 stratum radiatum was stimulated (0.05 Hz, 100 μsec) at a stimulus strength adjusted to evoke field EPSPs (fEPSPs) equal to 30% of the relative maximum amplitude without superimposed population spike. fEPSPs were recorded from the CA1 stratum radiatum with a glass micropipette (1–3 MΩ) containing 2 m NaCl. After stable baseline recordings, LTP was induced using a theta burst stimulation (TBS) paradigm consisting of two stimulus patterns spaced by 8 sec. Each pattern consisted of 10 × 50 msec stimulus trains at 100 Hz, each separated by 150 msec. The duration of the stimulation pulses was doubled during the tetanus. Results are expressed as means ± SE of the fEPSP slope as a percentage of the baseline values recorded 10 min before TBS for 20 slices from 10 animals per group (for each animal, means of two slices were made for each data point).
Cortical wedge experiments
Experiments with cortical wedges were performed with the greased-gap technique as previously described (Kemp et al., 1991). Coronal slices (500 μm) were cut from a 3- to 4-mm-thick block of cerebral cortex/striatum using a vibratome. The tissue was submerged at all times in a simple salt solution containing (in mm): NaCl 124, KCl 2.5, MgSO4 2, CaCl2 2.5, KH2PO4 1.25, NaHCO3 26, glucose 10, sucrose 4, gassed with 95% O2/5% CO2, pH 7.4. Tissue wedges ∼1 mm wide consisting of frontoparietal motor cortex, corpus callosum, and underlying striatal matter were dissected from the cortical slices. The wedges were mounted in a perspex perfusion chamber and continuously perfused with a modified salt solution that contained tetrodotoxin (300 nm) and lacked MgCl2 and contained 1.75 mmCaCl2. Population depolarizations of the cortical tissue were evoked by 1 min duration applications of NMDA (20 μm) or AMPA (6 μm) and were recorded using Ag/AgCl electrodes connected to a DC amplifier and acquired using MacLab8 software. AMPA applications were made at the beginning and end of the experiments to control for the stability of the preparation. All experiments were performed at room temperature.
Behavioral assays
Behavioral observation. Eight male wild-type and eight male Grin1D481Nmice were used per group. Mice were placed in transparent boxes (40 × 20 × 15 cm) in groups of two to three and observed for any signs of general abnormal behavior as well as changes in body posture, gait, sensory responses, and autonomic activity, as described by Irwin (1968). Experiments were performed on a “blind” basis.
Motor coordination. A revolving rotarod apparatus (accelerating units increase from 3.5 to 35 rpm in 5 min; Ugo Basile, Varese, Italy) was used to measure the motor coordination of mice. The latency time to fall off the rotarod was determined (cutoff time = 120 sec).
Analgesia testing. For the hot-plate test, the hot-plate (Columbus Instruments, Columbus, Ohio) was used at a constant temperature of 55°C. The latency time (seconds) for the mice to lick their paws was measured (cutoff time = 60 sec). For the tail-flick test, heat from a radiant source was focused on a point midway along the length of the tail. The time for the mouse to deflect its tail from the heat stimulus (tail-flick latency) was recorded automatically (LE 7106, Letica, Barcelona, Spain) (cutoff time = 10 sec).
Locomotor activity. The computerized Disgiscan 16 Animal Activity Monitoring System (Omnitech, Colombus, OH) was used to quantitate motor activity. Data were obtained simultaneously from eight Digiscan chambers. Each activity monitor consisted of a Plexiglas box (20 × 20 × 30.5 cm) surrounded by horizontal and vertical infrared sensor beams. The cages were connected to a Digiscan Analyzer that works in conjunction with a PC to interpret the photobeam interruptions. A 12 hr light/dark cycle was maintained in the rooms, with all tests being performed during the light phase. With this system, 19 different parameters could be measured, but only the most relevant are reported: horizontal activity is the total number of interruptions of the horizontal sensors during a given period; vertical activity is the total number of interruptions of the vertical sensors during a given period; number of stereotypy movements corresponds to the number of times the monitor observed stereotypic behavior (a break in stereotypy of 1 sec or more is required to separate one stereotypic episode from the next); and center time is the time spent in the center of the activity box. Locomotor activity was recorded for 8 hr starting immediately after the mice were placed in the cages.
Light/dark test. The light/dark choice apparatus consisted of two polyvinylchloride boxes (27 × 21 × 14 cm high, black, and covered on one side; translucent and illuminated by a 30 W lamp placed 30 cm above the other side) with an interconnecting dark tunnel (5 × 7 × 10 cm). Each mouse was placed in front of the tunnel, and the time spent in the lit area and the number of transitions from dark to lit area were recorded during the 5 min test period.
Morris water maze. Acquisition of spatial learning and memory was assessed by placing mice in a circular pool (diameter 120 cm, height 30 cm) in which they learned to escape from milky water (20 cm depth, 20 ± 1°C) by locating a hidden platform. This target platform (7 cm diameter, 1 cm below the water surface) was located in the center of a particular quadrant of the pool, and external visual cues were positioned around the pool to facilitate navigation of the animals. During a 4 d test period, mice were placed in the water facing the wall of the pool in one of four fixed starting position chosen randomly (three trials per session, three sessions per day). The time the mouse needed to locate the target (escape latency) and the swim path and swim speed were measured using an automated video motility system (Video Mot II, TSE, Bad Homburg, Germany). If an animal failed to find the target within 60 sec, it was placed on the platform by hand and allowed to remain there for an intertrial interval (10–20 sec). The interval between each session was 1.5–2 hr. After the final trial on day 4, the platform was removed, and the mice were allowed to swim freely for 60 sec. The time the mice spent in each quadrant and their swim path were recorded. Statistical analysis was performed by ANOVA with post hoc Fisher's test.
Auditory startle and prepulse inhibition of the acoustic startle reflex. Testing was conducted in eight startle devices (SR-LAB, San Diego Instruments, San Diego, CA) each consisting of a Plexiglas cylinder (5 cm in diameter) mounted on a Plexiglas platform in a ventilated, sound-attenuated cubicle with a high-frequency loudspeaker (28 cm above the cylinder) producing all acoustic stimuli. The background noise of each chamber was 68 dB. Movements within the cylinder were detected and transduced by a piezoelectric accelerometer attached to the Plexiglas base and digitized and stored by a computer. Beginning at the stimulus onset, 65 × 1 msec readings were recorded to obtain the animal's startle amplitude.
Each session was initiated with a 5 min acclimation period followed by five successive 110 dB trials. These trials were not included in the analysis. Ten different trial types were then presented: startle pulse alone (ST110, 110 dB/40 msec); eight different prepulse trials in which either 20-msec-long 72, 78, 84, or 90 dB stimuli were presented alone (P72, P78, P84, P90) or preceded the 110 dB pulse by 100 msec (PP72, PP78, PP84, PP90); and finally one trial in which only the background noise was presented (NST) to measure the baseline movement in the cylinders. All trials were presented in a pseudorandom order, and the average inter-trial interval (ITI) was 15 sec (10–20 sec). The startle data and percentage prepulse inhibition (PPI) were analyzed by two-way ANOVA with the strain as the between-subject factor and the various stimulation intensities or the intensity of prepulse stimuli, respectively, as the repeated measure, followed by post hocFisher's least significance difference test.
Intracerebroventricular NMDA-induced convulsions. Seizures were induced by injection of NMDA (5 nm in 1 μl) into the lateral ventricle of conscious mice. Immediately after injection, animals were placed in Plexiglas boxes (12 × 12 × 15 cm) and observed for a period of 5 min. Typically, seizure activity started with a wild running phase, followed by clonic convulsions. The latency (in seconds) for each mouse to exhibit these various symptoms was recorded.
RESULTS
Generation of Grin1-targeted mutant mice
Previous studies using site-directed mutagenesis and heterologous expression in Xenopus oocytes have identified amino acids in NMDAR1 that appear to contribute to the glycine binding site (Kuryatov et al., 1994; Wafford et al., 1995; Hirai et al., 1996). Replacing the aspartic acid at position 481 with asparagine reduced NMDA receptor glycine affinity by approximately sevenfold, whereas replacement of the lysine at position 483 with glutamine resulted in an approximately 125-fold reduction in receptor glycine affinity [numbering according to Wafford et al. (1995)]. Based on these in vitroexperiments, we have introduced these two point mutations independently into the mouse germ line by homologous recombination in ES cells. Genomic clones of the Grin1 gene (Forrest et al., 1994) encompassing exon 10–18 were used for construction of the targeting vector. The neomycin resistance gene and the HSV-tk cassette were tandemly arranged and cloned into the intron between exons 10 and 11 so as not to disturb the coding region of the Grin1 gene (Fig. 1). This 3 kb gene cassette was flanked with two loxP sites, allowing precise excision of the selection markers by site-specific recombination with the Cre recombinase after successful homologous recombination. To monitor this event, an additional SpeI site was placed adjacent to the 3′loxP site. The point mutations for the amino acid exchanges were introduced into exon 12 along with a new indicative restriction site (MscI). The design of the final targeting vectors, carrying 6 kb of homologous sequence, was such that after integration by homologous recombination, the coding sequence of the endogenousGrin1 gene remained unchanged, with the exception of the targeted point mutations D481N and K483Q, respectively, in exon 12, and one loxP site that is left behind after Cre-mediated excision of the selection markers (Fig. 1).
Fig. 1.
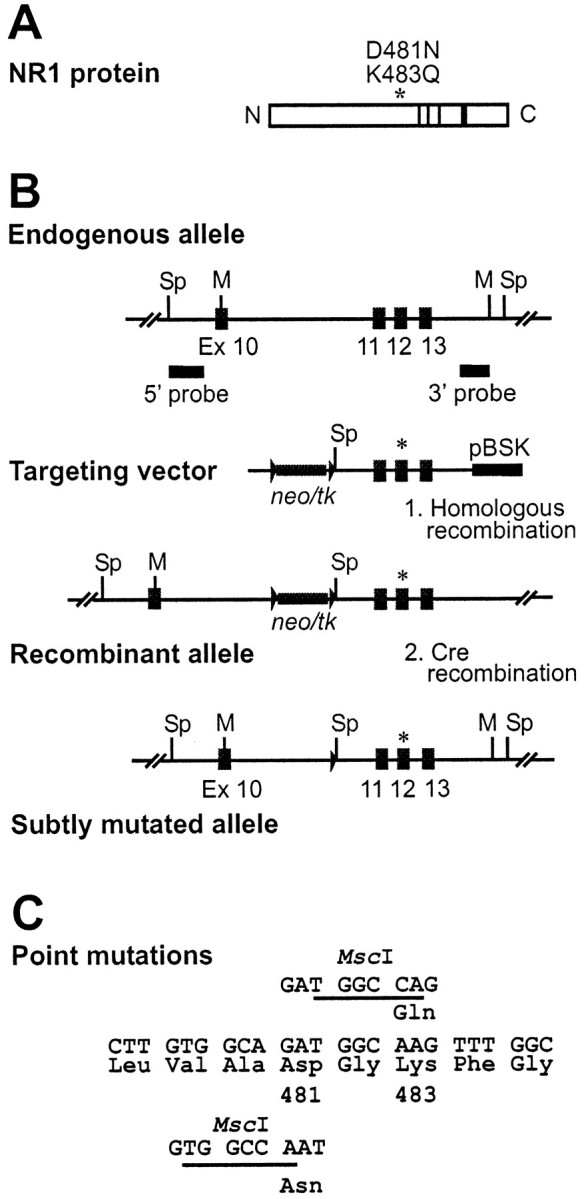
Targeted point mutation of the glycine binding site of the Nmdar1 gene (Grin1).A, Schematic representation of the NMDAR1 protein of 938 amino acids in size showing the N and Ctermini and the four putative transmembrane domains as solid bars. An asterisk indicates the location of amino acids 481 and 483, which were mutated. B, Homologous recombination and subsequent Cre-mediated recombination of the Grin1 gene in ES cells. The relevant genomic structure and partial restriction map of the Grin1 gene spanning exons 10–13 is given on top (numbering according to Hollmann et al., 1993). The locations of the 5′ and 3′ probes used for Southern blot analysis are indicated below. Targeting vectors pNR1 481 and 483 neotkflox carry the D481N and K483Q mutation in exon 12, respectively, as marked with an asterisk, which creates an additional MscI restriction site. The neomycin resistance (neo) and HSV–thymidine kinase (tk) cassette used for selection is located in the intron between exons 10 and 11 and is flanked with twoloxP sites in the same orientation. The solid bar at the 3′ end indicates residual vector sequences of pBluescript (Stratagene, Basel, Switzerland). The recombinant allele after homologous recombination carries the floxed neo/tkcassette and the respective point mutation in exon 12 as indicated by the asterisk. After Cre-recombination, the floxedneo/tk cassette is excised, leaving oneloxP site behind in the intron and the point mutation in exon 12 unchanged. Restriction sites used for Southern blot analysis:Sp, SpeI; M,MscI; X, XbaI.C, Base pair exchanges introduced in exon 12 by the targeting vector coding for amino acid exchanges D481N and K483Q, respectively (numbering according to Wafford et al., 1995).
E14 ES cells were electroporated with the linearized vector DNA, and 191 clones for the D481N mutation and 156 clones for the K483Q mutation were screened by Southern blot hybridization for homologous recombination. The initial screening was performed with an external 5′ probe and revealed 5 D481N and 10 K483Q clones that had undergone homologous recombination at the Grin1 locus. Further analysis of the positive clones with a 3′ external probe revealed that 2 of 5 (D481N) and 7 of 10 (K483Q) clones had correctly integrated the desired mutations into the Grin1 allele.
Because drug selection markers may influence gene expression, they were removed from the targeted Grin1 allele by transient expression of the Cre recombinase in selected ES cell clones. Southern blot hybridization revealed that up to 75% of the clones had correctly undergone Cre-mediated recombination (Fig.2A). After blastocyst injection of two independent ES cell clones for each mutation, chimeric male offspring were mated to C57BL/6J females to establish germline transmission of the novel Grin1D481Nand Grin1K483Qalleles.
Fig. 2.
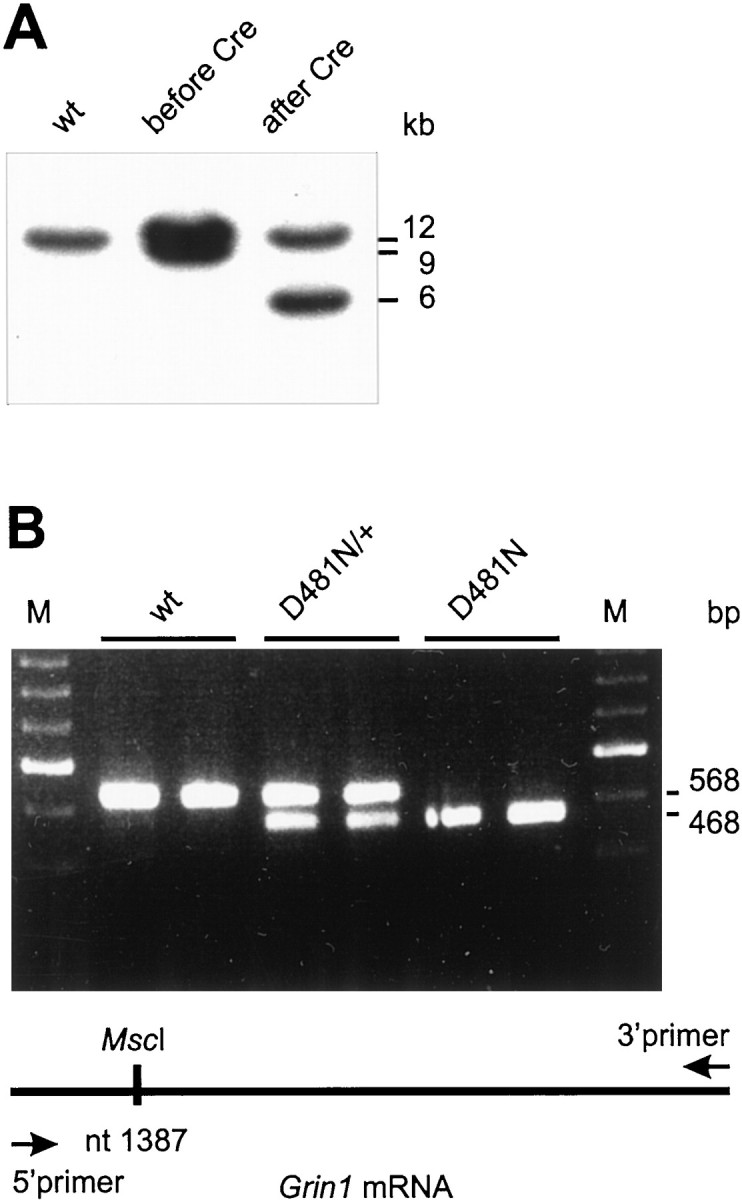
A, Southern blot analysis of ES cell clones. DNA from wild-type ES cells and a targeted ES cell clone before and after Cre-recombination was digested withSpeI and hybridized with the 5′ probe. The 9 kb fragment represents the homologous recombined allele containing theneo/tk cassette. This fragment is shortened to 6 kb after Cre-mediated excision of the resistance cassette. DNA from both Grin1D481N- andGrin1K483Q-targeted ES cells gives an indistinguishable pattern in Southern blot analysis attributable to the almost identical location of the point mutation in the Grin1 gene. B, RT-PCR and mutation-specific restriction enzyme analysis. Total RNA isolated from whole mouse brains of different genotypes of both mutations was used as a template for cDNA synthesis. The 5′ primer used forGrin1-specific PCR amplification starts at nt 1287, and the 3′ primer starts at nt 1855. The position of the mutation-specificMscI site is nt 1387 for D481N (bottom panel) and nt 1393 for K483Q (data not shown). The amplified fragments after restriction digestion withMscI are depicted in the top panel. Wild-type (wt) fragments are resistant to digestion, whereas half of the fragments from heterozygous D481N animals (D481N/+) are shortened, giving two bands of 568 and 468 bp, respectively. All fragments from homozygous D481N mutant animals (D481N), however, are digested to the smaller band. cDNA from Grin1K483Qmice displayed the same pattern after MscI digestion because of the proximity of both point mutations (data not shown).
Heterozygous mice for either mutation were phenotypically normal, developed normally, and were fertile. By crossing these animals, homozygous offspring for both mutations were obtained. Northern blot analysis of whole-brain RNA from 5-d-old wild-type, heterozygous, and homozygous littermates from both mutants revealed no difference in the size and amount of the Grin1 mRNA, demonstrating that the targeted point mutations did not influence the expression of the gene (data not shown). With RT-PCR and mutation-specific restriction enzymes, we directly identified the mutations at the RNA level (Fig.2B). Further confirmation of correct targeting of theGrin1 allele was obtained by sequencing the RT-PCR fragment from homozygous mutant animals (data not shown). In addition, Western blot analysis revealed that bothGrin1D481NandGrin1K483Qhomozygous mutant animals expressed the mutated NMDAR1 protein (data not shown).
Phenotype of homozygous NMDAR mutant mice
Homozygous mutant Grin1D481Nmice are viable and fertile and appear to develop normally. No gross abnormalities in CNS anatomy were detected in young adult animals (Fig. 3). However, the majority of homozygous Grin1K483Qmice die within 48 hr. Newborn animals are significantly lighter (ANOVA,p < 0.001) than wild-type or heterozygous littermates. In heterozygote crosses, homozygousGrin1K483Qoffspring weighed 1.45 ± 0.02 gm (mean ± SE, n = 51), whereas heterozygote littermates weighed 1.61 ± 0.02 gm (n = 96) and wild-type littermates weighed 1.66 ± 0.03 gm (n = 42). The ratio of the three genotypes in the F1 generation is close to 1:2:1, indicating that there is no embryonic lethality. Most Grin1K483Qanimals do not appear to feed normally, and milk is rarely visible in their stomachs. Occasionally,Grin1K483Qmice survived the immediate postnatal period and lived for a maximum of 21 d. These mice failed to gain weight and appeared generally retarded in their physical development; however, no gross abnormalities in CNS anatomy were detected at postnatal day 13 (Fig. 3).
Fig. 3.
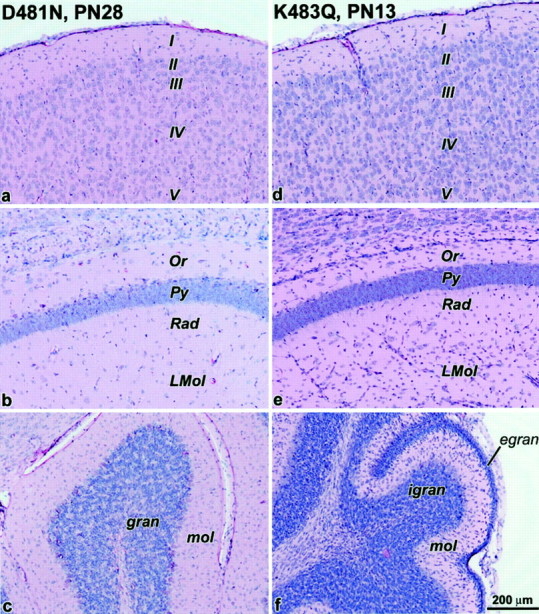
Bright-field images of hematoxylin/eosin-stained brain sections from Grin1D481Nand Grin1K483Qmice. No morphological abnormalities were apparent for either 28-d-oldGrin1D481Nor 13-d-oldGrin1K483Qmice in the cerebral cortex (a, d), hippocampal CA1 region (b, e), and cerebellum (c,f), respectively. I–V, Cortical layers; Or, oriens layer of CA1; Py, pyramidal layer of CA1; Rad, radiatum layer of CA1;Lmol, lacunosum moleculare layer of CA1;gran, granule cell layer of cerebellum;egran, external granule cell layer;igran, internal granule cell layer; mol, molecular layer of cerebellum.
Expression levels of NMDA receptor subunits in control andGrin1D481N mice
The expression levels of NMDAR1, NR2A, NR2B, and NR2C were assessed in 28-d-old wild-type andGrin1D481Nmice by in situ hybridization histochemistry and for NMDAR1, NR2A, and NR2B by Western blot analysis. Although NMDAR1 expression levels in mutant mice were not significantly different from controls in the caudate putamen, cortex, and hippocampus, we observed significantly increased expression levels in the thalamus and cerebellum (Fig.4A). Interestingly, the NR2A and NR2C subunits were also significantly upregulated in the cerebellum of mutant mice, and NR2C was also significantly upregulated in the thalamus, caudate putamen, and cortex (Fig.4A). At the protein level, we observed minor changes in the expression levels of NMDAR1 in the cortex, striatum, and hippocampus of the mutants, accompanied by a large increase in the cerebellum (Fig. 5). Only minor changes in NR2A protein levels were apparent in mutant mice. NR2B protein was somewhat upregulated in the cortex and striatum, with only minor changes in the hippocampus of the mutants. Notably, although no NR2B protein was detectable in the cerebellum of 28-d-old wild-type mice, protein was detectable in mutants (Fig. 5). Autoradiography with the NR2B-selective ligand antagonist [3H]Ro 25-6981 (Fischer et al., 1997; Mutel et al., 1998) revealed a significant increase in binding in only the cortex of mutant mice (Fig.4A,B).
Fig. 4.

In situ hybridization and receptor autoradiography analysis of NMDA receptor subunit expression in wild-type and Grin1D481N mice.A, Percentage change (mean ± SE) in NMDA receptor subunit mRNA hybridization signal and [3H]Ro 25-6981 binding in brains of Grin1D481Nmice versus controls revealed by quantitative radioautography and image analysis (*p < 0.05, **p < 0.01, two-tailed t test).B, Regional distribution of in vitrobinding sites for [3H]Ro 25-6981 (selective for NMDA receptors containing NR2B) in parasagittal brain sections of wild-type and Grin1D481Nmice revealed by receptor radioautography. White areasindicate high levels of binding.
Fig. 5.

Expression of NMDAR1, NR2A, and NR2B protein in the cortex, striatum, hippocampus, and cerebellum of wild-type andGrin1D481N mice revealed by Western blot analysis. Optical densities of the protein bands fromGrin1D481Nmice are expressed relative to the values obtained from respective brain regions in wild-type animals.
Grin1D481Nand Grin1K483Qmice exhibit reduced NMDA receptor glycine but not glutamate affinity
Glycine and glutamate concentration–response curves were performed using whole-cell voltage-clamp recordings from acutely dissociated hippocampal neurons prepared from 5- to 12-d-old animals. Glycine concentration–response curves were constructed by jumping rapidly from a control solution to one containing 100 μmNMDA in the presence of increasing concentrations of glycine in both control and NMDA-containing solutions. Monophasic glycine concentration–response curves from wild-type,Grin1D481N, andGrin1K483Qmice yielded meanpmKD values of 7.42 ± 0.05, 6.76 ± 0.09, and 5.47 ± 0.06, respectively (mean ± SE; n = 7, 5, and 6 neurons, respectively). A plot of the data from all neurons normalized to their respective individual predicted maximum peak response from individual curves fit with the two-equivalent binding-site model (Eq. 1) yieldedmKD values of 0.038, 0.19, and 3.26 μm for wild-type,Grin1D481N, andGrin1K483Qmice, respectively (Fig.6A). Mean maximum current amplitudes in neurons fromGrin1D481N(1041 ± 329 pA) andGrin1K483Q(1043 ± 199 pA) mice were not significantly different from those of wild-type animals (1179 ± 75 pA). Glycine concentration–response curves from neurons from wild-type and mutant mice were generally monophasic but were occasionally biphasic with a lower affinity component, which is likely to represent NR2A-containing receptors that are upregulated during ontogeny (Kew et al., 1998). To simplify the analysis, neurons generating biphasic curves have been excluded. However, it should be noted that the mean pmKD value of the high-affinity component of biphasic curves fromGrin1D481Nmice, 6.70 ± 0.07, was not significantly different from that of the monophasic curves (two-tailed t-test, p > 0.58). Insufficient numbers of biphasic curves were recorded from wild-type orGrin1K483Qmice to permit statistical analysis.
Fig. 6.

Glycine and glutamate concentration–response data from wild-type, Grin1D481N, and Grin1K483Q mice. A, Plot of the glycine concentration–response curves from acutely dissociated hippocampal neurons from wild-type,Grin1D481N, andGrin1K483Q mice. Curves fitted with the two-equivalent binding site model yieldedmKD values of 0.038, 0.19, and 3.26 μm, respectively. Inward currents were elicited in response to 2 sec applications of 100 μm NMDA at 29 sec intervals in the presence of increasing concentrations of glycine. Peak current–response amplitudes were normalized to the respective maximum peak response derived from a fitted curve of the peak glycine concentration–response data for each individual neuron using the two-equivalent binding site model. B, Glutamate concentration–response curves from acutely dissociated hippocampal neurons from wild-type, Grin1D481N, andGrin1K483Q mice. Curves fitted with the two-equivalent binding site model yieldedmKD values of 1.9, 1.8, and 2 μm, respectively. Inward currents were elicited at 29 sec intervals in response to 2 sec applications of increasing concentrations of glutamate in the continuous presence of 30 μm glycine and 10 μm NBQX. Mean ± SE peak currents have been normalized to the respective maximum peak response derived from a fitted curve of the peak glutamate concentration–response data for each individual neuron using the two-equivalent binding site model. C, Effect on intracellular Ca2+, as measured by fura-2 imaging, of stimulation of neurons with NMDA (100 μm) and variable concentrations of glycine. Cortical neurons from single rat embryos were stimulated with NMDA (100 μm) plus variable concentrations of glycine as indicated for 30 sec; stimuli were separated by 5 min washes. The ratio values of 340/380 (100×) from representative experiments are shown as means ± SD (wild type: n = 17;Grin1K483Q: n = 34).
Glutamate concentration–response curves were constructed by jumping rapidly from a control solution into one containing increasing concentrations of glutamate in the continuous presence of 30 μm glycine and 10 μm NBQX in both the control and glutamate-containing solutions. Glutamate concentration–response curves from all animals were monophasic. Fits of the mean data with the two-equivalent binding-site model yieldedmKD values of 1.9, 1.8, and 2.0 μm for wild-type,Grin1D481N, andGrin1K483Qmice, respectively (n = 9, 9, and 5, respectively) (Fig.6B).
The reduction in NMDA receptor glycine affinity inGrin1K483Qmice was further illustrated by assaying the glycine concentration-dependent increases in intracellular Ca2+ concentration evoked by costimulation of cultured cortical neurons with both NMDA (100 μm) and increasing concentrations of glycine. Cultured cortical neurons from homozygousGrin1K483Qembryos (embryonic day 17) exhibited a markedly reduced sensitivity to glycine compared with wild-type neurons (Fig. 6C).
Grin1D481Nmice exhibit a deficit in hippocampal theta burst-induced LTP
Occupation of the glycine site is required for NMDA receptor function (Johnson and Ascher, 1987; Kleckner and Dingledine, 1988), and NMDA receptor activation is required for induction of certain forms of LTP (Bliss and Collingridge, 1993). Therefore, we compared LTP evoked in hippocampal slices from wild-type andGrin1D481Nmutant mice. Potentiation induced by theta burst stimulation was significantly attenuated inGrin1D481Nmutants compared with wild-type controls throughout the post-tetanus period (2–60 min, ANOVA, p < 0.01) (Fig.7A). Thus,Grin1D481Nmice exhibit a deficit in the induction of LTP.
Fig. 7.

Theta burst-induced LTP in wild-type andGrin1D481N mice.A, Hippocampal slices (400 μm) from wild-type (solid squares, n = 10) and Grin1D481N mice (open circles, n = 10) were maintained in an interface chamber at 35°C, and fEPSPs were elicited by stimulation of the Schaffer collateral/commissural afferents (100 μsec, 0.05 Hz) and recorded in the CA1 stratum radiatum. LTP was induced using a TBS paradigm. Mean ± SE fEPSP slopes are expressed as a percentage of baseline values recorded 10 min before TBS. B, NMDA-evoked population depolarizations of cortical slices from wild-type (solid bars, n = 6–13) and Grin1D481Nmice (open bars, n = 14). Mean ± SE depolarizations produced by application of 20 μmNMDA in the presence of increasing concentrations ofd-serine are expressed as a percentage increase relative to the depolarization evoked by 20 μm NMDA alone in each individual slice (i.e., 20 μm NMDA alone = 0%). The relative increase in response amplitude after addition of 30, 100, and 300 μmd-serine was significantly greater in slices fromGrin1D481Nmice compared with wild type (**p < 0.01, two-tailed ttest).
This deficit might result from the reduction in NMDA receptor glycine affinity and the consequent reduced level of NMDA receptor glycine site occupation in brain slices fromGrin1D481Nmice. To examine the relative level of NMDA receptor glycine site occupation in brain slices from wild-type and Grin1D481Nmice, we used a greased-gap cortical wedge technique. In cortical wedges from wild-type animals, the level of occupation of the glycine site by endogenous agonists is such that addition of NMDA (20 μm) elicits a robust depolarization. Addition of increasing amounts of the NMDA receptor glycine site agonistd-serine, which is not taken up at glycine transporters (Supplisson and Bergman, 1997), increased the amplitude of NMDA-mediated depolarizations in a concentration-dependent manner in cortical wedges from both wild-type andGrin1D481N mice (Fig.7B). However, the relative increase in response amplitude after addition of 30, 100, and 300 μmd-serine was significantly greater in slices fromGrin1D481Ncompared with wild-type mice (p < 0.01, two-tailed t test). Thus, although the NMDA receptor glycine site is apparently not saturated in control brain slices from either wild-type orGrin1D481Nmice, addition of exogenous agonists results in a larger relative increase in response amplitude in mutant mice, thus indicating a reduced level of NMDA receptor glycine site occupancy in untreated slices relative to wild-type controls. In agreement, the mean depolarization elicited by 20 μm NMDA in the absence of exogenousd-serine was significantly smaller inGrin1D481Nmice (0.58 ± 0.11 mV, n = 14) compared with wild-type controls (1.14 ± 0.15 mV, n = 13) (p < 0.01, two-tailed t test), whereas that elicited in the presence of 300 μmd-serine was not significantly different (0.89 ± 0.14 mV and 1.35 ± 0.17 mV, respectively; p > 0.05, two-tailed ttest).
Behavioral assays
Wild-type mice (n = 8) showed normal reflexes, had no sign of abnormalities, and were able to perform in the horizontal wire test. Five of the mutant mice (n = 8) exhibited deficits in the horizontal wire test in that although the animals could hold the wire with their forepaws, they were unable to lift their hindpaws onto the wire. The remaining three animals performed normally. Pinna, corneal, and toe-pinch reflexes were normal in all mutant animals. One of the mutant mice exhibited an arched back, piloerection, tremors, and a decrease of locomotor activity, and two others had no fur around their nose. No significant difference was observed between the wild-type and mutant mice on the rotarod apparatus (mean latency: wild type = 120 sec, Grin1D481N= 116 ± 4 sec; two-tailed t test,p > 0.05). However, one of the mutant animals could not stay on the rotarod for 2 min even after four attempts. No significant difference was observed between the wild-type and mutant mice in the tail-flick (mean latency: wild type = 1.88 ± 0.51 sec, Grin1D481N= 2.36 ± 0.81 sec; two-tailed t test, p > 0.05) and hot-plate tests (mean latency: wild type = 9.24 ± 0.52 sec,Grin1D481N= 7.56 ± 0.61 sec; two-tailed t test, p > 0.05).
Locomotor activity
Grin1D481N mice spent a significantly longer time in the center of the cage compared with wild-type controls (10771 ± 2395 and 3995 ± 1609 sec, respectively; mean ± SE, n = 8; two-tailedt-test, p < 0.05) over the 8 hr test period. Under these conditions, there was no significant difference in horizontal or vertical activity or level of stereotypic behavior over the same time period in both groups (Fig.8). When the mice were placed in a larger area (40 × 40 × 30.5 cm), there was again a significant increase of the time spent in the center of the cage (data not shown).
Fig. 8.

Locomotor activity and number of stereotypies in wild-type andGrin1D481N mice. Locomotor activity profile of wild-type (solid squares) andGrinD481Nmice (open circles) measured in the Omnitech apparatus. Groups of eight mice per group were used. The locomotor activity profile was recorded for 8 hr. The figure shows horizontal activity (A), vertical activity (B), number of stereotypies (C), and center time (D). Inset bar graphs represent the cumulative values for 8 hr (*p < 0.05, two-tailed t test).
Light/dark test
There was no significant difference between wild-type andGrin1D481Nmice in terms of time spent in the lit area (97 ± 17 and 141 ± 27 sec, respectively; mean ± SE, n = 8), number of transitions (10.5 ± 1.5 and 8 ± 1.9), or number of attempts to go from dark to lit box (13.5 ± 4 and 10.9 ± 3.9; two-tailed t test, p > 0.05). However, a trend toward spending more time in the lit area was apparent forGrin1D481Nmice.
Morris water maze
To test the spatial learning ability ofGrin1D481Nmice, they were trained in a water maze to find a fixed, hidden platform using distal cues (Morris et al., 1982, 1986). Grin1D481Nmice exhibited deficits in learning this task compared with wild-type controls (Fig. 9A).Grin1D481Nmice and controls achieved a similar final level of performance with escape latencies of 11.4 ± 3.4 and 11.0 ± 1.7 sec at the final session, respectively (mean ± SE, n = 9 and 10, respectively). However, acquisition of the task was impaired in the mutants, with significantly slower escape latencies than control animals in sessions 2, 3 (p < 0.01), and 4 (p < 0.05, two-way ANOVA for repeated measures). Swim speeds of the mutant and control animals were not significantly different [ANOVA, p > 0.05, e.g., mean ± SE (centimeters per second) for mutant and control, respectively; session 1: 14.8 ± 1.8 and 17.5 ± 0.8; session 4: 16.8 ± 1.8 and 12.3 ± 0.9; session 7: 12.2 ± 1.4 and 9.6 ± 1.2]. In a probe test performed immediately after the final training session, both wild-type and mutant mice exhibited a similar preference for the target area, as assessed by time spent in the target quadrant and the number of crossings over the platform's original position (Fig. 9B). Neither group showed a significant preference for the target as assessed by the number of crossings (ANOVA, p > 0.05). Wild-type animals spent a significantly greater time in the target quadrant versus the opposite and adjacent right quadrants (ANOVA, p < 0.05); however, there was no significant difference between time spent in the target and adjacent left quadrants (ANOVA, p > 0.05). Mutant animals showed no significant preference for the target quadrant (ANOVA, p > 0.05). Swim path analysis suggested that both groups of animals had adopted similar search strategies (data not shown).
Fig. 9.
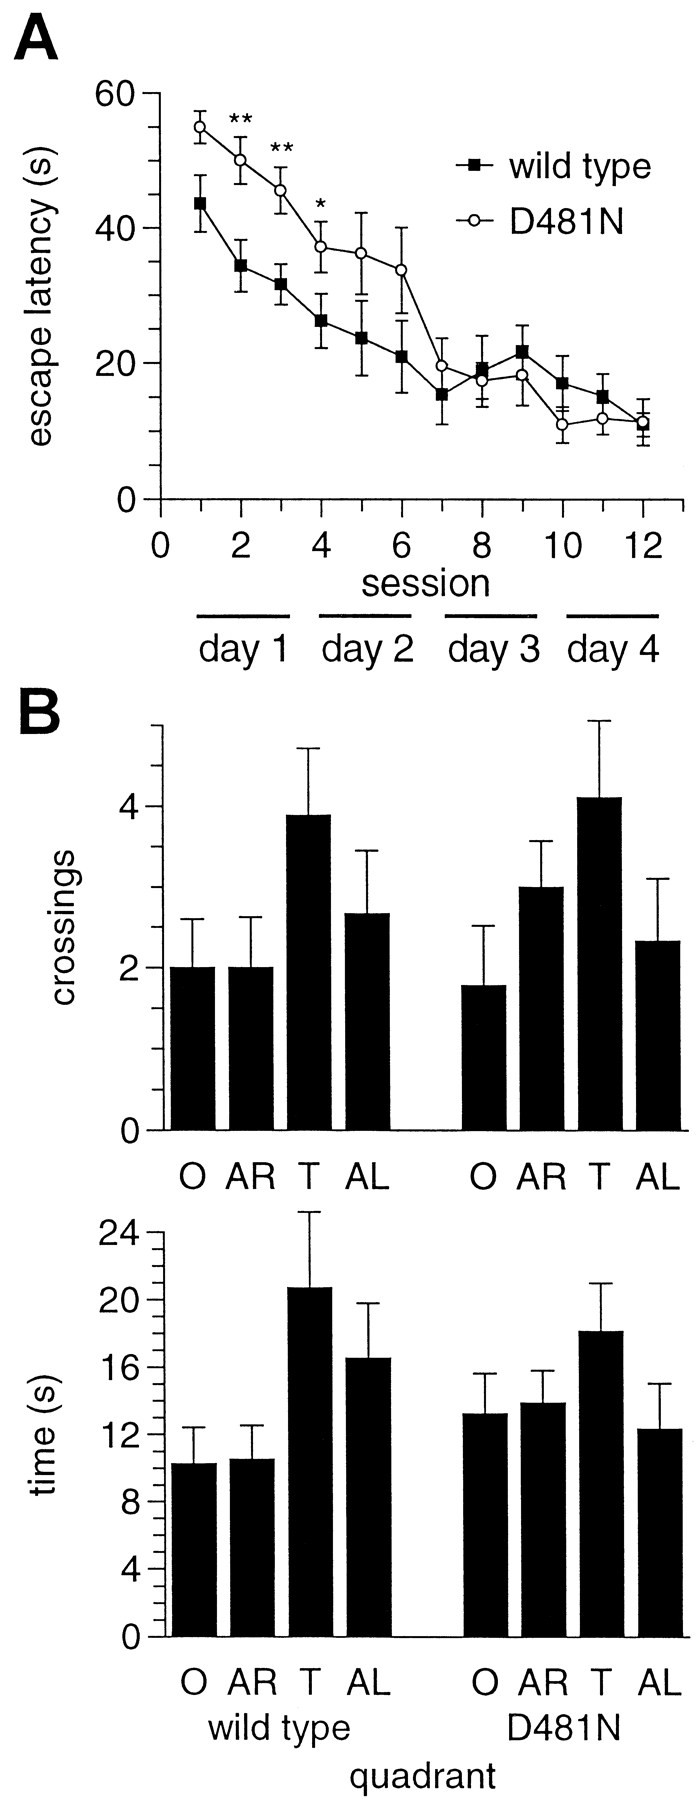
Spatial learning in the Morris water maze in wild-type and Grin1D481Nmice. A,Grin1D481N(n = 9) and wild-type (n = 10) mice were trained for 4 d with three sessions per day and three trials per session. The mean ± SE time to reach the hidden platform in the pool (escape latency) was plotted against the training session (*p < 0.05, **p < 0.01, ANOVA). B, After the final trial on day 4, the platform was removed, and mice were allowed to swim freely for 60 sec. Mean ± SE time spent in each quadrant and the mean ± SE number of crossings over the platform position are shown for wild-type and Grin1D481Nanimals. T, Target quadrant; O, opposite; AR, adjacent right; AL, adjacent left.
Auditory startle and PPI of the startle reflex
Grin1D481N mice exhibited an exaggerated startle response as compared with wild-type animals. Two-way ANOVA revealed a significant effect (F(1,21) = 7.78, p < 0.01), and post hoc analysis indicated that the mutant mice had significantly higher startle response to 90 and 110 dB as compared with the wild-type animals (Fig.10A). Mutant mice also exhibited a lower threshold for startle reactivity. Indeed, as compared with NST, control animals exhibited a significant startle response only to a 110 dB stimulus (Fisher's least significant difference test, p < 0.0001), whereas mutant mice exhibited an exaggerated startle response to both 90 and 110 dB (p < 0.05 and p < 0.0001, respectively). In the PPI assay, mutant and wild-type mice did not show any significant difference at the various prepulse intensities tested (F(1,21) = 0.13, p > 0.05) (Fig. 10B).
Fig. 10.

Magnitude and prepulse inhibition of the acoustic startle response in wild-type andGrin1D481N mice. A, Magnitude (mean ± SE) of the startle response to various acoustic stimuli (NST: no stimulus, 68 dB background noise; P72–P90: acoustic stimuli of 72–90 dB; ST: 110 dB stimulus; PP72–PP90: 110 dB stimulus preceded by a prepulse of 72–90 dB). Wild-type mice =open bars (n = 12);Grin1D481Nmice =closed bars (n = 11). +indicates statistically significant difference as compared with NST (p < 0.05, Fisher's PLSD test). * indicates statistically significant difference between wild-type andGrin1D481Nmice (p < 0.05 Fisher's PLSD test).B, Percentage prepulse inhibition (mean ± SE) of the acoustic startle response at various prepulse intensities in wild-type and Grin1D481Nmice.
Intracerebroventricular NMDA-induced convulsions
Grin1D481N mice were less sensitive to intracerebroventricular NMDA-induced convulsions as compared with wild-type animals. Mutant mice exhibited a much higher latency for NMDA-induced wild running (two-tailed t test,p < 0.001) and clonic convulsions (two-tailedt test, p < 0.05) as compared with wild-type mice. During the 5 min observation period, 4 of 12 wild-type mice exhibited clonic seizures (mean latency to exhibit symptoms = 23 sec) and 11 of 12 showed wild running (mean latency = 19.3 sec). None of the mutant mice exhibited clonic seizures, and only 2 of 11 showed wild running activity (mean latency = 27.5 sec).
DISCUSSION
Using targeted mutagenesis in ES cells, we have generated two mouse lines carrying point mutations in amino acids believed to form part of the NMDA receptor glycine binding site. NMDA receptors in acutely dissociated hippocampal neurons from homozygousGrin1D481NandGrin1K483Qmice exhibit 5- and 85-fold reductions in glycine affinity, respectively, relative to wild-type controls, whereas receptor glutamate affinity was unaffected. This is in good agreement with the reductions in receptor glycine affinity previously reported for identical mutations in recombinant receptors expressed in Xenopus oocytes (Wafford et al., 1995). Transferal of the mutant phenotype from recombinant to native receptor infers a dominant role for the NMDAR1 subunit in the determination of receptor glycine affinity and strongly supports the localization of the glycine binding site on the NMDAR1 subunit.
NMDA receptor function appears to be critical for postnatal survival because both NMDAR1 (Grin1)−/−and ε2 (NR2B, Grin2b)−/−mice die shortly after birth (Forrest et al., 1994; Li et al., 1994;Kutsuwada et al., 1996). Our results support this observation becauseGrin1K483Qmice, in which NMDA receptor function would be expected to be greatly impaired, are also not viable. Grin1K483Qneonates do not appear to exhibit respiratory distress as observed in NMDAR1 (Grin1)−/−mice (Forrest et al., 1994; Li et al., 1994) but rather resemble theε2 (NR2B, Grin2b)−/−mice, which lack the suckling response and do not feed (Kutsuwada et al., 1996). NMDA receptors in acutely dissociated hippocampal neurons from neonatal Grin1K483Qmice exhibited an mKD (equivalent to an EC25) for glycine of 3.26 μm. Transporters might reduce the glycine concentration in the local microenvironment of synaptic NMDA receptors to below 1 μm (Supplisson and Bergman, 1997;Berger et al., 1998; Bergeron et al., 1998). Thus, the proportion of NMDA receptors occupied by glycine and available for activation after release of glutamate in the brains of these animals would be expected to be very low. There were no gross abnormalities in CNS anatomy in rare Grin1K483Qmice, which survived to postnatal day 13. This suggests that NMDA receptor function is not essential for embryonic or early postnatal development of the major CNS structures in agreement with the reported phenotype of the NMDAR1 (Grin1)−/−and ε2 (NR2B, Grin2b)−/−mice (Forrest et al., 1994; Kutsuwada et al., 1996).
The NMDA receptor NR2 subunit exerts a major influence on receptor glycine affinity (Ikeda et al., 1992; Kutsuwada et al., 1992; Priestley and Kemp, 1993; Priestley et al., 1995; Kew et al., 1998). It is interesting to note that NR2D-containing receptors exhibit the highest affinity for glycine (Ikeda et al., 1992) and that NR2D is expressed at high levels in the embryonic and early postnatal mouse diencephalon and brainstem, after which time expression decreases to very low levels (Watanabe et al., 1992). Furthermore, NR2A-containing receptors, which exhibit the lowest affinity for glycine (Kutsuwada et al., 1992), are upregulated postnatally throughout the brain (Watanabe et al., 1992). The developmental changes in NR2 subunits thus might result in a net reduction in NMDA receptor glycine affinity, further compromising NMDA receptor function in the Grin1K483Qmice, which may result in death. It is also interesting to speculate that NR2A-containing receptors (with the lowest glycine affinity) might be selectively impaired inGrin1D481Nanimals.
Changes in NMDA receptor subunit expression at both the message and protein level were observed in Grin1D481Nmutant mice compared with wild-type controls, perhaps reflecting a compensatory response to the reduction in receptor glycine affinity. The marked elevation of NR2B protein in the cerebellum ofGrin1D481Nmice is particularly notable, because in wild-type animals there is a developmental switch from prominent cerebellar NR2A and NR2B expression at early postnatal time points to a complete downregulation of NR2B expression, accompanied by an upregulation of NR2C expression, in young adults (Watanabe et al., 1992). Smaller increases in NR2B protein were evident in the cortex and striatum; however, significant increases in binding of the NMDA NR2B subunit selective antagonist [3H]Ro 25-6981 (Fischer et al., 1997;Mutel et al., 1998) were evident only in the cortex. The reason for the discrepancy between the changes in NR2B protein and [3H]Ro 25-6981 binding is unclear. Interestingly, no high-affinity [3H]Ro 25-6981 binding was detected in homogenates from human embryonic kidney 293 cells expressing recombinant NR2B alone (Hawkins et al., 1999), raising the possibility that the increased levels of protein detected by Western blot analysis do not necessarily reflect an increase in functional receptors accessible to the radioligand.
Grin1D481Nmice, in which receptor glycine affinity is reduced fivefold, exhibit physiological and behavioral abnormalities. In the context of the many previous pharmacological studies using NMDA receptor antagonists, these abnormalities are largely compatible with a mild reduction in NMDA receptor function. However, it should be noted that the mutations may influence physiological parameters, which have not been analyzed in this study, and the demonstrated reduction in NMDA receptor glycine affinity might not underlie all of the observed phenotypic changes.
NMDA receptor activation is necessary for both the induction of LTP in the hippocampal CA1 and spatial learning (Morris et al., 1986; Larson and Lynch, 1988; Tsien et al., 1996). In situ hybridization analysis showed no significant change in NMDAR1 or NR2A, NR2B, or NR2C mRNA expression in the hippocampi ofGrin1D481Nmice, and Western blot analysis revealed only minor changes in protein levels. Thus, changes in NMDA receptor subunit expression are unlikely to contribute to a reduction in NMDA receptor function. In agreement, there was no significant difference in whole-cell current amplitude in acutely dissociated hippocampal neurons from mutant and wild-type mice. The deficit in LTP induction observed inGrin1D481Nmice is consistent with a reduction in NMDA receptor activation during tetanic stimulation attributable to reduced receptor glycine site occupancy relative to wild-type animals. Such a reduced level of NMDA receptor glycine site occupancy is supported by the observation that cortical wedges from Grin1D481Nmice exhibited a relatively larger increase in NMDA-mediated depolarization in the presence of saturating concentrations of d-serine than wedges from wild-type animals. In agreement, the mean depolarization elicited by 20 μm NMDA in the absence of exogenous glycine site ligands was significantly smaller, and this difference was normalized in the presence of 300 μmd-serine. A reduction in NMDA receptor glycine site occupancy is also consistent with the reduced sensitivity of the Grin1D481Nmice to intracerebroventricular NMDA-induced convulsions.Grin1D481Nmice also exhibited a deficit in spatial learning in the Morris water maze. Although their final performance level was not significantly different from wild-type controls, acquisition of the task was impaired in mutant mice. A probe test revealed that both sets of animals appeared to adopt similar search strategies but indicated a trend toward improved spatial memory in the wild-type animals. Thus, inGrin1D481Nmice, whose NMDA receptor function is compromised because of the reduction in receptor glycine affinity, there is an impairment in both hippocampal LTP and spatial learning.
NMDA receptors appear to play a role in other behavioral paradigms, including sensorimotor gating and anxiety. Both competitive glutamate site and noncompetitive NMDA receptor antagonists disrupt PPI (Bakshi and Geyer, 1998; Bakshi et al., 1999), a frequently used model of the sensorimotor gating deficits observed in schizophrenia, whereas the effect of NMDA receptor glycine site antagonists is less clear (Bristow et al., 1995; Baron et al., 1997; Furuya and Ogura, 1997; Kretschmer and Koch, 1997; Kretschmer et al., 1997). In our study,Grin1D481Nmice behaved indistinguishably from wild-type controls in this assay, although, notably, they exhibited an increased startle reactivity.
A number of studies have reported anxiolytic activity of NMDA receptor glycine site antagonists (Matheus et al., 1994; Kotlinska and Liljequist, 1998). In the locomotor activity test,Grin1D481Nmice spent a significantly longer time in the center of the cage compared with wild-type animals, which could indicate a reduced level of anxiety. Mutants performed otherwise indistinguishably from wild-type animals in this assay, suggesting no major neurological deficits, in agreement with the motor coordination test and the behavioral observations in the “Irwin test.” In the light/dark test, the mutant mice exhibited a tendency to spend more time in the lit area, which may also indicate a decreased natural aversion to an exposed environment. Further studies are necessary to better characterize the effects of the mutation on anxiety-related behaviors.
In conclusion, a severe reduction in NMDA receptor glycine affinity results in a lethal phenotype consistent with the observation that occupation of the NMDA receptor glycine site is obligatory for receptor activation and further illustrates the critical role of NMDA receptor activation for neonatal survival. A moderate (fivefold) reduction in receptor glycine affinity results in an impairment in LTP and spatial learning and changes in anxiety-related behaviors, providing further evidence for the role of NMDA receptors in these processes. Interestingly, the observed behavioral changes in these animals suggest that the ambient glycine concentration is not far above threshold in wild-type animals.
Footnotes
We thank Marie-Claire Pflimlin, Urs Humbel, Veronique Graf, Birgit Molitor, Danièle Buchy, Marie-Laurence Harlé-Ygé, Yolande Lang, and Jürg Messer for expert technical assistance. We also thank Dr. Guy Higgins for helpful discussion of this manuscript.
J.N.C.K. and A.K. contributed equally to this work.
Correspondence should be addressed to James N. C. Kew, Pharma Division, Preclinical CNS Research, F. Hoffmann-La Roche Ltd., Building 70/343, CH-4070 Basel, Switzerland. E-mail:james_n.kew@roche.com.
Dr. Koester's present address: Eli Lilly, Lilly Corporate Center DC 0444, Indianapolis, IN 46285.
Dr. Reinscheid's present address: Department of Pharmacology, College of Medicine, 354 Med Surge II, University of California Irvine, Irvine, CA 92697-4625.
REFERENCES
- 1.Anson LC, Chen PE, Wyllie DJA, Colquhoun D, Schoepfer R. Identification of amino acid residues of the NR2A subunit that control glutamate potency in recombinant NR1/NR2A NMDA receptors. J Neurosci. 1998;18:581–589. doi: 10.1523/JNEUROSCI.18-02-00581.1998. [DOI] [PMC free article] [PubMed] [Google Scholar]
- 2.Bakshi VP, Geyer MA. Multiple limbic regions mediate the disruption of prepulse inhibition produced in rats by the non-competitive NMDA antagonist dizolcilpine. J Neurosci. 1998;18:8394–8401. doi: 10.1523/JNEUROSCI.18-20-08394.1998. [DOI] [PMC free article] [PubMed] [Google Scholar]
- 3.Bakshi VP, Tricklebank M, Neijt HC, Lehmann-Masten V, Geyer MA. Disruption of prepulse inhibition and increases in locomotor activity by competitive N-methyl-d-aspartate receptor antagonists in rats. J Pharmacol Exp Ther. 1999;288:643–652. [PubMed] [Google Scholar]
- 4.Baron BM, Harrison BL, Kehne JH, Schmidt CJ, van Giersbergen PL, White HS, Siegel BW, Senyah Y, McCloskey TC, Fadayel GM, Taylor VL, Murawsky MK, Nyce P, Salituro FG. Pharmacological characterisation of MDL 105,519, an NMDA receptor glycine site antagonist. Eur J Pharmacol. 1997;323:181–192. doi: 10.1016/s0014-2999(97)00045-9. [DOI] [PubMed] [Google Scholar]
- 5.Benveniste M, Mayer ML. Kinetic analysis of antagonist action at N-methyl-d-aspartic acid receptors. Biophys J. 1991;59:560–573. doi: 10.1016/S0006-3495(91)82272-X. [DOI] [PMC free article] [PubMed] [Google Scholar]
- 6.Berger AJ, Dieudonne S, Ascher P. Glycine uptake governs glycine site occupancy at NMDA receptors of excitatory synapses. J Neurophysiol. 1998;80:3336–3340. doi: 10.1152/jn.1998.80.6.3336. [DOI] [PubMed] [Google Scholar]
- 7.Bergeron R, Meyer TM, Coyle JT, Greene RW. Modulation of N-methyl-d-aspartate receptor function by glycine transport. Proc Natl Acad Sci USA. 1998;95:15730–15734. doi: 10.1073/pnas.95.26.15730. [DOI] [PMC free article] [PubMed] [Google Scholar]
- 8.Bliss TV, Collingridge GL. A synaptic model of memory: long-term potentiation in the hippocampus. Nature. 1993;361:31–39. doi: 10.1038/361031a0. [DOI] [PubMed] [Google Scholar]
- 9.Borowsky B, Mezey E, Hoffman BJ. Two glycine transporter variants with distinct localization in the CNS and peripheral tissues are encoded by a common gene. Neuron. 1993;10:851–863. doi: 10.1016/0896-6273(93)90201-2. [DOI] [PubMed] [Google Scholar]
- 10.Bristow LJ, Landon L, Saywell KL, Tricklebank MD. The glycine/NMDA receptor antagonist, l-701,324 reverses isolation-induced deficits in prepulse inhibition in the rat. Psychopharmacology. 1995;118:230–232. doi: 10.1007/BF02245847. [DOI] [PubMed] [Google Scholar]
- 11.Chirgwin JM, Przybyla AE, MacDonald RJ, Rutter WJ. Isolation of biologically active ribonucleic acid from sources enriched in ribonulease. Biochemistry. 1979;18:5294–5299. doi: 10.1021/bi00591a005. [DOI] [PubMed] [Google Scholar]
- 12.Clements JD, Westbrook GL. Activation kinetics reveal the number of glutamate and glycine binding sites on the N-Methyl-d-aspartate receptor. Neuron. 1991;7:605–613. doi: 10.1016/0896-6273(91)90373-8. [DOI] [PubMed] [Google Scholar]
- 13.Ferrer-Montiel AV, Montal M. Pentameric subunit stoichiometry of a neuronal glutamate receptor. Proc Natl Acad Sci USA. 1996;93:2741–2744. doi: 10.1073/pnas.93.7.2741. [DOI] [PMC free article] [PubMed] [Google Scholar]
- 14.Fischer G, Mutel V, Trube G, Malherbe P, Kew JNC, Mohacsi E, Heitz M-P, Kemp JA. Ro 25-6981, a highly potent and selective blocker of N-methyl-d-aspartate receptors containing the NR2B subunit. Characterization in vitro. J Pharmacol Exp Ther. 1997;283:1285–1292. [PubMed] [Google Scholar]
- 15.Forrest D, Yuzaki M, Soares HD, Ng L, Luk DC, Sheng M, Stewart CL, Morgan JI, Connor JA, Curran T. Targeted disruption of the NMDA receptor 1 gene abolishes NMDA response and results in neonatal death. Neuron. 1994;13:325–338. doi: 10.1016/0896-6273(94)90350-6. [DOI] [PubMed] [Google Scholar]
- 16.Furuya Y, Ogura H. Competitive NMDA and strychnine-insensitive glycine-site antagonists disrupt prepulse inhibition. Pharmacol Biochem Behav. 1997;57:909–913. doi: 10.1016/s0091-3057(96)00452-2. [DOI] [PubMed] [Google Scholar]
- 17.Grynkiewicz G, Poenie M, Tsien RY. A new generation of Ca2+ indicators with greatly improved fluorescence properties. J Biol Chem. 1985;260:3440–3450. [PubMed] [Google Scholar]
- 18.Gu H, Zou YR, Rajewsky K. Independent control of immunoglobulin switch recombination at individual switch regions evidenced through Cre-loxP-mediated gene targeting. Cell. 1993;73:1155–1164. doi: 10.1016/0092-8674(93)90644-6. [DOI] [PubMed] [Google Scholar]
- 19.Hawkins LM, Chazot PL, Stephenson FA. Biochemical evidence for the co-association of three N-methyl-d-aspartate (NMDA) R2 subunits in recombinant NMDA receptors. J Biol Chem. 1999;274:27211–27218. doi: 10.1074/jbc.274.38.27211. [DOI] [PubMed] [Google Scholar]
- 20.Hirai H, Kirsch J, Laube B, Betz H, Kuhse J. The glycine binding site of the N-methyl-d-aspartate receptor subunit NR1: identification of novel determinants of co-agonist potentiation in the extracellular M3–M4 loop region. Proc Natl Acad Sci USA. 1996;93:6031–6036. doi: 10.1073/pnas.93.12.6031. [DOI] [PMC free article] [PubMed] [Google Scholar]
- 21.Hollmann M, Boulter J, Maron C, Beasley L, Sullivan J, Pecht G, Heinemann S. Zinc potentiates agonist-induced currents at certain splice variants of the NMDA receptor. Neuron. 1993;10:943–954. doi: 10.1016/0896-6273(93)90209-a. [DOI] [PubMed] [Google Scholar]
- 22.Ikeda K, Nagasawa M, Mori H, Araki K, Sakimura K, Watanabe M, Inoue Y, Mishina M. Cloning and expression of the ε4 subunit of the NMDA receptor channel. FEBS Lett. 1992;313:34–38. doi: 10.1016/0014-5793(92)81178-o. [DOI] [PubMed] [Google Scholar]
- 23.Irwin S. Comprehensive observational assessment: Ia. A systematic, quantitative procedure for assessing the behavioral and psychologic state of the mouse. Psychopharmacologia. 1968;13:222–257. doi: 10.1007/BF00401402. [DOI] [PubMed] [Google Scholar]
- 24.Johnson JW, Ascher P. Glycine potentiates the NMDA response in cultured mouse brain neurons. Nature. 1987;325:529–531. doi: 10.1038/325529a0. [DOI] [PubMed] [Google Scholar]
- 25.Kemp JA, Leeson PD. The glycine site of the NMDA receptor—five years on. Trends Pharmacol Sci. 1993;14:20–25. doi: 10.1016/0165-6147(93)90108-v. [DOI] [PubMed] [Google Scholar]
- 26.Kemp JA, Marshall GR, Priestley T. A comparison of the agonist-dependency of the block produced by uncompetitive NMDA receptor antagonists on rat cortical slices. Mol Pharmacol. 1991;1:65–70. [Google Scholar]
- 27.Kew JNC, Richards JG, Mutel V, Kemp JA. Developmental changes in NMDA receptor glycine affinity and ifenprodil sensitivity reveal three distinct populations of NMDA receptors in individual rat cortical neurons. J Neurosci. 1998;18:1935–1943. doi: 10.1523/JNEUROSCI.18-06-01935.1998. [DOI] [PMC free article] [PubMed] [Google Scholar]
- 28.Kleckner NW, Dingledine R. Requirement for glycine in activation of NMDA-receptors expressed in Xenopus oocytes. Science. 1988;241:835–837. doi: 10.1126/science.2841759. [DOI] [PubMed] [Google Scholar]
- 29.Kotlinska J, Liljequist S. A characterisation of anxiolytic-like actions induced by the novel NMDA/glycine site antagonist, l-701,324. Psychopharmacology. 1998;135:175–181. doi: 10.1007/s002130050499. [DOI] [PubMed] [Google Scholar]
- 30.Kretschmer BD, Koch M. Role of the strychnine-insensitive glycine binding site in the nucleus accumbens and anterodorsal striatum in sensorimotor gating: a behavioural and microdialysis study. Psychopharmacology. 1997;130:131–138. doi: 10.1007/s002130050220. [DOI] [PubMed] [Google Scholar]
- 31.Kretschmer BD, Kratzer U, Beithecker K, Koch M. ACEA 1021, a glycine site antagonist with minor psychotomimetic and amnestic effects in rats. Eur J Pharmacol. 1997;331:109–116. doi: 10.1016/s0014-2999(97)01047-9. [DOI] [PubMed] [Google Scholar]
- 32.Kuryatov A, Laube B, Betz H, Kuhse J. Mutational analysis of the glycine-binding site of the NMDA receptor: structural similarity with bacterial amino acid-binding proteins. Neuron. 1994;12:1291–1300. doi: 10.1016/0896-6273(94)90445-6. [DOI] [PubMed] [Google Scholar]
- 33.Kutsuwada T, Kashiwabuchi N, Mori H, Sakimura K, Kushiya E, Araki K, Meguro H, Masaki H, Kumanishi T, Arakawa M, Mishina M. Molecular diversity of the NMDA receptor channel. Nature. 1992;358:36–41. doi: 10.1038/358036a0. [DOI] [PubMed] [Google Scholar]
- 34.Kutsuwada T, Sakimura K, Manabe T, Takayama C, Katakura N, Kushiya E, Natsume R, Watanabe M, Inoue Y, Yagi T, Aizawa S, Arakawa M, Takahashi T, Nakamura Y, Mori H, Mishina M. Impairment of suckling response, trigeminal neuronal pattern formation, and hippocampal LTD in NMDA receptor epsilon 2 subunit mutant mice. Neuron. 1996;16:333–344. doi: 10.1016/s0896-6273(00)80051-3. [DOI] [PubMed] [Google Scholar]
- 35.Larson J, Lynch G. Role of N-methyl-d-aspartate receptors in the induction of synaptic potentiation by burst stimulation patterned after the hippocampal theta-rhythm. Brain Res. 1988;441:111–118. doi: 10.1016/0006-8993(88)91388-1. [DOI] [PubMed] [Google Scholar]
- 36.Laube B, Hirai H, Sturgess M, Betz H, Kuhse J. Molecular determinants of agonist discrimination by NMDA receptor subunits: analysis of the glutamate binding site on the NR2B subunit. Neuron. 1997;18:493–503. doi: 10.1016/s0896-6273(00)81249-0. [DOI] [PubMed] [Google Scholar]
- 37.Laube B, Kuhse J, Betz H. Evidence for a tetrameric structure of recombinant NMDA receptors. J Neurosci. 1998;18:2954–2961. doi: 10.1523/JNEUROSCI.18-08-02954.1998. [DOI] [PMC free article] [PubMed] [Google Scholar]
- 38.Li Y, Erzurumlu RS, Chen C, Jhaveri S, Tonegawa S. Whisker-related neuronal patterns fail to develop in the trigeminal brainstem nuclei of NMDAR1 knockout mice. Cell. 1994;76:427–437. doi: 10.1016/0092-8674(94)90108-2. [DOI] [PubMed] [Google Scholar]
- 39.Matheus MG, Nogueira RL, Carobrez AP, Graeff FG, Guimaraes FS. Anxiolytic effects of glycine antagonists microinjected into the dorsal periaqueductal grey. Psychopharmacology. 1994;113:565–569. doi: 10.1007/BF02245241. [DOI] [PubMed] [Google Scholar]
- 40.Monyer H, Sprengel R, Schoepfer R, Herb A, Higuchi M, Lomeli H, Burnashev N, Sakmann B, Seeburg PH. Heteromeric NMDA receptors: molecular and functional distinction of subtypes. Science. 1992;256:1217–1221. doi: 10.1126/science.256.5060.1217. [DOI] [PubMed] [Google Scholar]
- 41.Monyer H, Burnashev N, Laurie DJ, Sakmann B, Seeburg PH. Developmental and regional expression in the rat brain and functional properties of four NMDA receptors. Neuron. 1994;12:529–540. doi: 10.1016/0896-6273(94)90210-0. [DOI] [PubMed] [Google Scholar]
- 42.Morris RG, Garrud P, Rowlins JN, O'Keefe J. Place navigation impaired in rats with hippocampal lesions. Nature. 1982;297:681–683. doi: 10.1038/297681a0. [DOI] [PubMed] [Google Scholar]
- 43.Morris RG, Anderson E, Lynch GS, Baudry M. Selective impairment of learning and blockade of long-term potentiation by an N-methyl-d-aspartate receptor antagonist, AP5. Nature. 1986;319:774–776. doi: 10.1038/319774a0. [DOI] [PubMed] [Google Scholar]
- 44.Mutel V, Buchy D, Klingelschmidt A, Messer J, Bleuel Z, Kemp JA, Richards JG. In vitro binding properties in rat brain of [3H] Ro 25-6981, a potent and selective antagonist of NMDA receptors containing NR2B subunits. J Neurochem. 1998;70:2147–2155. doi: 10.1046/j.1471-4159.1998.70052147.x. [DOI] [PubMed] [Google Scholar]
- 45.Premkumar LS, Auerbach A. Stoichiometry of recombinant N-methyl-d-aspartate receptor channels inferred from single-channel current patterns. J Gen Physiol. 1997;110:485–502. doi: 10.1085/jgp.110.5.485. [DOI] [PMC free article] [PubMed] [Google Scholar]
- 46.Priestley T, Kemp JA. Agonist response kinetics of N-methyl-d-aspartate receptors in neurons cultured from rat cerebral cortex and cerebellum: evidence for receptor heterogeneity. Mol Pharmacol. 1993;44:1252–1257. [PubMed] [Google Scholar]
- 47.Priestley T, Laughton P, Myers J, Le Bourdelles B, Kerby J, Whiting PJ. Pharmacological properties of recombinant human N-methyl-d-aspartate receptors comprising NR1a/NR2A and NR1a/NR2B subunit assemblies expressed in permanently transfected mouse fibroblast cells. Mol Pharmacol. 1995;48:841–848. [PubMed] [Google Scholar]
- 48.Smith KE, Borden LA, Hartig PR, Branchek T, Weinshank RL. Cloning and expression of a glycine transporter reveal colocalization with NMDA receptors. Neuron. 1992;8:927–935. doi: 10.1016/0896-6273(92)90207-t. [DOI] [PubMed] [Google Scholar]
- 49.Sugihara H, Moriyoshi K, Ishii T, Masu M, Nakanishi S. Structures and properties of 7 isoforms of the NMDA receptor generated by alternative splicing. Biochem Biophys Res Commun. 1992;185:826–832. doi: 10.1016/0006-291x(92)91701-q. [DOI] [PubMed] [Google Scholar]
- 50.Supplisson S, Bergman C. Control of NMDA receptor activation by a glycine transporter co-expressed in Xenopus oocytes. J Neurosci. 1997;17:4580–4590. doi: 10.1523/JNEUROSCI.17-12-04580.1997. [DOI] [PMC free article] [PubMed] [Google Scholar]
- 51.Tsien JZ, Huerta PT, Tonegawa S. The essential role of hippocampal CA1 NMDA receptor-dependent synaptic plasticity in spatial memory. Cell. 1996;87:1327–1338. doi: 10.1016/s0092-8674(00)81827-9. [DOI] [PubMed] [Google Scholar]
- 52.Wafford KA, Kathoria M, Bain CJ, Marshall G, Le Bourdelles B, Kemp JA, Whiting PJ. Identification of amino acids in the N-methyl-d-aspartate receptor NR1 subunit that contribute to the glycine binding site. Mol Pharmacol. 1995;47:374–380. [PubMed] [Google Scholar]
- 53.Watanabe M, Inoue Y, Sakimura K, Mishina M. Developmental changes in distribution of NMDA receptor channel subunit mRNAs. NeuroReport. 1992;3:1138–1140. doi: 10.1097/00001756-199212000-00027. [DOI] [PubMed] [Google Scholar]
- 54.Westergren I, Nystrom B, Hamberger A, Nordborg C, Johansson B. Concentrations of amino acids in extracellular fluid after opening of the blood-brain barrier by intracarotid infusion of protamine sulfate. J Neurochem. 1994;62:159–165. doi: 10.1046/j.1471-4159.1994.62010159.x. [DOI] [PubMed] [Google Scholar]
- 55.Wurst W, Joyner AL. Production of targeted embryonic stem cell clones. In: Joyner AL, editor. Gene targeting, a practical approach. IRL; Oxford: 1993. pp. 34–61. [Google Scholar]
- 56.Zafra F, Aragon C, Olivares L, Danbolt NC, Gimenez C, Storm-Mathisen J. Glycine transporters are differentially expressed among CNS cells. J Neurosci. 1995;15:3952–3969. doi: 10.1523/JNEUROSCI.15-05-03952.1995. [DOI] [PMC free article] [PubMed] [Google Scholar]