

Abstract
The daily timing of rapid eye movement (REM) sleep reflects an interaction between the circadian pacemaker located in the suprachiasmatic nucleus of the hypothalamus (SCN) and a homeostatic process that induces compensatory REM sleep in response to REM sleep loss. Whether the circadian variation in REM sleep propensity is caused by active promotion, inhibition, or passive gating of REM sleep homeostasis by the SCN is unknown. To investigate these possibilities, compensatory responses to 24 hr REM sleep deprivation (RSD) were compared between SCN-lesioned (SCNx) and sham-lesioned rats at different times of day in constant dark. The attempts to enter REM sleep (REM tendency) increased during RSD in all rats and were modulated by circadian phase in sham-lesioned, but not SCNx rats. REM sleep homeostasis interacted with circadian time, such that REM tendency doubled during the rest phase in sham-lesioned rats relative to SCNx rats (F(6,93) = 17.9;p = 0.0001). However, REM tendency was indistinguishable between SCNx and sham-lesioned rats during the activity phase, suggesting the SCN does not inhibit REM tendency at this time. By contrast, the amount of compensatory REM sleep examined 2, 6, 12, or 24 hr after RSD did not depend on circadian phase. Thus, transitions into REM sleep are facilitated by the SCN during the rest phase, but the amount of REM sleep, once initiated, is determined primarily by homeostatic mechanisms. This work supports a role for the SCN in the active promotion of REM sleep at specific times of day.
Keywords: electroencephalogram, sleep homeostasis, REM sleep propensity, paradoxical sleep, active sleep, desynchronized sleep, circadian rhythm, suprachiasmatic nucleus, rat
The circadian pacemaker located in the suprachiasmatic nucleus of the hypothalamus (SCN) interacts with sleep homeostasis to shape the daily sleep–wake cycle (Daan et al., 1984). The SCN promotes the consolidation of wakefulness during the activity phase to oppose the increasing drive to sleep (Edgar et al., 1993), which subsequently facilitates sleep consolidation during the rest phase (Dijk and Czeisler, 1994, 1995). However, the coincident timing of human circadian rhythms in sleep propensity, electroencephalographic (EEG) spindle activity, and melatonin secretion suggest that sleep onset (Lavie, 1997; Sack et al., 1997) and sleep maintenance (Dijk et al., 1997; Dijk and Duffy, 1999) may also be directly influenced by the circadian clock. Moreover, component sleep states may be differentially regulated by the SCN. For example, rapid eye movement (REM) sleep latency depends more on circadian phase than on the duration of previous wakefulness (Czeisler et al., 1980a), whereas the converse applies to the depth of NREM sleep (Daan et al., 1984). Although the SCN is necessary for the circadian timing of REM and NREM sleep (Mistlberger et al., 1983; Tobler et al., 1983; Eastman et al., 1984; Edgar et al., 1993), how this timing is imposed via interactions with homeostasis of component sleep states, in particular REM sleep, is poorly understood.
REM sleep propensity is greatest during the last half of the rest phase in an environment with light/dark cycles (Maron et al., 1964; Borbely, 1980; Zulley, 1980; Endo et al., 1981; Bes et al., 1996). In an environment without time cues, the maxima of the circadian rhythm of REM sleep propensity coincides with the nadir and early rising phase of the body temperature circadian rhythm, a typical endogenous reference for circadian phase (Czeisler et al., 1980a). This temporal relationship persists when the timing of the sleep–wakefulness cycle dissociates from the temperature circadian rhythm spontaneously (Czeisler et al., 1980b; Weitzman et al., 1980; Zulley, 1980), and in protocols that impose desynchrony between these variables (Carskadon and Dement, 1977; Lavie, 1987; Dantz et al., 1994; Dijk and Czeisler, 1995), suggesting REM sleep is under strong circadian control.
REM sleep is also homeostatically regulated. The attempts to enter REM sleep increase during selective REM sleep deprivation (RSD) and extends the time spent in REM sleep during recovery to produce a rebound effect (Dement, 1960; Agnew et al., 1967; Morden et al., 1967; Beersma et al., 1990; Benington et al., 1994; Endo et al., 1997). Compensatory increases in REM and NREM sleep are evident in SCN-lesioned (SCNx) rats after total sleep deprivation, suggesting that the circadian and homeostatic processes controlling sleep can be structurally separated (Mistlberger et al., 1983; Tobler et al., 1983). Lacking, however, are selective REM sleep deprivation studies in SCNx animals, which could help clarify the functional interaction of the circadian clock and REM sleep homeostasis.
The circadian control of REM sleep may be achieved through SCN-dependent augmentation of REM sleep homeostasis during the rest phase, inhibition of REM sleep drive by the SCN during the activity phase, or passive gating of REM sleep through temporal displacement by competing arousal states. These possibilities were tested by comparing the compensatory responses of sham-lesioned rats and SCNx rats to REM sleep deprivation at different times of day.
MATERIALS AND METHODS
Surgery. Thirty-nine male Wistar rats (Charles River Laboratories, Wilmington, MA) with a mean (± SE) age of 70.6 ± 2.6 d and weight of 285 ± 19.5 gm were surgically prepared for SCN or sham lesions and chronic EEG, EMG, body temperature (Tb) and locomotor activity (LMA) recording using established procedures (Edgar et al., 1991a,b). The rats were sedated with diazepam (1.6 mg/kg, i.m.) and anesthetized with isofluorane (3% in medical grade oxygen). Telemetry transmitters (Barrows, Palo Alto, CA) were surgically placed in the peritoneal cavity for Tb and LMA monitoring via telemetry receivers (Data Sciences, St. Paul, MN).
To make SCN lesions, anesthetized rats were secured in the flat plane position on a stereotaxic frame (Kopf Instruments, Tajunga, CA). A radio frequency lesion probe (tip diameter, 0.2 mm; Radionics RFG-4A, Burlington, MA) was lowered four times through a small craniotomy into the SCN at the following coordinates: anteroposterior (AP), −0.6 mm and −1.1 mm caudal to bregma, lateral (Lat), ± 0.3 mm, dorsoventral (DV), −8.8 mm from dura (Paxinos and Watson, 1986). Lesions were focused in the SCN of 22 rats by raising the probe tip temperature to 68°C for 60 sec at each lesion site. The probe was lowered but not heated to make sham lesions in 17 additional rats.
As part of the same surgical procedure, the rats were implanted for chronic EEG and EMG recording. The electrode implants were gas-sterilized before surgery and consisted of six stainless steel wires that had been soldered to a miniature gold and Teflon connector (Microtech, Boothwyn, PA). Four EEG leads were secured to the skull with stainless steel screws inserted at the following coordinates: AP, 2.0 mm rostral to bregma, Lat, ± 2.0 mm, and AP, −6.4 mm caudal to bregma, Lat, ±3.0 mm (Paxinos and Watson, 1986). Two EMG electrodes were positioned under the nuchal trapezoid muscles. The implants were attached to the skull with cyanoacrylate and dental cement.
Postoperative care included pain management with nalbuphine (2 mg/kg, i.m.) and buprenorphine (0.03 mg/kg, i.p.). Prophylactic control of infection was provided before and after surgery with chloramphenicol (10 mg in 0.1 ml, i.p.) and topical antibiotics as needed. Surgical recuperation was permitted for a minimum of 3 weeks and was followed by 2 weeks of recording cable and chamber adaptation before data collection began. For at least 3 weeks between surgical recovery and recording adaptation, candidate SCNx rats were screened in isolation chambers in constant dark (DD) for the loss of circadian rhythms in drinking, LMA, and Tb. The presence or absence of circadian rhythms was assessed by visual examination of raster plots and the use of objective periodogram analysis (Sokolove and Bushell, 1978). Only candidate SCNx rats with verified circadian arhythmicity (n = 12) were retained for further study. SCNx rats, after screening, and sham-lesioned rats were housed in 12 hr light/dark (LD) cycles (lights on at 8:00 A.M.) until experimentation began.
REM sleep deprivation and data collection. Rats were housed individually in custom-designed, sleep deprivation chambers for the duration of the experiment. Each chamber consisted of a perforated stainless steel cylinder (39.7 cm diameter by 32.1 cm length) that was positioned horizontally inside a Plexiglas frame (637.2 cm2 floor space). The cranial electrode implants were connected to low-torque commutators (Biela Engineering, Irvine, CA) by flexible cables, allowing the animals unimpeded movement throughout the chambers. Food and water were available ad libitum. The study was conducted in a sound-attenuated, light and temperature-controlled (24.4 ± 0.1°C) recording room, to control for sensory modalities known to affect REM sleep (Lisk and Sawyer, 1966; Szymusiak and Satinoff, 1981; Drucker-Colin et al., 1983).
EEG and EMG were sampled in 5 sec epochs using SCORE, a personal computer-based, automated sleep–wake data collection system (Van Gelder et al., 1991). This system identified vigilance states as NREM, REM, wake, or theta-dominated wake in real time based on the match of the epoch content to individual vigilance state templates that were constructed for each animal. Data quality was monitored by frequent inspection of the signals and was optimized by replacement of recording cables or adjustment of the scoring templates for individual rats as needed. Analog EEG and EMG signals were amplified 10,000×. The EEG was filtered to permit 1–30 Hz bandpass (−6 dB/octave), and the EMG was filtered for 10–100 Hz bandpass (−6 dB/octave). Digitized EEG and integrated EMG were collected as raw data, permitting off-line verification of vigilance state scoring, additional data quality control, and EEG spectral analysis.
An automated method of RSD was used in this study. When SCORE detected an epoch of REM sleep, the program activated a motor to roll the cylindrical chamber around its axis for 5 sec at a rate of 18.3 cm/sec (265° of rotation per epoch). This motion initiated the righting reflex of the rats and effectively disrupted their REM sleep. Each 5 sec epoch in which a rotation occurred reflected an attempt to enter REM. To control for the nonspecific effects of the REM sleep-deprivation stimulus, each rat was subjected to yoked-control arousal (YCA) in which the rotation signal was driven by the REM sleep of a neighboring RSD rat from the same lesion group. Thus, every time an RSD rat was inhibited from entering REM sleep, a YCA rat received an identical arousal stimulus, regardless of the vigilance state of the YCA rat. Because sham-lesioned and SCNx rats had equivalent amounts of baseline NREM and REM sleep per day (Table1), RSD and YCA were imposed for 24 hr to induce consistent amounts of sleep loss between groups. Automated RSD by initiation of the righting reflex effectively reduced REM sleep below baseline (BL) and YCA levels, induced compensatory REM sleep, and left NREM sleep relatively undisturbed (see Fig. 5), comparable to conventional methods of REM sleep deprivation (Radulovacki et al., 1980; van Luijtelaar and Coenen, 1986; Rechtschaffen et al., 1999).
Table 1.
Sleep during 72-hr baseline
| REM | NREM | |
|---|---|---|
| CT6 | 8.3 ± 0.3 | 45.1 ± 1.0 |
| CT18 | 7.6 ± 0.3 | 43.4 ± 0.7 |
| CTX | 7.3 ± 0.2 | 44.6 ± 1.0 |
| F(2,33) = | 3.04;p = 0.062 | 0.84; p = 0.44 |
CT groups were recorded in DD beginning midrest phase (CT6) or midactivity phase (CT18) in sham-lesioned rats (n = 12), or at the corresponding clock times in SCN-lesioned rats (CTX;n = 10). Data (mean ± SE) are expressed as the percentage of recording time.
Fig. 5.

REM and NREM sleep (mean percentage per hour ± SE) over 3 d of recording in DD under BL (gray line), RSD (thick line), or YCA (thin line) conditions. RSD and YCA lasted 24 hr (bar) and terminated midrest phase (CT 6) or midactivity phase (CT 18) in sham-lesioned rats (n = 12) or at the corresponding clock times in SCN-lesioned rats (CT-X;n = 10). Automated RSD by initiation of the righting reflex substantially reduced REM sleep below BL and YCA levels and elicited a compensatory increase in REM sleep during recovery. Compensatory REM sleep was displaced 3–6 hr after release from RSD at CT 18 (arrow). RSD and YCA impacted NREM sleep to the same minimal extent.
Study design and data analysis. In a 2 × 6 crossover design, sham-lesioned and SCNx rats, aged 240 ± 12 d (mean ± SE), underwent weekly treatments of RSD, YCA, or BL conditions that began at two different times of day. The treatments began at 2:00 P.M. or 2:00 A.M. on different weeks. Treatments were pseudorandomized to achieve counterbalancing, and only sham-lesioned (n = 12) and SCNx (n = 10) rats that completed each of the six treatments were included in the analysis. Sham-lesioned and SCNx rats were recorded in DD, because light/dark cycles can influence sleep patterns independently of the circadian time-keeping system (Miller et al., 1998). In nocturnal animals with an intact SCN living in an environment without time cues (e.g., light/dark cycles), the rest phase is defined to begin at circadian time 0 (CT 0). In sham-lesioned rats, 2:00 P.M. corresponded to the middle of the rest phase (CT 6), and 2:00 A.M. occurred at the middle of the activity phase (CT 18). Each week, the DD recording sessions were continuous for 3 d (e.g., 72 hr BL, 24 hr RSD or YCA followed by 48 hr recovery). Over the next 4 d of the week, all rats were housed in LD 12:12 (lights on at 8:00 A.M.) under fluorescent room light, to resynchronize the circadian rhythms of the sham-lesioned rats. The rats were undisturbed the day before, and throughout, each recording session. Raw EEG and EMG were sampled on the day before experimentation for data quality control and normalization procedures.
Principle variables measured were REM and NREM sleep duration (percentage per hour), REM sleep tendency (the number of REM attempts that triggered cylinder rotations during RSD), and slow-wave activity (SWA; an index of NREM sleep intensity based on EEG spectral analysis). Compensatory responses to REM sleep loss were assessed both during RSD, as REM sleep tendency, and during recovery from RSD, as deviations, or “rebound,” from BL and YCA measured at the same circadian time for each rat. Compensatory REM sleep during recovery from RSD was assessed at all circadian times by presentation of the data in time-series plots for 24 hr after RSD (in 6 hr bins) and for 12 hr after RSD (in 2 hr bins). Changes in NREM sleep duration and SWA were assessed alongside REM sleep during and after RSD and YCA for an evaluation of the specificity of the REM sleep responses.
Spectral analysis was performed on the raw, digitized (100 Hz) EEG waveforms across the day before treatment and during the three experimental recording days. Ten second epochs of EEG were screened with an algorithm to detect artifacts, which were then confirmed visually. Artifacts were defined per epoch as: >0.2 sec of exceeded recordable amplitude, >0.05 sec of continuously exceeded recordable amplitude, 5 sec or more of no amplitude change, and/or atypical EEG activity. Through this procedure, 7.8 ± 0.6% of all epochs were eliminated from further analysis. The power spectra in each epoch were determined using Hartley's modification of the fast Fourier transform (Bracewell, 1986). SWA was quantified as the mean power in the delta band (0.1–4.0 Hz) during NREM sleep and was normalized as the percentage of the mean SWA from the pretreatment day for each animal.
Statistics were performed using SAS 6.12 (SAS Institute, Cary, NC) to compare CT groups (“CT 6”, in which recording in sham-lesioned rats began at CT 6; “CT 18”, in which recording in sham-lesioned rats began at CT 18; and “CT X”, which consisted of SCNx rats) and conditions (BL, RSD, YCA). Verification of similar sleep histories between CT groups and conditions was achieved via comparison of the mean amount of BL sleep per day with one-way ANOVA. Absence of circadian rhythms in SCNx rats was tested by two-way repeated-measures ANOVA on factors “CT group” and “2 hr bin” across 24 hr baseline. REM, NREM, and SWA summed across the entire 24 hr RSD and 24 hr recovery periods were assessed with two-way ANOVA on factors CT group and deprivation condition. For a more detailed analysis of recovery sleep patterns, the time course of NREM, REM, and SWA data expressed as the change relative to BL was examined across the first 24 hr of recovery with three-way repeated-measures ANOVA on factors CT group, deprivation condition, and recovery hour. From this analysis, the first 12 hr post-RSD recovery were identified as the most critical for REM sleep rebound. Thus, the time course of NREM, REM, and SWA data expressed relative to YCA was examined across this time period with two-way repeated-measures ANOVA on factors CT group and recovery hour. Differences between CT groups in the time course of the absolute levels of REM sleep during the first 8 hr after RSD (in 2 hr bins) were tested with two-way ANOVA. REM sleep tendency was compared between CT groups over 24 hr RSD (in 6 hr bins) by two-way repeated-measures ANOVA. All repeated-measures ANOVA tests for this study were adjusted with the Greenhouse–Geisser correction, and contrasts were detected with Tukey's studentized range test (α = 0.05).
A “circadian separation” analysis was used to further assess the contribution of circadian phase to the time course of homeostatic responses to 24 hr REM sleep deprivation. For this analysis, REM tendency data during RSD and REM duration data after RSD from sham-lesioned rats were partitioned into 24 hr rest and activity phase groups for comparison against SCNx rats (Fig.1). The rationale behind this circadian separation procedure is as follows. Sham-lesioned rats underwent 24 hr RSD twice: once beginning at CT 6 and once beginning at the opposite time of day at CT 18. Thus, each sequential hour into 24 hr RSD or recovery was represented in circadian rest and activity phases. Data from the sequential hour of RSD or recovery were pooled together from both RSD trials, but were separated into circadian phases (Fig. 1,black and white bars). For example: (1) The first 6 hr of RSD occurred from CT 6 to CT 12 (late rest phase) in the CT 6 group. (2) The first 6 hr of RSD occurred from CT 18 to CT 0 (late activity phase) in the CT 18 group. (3) The rats then reached a phase transition. Thus, the next 12 hr of RSD occurred in the activity phase for the CT 6 group, and in the rest phase for the CT 18 group. (4) Then the rats reached another phase transition. Therefore, the last 6 hr of RSD occurred in the early rest phase for the CT 6 group, and in the early activity phase for the CT 18 group. By separating the sequential hour into RSD or recovery into distinct circadian phases for comparison against SCNx data, the interaction of the time course of the REM homeostatic process with circadian phase was assessed. Two-way repeated-measures ANOVA was used to evaluate interactions between the factors circadian phase and RSD hour or recovery hour.
Fig. 1.

Circadian rest (white bars) and activity (black bars) phases in sham-lesioned rats were separated for data analysis. The same sham-lesioned rats began recording in DD at CT 6 and CT 18, thus transitions between rest and activity phases occurred 6 and 18 hr into the recording period. Data were pooled into groups according to phase (arrows), regardless of the recording start time, to allow each sequential hour of RSD or recovery from RSD to be represented exclusively in rest or activity phases.
Histology. Brains from each SCNx and sham-lesioned rat were histologically processed to evaluate the integrity of the hypothalamus. Rats were euthanized by pentobarbital overdose (>150 mg/kg) and perfused intracardially with 200 ml of 0.1 m PBS (0.9% in double distilled water, 37°C) containing 1000 IU of heparin, followed by 300 ml of paraformaldehyde (4% in PBS, 6°C). Brains were removed, post-fixed in 4% paraformaldehyde overnight, and cryoprotected in sucrose (30% in PBS containing 0.1% sodium azide) for at least 24 hr. Coronal sections were sliced at 25 μm on a cryostat microtome and stored in sodium azide (0.1% in PBS with 0.3% Triton X-100, 6°C). All solutions used for perfusion and immunocytochemistry were pH 7.5 at room temperature.
Vasoactive intestinal polypeptide (VIP) immunocytochemistry was used to highlight the SCN, because SCN neurons contain distinctly higher levels of VIP than the surrounding hypothalamic areas. Free-floating sections from each brain were processed simultaneously. Sections were first placed in blocking solution (10% normal goat serum in PBS with 0.3% Triton X-100, 0.1% sodium azide, 0.1% hydrogen peroxide, and 0.1% bovine serum albumin) for 90–120 min, and then incubated for 72 hr at 6°C in rabbit primary antiserum against VIP (Peninsula Laboratories, Belmont, CA) diluted 1:16,000 (in PBS with 0.3% Triton X-100, 0.1% sodium azide, and 2% normal goat serum). The tissue was washed (three times for 10 min) with 0.3% Triton X-100 in PBS and incubated for 90 min in 1:400 biotinylated goat anti-rabbit IgG (Vector Laboratories, Burlingame, CA) in the same diluent as for the primary antiserum. After rinses (three times for 10 min) with 0.3% Triton X-100 in PBS, the VIP immunolabel was amplified through incubation with an avidin–biotin–HRP complex (Elite-ABC kit; Vector Laboratories) for 90 min. The complex was visualized using nickel-intensified 3,3′-diaminobenzidine (Sigma, St. Louis, MO) as the chromagen (0.02% in 0.8% Tris HCl with 0.1% hydrogen peroxide) to produce a blue–black reaction product after 3–6 min. Sections were mounted on glass slides, counterstained for Nissl substance with cresyl violet acetate (Sigma, St. Louis, MO), dehydrated, cleared, and coverslipped.
RESULTS
SCN Lesions
Extended Tb monitoring was used to physiologically validate the loss of circadian rhythms before subjecting the rats to REM sleep deprivation. Representative Tb data from an SCNx rat are shown in Figure 2, A and B,for comparison against the circadian rhythm of a sham-lesioned rat (Fig. 2C,D). SCN lesions eliminated circadian rhythms in all monitored variables (NREM, REM, Tb, LMA, and drinking behavior).
Fig. 2.

Raster plots of normalized body temperature (A, C) and corresponding chi square periodogram analyses (B, D) from a representative SCN-lesioned rat (SCNx; A, B) and sham-lesioned rat (C, D). Tick marks in the raster plot indicate the occurrence of body temperature excursions above the stepwise-moving mean from 72 hr before the tick mark. The data are plotted at 5 min resolution over 2 d (horizontally) and are double-plotted as successive days (vertically). Dashed lines indicate missing data. Objective chi square periodogram analysis of the SCNx body temperature data (B) confirmed the absence of significant rhythmic components with a circadian period using a 95% confidence threshold. The circadian rhythm sham-lesioned rat has a prominent rhythm with a period of 24.3 hr (D). Note the amplitude scale differs betweenB and D. Complete bilateral SCN lesions eliminated circadian rhythms in all measured variables, including body temperature, locomotor activity, NREM, REM, wakefulness, and drinking behavior.
Examples of hypothalamic lesion damage from each SCNx rat are shown in Figure 3. The photomicrograph in Figure4 shows the intact SCN (immunostained for VIP) and its neighboring structures (counterstained for Nissl substance) from a representative sham-lesioned rat. In the SCNx group, the SCN were completely and bilaterally ablated in all but one animal (Fig. 3; ID number 2214). In this rat, a few VIP-labeled fibers remained unilaterally along the medial aspect of the SCN, but analysis of raster plots for Tb, LMA, and drinking behavior in DD revealed no circadian rhythms, despite the presence of these few VIP fibers. All SCN lesions produced some collateral damage to neighboring structures, limited primarily to damage of the optic chiasm and to a lesser extent in the medial preoptic area, the anterior hypothalamic area, and the periventicular nucleus of the hypothalamus. Approximately half of the animals showed mild damage in the lateral hypothalamic area and retrochiasmatic area. In separate cases, individual brains had minor hypothalamic damage in the supraoptic nucleus, the lateral preoptic nucleus, and the arcuate nucleus. The paraventricular nucleus and ventrolateral preoptic nucleus were not damaged in any animals. In sham-lesioned rats, the mass of the SCN appeared to be unaffected by the lowering of the lesion probe.
Fig. 3.
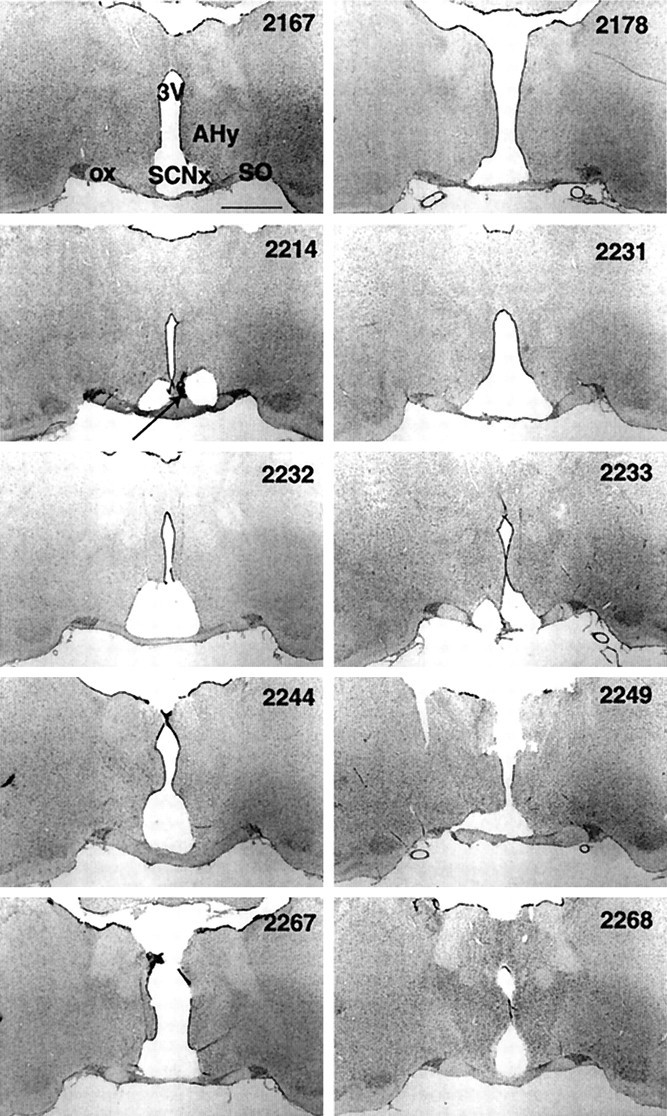
Coronal sections (25 μm, 2× magnification) from each SCN-lesioned brain that represent the largest lesion area midway between rostrocaudal lesion borders. Tissue stained for Nissl substance (gray) and VIP (black, arrow). Suprachiasmatic nucleus lesion (SCNx), third ventricle (3V), optic chiasm (ox), supraoptic nucleus (SO), and anterior hypothalamic area (AHy). Rat ID in top right corner. Scale bar, 1 mm. SCN lesions disrupted circadian rhythms in body temperature, locomotor activity, drinking, and vigilance states in all rats. Compared to the intact hypothalamus shown in Figure 4, only a small amount of lesion damage impinged on the structures neighboring the SCN.
Fig. 4.

Coronal section (25 μm, 2× magnification) from a representative, sham-lesioned brain. Tissue stained for Nissl substance (gray) and VIP (black, arrow). See Figure 3 for abbreviations. Scale bar, 1 mm.
Baseline
During the 72 hr recording period in DD, sham-lesioned rats exhibited robust circadian rhythms in NREM and REM sleep, and these rhythms were absent in the SCNx group (Fig.5). During the first day of DD (Fig. 5,gray lines over bars), CT group interacted with hour to shape the daily expression of REM (F(22,341) = 25.0; p = 0.0001) and NREM (F(22,341) = 14.9;p = 0.0001). However, the mean amount of each state was equivalent between the sham-lesioned rats and SCNx groups (Table 1). Sleep histories (mean percentage per 24 hr) before RSD, YCA, and BL recordings in sham-lesioned rats and SCNx rats did not statistically differ for REM (F(8,101) = 0.68;p = 0.70) or NREM (F(8,101) = 0.77; p = 0.63).
REM sleep deprivation
The amount of NREM and REM sleep and SWA that occurred during 24 hr RSD and YCA are displayed as the percentage of BL in Table2 for the three CT groups. RSD by initiation of the righting reflex reduced REM sleep to >75% below BL levels in sham-lesioned rats and SCNx rats. RSD was significantly more effective in reducing REM sleep than YCA. However, RSD and YCA impacted NREM sleep duration similarly in sham-lesioned rats and SCNx rats. No treatment group lost >13% of the baseline NREM sleep. SWA was reduced during RSD compared to YCA, according to a main effect for the factor “deprivation condition.” Although this main effect was significant, on average during both RSD and YCA, all rats exhibited SWA within only 2.2 ± 0.8% of their BL levels.
Table 2.
Sleep and SWA during 24 hr RSD
| REM | NREM | SWA | ||
|---|---|---|---|---|
| CT6 | RSD | 24.1 ± 3.7 | 88.1 ± 3.6 | 103.3 ± 1.9 |
| YCA | 71.2 ± 5.6 | 91.1 ± 4.0 | 103.3 ± 1.7 | |
| CT18 | RSD | 24.8 ± 3.6 | 88.2 ± 5.8 | 99.9 ± 1.7 |
| YCA | 77.3 ± 7.8 | 92.6 ± 5.2 | 106.3 ± 2.5 | |
| CTX | RSD | 16.4 ± 2.4 | 87.3 ± 4.6 | 97.1 ± 1.4 |
| YCA | 65.5 ± 7.4 | 88.6 ± 4.9 | 101.9 ± 1.0 | |
| F(5,67)= | 25.1,p = 0.0001 | 0.19, p = 0.06 | 2.99,p = 0.018 | |
| *F(1,67)= | 122,p = 0.0001 | — | 6.20, p = 0.016 | |
RSD and YCA began midrest phase (CT6) or midactivity phase (CT18) in sham-lesioned rats (n = 12), or at the corresponding clock times in SCN-lesioned rats (CT-X; n = 10). Data (mean ± SE) were recorded in DD and are expressed as the mean percentage of 24 hr baseline. No main effects for CT group or interaction effects for any variables were found.
*Main effect for deprivation condition, RSD < YCA, Tukey's studentized range test (α = 0.05). Note that RSD selectively decreased REM sleep to a similar degree among CT groups.
The attempts to enter REM sleep during RSD beginning at CT 6 or CT 18 in sham-lesioned rats, or at the corresponding clock times in SCNx rats are shown in Figure 6. A main effect for the factor “RSD hour” revealed that the attempts to enter REM sleep increased as RSD progressed (F(3,93) = 16.3; p = 0.0001). However, the attempts to enter REM sleep over the entire 24 hr RSD period did not differ between CT groups (mean ± SE: CT 6, 17.0 ± 3.3; CT 18, 13.9 ± 2.1; SCNx, 8.8 ± 1.1) (F(2,31) = 2.47; p = 0.10). Because of the interaction between CT group and RSD hour (F(6,93) = 17.9;p = 0.0001), the sham-lesioned groups significantly differed from each other during the last 12 hr of RSD. The REM sleep attempts by the sham-lesioned rats during the rest phase always exceeded those of the SCNx rats, whether the sham-lesioned rats began RSD at CT 6 or CT 18. Furthermore, REM sleep tendency was indistinguishable between SCNx rats and sham-lesioned rats during the activity phase, whether the activity phase occurred at the beginning, middle, or end of the RSD period.
Fig. 6.

REM sleep attempts (mean number per hour ± SE) during 24 hr RSD in DD that began midrest (CT 6;circles) or midactivity phase (CT 18;triangles) in sham-lesioned rats (n= 12) or at the corresponding clock times in SCN-lesioned rats (SCNx;squares;n = 10). Data from sham-lesioned rats that are plotted below thedotted line were collected during the activity phase; data above the dotted line were from the rest phase. Data are plotted in 6 hr bins and are fitted with second-order regressions. CT group and RSD hour interacted to influence REM sleep tendency (F(6,93) = 17.9;p = 0.0001). Contrasts by Tukey's studentized range test (α = 0.05): *CT 6 versus SCNx; **CT 18 versus SCNx;+CT 6 versus CT 18. REM sleep attempts were greatest during the rest phase in sham-lesioned rats and were indistinguishable between sham-lesioned rats during the activity phase and SCNx rats.
Recovery from REM sleep deprivation
Figure 7 illustrates the time course of REM and NREM sleep duration, compared to BL, 24 hr after release from RSD and YCA at CT 6 or CT 18 in sham-lesioned rats, or at the corresponding clock times in SCNx rats. Table3 shows the statistics on the data in Figure 7 presented as the change relative to BL. For the entire 24 hr recovery period, the mean (± SE) proportion of REM sleep rebound over BL (34.3 ± 2.7%) was greater than that for NREM sleep (5.2 ± 1.2%) and SWA (6.1 ± 1.2%) in all CT groups after RSD, indicating REM sleep homeostasis was selectively challenged.
Fig. 7.

REM and NREM sleep (mean percentage per hour ± SE) during 24 hr recovery from RSD or YCA that ended midrest phase (CT 6; black circles) or midactivity phase (CT 18;black triangles) in sham-lesioned rats (n = 12) or at the corresponding clock times in SCN-lesioned rats (SCNx; black squares;n = 10). BL data from sham-lesioned rats beginning at CT 6 (gray circles) or CT 18 (gray triangles) or from SCNx rats (gray squares) were double-plotted against values from the RSD and YCA conditions. Data were recorded in DD, are plotted in 6 hr bins, and are fitted with second-order regressions. Statistics were performed on these data expressed as the change relative to BL (Table 3). RSD induced more REM sleep rebound over BL than did the YCA procedure. NREM sleep during recovery from RSD and YCA was minimally affected by both methods of sleep disruption.
Table 3.
Sleep and SWA during 24 hr recovery from RSD
| Hours after RSD | |||||||
|---|---|---|---|---|---|---|---|
| 1–6 | 7–12 | 13–18 | 19–24 | F | p | ||
| REM | |||||||
| CT-6 | RSD | 6.6 ± 0.5 | 1.9 ± 0.6 | 1.3 ± 0.7 | 0.3 ± 0.7 | ||
| YCA | 2.5 ± 0.9 | 0.3 ± 0.4 | 1.2 ± 0.6 | 1.3 ± 0.7 | |||
| CT-18 | RSD | 7.0 ± 0.9 | 3.4 ± 0.4 | 0.9 ± 0.8 | 1.6 ± 0.5 | ||
| YCA | 3.2 ± 0.9 | 1.9 ± 1.0 | 0.7 ± 1.0 | 0.6 ± 0.4 | |||
| CT-X | RSD | 6.2 ± 0.8 | 2.2 ± 0.6 | 2.0 ± 0.7 | 0.7 ± 0.4 | ||
| YCA | 4.1 ± 0.6 | 1.4 ± 0.7 | 1.5 ± 0.6 | 0.3 ± 0.6 | |||
| GROUP × COND × HOUR | (6,186) = 0.84 | 0.52 | |||||
| GROUP × HOUR | (6,186) = 1.42 | 0.22 | |||||
| COND × HOUR | RSD>YCA | RSD>YCA | (3,186) = 8.97 | 0.0001 | |||
| GROUP × COND | (2,62) = 0.32 | 0.73 | |||||
| GROUP | (2,62) = 0.72 | 0.49 | |||||
| COND | (1,62) = 12.5 | 0.0008 | |||||
| HOUR | >hours 7–24 | >hours 13–24 | (3,186) = 56.2 | 0.0001 | |||
| NREM | |||||||
| CT-6 | RSD | 1.1 ± 1.8 | 2.2 ± 1.5 | 1.30 ± 1.5 | 0.5 ± 1.1 | ||
| YCA | 1.9 ± 2.3 | −3.8 ± 2.2 | −1.10 ± 2.4 | −1.3 ± 1.5 | |||
| CT-18 | RSD | 5.5 ± 2.2 | 0.9 ± 1.1 | 0.00 ± 0.9 | 4.6 ± 1.9 | ||
| YCA | 5.0 ± 3.0 | 0.0 ± 1.8 | 0.50 ± 1.4 | 3.0 ± 2.0 | |||
| CT-X | RSD | 0.6 ± 2.0 | −0.1 ± 2.0 | 2.60 ± 1.2 | 2.2 ± 1.3 | ||
| YCA | 5.8 ± 1.8 | 3.1 ± 1.6 | 4.70 ± 1.3 | 1.1 ± 1.2 | |||
| GROUP × COND × HOUR | (6,186) = 1.02 | 0.41 | |||||
| GROUP × HOUR | (6,186) = 1.89 | 0.10 | |||||
| COND × HOUR | (3,186) = 1.72 | 0.17 | |||||
| GROUP × COND | (2,62) = 1.53 | 0.22 | |||||
| GROUP | (2,62) = 2.21 | 0.12 | |||||
| COND | (1,62) = 0.03 | 0.86 | |||||
| HOUR | >hours 7–12 | (3,186) = 4.30 | 0.0084 | ||||
| SWA | |||||||
| CT-6 | RSD | 25.6 ± 2.5 | 9.1 ± 1.3 | −0.4 ± 2.6 | −0.6 ± 2.8 | ||
| YCA | 19.6 ± 5.2 | 7.6 ± 4.0 | −3.5 ± 2.5 | −3.2 ± 3.4 | |||
| CT-18 | RSD | 16.8 ± 3.6 | 8.6 ± 4.2 | 3.4 ± 2.7 | −1.3 ± 3.1 | ||
| YCA | 9.0 ± 3.7 | 3.8 ± 3.5 | 4.7 ± 2.5 | 2.0 ± 3.4 | |||
| CT-X | RSD | 15.3 ± 4.1 | 1.5 ± 2.8 | −5.0 ± 3.0 | −5.3 ± 2.2 | ||
| YCA | 11.9 ± 3.1 | −2.0 ± 2.1 | −7.3 ± 2.7 | −7.5 ± 2.3 | |||
| GROUP × COND × HOUR | (6,186) = 0.43 | 0.79 | |||||
| GROUP × HOUR | CT-6>CT-18 | CT-6>CT-X | CT-18>CT-X | (6,186) = 2.94 | 0.021 | ||
| COND × HOUR | (3,186) = 0.93 | 0.40 | |||||
| GROUP × COND | (2,62) = 0.07 | 0.94 | |||||
| GROUP | (2,62) = 6.33 | 0.0031 | |||||
| COND | (1,62) = 2.92 | 0.093 | |||||
| HOUR | >hours 7–24 | >hours 13–24 | (3,186) = 51.7 | 0.0001 | |||
RSD and YCA in DD ended midrest phase (CT6) or midactivity phase (CT18) in sham-lesioned rats (n = 12), or at the corresponding clock times in SCN-lesioned rats (CT-X; n= 10). Data (mean ± SE) are expressed as the change relative to baseline, and are the mean percentage per hour in 6 hr bins. The factor “cond” refers to the deprivation condition, and the factor “group” is based on the time of day that recovery began. Only the significant contrasts (Tukey's studentized range test, α = 0.05) for analyses with the factor “hour” are shown. For other contrasts, see Results.
REM sleep rebound was evident after RSD and YCA, because REM sleep was most elevated above BL levels for 6 hr into the recovery period and gradually returned to baseline by 13–18 hr after RSD, as shown by a main effect for hour (Fig. 7, see statistics in Table 3). Overall, RSD induced more compensatory REM sleep than YCA (main effect for condition), especially during the first 12 hr of the recovery period, (“cond × hour” interaction). The amount of REM sleep rebound did not depend on the time of day that recovery from RSD began, or even on the presence of the SCN (“group × cond” interaction and main effect for group). No interaction was found between recovery hour, CT group, or deprivation condition for compensatory REM sleep.
Compensation for the disruption of NREM sleep that occurred during RSD and YCA was statistically evident, according to a main effect for hour (Table 3). However, the magnitude of the compensatory NREM sleep was smaller than for REM sleep, considering the daily average amount of NREM is 5–6 times the amount of REM (Fig. 7). Furthermore, NREM sleep rebound lasted no longer than 6 hr, whereas REM sleep rebound occurred for at least 12 hr. Compensatory NREM sleep did not significantly differ after RSD compared to YCA over the total 24 hr recovery period, or at any time point therein (“cond × hour” interaction and main effect for condition). The amount of compensatory NREM sleep did not depend on the circadian phase at which recovery from RSD began (effects for factor “group”). Furthermore, no interaction was found between recovery hour, CT group, or deprivation condition for NREM sleep.
SWA was most elevated above baseline levels for the first 6 hr of the RSD recovery period and gradually returned to BL 13–18 hr after RSD (Table 3, main effect for hour). The amount of SWA during RSD recovery did not depend on the deprivation condition, or on an interaction between RSD or YCA and recovery hour. However, compensatory SWA did depend on the circadian phase at which RSD recovery began (“group × cond” interaction and main effect for group). In addition, no interaction between recovery hour, CT group, or deprivation condition was found for SWA.
Figure 8 shows the time course of REM, NREM, and SWA during recovery from RSD, as the change relative to YCA, for the first 12 hr after RSD when compensatory responses were greatest. REM sleep rebound relative to YCA over the entire 12 hr period did not differ between SCNx, CT 6 (mid-rest phase), and CT 18 (mid-activity phase) groups (F(2,31) = 1.00; p = 0.38). Over time, compensatory REM sleep waned (F(5,155) = 4.52;p = 0.0007), but did not fall below YCA levels (i.e., below 0% relative to YCA). Recovery hour interacted with CT group (F(10,155) = 2.26; p = 0.017), such that sham-lesioned rats exhibited circadian differences in compensatory REM sleep 7–10 hr after RSD (see Fig. 8 for contrasts). This time period corresponds to the early activity phase for the rats that began recovery at CT 6, and early rest phase for the rats that began recovery at CT 18. Unlike REM sleep, NREM rebound relative to YCA was reduced in SCNx rats compared to sham-lesioned rats over the entire 12 hr RSD recovery period (F(2,31) = 5.57; p = 0.0086). For the first 4 hr after RSD, NREM sleep was reduced below YCA levels, and then climbed above YCA amounts (F(5,155) = 3.36; p = 0.013). Recovery hour interacted with CT group to produce an unclear pattern of differences in compensatory NREM sleep (F(10,155) = 2.12; p = 0.040) (see Fig. 8 for contrasts). SWA was not influenced by an interaction between recovery hour and CT group (F(10,155) = 0.96; p = 0.46), or even by a main effect for CT group (F(2,31) = 0.18; p = 0.83). Although the main effect for recovery hour was significant (F(5,155) = 2.88; p = 0.042), it was not strong enough to show contrasts over time bypost hoc Tukey's studentized range tests.
Fig. 8.
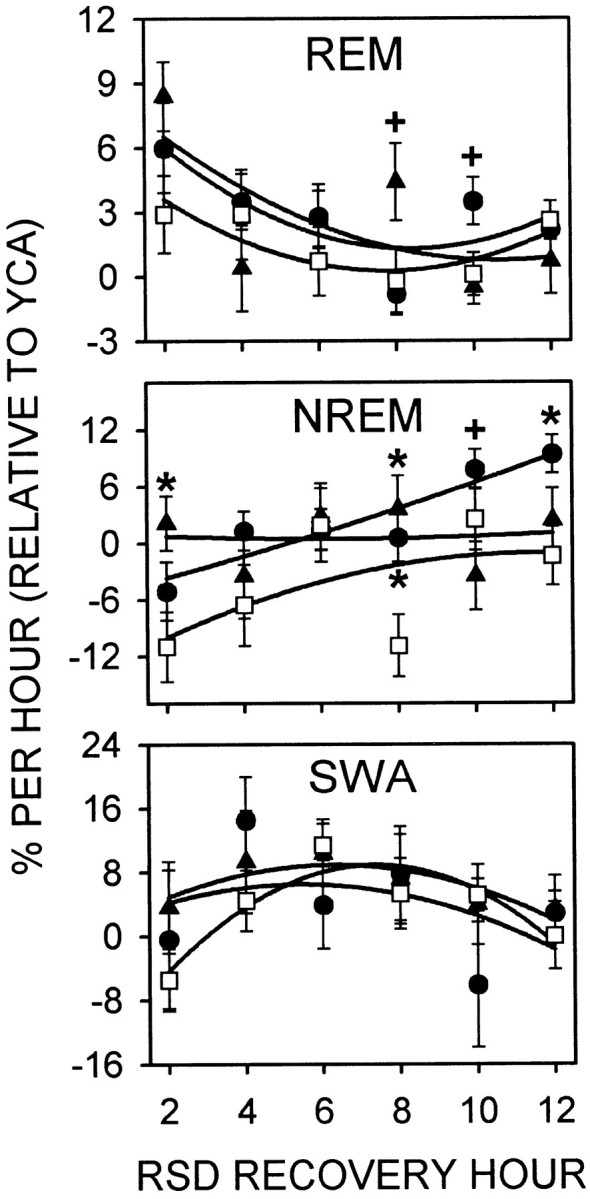
REM, NREM, and SWA during 12 hr recovery from RSD that ended midrest phase (CT 6; circles) or midactivity phase (CT 18; triangles) in sham-lesioned rats (n = 12) or at the corresponding clock times in SCN-lesioned rats (squares;n = 10). Data (mean percentage per hour ± SE) were recorded in DD and are expressed as the change relative to YCA. Data are plotted in 2 hr bins and are fitted with second-order regressions. See Results for two-way, repeated-measures ANOVA. Contrasts by Tukey's studentized range test (α = 0.05): *sham-lesioned versus SCNx, +CT 6 versus CT 18. As the compensatory elevation of REM sleep abated during recovery from RSD, NREM sleep increased.
Time course of REM sleep
In addition to the direct control of REM sleep by circadian and homeostatic processes, the amount of REM sleep observed at a given time of day can be indirectly controlled by the expression of competing arousal states. Therefore, an examination of the time course of the absolute levels of REM sleep was undertaken during the first 8 hr after RSD, a time period in which visual inspection of the data revealed clear distinctions between CT groups (Fig. 5).
CT group interacted with the hour after RSD (F(6,93) = 13.2; p = 0.0001) to produce the distinctive patterns of REM sleep expression. During the first 2 hr after RSD, REM sleep was significantly greater in the CT 6 group (RSD release at mid-rest phase) than in the CT 18 (RSD release at mid-activity phase) or SCNx groups. The SCNx and CT 18 groups had equivalent amounts of REM sleep (14.6% per hour) at this time, versus 24% per hour for the CT 6 group. Then, 3–4 hr after RSD, REM sleep duration decreased in the CT 18 group (Fig. 5,arrow) to below the levels observed in the CT 6 and SCNx groups, which had equivalent amounts of REM sleep. This time period corresponded to CT 20 to CT 21 for the rats that were released during the mid-activity phase. REM sleep remained suppressed in the CT 18 group 5–6 hr after RSD (from CT 22 to CT 23) at a level that was statistically indistinguishable from the SCNx group, but was significantly less than the CT 6 group. By 7–8 hr after RSD (from CT 0 to CT 1), REM sleep increased from 8.8 to 15.6% per hour in the CT 18 group. This amount was significantly greater than the REM duration observed in the SCNx and CT 6 groups, which were equivalent (9.2% per hour). Post hoc one-way ANOVA and contrasts on the time course of the absolute levels of REM sleep within the CT 18 group confirmed the significance of the decrease in REM sleep 3–6 hr post-RSD (CT 20 to CT 23) and its subsequent resurgence at the start of the rest phase (F(3,47) = 10.9;p = 0.0001) (Fig. 5, arrow).
Circadian separation analysis
Figure 9 shows REM sleep tendency during RSD and REM sleep duration for 24 hr after RSD, after the data from sham-lesioned rats had been parsed into rest and activity phase groups according to the circadian separation procedure (Fig. 1). Sham-lesioned rats attempted to enter REM sleep more during the rest phase than during the activity phase or than SCNx rats, and the attempts to enter REM sleep were the same between the activity-phase group and the SCNx rats (F(2,31) = 7.08; p = 0.0029). REM sleep tendency also increased as RSD progressed (F(3,93) = 12.0;p = 0.0001), but RSD hour and circadian phase did not interact to affect REM sleep attempts (F(6,93) = 1.81; p = 0.13). While recovering from RSD, sham-lesioned rats spent more time in REM sleep during the rest phase than during the activity phase, and SCNx rats showed REM sleep at a level intermediary to the levels in sham-lesioned rats (F(2,31) = 36.4;p = 0.0001). REM sleep decreased over the course of the 24 hr RSD recovery period (F(3,93) = 105; p = 0.0001), and was influenced by an interaction between recovery hour and circadian phase (F(6,93) = 3.47; p = 0.0078). Contrasts were evident between all circadian phase groups at every hour after RSD.
Fig. 9.

Circadian separation analysis (see Materials and Methods and Fig. 1 for explanation) of REM sleep attempts (mean number per hour ± SE) during 24 hr RSD (left panel) and REM sleep duration (mean percentage per hour ± SE) during 24 hr recovery from RSD (right panel). Data in the left panel are identical to Figure 6, and data in the right panel are identical to Figure 7 (top left panel, RSD plots), except the second-order regressions here are fitted to data points taken from the rest phase (circles) or activity phase (triangles), whether RSD began at CT 6 or CT 18. The two circadian phases are plotted against values from SCN-lesioned rats (squares; n = 10). See Results for two-way repeated-measures ANOVA and contrasts. During RSD, REM sleep tendency was promoted in the rest phase and was not inhibited by the SCN in the activity phase. After RSD, REM sleep was a composite of REM sleep tendency and duration, and circadian and homeostatic factors interacted to maintain consistent proportions of REM sleep between the rest and activity phases.
DISCUSSION
This work represents the first systematic attempt to discern whether the circadian system facilitates or inhibits REM sleep homeostasis at different times of day to produce the circadian rhythm of REM sleep. Although circadian and homeostatic processes have previously been shown to interact to influence REM sleep expression (Dijk and Czeisler, 1995), the present study was designed to elucidate the specific nature of that interaction. Using novel, automated REM sleep deprivation technology in sham-lesioned and SCNx rats, this study demonstrates that the SCN promotes REM sleep tendency during the rest phase and does not inhibit the attempts to enter REM sleep during the activity phase. Furthermore, circadian processes do not interact with compensatory mechanisms responsible for the amount of REM sleep rebound after REM sleep deprivation in the rat.
Circadian and homeostatic processes in REM regulation
The compensatory increases in REM sleep tendency during RSD and in REM sleep duration after RSD in SCNx rats demonstrate that REM sleep homeostatic mechanisms are morphologically distinct from the circadian pacemaker. This conclusion is consistent with previous findings of compensatory REM sleep during recovery from total sleep deprivation (Mistlberger et al., 1983; Tobler et al., 1983), but shows that compensatory REM sleep can be evoked without an elevation of NREM sleep in SCNx rats, in contrast to previous claims of this prerequisite (Benington et al., 1991; Benington and Heller, 1994).
Somnographic recording during selective REM sleep deprivation of SCNx rats and sham-lesioned rats for 24 hr revealed a circadian promotion of REM sleep tendency. Throughout RSD, REM sleep attempts increased in sham-lesioned rats during the rest phase and were indistinguishable between sham-lesioned rats during the activity phase and SCNx rats (Figs. 5, 9). These data suggest REM sleep tendency was promoted by the SCN during the rest phase and did not show circadian inhibition during the activity phase. Although an interaction between CT group and RSD hour was evident in the analysis for Figure 6, no interaction between circadian phase and RSD hour was found in the circadian separation analysis for Figure 9. The circadian separation analysis suggests that the homeostatic increase in REM sleep attempts follows an approximately linear function during rest or activity phases, or in the absence of circadian rhythmicity. However, REM sleep attempts during 5 weeks of RSD are stable from week to week (Kushida et al., 1989), suggesting REM tendency reaches an asymptote fairly soon after 24 hr. Indeed, the trend toward a plateau in the REM sleep attempts during the last half of the RSD period during the activity phase (Fig. 9) suggests that an interaction between circadian phase and RSD hour might have appeared had RSD lasted >24 hr. Further studies on the rate of REM tendency at different circadian phases (and in SCNx animals) during RSD for a few days would help clarify whether REM tendency can be inhibited by the SCN during the activity phase.
Although transitions into REM sleep are facilitated by the SCN during the rest phase, the amount of REM sleep, once initiated, is determined primarily by homeostatic mechanisms. The circadian phase of REM sleep rebound initiation did not affect the amount of REM sleep that was ultimately recovered (Table 3, Figs. 7, 8). REM sleep was significantly elevated above BL and YCA for the first 12 hr after release from RSD at CT 6 or CT 18 in sham-lesioned rats, or in SCNx rats, but this compensatory response did not differ between the groups. Even the small REM sleep rebound after YCA did not show circadian variation, suggesting the lack of circadian differences in rebound after RSD is probably not attributable to a ceiling effect. Alternatively, not enough REM sleep may have been lost to produce an exaggerated REM sleep rebound that would be sufficient to show an interaction with circadian phase. Nevertheless, this caveat is tempered by the finding that REM sleep homeostasis was challenged enough to interact with circadian time during the RSD period. Furthermore, the rate of decay for the absolute levels of REM sleep was the same in all circadian phase groups (Fig. 9). The differential regulation of REM sleep timing and amount found by this study supports previous claims of this distinction (Benington and Heller, 1994; Franken, 1995), but adds a circadian component to REM sleep regulation.
In the debate over strong versus weak homeostatic regulation of REM sleep, the present findings favor weak homeostatic regulation and suggest stronger circadian control than has been previously considered. Strong homeostatic control of REM sleep has been based on the rapid rise in REM sleep attempts during a night of REM sleep deprivation in humans (Sampson, 1965; Endo et al., 1998) and during the first few hours of REM sleep deprivation in rats (Borbely et al., 1984; Benington et al., 1994; Endo et al., 1997). Weak homeostatic control has been used to describe the more modest increase in REM sleep attempts over successive nights of REM sleep deprivation (Sampson, 1965; Endo et al., 1998). The present study suggests REM tendency is controlled more by the SCN than by a weak homeostatic process based on the twofold difference in REM sleep attempts between circadian phases during the first 6 hr of REM deprivation versus the much longer time required for REM attempts to double within circadian phase groups (Fig. 9). In addition, the ratio of REM sleep in SCNx rats to sham-lesioned rats shows SCNx rats had less REM sleep during BL (0.92), YCA (0.88), and RSD (0.67) conditions (Tables 1, 2). The progressively disproportionate reduction of REM sleep in SCNx versus sham-lesioned rats during conditions in which REM sleep homeostasis was progressively challenged to a greater degree (i.e., BL to YCA to RSD) suggests homeostasis alone does not appear to be a very strong promoter of REM sleep during sleep-disrupting conditions.
The hypothesis that REM sleep is controlled mostly by a strong homeostatic process does not readily explain the dramatic decrease in REM sleep attempts from the end of a night of REM deprivation to the beginning of the next night of REM deprivation in humans (Sampson, 1965; Endo et al., 1998) or the present finding that REM tendency decreased during the last 6 hr of RSD in rats that began 24 hr RSD at CT 18 (Fig. 6). The decrease in REM attempts in humans has been hypothesized to be attributable to a functional substitution of wakefulness for REM sleep, in which REM drive would dissipate through the expression of wakefulness (Endo et al., 1998). However, circadian modulation of a REM tendency set point could explain the daily pattern of REM sleep attempts observed in humans and rats without the need to invoke the functional substitution of arousal states. The rodent studies that suggest REM sleep is strongly controlled by a homeostatic process all measured a rapid increase in REM attempts during 2 or 4 hr of REM sleep deprivation during the early rest phase—a qualifier often discounted in the discussion of REM sleep homeostasis (Borbely et al., 1984; Benington et al., 1994; Endo et al., 1997). The current study also showed REM tendency to most rapidly increase during the early rest phase, whether that circadian time occurred at the beginning or end of the 24 hr REM deprivation period (Fig. 6). However, this study is the first to attribute circadian control of REM tendency as an explanation for the pattern of REM attempts observed in all of these studies.
Competition between arousal states
Growing evidence suggests that increased pressure for REM sleep suppresses SWA (Beersma et al., 1990; Benington et al., 1994; Endo et al., 1997). This interaction between sleep state drives could explain the very small, but significant, reduction during RSD of SWA relative to YCA (Table 2), but does not explain the parallel time course in the decay of REM sleep rebound and SWA during recovery from RSD (Table 3). However, as REM sleep abated during the first 12 hr after RSD, NREM sleep gradually increased from below YCA levels to above (Fig. 8), suggesting NREM duration was disinhibited as REM sleep pressure was discharged. Thus, high homeostatic drive for REM sleep can suppress either NREM sleep time or NREM intensity.
The temporal pattern of arousal states is shaped not only by the active interaction between circadian and homeostatic processes, but also by the passive gating of competing arousal states (e.g., the wakefulness required for feeding necessarily displaces sleeping behavior). The unexpected reduction of REM sleep from CT 20–23 after release from RSD at CT 18 (Fig. 5, arrow) is consistent with the notion that the circadian control of wakefulness can offset recovery sleep after sleep deprivation (Borbely and Neuhaus, 1979; Kas and Edgar, 1999). The present data showing the circadian promotion of REM sleep tendency, taken together with previous evidence of SCN-dependent alerting (Edgar et al., 1993; Edgar, 1994), suggest that the SCN may actively promote cortical EEG arousal that manifests as wakefulness or REM sleep depending on the time of day.
Neurobiological substrates
The neurobiological substrate for the circadian facilitation of EEG-desynchronized arousal states is unknown but may implicate neurons of the posterior lateral hypothalamus that discharge maximally during both wakefulness and REM sleep (Steininger et al., 1999) or the locus coeruleus that discharge maximally during wakefulness and cease firing during REM (Hobson et al., 1975). These areas are densely innervated by hypocretin/orexin fibers (Peyron et al., 1998) arising from hypothalamic areas that receive SCN input (Watts, 1991). Disruption of the hypocretin system causes narcolepsy (Chemelli et al., 1999; Lin et al., 1999), a disorder characterized by abnormal transitions from wakefulness to REM sleep, impaired circadian effector mechanisms for arousal, but normal sleep homeostasis (Dantz et al., 1994; Mayer et al., 1997; Broughton et al., 1998).
Footnotes
This work was supported by the Air Force Office of Scientific Research, Program for Research Excellence and Transition (F49620-95-1-0388), and the National Institutes of Health Grants AG11084 and MH11660. We thank Laura Alexandre, Humberto Garcia, Wesley Seidel, and Ronny Tjon, for technical assistance, Rand Wheatland for software development, and the National Multi-Site Training Program for Basic Sleep Research, for facilitating the graduate training of Sarah Wurts.
Correspondence should be addressed to Dr. Sarah W. Wurts, Sleep Research Center, Stanford University, 701 Welch Road #2226, Palo Alto, CA 94304.
REFERENCES
- 1.Agnew HW, Jr, Webb WB, Williams RL. Comparison of stage four and 1-rem sleep deprivation. Percept Mot Skills. 1967;24:851–858. doi: 10.2466/pms.1967.24.3.851. [DOI] [PubMed] [Google Scholar]
- 2.Beersma DG, Dijk DJ, Blok CG, Everhardus I. REM sleep deprivation during 5 hours leads to an immediate REM sleep rebound and to suppression of non-REM sleep intensity. Electroencephalogr Clin Neurophysiol. 1990;76:114–122. doi: 10.1016/0013-4694(90)90209-3. [DOI] [PubMed] [Google Scholar]
- 3.Benington JH, Heller HC. REM-sleep timing is controlled homeostatically by accumulation of REM-sleep propensity in non-REM sleep. Am J Physiol. 1994;266:R1992–R2000. doi: 10.1152/ajpregu.1994.266.6.R1992. [DOI] [PubMed] [Google Scholar]
- 4.Benington JH, Trachsel L, Edgar DM, Heller HC, Dement WC. REM-sleep expression increases progressively during recovery sleep in rats with lesions of the suprachiasmatic nuclei. Sleep Res. 1991;20:21. [Google Scholar]
- 5.Benington JH, Woudenberg MC, Heller HC. REM-sleep propensity accumulates during 2-h REM-sleep deprivation in the rest period in rats. Neurosci Lett. 1994;180:76–80. doi: 10.1016/0304-3940(94)90917-2. [DOI] [PubMed] [Google Scholar]
- 6.Bes FW, Jobert M, Cordula Muller L, Schulz H. The diurnal distribution of sleep propensity: experimental data about the interaction of the propensities for slow-wave sleep and REM sleep. J Sleep Res. 1996;5:90–98. doi: 10.1046/j.1365-2869.1996.00020.x. [DOI] [PubMed] [Google Scholar]
- 7.Borbely AA. Effects of light and circadian rhythm on the occurrence of REM sleep in the rat. Sleep. 1980;2:289–298. [PubMed] [Google Scholar]
- 8.Borbely AA, Neuhaus HU (1979) Sleep-deprivation: effects on sleep and EEG in the rat. 133:71–87.
- 9.Borbely AA, Tobler I, Hanagasioglu M. Effect of sleep deprivation on sleep and EEG power spectra in the rat. Behav Brain Res. 1984;14:171–182. doi: 10.1016/0166-4328(84)90186-4. [DOI] [PubMed] [Google Scholar]
- 10.Bracewell RN. The hartley transform. Oxford UP; New York: 1986. [Google Scholar]
- 11.Broughton R, Krupa S, Boucher B, Rivers M, Mulligan J. Impaired circadian waking arousal in narcolepsy-cataplexy. Sleep Res Online. 1998;1:159–165. [PubMed] [Google Scholar]
- 12.Carskadon MA, Dement WC. Sleepiness and sleep state on a 90-min schedule. Psychophysiology. 1977;14:127–133. doi: 10.1111/j.1469-8986.1977.tb03362.x. [DOI] [PubMed] [Google Scholar]
- 13.Chemelli RM, Willie JT, Sinton CM, Elmquist JK, Scammell T, Lee C, Richardson JA, Williams SC, Xiong Y, Kisanuki Y, Fitch TE, Nakazato M, Hammer RE, Saper CB, Yanagisawa M. Narcolepsy in orexin knockout mice: molecular genetics of sleep regulation. Cell. 1999;98:437–451. doi: 10.1016/s0092-8674(00)81973-x. [DOI] [PubMed] [Google Scholar]
- 14.Czeisler CA, Weitzman E, Moore-Ede MC, Zimmerman JC, Knauer RS. Human sleep: its duration and organization depend on its circadian phase. Science. 1980a;210:1264–1267. doi: 10.1126/science.7434029. [DOI] [PubMed] [Google Scholar]
- 15.Czeisler CA, Zimmerman JC, Ronda JM, Moore-Ede MC, Weitzman ED. Timing of REM sleep is coupled to the circadian rhythm of body temperature in man. Sleep. 1980b;2:329–346. [PubMed] [Google Scholar]
- 16.Daan S, Beersma DG, Borbely AA. Timing of human sleep: recovery process gated by a circadian pacemaker. Am J Physiol. 1984;246:R161–R183. doi: 10.1152/ajpregu.1984.246.2.R161. [DOI] [PubMed] [Google Scholar]
- 17.Dantz B, Edgar DM, Dement WC. Circadian rhythms in narcolepsy: studies on a 90 minute day. Electroencephalogr Clin Neurophysiol. 1994;90:24–35. doi: 10.1016/0013-4694(94)90110-4. [DOI] [PubMed] [Google Scholar]
- 18.Dement WC. The effect of dream deprivation. Science. 1960;131:1705–1707. doi: 10.1126/science.131.3415.1705. [DOI] [PubMed] [Google Scholar]
- 19.Dijk DJ, Czeisler CA. Paradoxical timing of the circadian rhythm of sleep propensity serves to consolidate sleep and wakefulness in humans. Neurosci Lett. 1994;166:63–68. doi: 10.1016/0304-3940(94)90841-9. [DOI] [PubMed] [Google Scholar]
- 20.Dijk DJ, Czeisler CA. Contribution of the circadian pacemaker and the sleep homeostat to sleep propensity, sleep structure, electroencephalographic slow waves, and sleep spindle activity in humans. J Neurosci. 1995;15:3526–3538. doi: 10.1523/JNEUROSCI.15-05-03526.1995. [DOI] [PMC free article] [PubMed] [Google Scholar]
- 21.Dijk DJ, Duffy JF. Circadian regulation of human sleep and age-related changes in its timing, consolidation and EEG characteristics. Ann Med. 1999;31:130–140. doi: 10.3109/07853899908998789. [DOI] [PubMed] [Google Scholar]
- 22.Dijk DJ, Shanahan TL, Duffy JF, Ronda JM, Czeisler CA. Variation of electroencephalographic activity during non-rapid eye movement and rapid eye movement sleep with phase of circadian melatonin rhythm in humans. J Physiol (Lond) 1997;505:851–858. doi: 10.1111/j.1469-7793.1997.851ba.x. [DOI] [PMC free article] [PubMed] [Google Scholar]
- 23.Drucker-Colin R, Bernal-Pedraza J, Fernandez-Cancino F, Morrison AR. Increasing PGO spike density by auditory stimulation increases the duration and decreases the latency of rapid eye movement (REM) sleep. Brain Res. 1983;278:308–312. doi: 10.1016/0006-8993(83)90261-5. [DOI] [PubMed] [Google Scholar]
- 24.Eastman CI, Mistlberger RE, Rechtschaffen A. Suprachiasmatic nuclei lesions eliminate circadian temperature and sleep rhythms in the rat. Physiol Behav. 1984;32:357–368. doi: 10.1016/0031-9384(84)90248-8. [DOI] [PubMed] [Google Scholar]
- 25.Edgar DM. Functional role of the suprachiasmatic nuclei in the regulation of sleep and wakefulness. In: Guilleminault C, Lugaresi E, Montagna P, Gambetti P, editors. Fatal familial insomnia: inherited prion diseases, sleep, and the thalamus. Raven; New York: 1994. pp. 203–213. [Google Scholar]
- 26.Edgar DM, Seidel WF, Dement WC. Triazolam-induced sleep in the rat: influence of prior sleep, circadian time, and light/dark cycles. Psychopharmacology (Berl) 1991a;105:374–380. doi: 10.1007/BF02244433. [DOI] [PubMed] [Google Scholar]
- 27.Edgar DM, Seidel WF, Martin CE, Sayeski PP, Dement WC. Triazolam fails to induce sleep in suprachiasmatic nucleus-lesioned rats. Neurosci Lett. 1991b;125:125–128. doi: 10.1016/0304-3940(91)90007-g. [DOI] [PubMed] [Google Scholar]
- 28.Edgar DM, Dement WC, Fuller CA. Effect of SCN lesions on sleep in squirrel monkeys: evidence for opponent processes in sleep-wake regulation. J Neurosci. 1993;13:1065–1079. doi: 10.1523/JNEUROSCI.13-03-01065.1993. [DOI] [PMC free article] [PubMed] [Google Scholar]
- 29.Endo S, Kobayashi T, Yamamoto T, Fukuda H, Sasaki M, Ohta T. Persistence of the circadian rhythm of REM sleep: a variety of experimental manipulations of the sleep-wake cycle. Sleep. 1981;4:319–328. doi: 10.1093/sleep/4.3.319. [DOI] [PubMed] [Google Scholar]
- 30.Endo T, Schwierin B, Borbely AA, Tobler I. Selective and total sleep deprivation: effect on the sleep EEG in the rat. Psychiatry Res. 1997;66:97–110. doi: 10.1016/s0165-1781(96)03029-6. [DOI] [PubMed] [Google Scholar]
- 31.Endo T, Roth C, Landolt HP, Werth E, Aeschbach D, Achermann P, Borbely AA. Selective REM sleep deprivation in humans: effects on sleep and sleep EEG. Am J Physiol. 1998;274:R1186–R1194. doi: 10.1152/ajpregu.1998.274.4.R1186. [DOI] [PubMed] [Google Scholar]
- 32.Franken P. REM sleep regulation in the rat. Sleep Res. 1995;24A:433. [Google Scholar]
- 33.Hobson JA, McCarley RW, Wyzinski PW. Sleep cycle oscillation: reciprocal discharge by two brainstem neuronal groups. Science. 1975;189:55–58. doi: 10.1126/science.1094539. [DOI] [PubMed] [Google Scholar]
- 34.Kas MJ, Edgar DM. Circadian timed wakefulness at dawn opposes compensatory sleep responses after sleep deprivation in Octodon degus. Sleep. 1999;22:1045–1053. doi: 10.1093/sleep/22.8.1045. [DOI] [PubMed] [Google Scholar]
- 35.Kushida CA, Bergmann BM, Rechtschaffen A. Sleep deprivation in the rat: IV. Paradoxical sleep deprivation. Sleep. 1989;12:22–30. doi: 10.1093/sleep/12.1.22. [DOI] [PubMed] [Google Scholar]
- 36.Lavie P. Ultrashort sleep-wake cycle: timing of REM sleep. Evidence for sleep-dependent and sleep-independent components of the REM cycle. Sleep. 1987;10:62–68. [PubMed] [Google Scholar]
- 37.Lavie P. Melatonin: role in gating nocturnal rise in sleep propensity. J Biol Rhythms. 1997;12:657–665. doi: 10.1177/074873049701200622. [DOI] [PubMed] [Google Scholar]
- 38.Lin L, Faraco J, Li R, Kadotani H, Rogers W, Lin X, Qiu X, de Jong PJ, Nishino S, Mignot E. The sleep disorder canine narcolepsy is caused by a mutation in the hypocretin (orexin) receptor 2 gene. Cell. 1999;98:365–376. doi: 10.1016/s0092-8674(00)81965-0. [DOI] [PubMed] [Google Scholar]
- 39.Lisk RD, Sawyer CH. Induction of paradoxical sleep by lights-off stimulation. Proc Soc Exp Biol Med. 1966;123:664–667. doi: 10.3181/00379727-123-31571. [DOI] [PubMed] [Google Scholar]
- 40.Maron L, Rechtschaffen A, Wolpert EA. Sleep cycle during napping. Arch Gen Psychiatry. 1964;11:503–508. doi: 10.1001/archpsyc.1964.01720290045006. [DOI] [PubMed] [Google Scholar]
- 41.Mayer G, Hellmann F, Leonhard E, Meier-Ewert K. Circadian temperature and activity rhythms in unmedicated narcoleptic patients. Pharmacol Biochem Behav. 1997;58:395–402. doi: 10.1016/s0091-3057(97)00241-4. [DOI] [PubMed] [Google Scholar]
- 42.Miller AM, Obermeyer WH, Behan M, Benca RM. The superior colliculus-pretectum mediates the direct effects of light on sleep. Proc Natl Acad Sci USA. 1998;95:8957–8962. doi: 10.1073/pnas.95.15.8957. [DOI] [PMC free article] [PubMed] [Google Scholar]
- 43.Mistlberger RE, Bergmann BM, Waldenar W, Rechtschaffen A. Recovery sleep following sleep deprivation in intact and suprachiasmatic nuclei-lesioned rats. Sleep. 1983;6:217–233. doi: 10.1093/sleep/6.3.217. [DOI] [PubMed] [Google Scholar]
- 44.Morden B, Mitchell G, Dement W. Selective REM sleep deprivation and compensation phenomena in the rat. Brain Res. 1967;5:339–349. doi: 10.1016/0006-8993(67)90042-x. [DOI] [PubMed] [Google Scholar]
- 45.Paxinos G, Watson C. The rat brain in stereotaxic coordinates, Ed 2. Academic; San Diego: 1986. [DOI] [PubMed] [Google Scholar]
- 46.Peyron C, Tighe DK, van den Pol AN, de Lecea L, Heller HC, Sutcliffe JG, Kilduff TS. Neurons containing hypocretin (orexin) project to multiple neuronal systems. J Neurosci. 1998;18:9996–10015. doi: 10.1523/JNEUROSCI.18-23-09996.1998. [DOI] [PMC free article] [PubMed] [Google Scholar]
- 47.Radulovacki M, Walovitch R, Yanik G. Caffeine produces REM sleep rebound in rats. Brain Res. 1980;201:497–500. doi: 10.1016/0006-8993(80)91060-4. [DOI] [PubMed] [Google Scholar]
- 48.Rechtschaffen A, Bergmann BM, Gilliland MA, Bauer K. Effects of method, duration, and sleep stage on rebounds from sleep deprivation in the rat. Sleep. 1999;22:11–31. doi: 10.1093/sleep/22.1.11. [DOI] [PubMed] [Google Scholar]
- 49.Sack RL, Hughes RJ, Edgar DM, Lewy AJ. Sleep-promoting effects of melatonin: at what dose, in whom, under what conditions, and by what mechanisms? Sleep. 1997;20:908–915. doi: 10.1093/sleep/20.10.908. [DOI] [PubMed] [Google Scholar]
- 50.Sampson H. Deprivation of dreaming sleep by two methods. I. Compensatory REM time. Arch Gen Psychiatry. 1965;13:79–86. doi: 10.1001/archpsyc.1965.01730010081011. [DOI] [PubMed] [Google Scholar]
- 51.Sokolove PG, Bushell WN. The chi square periodogram: its utility for analysis of circadian rhythms. J Theor Biol. 1978;72:131–160. doi: 10.1016/0022-5193(78)90022-x. [DOI] [PubMed] [Google Scholar]
- 52.Steininger TL, Alam MN, Gong H, Szymusiak R, McGinty D. Sleep-waking discharge of neurons in the posterior lateral hypothalamus of the albino rat. Brain Res. 1999;840:138–147. doi: 10.1016/s0006-8993(99)01648-0. [DOI] [PubMed] [Google Scholar]
- 53.Szymusiak R, Satinoff E. Maximal REM sleep time defines a narrower thermoneutral zone than does minimal metabolic rate. Physiol Behav. 1981;26:687–690. doi: 10.1016/0031-9384(81)90145-1. [DOI] [PubMed] [Google Scholar]
- 54.Tobler I, Borbely AA, Groos G. The effect of sleep deprivation on sleep in rats with suprachiasmatic lesions. Neurosci Lett. 1983;42:49–54. doi: 10.1016/0304-3940(83)90420-2. [DOI] [PubMed] [Google Scholar]
- 55.Van Gelder RN, Edgar DM, Dement WC. Real-time automated sleep scoring: validation of a microcomputer-based system for mice. Sleep. 1991;14:48–55. doi: 10.1093/sleep/14.1.48. [DOI] [PubMed] [Google Scholar]
- 56.van Luijtelaar EL, Coenen AM. Electrophysiological evaluation of three paradoxical sleep deprivation techniques in rats. Physiol Behav. 1986;36:603–609. doi: 10.1016/0031-9384(86)90341-0. [DOI] [PubMed] [Google Scholar]
- 57.Watts AG. The efferent projections of the suprachiasmatic nucleus: anatomical insights into the control of circadian rhythms. In: Klein DC, Moore RY, Reppert SM, editors. Suprachiasmatic nucleus: the mind's clock. Oxford UP; New York: 1991. pp. 77–106. [Google Scholar]
- 58.Weitzman ED, Czeisler CA, Zimmerman JC, Ronda JM. Timing of REM and stages 3 + 4 sleep during temporal isolation in man. Sleep. 1980;2:391–407. [PubMed] [Google Scholar]
- 59.Zulley J. Distribution of REM sleep in entrained 24 hour and free-running sleep-wake cycles. Sleep. 1980;2:377–389. [PubMed] [Google Scholar]