

Abstract
We have used the activity-dependent probe FM1-43 with electron microscopy (EM) to examine endocytosis at the vertebrate nerve–muscle synapse. Preparations were fixed after very brief neural stimulation at reduced temperature, and internalized FM1-43 was photoconverted into an electron-dense reaction product. To locate the reaction product, we reconstructed computer renderings of individual terminal boutons from serial EM sections. Most of the reaction product was seen in 40–60 nm vesicles. All of the labeled vesicles were clathrin-coated, and 92% of them were located within 300 nm of the plasma membrane, suggesting that they had undergone little processing after retrieval from their endocytic sites. The vesicles (and by inference the sites) were not dispersed randomly near the plane of the membrane but instead were clustered significantly near active zones. Additional reaction product was found within putative macropinosomes; these appeared to form from deep membrane invaginations near active zones. Thus two mechanisms of endocytosis were evident after brief stimulation. Endocytosis near active zones is consistent with the existence of local exo/endocytic cycling pools. This mechanism also might serve to maintain alignment of active zones with postsynaptic folds during periods of activity when vesicular and plasma membranes are interchanged.
Keywords: clathrin, endocytosis, nerve terminal, neuromuscular junction, neurosecretion, optical probes, vesicle processing
The cycle of transmitter exocytosis and subsequent endocytosis of spent vesicular membranes first was described nearly three decades ago (Couteaux and Pecot-Dechavassine, 1970; Heuser and Miledi, 1971; Ceccarelli et al., 1973, 1979; Heuser and Reese, 1973). Although exocytosis was associated with active zones (AZs; Couteaux and Pecot-Dechavassine, 1970, 1974), the endocytic process was unclear in two respects: the type of endocytosis that was used under physiological conditions and the location at which, relative to the AZ, endocytosis took place (see Heuser, 1989). Additional information about exocytosis, endocytosis, and their coupling has become available from a variety of recent techniques (for review, seeAngleson and Betz, 1997). However, the questions first debated by Heuser, Ceccarelli, and their colleagues have not been answered completely.
Three endocytic mechanisms have been proposed. Clathrin-mediated endocytosis, evidenced by coated pits and coated vesicles (Heuser and Reese, 1973), is the standard model. Macropinocytosis (Kadota et al., 1994; Takei et al., 1996), or bulk endocytosis of plasma membrane, is probably responsible for the formation of large “cisternae” within terminals; clathrin-mediated budding from the cisternae (and perhaps also from noninternalized membrane invaginations; Takei et al., 1996) then produces vesicles similar or identical to those endocytosed directly from the plasma membrane. “Kiss and run” transmitter release (Fesce et al., 1994; Ales et al., 1999; Daly et al., 2000) refers to the putative process whereby exocytosis is followed by endocytosis of the same membrane via a single fusion pore. Activity-dependent probes taken up by kiss and run necessarily would appear at or near AZs, the precise location reported by Ceccarelli et al. (1973, 1979) for the uptake of dextran and for the formation of pits in freeze-fracture replicas. In contrast, clathrin-mediated endocytosis and macropinocytosis could occur anywhere in the plasma membrane of the terminal, but observations of Heuser and colleagues indicated that retrieval of vesicle membrane was spatially separate from exocytosis (Heuser, 1989). More recent indications are that two or more endocytic mechanisms might coexist (and perhaps be spatially distinct), with their recruitment depending on factors such as the rate at which the nerve terminal must recycle membrane (von Gersdorff and Matthews, 1994; Koenig and Ikeda, 1996; Matthews, 1996; Takei et al., 1996; Kuromi and Kidokoro, 1998, 1999; Roos and Kelly, 1999; Teng et al., 1999).
Ascertaining the relative importance of these disparate mechanisms, for example by viewing endocytosis directly, has proven difficult. Even small stimuli can elicit responses in which processing proceeds well beyond the stage of initial endocytosis, obscuring the association of activity-labeled structures with the endocytic site. We describe here a recent synaptic preparation that overcomes this limitation. Motor terminals of the garter snake comprise ∼60 discrete boutons, which avidly take up activity-dependent probes and become labeled with <100 low-frequency stimuli (Teng et al., 1999). Reduced temperature (∼7°C) slows vesicle processing so that vesicles remain near their sites of endocytosis. We found that under these conditions internalized FM1-43 was in vesicles distributed just inside the presynaptic membrane and significantly clustered around AZs. All FM1-43-positive vesicles were clathrin-coated, as were numerous membrane pits from which internalized vesicles presumably arose. A few additional labeled structures appeared to be macropinosomes that had formed from deep membrane invaginations near AZs. Endocytosis near AZs, if appropriately regulated, could help to stabilize the AZs and provide other advantages to the recycling pathways.
Parts of this paper have been published in abstract form (Teng and Wilkinson, 1999).
MATERIALS AND METHODS
Garter snakes (Thamnophis sirtalis) were killed by rapid decapitation. Several contiguous segments of the single-fiber-thick transversus abdominis muscle were dissected from the animals, placed in reptilian saline solution, and divided as needed to provide individual three segment nerve–muscle preparations. Details of the anatomy of the muscle, dissection procedure, and saline composition are described elsewhere (Wilkinson and Lichtman, 1985).
Electrical stimulation and activity-dependent staining.Preparations were placed in a dish on the stage of an inverted microscope equipped with differential interference contrast optics. In most experiments the dish was surrounded by ice so that the bath temperature was ∼7°C to slow clathrin-related activity (Teng et al., 1999). For electrical stimulation the cut end of the muscle nerve was drawn into a hook-in-oil electrode. Negative rectangular pulses (200 μsec) were delivered from an isolated stimulator. The amplitude of the pulses was set supramaximal as judged by visible contraction of the muscle (2–5 V). A minimal number of stimuli (two to three) were delivered to confirm function of the nerve; then the preparation was allowed to rest for ∼5 min so that endocytosis could return to baseline (unstimulated) levels.
The styryl dye FM1-43 (Molecular Probes, Eugene, OR) was prepared as a stock solution (4 mg/ml in 100% dimethylsulfoxide) and applied to the bath (13.0 μm, ∼7°C) before a timed period of electrical stimulation (usually 5 Hz for 30 sec, or 150 stimuli in total). After stimulation the preparation was allowed to remain in the dye-containing bath for either 0.5 or 1.0 min and then washed in 4°C reptilian saline for 10 sec (frequent solution changes) before fixation in 2% gluteraldehyde/100 mm sodium phosphate buffer (PB) solution for 20 min. To reduce the interference of glutaraldehyde autofluorescence with the photoconversion process, we washed the fixed preparation further in 100 mm glycine/PB for 1.0–1.5 hr, in 100 mm ammonium chloride/distilled water for 5 min, and in PB for 10 min (Harata et al., 1998).
Horseradish peroxidase (HRP; Type VI; 2 mg/ml; Sigma, St. Louis, MO), was bath-applied as an alternative endocytic probe. After electrical stimulation the dye remained in the bath for 10 sec or 1 min. Then the preparation was washed in 4°C reptilian saline for 10 sec (frequent solution changes) and fixed in 2% glutaraldehyde and 1% paraformaldehyde/PB for 20 min, followed by three rinses in PB (10 min each). Diaminobenzidine (DAB; powder, 0.5 mg/ml in PB; Sigma) and 0.2 μl/ml of H2O2 solution (30%) were applied to the preparation at room temperature (RT) for 20 min, followed by a washing in PB.
Photoconversion of FM1-43. FM1-43 staining was photoconverted to an electron-dense reaction product, using the protocol of Harata et al. (1998). Incubation with filtered ice-cold DAB (tablets, 1.3 mg/ml; Sigma) was for 15 min in the dark at RT. Then the preparation was transferred to an upright microscope equipped with fluorescein epifluorescence optics (100 W mercury lamp) and a water immersion objective (40×; 0.55 numerical aperture). A small region of the endplate band of the stimulated muscle was “mapped” so that it could be identified later for embedding and electron microscopy (EM). Illumination of several labeled terminals in this region continued until fluorescence staining was bleached completely and the DAB reaction product was visible (9–15 min). During this time the preparation was kept cool by changes of DAB solution every 5 min. The time of illumination was critical to produce a suitably dense reaction product without concomitant ultrastructural damage. After photoconversion a final rinse in PB (three times for 10 min each) was done before preparation for EM.
To exclude the possibility that the photoconverted product that was seen was artifact, we either did not illuminate additional FM1-43-stained nerve terminals after DAB incubation (n= 2) or illuminated them without incubation in DAB reagent (n = 1). EM confirmed that no structures were labeled.
Electron microscopy. Preparations were post-fixed in 1 or 3% osmium dissolved in PB for 1 hr and rinsed with PB buffer (6×). Previously “mapped” regions containing illuminated terminals (FM1-43) or regions of the endplate band that were visualized with a dissecting microscope (HRP) were cut from the muscle, dehydrated in acetone and propylene oxide, embedded in Epon (Araldite 502), and processed by standard methods (see Wilkinson and Nemeth, 1989). Thin sections (∼65 nm) were cut and examined with a JEM-1200EX electron microscope. Portions of 24 boutons were sectioned in four HRP preparations, and portions of 34 boutons were sectioned in six FM1-43 preparations. Among the latter were serial sections obtained from 16 boutons in two preparations. Serial sections from one of these preparations were post-stained with 1% uranyl acetate in 1% sodium acetate and Reynold's lead citrate to enhance the visibility of the AZs (see Results).
Electron micrographs were taken at 8000–50,000× magnification; negatives were scanned (Agfa DuoScan, Belgium) into files on the magnetic disk of a personal computer. Measurements such as perimeter of synaptic vesicles and surface area of bouton sections were acquired with Scion Image software (Scion, Frederick, MD;http://scioncorp.com).
Computerized rendering. Six sets of serial EM sections, each representing a portion of one bouton, were reconstructed into three-dimensional renderings by the following method. Features common to two or more sections, such as the bouton plasma membrane and postjunctional secondary folds, were aligned first with IGL Align (http://synapses.tch.harvard.edu). This software permits features in each of two images (adjacent EM sections) to be seen while moving one of them. In this way all of 22–31 sections representing one bouton were aligned in sequence. Then objects in those aligned images (postjunctional folds, AZs, labeled vesicles, endosomes, etc.) were traced by IGL Trace. The locations of specific points, such as the centers of labeled vesicles (LVs), centers of AZs, and the center of the folds at their intersection with the synaptic cleft (FCs), were recorded; these same coordinates comprised the three-dimensional (x, y, z) data sets for use in statistical analyses (see below). LVs and AZs were rendered as uniform spheres (50 nm diameter) and thin slabs (actual dimensions of AZ density), respectively. Other objects, such as the plasma membrane of the bouton, postjunctional folds, deep membrane invaginations, and labeled or unlabeled endosomes, were rendered as surfaces. A final three-dimensional image of a bouton or an object (i.e., endosome) was integrated, colored, and modified with three-dimensional Studio Max R3 software (Discreet, Montreal, Quebec; http://www2.discreet.com).
Statistics. Statistical tests were performed to assess the spatial relationship among LVs, AZs, and FCs within the presynaptic membrane. The tests compared the actual distribution of LVs with a uniform random distribution of points of the same number and occupying the same area (two-dimensional analyses) or volume (three-dimensional analyses). For the coordinates of each actual LV, or for those of each randomly generated LV point, the distance to the nearest AZ was calculated. From this a mean nearest neighbor (NN) distance was calculated for all of the LVs in one bouton. The same AZ coordinates were used to calculate a similar mean NN distance for each of 250 random LV coordinate sets. Then the mean NN distance for LVs was ranked among the mean NN distances of the 251 data sets. Thus the relative rank order (rank in order of ascending mean distances/251) was taken as an empirical p value regarding the likelihood that LVs were located nearer AZs than would be expected were the LVs distributed randomly. The likelihood that LVs were clustered around FCs was computed in an identical manner. Finally, the disposition of AZs (as candidates) with respect to FCs (as targets) was assessed. This calculation served as a control for our measurements and statistical analyses because the well known coincidence of AZs with folds was evident in all individual serial sections.
RESULTS
We previously reported experiments in which snake motor terminals were stimulated in the presence of an activity-dependent probe at a reduced temperature, fixed, and viewed at the light level (Teng et al., 1999). Two types of structures containing internalized dye were seen. The experiments described below were intended to find and characterize the ultrastructural correlates of those structures. Although several boutons were studied with either HRP or FM1-43 as the endocytic marker (see Materials and Methods), only six (all labeled with FM1-43) were reconstructed from serial sections. In three of these boutons the EM serial sections were left unstained to maximize the contrast of FM1-43 photoconversion product. Because AZs were not always visible, we were unable to quantitate the spatial relation between internalized dye and AZs. Subsequent serial EM sections of three other boutons were stained lightly so that AZs became clearly visible, yet photoconverted FM1-43 LVs remained distinguishable from unlabeled ones. In those boutons the location of endocytosed dye relative to AZs was studied directly. HRP was used primarily to compare results from this well established endocytic marker with those from the photoconversion of FM1-43.
Electron microscopy with FM1-43 and HRP
Figure 1 compares typical thin EM sections from boutons labeled with HRP and with FM1-43. Both preparations received 150 stimuli (5 Hz for 30 sec) in their respective baths. Morphology was compromised by photoconversion, presumably caused by free radical formation via the interaction of intense light with FM1-43. Interestingly, vesicles labeled with HRP, a fluid phase marker, often appeared hollow, whereas those labeled with FM1-43, which stains primarily the vesicular membrane, often appeared filled (compare Fig.1A,B, black arrowheads). We presume that the hollow appearance of some HRP-containing vesicles was attributable to the affinity of the enzyme for membranes, whereas the solid appearance of some FM1-43 vesicles was attributable to spreading of the photoreaction into the lumen of the vesicle or to photoreaction of FM1-43 that had equilibrated into the aqueous contents of the lumen. Fuzzy clathrin coats were seen more easily in HRP preparations but were visible in photoconverted ones as well. Virtually all small vesicles labeled with either marker were clathrin-coated. The main difference between HRP and FM1-43 was the number of vesicles that were stained. Fewer vesicles seemed to be labeled with HRP, although we cannot quantitate this observation because only FM1-43 preparations were sectioned serially. Consistent with this, numerous clathrin-coated but unlabeled vesicles were seen in HRP preparations (23% of 116 coated vesicles in 31 EM sections; white arrowhead in Fig.1A), but few coated vesicles that did not also contain visible reaction product (2.4% of 289 coated vesicles in 22 EM sections) were seen in FM1-43 preparations.
Fig. 1.
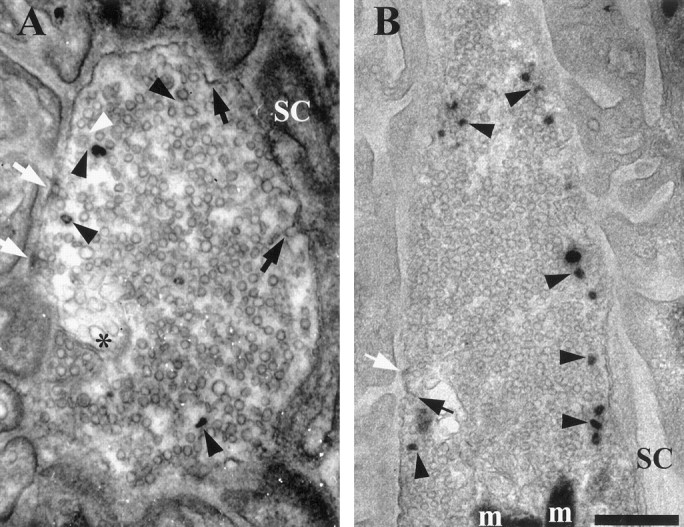
Electron micrographs (65 nm tissue sections) comparing two activity-dependent endocytic probes. A, Horseradish peroxidase (HRP) provided satisfactory contrast to visualize active zones (AZs, white arrows) and vesicles labeled with reaction product (LVs). All LVs were clathrin-coated (black arrowheads), but some coated vesicles were not labeled (white arrowhead). Coated pits (black arrows) and a deep membrane invagination (asterisk) are also present in this section. Note the affinity of HRP for the plasma membrane, particularly coated pits and AZs. B, Photoconversion reaction product of FM1-43 (without post-staining). LVs were clathrin-coated (black arrowheads). Coated pits (black arrow) were visible, but putative AZs (white arrow) exhibited low contrast without post-staining (compare Fig.2A), possibly because FM1-43 rinsed more easily from the AZ densities than did HRP. Note LVs in B and coated pit in A that were close to the Schwann cell (SC; see Results). m, Mitochondrion. Scale bar, 500 nm.
As shown in Figure 2, most, but not all, LVs were the same size as uncoated vesicles. LV effective diameters (measured perimeters/π) were distributed over a broader range than those of unlabeled vesicles from the same preparation (Fig.2E). Although some LVs seemed to be “doublets” (Fig. 2C), most of the ∼8% of LVs that were larger than unlabeled ones exhibited no special features. As discussed further below, internalized coated vesicles were found predominantly near AZs. This was often true of the coated pits (omega profiles) seen in the membrane as well (Table 1; examples in Fig. 2A,D).
Fig. 2.

Size distribution of LVs. A, Virtually all LVs were clathrin-coated (black arrowheads). Note LV and coated pit (black arrow) near AZ (white arrow;asterisk marks center of postjunctional fold). B, C, Examples of LVs that were larger than the unlabeled vesicles surrounding them. D, Large coated pit near AZ (white arrow) is possible precursor to “doublet” LVs, as shown in B and C.E, Distribution of vesicle sizes in 57 sections from one animal, showing substantial contribution of larger LVs to population. Effective diameters were calculated as measured perimeters/π. Shown are FM1-43 preparations with post-staining. Scale bar, 100 nm.
Table 1.
Endocytic structures in FM1-43 labeled boutons
| Structures | Location | Bouton 1 | Bouton 2 | Bouton 3 |
|---|---|---|---|---|
| LVs | <300 nm*presynaptic | 118 | 125 | 118 |
| <300 nm1-160Schwann cell | 10 | 17 | 11 | |
| Near endosomes | 8 | 1 | 12 | |
| Other | 7 | 5 | 0 | |
| Total | 143 | 148 | 141 | |
| Coated pits | *Presynaptic | 23 | 22 | 20 |
| 1-160Schwann cell | 5 | 4 | 3 | |
| Endosomes | 0 | 2 | 4 | |
| Total | 28 | 28 | 27 | |
| Endosomes | Unlabeled | 0 | 3 | 2 |
| Labeled | 1 | 1 | 2 | |
| Deep membrane invaginations | *Presynaptic | 4 | 1 | 2 |
| Presynaptic area (μm2) | 7.7 | 11.1 | 9.1 |
Presynaptic membrane;
F1-160: plasma membrane underlying Schwann cell.
EM sections revealed numerous flattened endosomal structures (cisternae), which generally were not labeled (Table 1; Fig.3D,E). Endosomes are a common feature of resting motor terminals. However, even with the brief stimulation that was used, there was evidence for the formation of new endosomes. Examples are in Figure 3A–D. Occasionally, fully internalized endosomes containing FM1-43 reaction product were seen (four structures in three serially sectioned boutons; Fig.3D; see also Fig. 4). More often, deep unstained invaginations of the plasma membrane were evident in one or more serial sections (seven in three boutons; Fig. 3A–C). Like LVs, often they were found close to AZs (see below). However, although LVs were found over the entire presynaptic membrane, invaginations were found more often near the outer edges of the membrane than near its center. This was confirmed by examining all EM sections containing invaginations (including those from preparations that were not sectioned serially) that had been cut perpendicular to the synaptic cleft. In this configuration the entire circumference of the bouton was visible, appearing as an oval-shaped line. Approximately one-half of the line was opposite the cleft (the presynaptic membrane), with the rest opposite the Schwann cell cap. With the presynaptic portion of the oval divided into four equal quarters, invaginations were found most often in the two quarters near the margins (71%) rather than in the two quarters nearest the center of the presynaptic membrane (29%;n = 21). Figure 3A shows two views of a typical invagination rendered from eight contiguous serial sections. Four of these sections (e.g., Fig. 3B) contained the clathrin-coated bud at the tip (arrows in Fig.3A,B; clathrin not shown in rendered image). Such buds were sometimes present at the tip of these deep invaginations (4 of 7), but no coated vesicles were found nearby. Thus the structures were probably incipient macropinosomes from which clathrin-mediated budding was about to begin. Alternatively, we cannot rule out that the clathrin could have been involved directly in the invagination process itself. Clathrin-mediated budding was, however, seen unambiguously in fully internalized endosomes, whether labeled (Fig. 3D) or not (Fig. 3E). Figure 4 is a stereo image of two such endosomes from which numerous vesicles were budding at the time of fixation.
Fig. 3.
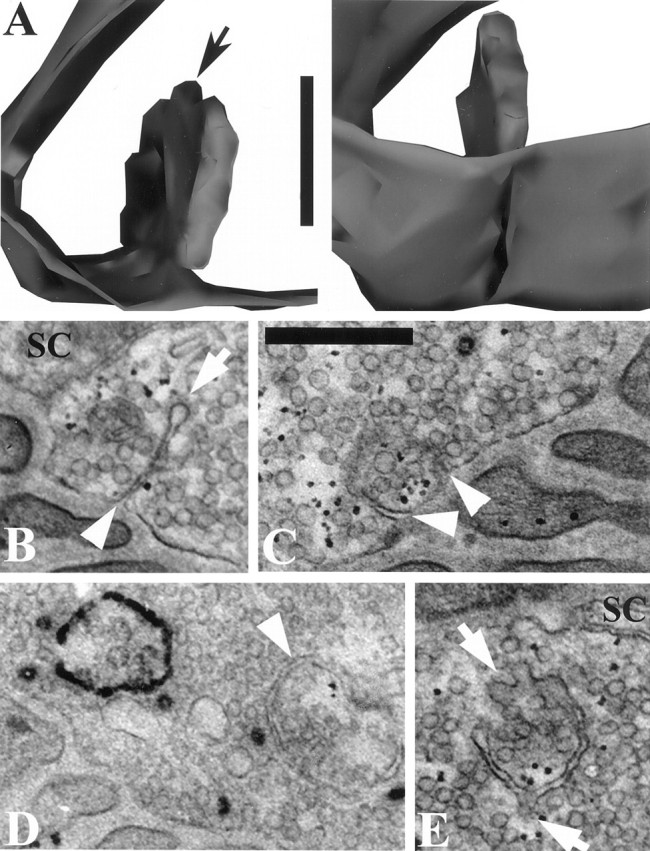
Endosomes and deep membrane invaginations in FM1-43 preparations. A, Two views of a deep membrane invagination, rendered from eight EM sections. Black arrow points to budding vesicle. B, One of five contiguous EM sections from rendering in A, showing continuity with synaptic cleft (arrowhead); note clathrin coat on bud (arrow). C, Double membrane invaginations (white arrowheads) near AZ. The invaginations and their openings to the cleft were seen in six contiguous EM sections. D, Labeled fully internalized endosome (left) and unlabeled fully internalized endosome (arrowhead). Note coated LVs that may have budded from the endosomes. E, Unlabeled endosome containing clathrin-coated buds (arrows). Scale bars:A, 250 nm; B–E, 500 nm.
Fig. 4.
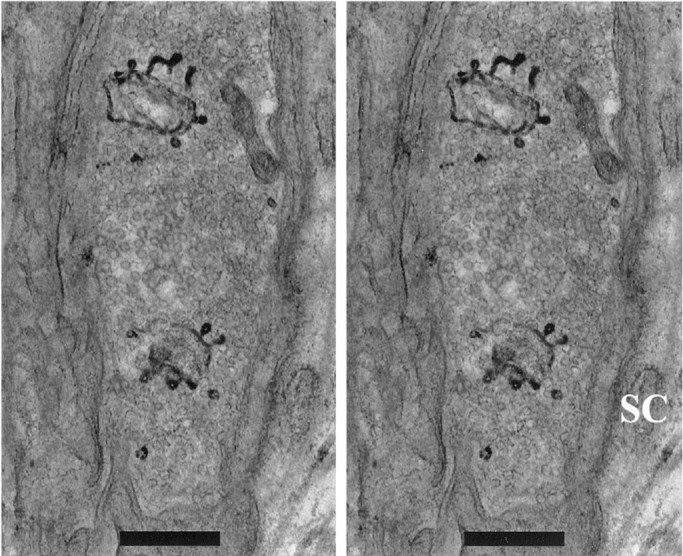
Two budding endosomes in HRP preparation. Stereo view is from stack of four EM sections. SC, Schwann cell. Scale bars, 500 nm.
Rendering of boutons
Three-dimensional reconstructions of computer tracings were made to analyze the spatial relationship between AZs and internalized structures. Specifically, each image data set comprised thex, y, and z coordinates of three structures: LVs, AZs, and the centers of postjunctional folds (FCs) where they intersect the synaptic cleft. As detailed in Table 1, the majority (83%) of LVs was found within 300 nm of the presynaptic membrane. Most of the remainder was found near the plasma membrane at the back of the bouton (i.e., underlying Schwann cells; 9%) or near endosomes (5%). An example (Bouton 3 in Table 1) is shown in Figure 5A. Each section was cut in a plane approximately parallel to that of the page; the image is oriented vertically and rotated slightly to the left for ease of viewing the stereo pair. A part of the bouton (which would appear closest to the viewer; we estimate approximately one-third) was not sectioned and rendered. Figure 5A contains most of the postjunctional fold structure (blue; at left), the bouton plasma membrane (gray-green), and two deep membrane invaginations and four endosomes (all shown gray; see Table 1). The muscle fiber (data not shown) coursed vertically left of the bouton, which partially indented its surface. AZs (red slabs) can be seen to lie in the presynaptic membrane, which opposed the folds. A tiny subset of the vesicles of the bouton (LVs; those labeled with FM1-43 and therefore recently internalized; see Fig.1) is depicted as uniform 50 nm spheres. Figure 5B–D shows FCs, AZs, and 118 of 141 LVs (i.e., excluding those >300 nm from the presynaptic membrane) as they appear in two-dimensional projections onto a plane that corresponds approximately to the presynaptic membrane in Figure 5A. Thus the horizontal dimension in Figure5B–D corresponds to depth in Figure 5A, whereas the vertical dimensions in Figure 5B–D and Figure5A are equivalent. The positions of AZs (red squares) and FCs (blue squares) are shown in Figure5B. A few AZs appeared without folds, possibly because the latter were not visible in certain EM sections. Because each red square depicts the location of an AZ in a single section, AZs that were seen opposite the same fold in two or more contiguous sections appear as contiguous red squares. Figure 5C shows the relation of LVs (white spheres) with AZs (red squares). In this and in similar projections from two other boutons (data not shown), LVs appeared to be clustered near, but usually not directly over, AZs. Consistent with this, larger areas of the presynaptic membrane that contained no AZs tended to contain no LVs either. The relation between LVs and folds (data not shown) was similar: LVs seemed to be associated with FCs and were absent from areas not containing FCs. Another consistent feature seen among both LV–AZ comparisons (three boutons) and LV–FC comparisons (six boutons) was that some AZ/fold regions were “occupied” by endocytosed vesicles whereas others were not (see Discussion). Examples of the locations of coated pits (yellow spheres) and deep membrane invaginations (arrows) relative to AZs are shown in Figure 5D(same bouton as in Fig. 5A–C) and Figure 5E(Bouton 1 in Table 1). Relatively few of these structures were seen, but their positions also appeared to be near AZs.
Fig. 5.
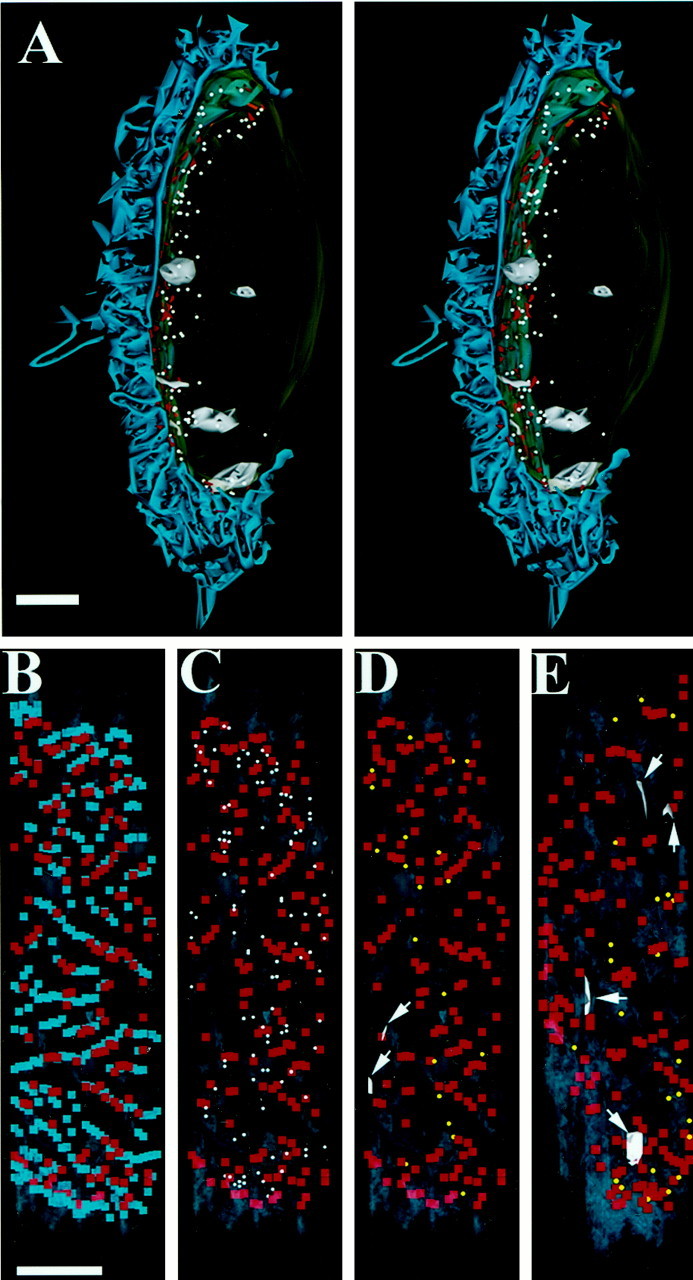
Endocytosis occurs near AZs in snake motor boutons. A, Rendering of bouton portion from 31 serial EM sections. Stereo pair shows postjunctional folds of muscle fiber atleft (blue). AZs (red) lie on presynaptic membrane. LVs (white), shown as 50 nm spheres, were found predominantly near the presynaptic membrane. Also shown are four endosomes and two deep membrane invaginations (gray). B, C, Projections of fold centers (FCs; blue squares) AZs (redsquares), and LVs (white spheres) onto a plane corresponding to that of the presynaptic membrane (see Results).B, AZs appeared near (or in direct apposition to) FCs. Some fold regions were not occupied by AZs. C, LVs were found clustered near AZs (and therefore near folds as well). D, E, Locations of coated pits (yellow spheres) and deep membrane invaginations (gray; arrows) relative to AZs in two rendered boutons. Bouton inD is the same as that in A–C. Scale bars: A, 1 μm; B–E, 1 μm.
Statistical tests
To assess whether LVs were clustered significantly near AZs, we asked whether the average distance separating an LV from the nearest AZ was smaller than would be expected from random chance. For each rendered partial bouton the positions of LVs, AZs, and FCs were compared with 250 random data sets as described below and in Materials and Methods. LVs located >300 nm from the presynaptic membrane, including those that budded from endosomes, were excluded (see Table1). In some analyses only the two dimensions corresponding to the “plane” of the presynaptic membrane were considered (i.e., the projections shown in Fig. 5B–E; the coordinate representing distance perpendicular to the membrane was set to zero). This simplification distorted (shortened) distances near the bouton margins (where the presynaptic membrane was curved) but did so equally for all three types of structures. In other analyses we represented actual and random positions in three dimensions. This eliminated the distortion described above but was also less than ideal because, among LVs that budded directly from the membrane, distances traveled perpendicular to the membrane had no meaning.
As shown in Table 2, the two-dimensional tests confirmed the association of LVs with AZs at high levels of significance (p < 0.004; n = 3 boutons). Similar analyses were performed to test the spatial relation between LVs and FCs (p < 0.008 in 5 of 6 boutons). Finally, we took advantage of known morphological features of AZs and FCs for use in verifying the statistical tests. Because AZs are known to oppose folds precisely (as was evident in individual EM sections), AZ and FC data were known to be associated. Consistent with these observations, tests confirmed the correspondence of AZs and FCs at high significance (p < 0.004;n = 3 boutons; Table 2). All three-dimensional tests corresponding to those described above indicated nonrandom dispositions as well (p < 0.004; data not shown).
Table 2.
Statistical assessments of nearest neighbor distances
| Bouton 1 | Bouton 2 | Bouton 3 | Bouton 4 | Bouton 5 | Bouton 6 | |
|---|---|---|---|---|---|---|
| No. of LVs | 118 | 125 | 118 | 64 | 229 | 130 |
| LV (actual) to AZ: mean ± SD (nm) | 133 ± 85 | 161 ± 96 | 122 ± 69 | |||
| LV (random) to AZ: range of 250 means (nm) | 149–207 | 191–246 | 127–166 | |||
| p = rank/251 | <0.004 | <0.004 | <0.004 | |||
| LV (actual) to FCs: mean ± SD (nm) | 99 ± 72 | 112 ± 68 | 100 ± 56 | 87 ± 63 | 102 ± 61 | 79 ± 50 |
| LV (random) to FCs: range of 250 means (nm) | 97–147 | 118–153 | 90–119 | 85–129 | 124–157 | 84–110 |
| p = rank/251 | <0.008 | <0.004 | <0.140 | <0.008 | <0.004 | <0.004 |
| Number of AZs | 149 | 126 | 165 | |||
| AZ (actual) to FC: mean ± SD (nm) | 79 ± 62 | 79 ± 40 | 68 ± 53 | |||
| AZ (random) to FC: range of 250 means (nm) | 111–153 | 109–137 | 95–121 | |||
| p = rank/251 | <0.004 | <0.004 | <0.004 |
Correspondence with light level observations
We previously observed two types of endocytic structures in confocal images of briefly stimulated boutons (Teng et al., 1999). Small punctate hot spots of endocytosed optical probe (sulforhodamine 101 or FM1-43) increased in size and brightness, but not in number, with increasing stimulation. The hot spots tended to oppose postjunctional folds as do AZs, but their location relative to AZs (which are known to be scattered along folds; Walrond and Reese, 1985) (see also Fig. 5B) was not determined. A second class of structures (which were larger and brighter than the first) appeared after additional stimulation (>20 sec at 5 Hz). On the basis of the results presented above, the larger structures were fully internalized endosomes, whereas the smaller structures were vesicle clusters that had appeared as single structures at light level. To test the latter hypothesis, we modified EM-based renderings of internalized vesicles to account for the diffraction limit (∼200 nm) of confocal light microscopy. An example is shown in Figure6. A confocal image of part of an FM1-43-labeled terminal is shown in Figure 6A, with a magnified region shown in Figure 6B. Stimulation in the presence of FM1-43 was for the same duration, and under the same conditions, as in the current study (see Teng et al., 1999). It can be appreciated that the light-level hot spots were complex structures and that some of the background staining also appeared punctate. Shown in Figure 6C is a projection, as in Figure 5C, of the rendering of Bouton 3 showing FM1-43 LVs. To emulate the diffraction-limited image of vesicles, we rendered each LV as a 200 nm disk for which the brightness decreased radially from the center. The disks were made semi-transparent so that two or more overlapping disks (corresponding to vesicles spaced with centers <200 nm apart) became proportionally brighter in the regions of overlap. In Figure6D, the same image is shown slightly blurred and with contrast and brightness adjusted to approximate optical conditions in which only overlapping vesicle images are clearly visible. The resemblance of Figure 6D to 6Bargues that vesicle clusters can appear as endocytic hot spots when viewed with the light microscope.
Fig. 6.

Clusters of LVs appear as punctate hot spots of FM1-43 staining at light level. A, Confocal photomicrograph of FM1-43 uptake by snake motor terminal in response to 150 stimuli delivered at 5 Hz. B, Magnified view ofbracketed region in A showing large, bright, irregular spots plus small circular spots in background.C, Region of rendered projection from EM as in Figure5C (same stimulation as the terminal inA). LVs with actual diameter of ∼50 nm are depicted as 200 nm partially transparent shaded disks to emulate diffraction-limited detail in light image (see Results).D, Contrast in C was adjusted manually to match the image in B best. Note similarity of large bright spots (overlapping vesicles) and small background spots (individual vesicles) to structures in B. Scale bars:A, 2 μm; B–D, 500 nm.
DISCUSSION
We have shown that endocytosed vesicles in snake motor terminals cluster near active zones. The locations of virtually all LVs and AZs in each of three serially sectioned boutons were mapped. The fraction of each bouton that was sectioned and rendered was 50–75%, giving a large sample size and consequent high levels of statistical significance. Moreover, because AZs are numerous in snake boutons and therefore separated by only ∼400 nm, the association of LVs with individual AZs revealed by statistical tests was demonstrably quite strong. The close spacing of AZs made it difficult to appreciate the clustering around individual AZs visually (see Fig. 5C). However, it was evident that clathrin-mediated endocytosis occurred quite near AZs collectively, as opposed to the classical model that has it well away, near the Schwann cell margins (Heuser, 1989).
The question arises as to whether labeled vesicles are representative of all of the vesicles that were endocytosed. For example, if FM1-43 were sequestered within folds, its activity (effective concentration) might be high near AZs (which oppose folds) yet insufficient elsewhere to produce reaction product. However, unlabeled internalized vesicles would still be identifiable by their clathrin coat, yet virtually no coated but unlabeled vesicles were found by using FM1-43 as a marker. Our ability to argue in this way that all internalized vesicles were labeled was attributable to an advantage of FM1-43 over the classical marker HRP, which failed to label 23% of coated vesicles. This failure may have been attributable to the high molecular weight of HRP and limited solubility, creating the possibility that some vesicles were internalized without even a single HRP molecule. It is also possible to estimate the total number of endocytosed vesicles that was expected and compare this with the actual number that was found. Under low-frequency stimulus conditions similar to those that were used here, one snake motor bouton releases, on average, 1.4 quanta per stimulus (Wilkinson et al., 1996). Thus ∼210 quanta (vesicles) per bouton would have been released during our stimulus protocol, which should equal the number that was retrieved (Smith and Betz, 1996). In our renderings of partial boutons we saw, on average, 144 LVs, 27 coated pits, plus one to two labeled endosomes (or membrane invaginations) from which budding was in progress at the time of fixation. This represents, at the least, a substantial fraction of the membrane likely to have been exocytosed and therefore argues that the majority of endocytosed vesicles was near AZs.
LVs remained close to the bouton membrane and were still coated with clathrin. Interestingly, their size range was somewhat greater than that of the general vesicle population. This suggests that later steps in processing contribute to uniformity, although it remains possible that the larger coated vesicles comprised a separate population (see De Camilli and Takei, 1996). We infer from these observations that processing had progressed little after internalization and that clustering near AZs suggests internalization near AZs as well. The location of coated pits predominantly near AZs supports the same argument, but because too few coated pits were seen to permit statistical analysis, it remains possible that the vesicles were internalized elsewhere (e.g., randomly) and then traveled toward AZs before they were fixed. Endocytosis near AZs was reported first byCeccarelli et al. (1973, 1979), but the activity-labeled vesicles and profiles that were seen could not be demonstrated to contain clathrin. Thus it was argued that either kiss-and-run exo/endocytosis was evidenced or that the profiles and vesicles that were seen were actually exocytotic, with endocytosis taking place elsewhere in the terminal (see Heuser, 1989). More recently, the association of endocytosis with active zones has been described inDrosophila synapses either directly (the shibiremutant; Koenig et al., 1998; Koenig and Ikeda, 1999) or indirectly via immunofluorescence labeling of putative endocytic machinery hot spots (Roos and Kelly, 1999). However, ours is the first demonstration (1) that the majority of endocytosis occurs near AZs, particularly at a conventional fast chemical synapse, and (2) that endocytosis near AZs is clathrin-dependent (and not, for example, kiss and run). Thus our results support the argument that regeneration of transmitter vesicles relies exclusively on clathrin (Heuser, 1989; Takei et al., 1996).
Although endocytosis was associated with active zones at high levels of significance, the converse did not appear to be true. As can be seen in the example of Figure 5C, some regions of the rendered presynaptic membrane contained AZs, but no LVs. Presumably these AZs were silent, or nearly so, during the brief stimulation. If so, release probability varied among AZs as it apparently does at the frog neuromuscular junction (NMJ; see Zefirov et al., 1995). Alternatively, some AZs might have appeared silent because relatively few stimuli were delivered. We also emphasize that a significant fraction of LVs (9%) and of coated pits (14%) was found within 300 nm of the Schwann cell side of the bouton membrane. These vesicles represent a population endocytosed far from AZs that might increase and perhaps even dominate with more prolonged stimulation, consistent with previous observations at the frog NMJ (Heuser, 1989). Alternatively, exocytosis might have occurred at these sites, perhaps in some regulatory role (Robitaille, 1998). This scenario would support the principle of endocytosis near release sites generally.
In addition to coated vesicles, three types of endosomal structures were seen. The first type was free of reaction product, indicating that a reserve of membrane already was internalized in the terminal before stimulation. Second, additional endosomes contained reaction product and therefore were formed during or just after stimulation. Finally, deep invaginations of the plasma membrane were seen, usually near AZs. When rendered in three dimensions, these putative incipient macropinosomes resembled in their complex shape the other classes of endosomes, excepting that their lumens were continuous with the extracellular space. Another similarity among all three structures was that each exhibited clathrin-mediated budding. These common features suggest that the fully internalized endosomes were formed from membrane invaginations by macropinocytosis (see also Heuser, 1989; Takei et al., 1996) (for review, see De Camilli and Takei, 1996), and not by fusion of vesicles (Heuser and Reese, 1973).
We found previously (Teng et al., 1999) that putative endosomes seen at light level formed only after vesicular endocytosis had already begun, and then only when a sufficient number of stimuli were delivered. We now can identify this secondary endocytic pathway with macropinocytosis. Thus the vertebrate NMJ exhibits two endocytic modes, as do goldfish bipolar terminals (von Gersdorff and Matthews, 1994) and motor terminals of Drosophila shibire (Koenig and Ikeda, 1996). We therefore propose a general model in which clathrin-mediated budding from the plasma membrane is used at low levels of activity, with macropinocytosis reserved for bursting or prolonged activity when larger areas of membrane must be recycled quickly. Deep membrane invaginations evidently participate in both schemes—by clathrin-mediated budding from their tips and by fission (macropinocytosis) from the plasma membrane. The fact that endosomes and membrane invaginations were seen to be budding after only 150 stimuli argues that macropinocytosis at the NMJ is recruited rapidly, perhaps in anticipation of sustained activity. Clathrin-mediated budding of individual vesicles also might expand away from AZs and into the margins with increased activity (Heuser, 1989), which was not studied.
Although we have visualized light-level hot spots (putative vesicle clusters) with stimulation at room temperature (Teng et al., 1999), it should be noted that the relative contributions of clathrin-mediated endocytosis and macropinocytosis probably were influenced by our deliberate use of low temperature. Clathrin-mediated endocytosis in mouse fibroblasts is slowed only slightly below 15°C, but the ability of vesicles to shed their clathrin coat is arrested almost totally (Illinger et al., 1991). Snake nerve terminals may behave similarly, because all of the labeled vesicles that were seen were still coated. Blockade of decoating by temperature decrease might have shifted the equilibrium between endocytic pathways toward macropinocytosis. It would be interesting to learn whether this is an adaptation of reptilian synapses, which necessarily function at lower temperatures than those of mammals.
Why endocytosis occurs near AZs is unknown, but the scheme provides several potential advantages. First, matching of endo- and exocytosis might be achieved more rapidly (or more precisely) by several short-range interactions limited to AZ microdomains (e.g., via Ca2+ signaling) than by global signaling throughout the bouton. Second, removal of membrane exactly where it is added, if properly regulated, could ensure that the AZ remains fixed relative to the postjunctional fold without stress on putative cell-to-cell structural anchors (Marques et al., 2000). Third, vesicular membrane proteins could remain separate from those in the plasma membrane if they were recycled quite near (and soon after) exocytosis. Thus the need for protein sorting might be reduced (seeRoos and Kelly, 1999). Last, proximity of exo- and endocytic “active zones” permits local cycling pools (Kuromi and Kidokoro, 1998). With this arrangement a fraction of vesicles released at a particular AZ could be refilled for immediate use at the same AZ, without the need to enter the reserve pool. Alternatively, the clusters of internalized vesicles might mark entry points for transport to the reserve pool by as yet unidentified motors. Further experiments—aimed at determining how the endocytic machinery is localized as well as the fate of endocytosed structures at later time points—are in progress to investigate these various possibilities.
Footnotes
This work was supported by United States Public Health Service Grant NS-24752. We thank J. Cole and J. Heuser for helpful discussions, P. Bridgman and G. Phillips for help with electron microscopy, D. Bishop for help with three-dimensional rendering, and K. Schechtman for help with statistics.
Correspondence should be addressed to Dr. Robert S. Wilkinson, Department of Cell Biology and Physiology, Washington University School of Medicine, Box 8228, 660 South Euclid Avenue, St. Louis, MO 63110. E-mail: wilk@cellbio.wustl.edu.
REFERENCES
- 1.Ales E, Tabares L, Poyato JM, Valero V, Lindau M, de Toledo GA. High calcium concentrations shift the mode of exocytosis to the kiss-and-run mechanism. Nat Cell Biol. 1999;1:40–44. doi: 10.1038/9012. [DOI] [PubMed] [Google Scholar]
- 2.Angleson JK, Betz WJ. Monitoring secretion in real time: capacitance, amperometry, and fluorescence compared. Trends Neurosci. 1997;20:281–287. doi: 10.1016/s0166-2236(97)01083-7. [DOI] [PubMed] [Google Scholar]
- 3.Ceccarelli B, Hurlbut WP, Mauro A. Turnover of transmitter and synaptic vesicles at the frog neuromuscular junction. J Cell Biol. 1973;57:499–524. doi: 10.1083/jcb.57.2.499. [DOI] [PMC free article] [PubMed] [Google Scholar]
- 4.Ceccarelli B, Grohovaz F, Hurlbut WP, Iezzi N. Freeze-fracture studies of frog neuromuscular junctions during intense release of neurotransmitter. II. Effects of electrical stimulation and high potassium. J Cell Biol. 1979;81:178–192. doi: 10.1083/jcb.81.1.178. [DOI] [PMC free article] [PubMed] [Google Scholar]
- 5.Couteaux R, Pecot-Dechavassine M. Vesicles synaptiques et poches au niveau des “zones activies” de la jonction neuromusculaire. Comptes Rend Acad Sci Hebd Seances D (Paris) 1970;271:2346–2349. [PubMed] [Google Scholar]
- 6.Couteaux R, Pecot-Dechavassine M. Les zones specialisees des membranes presynaptique. Comptes Rend Acad Sci Hebd Seances D (Paris) 1974;280:299–301. [PubMed] [Google Scholar]
- 7.Daly C, Sugimori M, Moreira JE, Ziff EB, Llin↔ s R. Synaptophysin regulates clathrin-independent endocytosis of synaptic vesicles. Proc Natl Acad Sci USA. 2000;97:6120–6125. doi: 10.1073/pnas.97.11.6120. [DOI] [PMC free article] [PubMed] [Google Scholar]
- 8.De Camilli P, Takei K. Molecular mechanisms in synaptic vesicle endocytosis and recycling. Neuron. 1996;16:481–486. doi: 10.1016/s0896-6273(00)80068-9. [DOI] [PubMed] [Google Scholar]
- 9.Fesce R, Grohovaz F, Valtorta F, Meldolessi J. Neurotransmitter release: fusion or “kiss and run”? Trends Cell Biol. 1994;4:1–4. doi: 10.1016/0962-8924(94)90025-6. [DOI] [PubMed] [Google Scholar]
- 10.Harata N, Buchanan J, Tsien RW. Visualization of endocytosed synaptic vesicles in hippocampal neurons. Soc Neurosci Abstr. 1998;24:77. [Google Scholar]
- 11.Heuser J. The role of coated vesicles in recycling of synaptic vesicle membrane. Cell Biol Int Rep. 1989;13:1063–1989. doi: 10.1016/0309-1651(89)90020-9. [DOI] [PubMed] [Google Scholar]
- 12.Heuser JE, Miledi R. Effect of lanthanum ions on function and structure of frog neuromuscular junctions. Proc R Soc Lond [Biol] 1971;179:247–278. doi: 10.1098/rspb.1971.0096. [DOI] [PubMed] [Google Scholar]
- 13.Heuser JE, Reese TS. Evidence for recycling of synaptic vesicle membrane during transmitter release at the frog neuromuscular junction. J Cell Biol. 1973;57:315–344. doi: 10.1083/jcb.57.2.315. [DOI] [PMC free article] [PubMed] [Google Scholar]
- 14.Illinger D, Poindron P, Kuhry J-G. Fluid phase endocytosis investigated by fluorescence with trimethylamino-diphenylhexatriene in L929 cells: the influence of temperature and of cytoskeleton depolymerizing drugs. Biol Cell. 1991;73:131–138. doi: 10.1016/0248-4900(91)90095-5. [DOI] [PubMed] [Google Scholar]
- 15.Kadota T, Mizote M, Kadota K. Dynamics of presynaptic endosomes produced during transmitter release. J Electron Microsc (Tokyo) 1994;43:62–71. [PubMed] [Google Scholar]
- 16.Koenig JH, Ikeda K. Synaptic vesicles have two distinct recycling pathways. J Cell Biol. 1996;135:797–808. doi: 10.1083/jcb.135.3.797. [DOI] [PMC free article] [PubMed] [Google Scholar]
- 17.Koenig JH, Ikeda K. Contribution of active zone subpopulation of vesicles to evoked and spontaneous release. J Neurophysiol. 1999;81:1495–1505. doi: 10.1152/jn.1999.81.4.1495. [DOI] [PubMed] [Google Scholar]
- 18.Koenig JH, Yamaoka K, Ikeda K. Omega images at the active zone may be endocytotic rather than exocytotic: implications for the vesicle hypothesis of transmitter release. Proc Natl Acad Sci USA. 1998;95:12677–12682. doi: 10.1073/pnas.95.21.12677. [DOI] [PMC free article] [PubMed] [Google Scholar]
- 19.Kuromi H, Kidokoro Y. Two distinct pools of synaptic vesicles in single presynaptic boutons in a temperature-sensitive Drosophila mutant, shibire. Neuron. 1998;20:917–925. doi: 10.1016/s0896-6273(00)80473-0. [DOI] [PubMed] [Google Scholar]
- 20.Kuromi H, Kidokoro Y. The optically determined size of exo/endo cycling vesicle pool correlates with the quantal content at the neuromuscular junction of Drosophila larvae. J Neurosci. 1999;19:1557–1565. doi: 10.1523/JNEUROSCI.19-05-01557.1999. [DOI] [PMC free article] [PubMed] [Google Scholar]
- 21.Marques MJ, Conchello JA, Lichtman JW. From plaque to pretzel: fold formation and acetylcholine receptor loss at the developing neuromuscular junction. J Neurosci. 2000;20:3663–3675. doi: 10.1523/JNEUROSCI.20-10-03663.2000. [DOI] [PMC free article] [PubMed] [Google Scholar]
- 22.Matthews G. Synaptic exocytosis and endocytosis: capacitance measurements. Curr Opin Neurobiol. 1996;6:358–364. doi: 10.1016/s0959-4388(96)80120-6. [DOI] [PubMed] [Google Scholar]
- 23.Robitaille R. Modulation of synaptic efficacy and synaptic depression by glia at the frog neuromuscular junction. Neuron. 1998;21:847–855. doi: 10.1016/s0896-6273(00)80600-5. [DOI] [PubMed] [Google Scholar]
- 24.Roos J, Kelly RB. The endocytic machinery in nerve terminals surrounds sites of exocytosis. Curr Biol. 1999;9:1411–1414. doi: 10.1016/s0960-9822(00)80087-1. [DOI] [PubMed] [Google Scholar]
- 25.Smith CB, Betz WJ. Simultaneous independent measurement of endocytosis and exocytosis. Nature. 1996;380:531–534. doi: 10.1038/380531a0. [DOI] [PubMed] [Google Scholar]
- 26.Takei K, Mundigl O, Daniell L, De Camilli P. The synaptic vesicle cycle: a single vesicle budding step involving clathrin and dynamin. J Cell Biol. 1996;133:1237–1250. doi: 10.1083/jcb.133.6.1237. [DOI] [PMC free article] [PubMed] [Google Scholar]
- 27.Teng H, Wilkinson RS. Recently endocytosed vesicles cluster at discrete hot spots in snake neuromuscular boutons. Soc Neurosci Abstr. 1999;25:473. [Google Scholar]
- 28.Teng H, Cole JC, Roberts RL, Wilkinson RS. Endocytic active zones: hot spots for endocytosis in vertebrate neuromuscular terminals. J Neurosci. 1999;19:4855–4866. doi: 10.1523/JNEUROSCI.19-12-04855.1999. [DOI] [PMC free article] [PubMed] [Google Scholar]
- 29.von Gersdorff H, Matthews G. Inhibition of endocytosis by elevated internal calcium in a synaptic terminal. Nature. 1994;370:652–655. doi: 10.1038/370652a0. [DOI] [PubMed] [Google Scholar]
- 30.Walrond JP, Reese TS. Structure of axon terminals and active zones at synapses on lizard twitch and tonic muscle fibers. J Neurosci. 1985;5:1118–1131. doi: 10.1523/JNEUROSCI.05-05-01118.1985. [DOI] [PMC free article] [PubMed] [Google Scholar]
- 31.Wilkinson RS, Lichtman JW. Regular alternation of fiber types in the transversus abdominis muscle of the garter snake. J Neurosci. 1985;5:2979–2988. doi: 10.1523/JNEUROSCI.05-11-02979.1985. [DOI] [PMC free article] [PubMed] [Google Scholar]
- 32.Wilkinson RS, Nemeth PM. Metabolic fiber types of snake transversus abdominis muscle. Am J Physiol. 1989;256:C1176–C1183. doi: 10.1152/ajpcell.1989.256.6.C1176. [DOI] [PubMed] [Google Scholar]
- 33.Wilkinson RS, Son Y-J, Lunin SD. Release properties of isolated neuromuscular boutons of the garter snake. J Physiol (Lond) 1996;495:503–514. doi: 10.1113/jphysiol.1996.sp021610. [DOI] [PMC free article] [PubMed] [Google Scholar]
- 34.Zefirov A, Benish T, Fatkullin N, Cheranov S, Khazipov R. Localization of active zones. Nature. 1995;376:393–394. doi: 10.1038/376393b0. [DOI] [PubMed] [Google Scholar]