

Abstract
The visual system uses information about the relative depth of contours and surfaces to link and segment elements of visual scenes. The integration of form and depth information was studied in areas V1 and V2 of the alert macaque. Neurons in area V2 used contextual depth information to integrate occluded contours, signal the presence of object boundaries, and segment surfaces: (1) Amodal contour completion occurs when a contour passes behind an occluder. The basis of contour completion, the facilitation of neuronal responses to stimuli located within their receptive fields (RFs) by contextual lines lying outside their RFs, was blocked by orthogonal lines intersecting the contours but was recovered when the orthogonal line was placed in the near depth plane. (2) An illusory contour will modally complete separated elements located across an isoluminant field if the elements are placed in the near depth plane. V2 neurons responded when line segments were placed outside the RF in the near depth plane and a field of uniform luminance covered the RF. (3) Texture elements within a surface will “capture” the perceived depth consistent with the disparity of the surface's boundary, even when given no disparity themselves. V2 neurons responded to the center elements of a grating as if they contained disparity, even though disparity was present only for the grating's end elements located beyond the RF borders. These results, which were more common in V2 than in V1, demonstrate a role for V2 in the three-dimensional representation of surfaces in space.
Keywords: stereopsis, surface segmentation, contour integration, intermediate level vision, amodal completion, model completion, disparity capture
Between the analysis of local stimulus attributes, such as edge orientation and contrast, and the recognition of complex objects, such as faces, lies an intermediate stage of vision involving contour integration and surface segmentation (Nakayama et al., 1995). Segmenting natural visual scenes into surfaces belonging to different objects can be particularly challenging when contours intersect or when near surfaces are partially occluded by objects located closer to the observer. A potential source for a solution to this challenge is depth information, which can be used to link spatially separated surfaces that belong to a single partially occluded object (amodal completion) and to link contours that may be incomplete (modal completion) (Nakayama et al., 1995; Nakayama, 1996) (Fig. 1). In this process, depth cues must be propagated from one part of the visual scene to another.
Fig. 1.

Depth information, in the form of stimulus disparity, dictates how these ambiguous figures are interpreted.A–C, Stereograms of two ambiguous figures result in dramatic shifts of illusory contours and surface boundaries depending on the sign of the disparity. If the left andcenterimages in A are separately presented to the left and right eyes, respectively, a set of contours will be seen as in the diagram in B. If disparity is reversed by similarly fusing the center andrightimages, the contours will appear as in the diagram in C. If crossed disparity is given to the outer edges of the horizontally oriented shape, then it is perceived to appear in front of the plane of fixation and to occlude partially the vertically oriented shape located behind it (shading added for emphasis). Note that this requires the generation of illusory contours to bound the nearer object, as well as the linking of the two separated shapes behind the horizontal object into a single, unified vertical shape. Simply reversing the disparity of the edges results in a dramatic change in the percept; the vertical shape is now seen in front of the horizontal shape. This change in local disparity information forced a relocation of the illusory contours so that they now bounded the vertical shape in front (adapted from Nakayama et al., 1995).
Local depth information is encoded by disparity-selective neurons. These neurons are sensitive to the small difference in the projections of stimuli lying in different depth planes onto the two retinas because of the horizontal displacement of the eyes (Wheatstone, 1838, 1852;Julesz, 1960; Barlow et al., 1967; Nikara et al., 1968; Hubel and Wiesel, 1970). Neurons in cat and monkey that are selective to stimulus depth have been classified according to the range of disparity values to which they respond; Far neurons respond to stimuli located beyond the plane of fixation, whereas Near neurons prefer stimuli located in front of the plane of fixation [cat (Barlow et al., 1967; Pettigrew et al., 1968; Bishop, 1970, 1973, 1974; Blakemore, 1970; Joshua and Bishop, 1970; Hubel and Wiesel, 1973; Pettigrew, 1973;Ferster, 1981; Freeman and Ohzawa, 1990); monkey (Hubel and Wiesel, 1970; Poggio and Fischer, 1977; Poggio and Talbot, 1981; Poggio et al., 1988; Poggio, 1995; Prince et al., 2000)].
To use depth cues in contour integration, cells must integrate information about depth and form and be sensitive to global depth cues. Information about depth in one part of the visual scene has to propagate to other parts of the scene and influence the perception of the form of distance features. In this regard, it is known that the responses of cells are strongly modulated by the context within which local features are embedded in two-dimensional space, enabling integration of information over large parts of the visual field (Maffei and Fiorentini, 1976; Allman et al., 1985; Nelson and Frost, 1985;Gilbert and Wiesel, 1990; Kapadia et al., 1995, 1999; Zipser et al., 1996). In this study, we have explored the sensitivity of cells to global depth information, in particular, to determine whether this sensitivity is consonant with the perceptual effects of modal and amodal completion and of depth capture.
The contribution of depth information to contour integration and surface segmentation was studied by manipulating contextual depth information outside of the neurons' classical receptive field (RF). We show the sensitivity of cortical cells to partially occluded contours, to illusory contours generated only by depth cues, and to texture elements whose depth is determined only by distant contextual depth cues.
MATERIALS AND METHODS
The experiments were performed with two adult male macaque monkeys (Macaca mulatta) weighing 5.2 and 3.4 kg, respectively. All procedures followed National Institutes of Health approved guidelines on the care and use of laboratory animals. Animals were anesthetized with sodium pentobarbital and underwent an initial surgery. Scleral search coils were implanted in both eyes (Judge et al., 1980), recording chambers were positioned over the opercular surface to include cortical areas V1 and V2, and a head post was implanted in the skull. After recovery, the animals were placed on a fluid-restricted diet. During this phase of the experiment, they would receive their fluid-intake allotments during the daily neurophysiological recording sessions.
To receive their fluid rewards, the animals were trained to detect a change in the luminosity of a small target presented on a cathode-ray tube (CRT). During a recording session, the animal was seated comfortably in a primate chair with its head fixed. Pulling a lever attached to the primate chair initiated a trial. A 0.1° square target appeared on a 30 × 40 cm CRT monitor placed 140 cm in front of the animal. The animal had to establish and maintain binocular eye fixation within 0.5° radius of the target for the trial to continue. Actual target fixation performance was within 0.1° as measured with a scleral search coil system (CNC Engineering). After a variable time interval (1.0–6.0 sec), the target dimmed, and releasing the lever within 750 msec resulted in the delivery of several drops of water. Failure to maintain binocular fixation ended the trial immediately without reward. Animals were allowed to continue for as long as they were willing to work. Training sessions typically lasted 3–4 hr, with the animals performing correctly on ∼80–85% of the ∼1000–1300 trials performed during the session and consuming 120–150 ml of water. Animals received unlimited access to water during weekends, and food was available ad libitum. All stimulus presentations, eye position monitoring, and reward contingencies were controlled by a Pentium-based personal computer (PC) with in-house software.
Binocular stimuli were presented on a standard CRT placed behind a liquid crystal-modulated polarizing filter (NuVision Technologies) that alternated states in synchronization with the monitor's frame rate. A pair of opposed circularly polarized lenses that matched the two states of the liquid crystal-modulated polarizing filter was placed directly in front of the subject's eyes. Stimuli were generated on a CRT monitor (Nanao Flexscan F2-21; 460 by 512 pixels; 60 Hz refresh rate) through a Univision Piranha PC-based graphics card using in-house-written proprietary software (STIM). Disparity was limited to the horizontal direction only; the stereo stimuli were generated by alternating the horizontal location of the stimulus slightly in alternate frames. Because no polarizing filter system is 100% effective in preventing stimulus leakage through the “closed” shutter, it is possible for cells to respond to the ghost stimulus, rather than the intended stimulus. To avoid activating cells by the ghost image in the closed state of the liquid crystal shutters, we chose a luminance level that would be well below the threshold of cells when projected through the closed shutter but would elicit a brisk response when projected through the open shutter. The luminance–response curves of a large number of superficial layer cortical neurons were measured, and we selected a luminance value appropriate for meeting the above criteria. The level chosen resulted in a stimulus luminance of 1.51 cd/m2against a uniform background of 0.23 cd/m2when viewed through the open shutter (both measured by a Minolta Luminance Meter LS-110 viewing the CRT through the circular polarized lenses and the liquid crystal-modulated polarizing filter). An effective 10-to-1 rejection ratio in the polarizing filter system led to a ghost stimulus luminance of only 10% of the original luminance value when the stimulus was viewed during the out-of-phase state.
Neural recordings were made in three hemispheres. A craniotomy was made over the V1–V2 border, and a small fiberglass recording chamber was affixed to the skull after the animal's initial acquisition of the behavioral task. Penetrations were made through the dura mater with glass-coated Pt-Ir microelectrodes (Wolbarsht et al., 1960) (FHC, Inc) with typical impedance between 1.0 and 3.0 mΩ at 1 kHz. Electrodes were driven by the use of a stepping motor microdrive (Narishige MO-951). Successive penetrations were positioned ∼0.5 mm apart.
Neuronal activity was amplified, filtered (model 1800; A-M Systems), and passed into a time-amplitude window discriminator (Tucker Davis Technologies) before being displayed on a digital storage oscilloscope (Tektronix). Individual spike times of window discriminator output pulses were stored and sorted on-line according to stimulus condition by the use of proprietary software (HIST) on a Pentium-based PC. On-line analysis was limited to peristimulus time histograms and rasters. Statistical analysis was completed off-line.
Activity was sampled at a single site during each recording session. Recordings were targeted for the upper layers of either V1 or V2, and recording depths varied from 150 to 650 μm. After isolation of a single neuron, the RF size, length tuning, orientation tuning, direction preference, ocular dominance, and disparity selectivity were measured. The eccentricity of RF positions ranged from 3 to 6°.
During a single fixation trial, the animal received 1–5 stimulus presentations. Stimuli were presented in a random manner until 5–10 presentations of each condition were completed. Recordings were collected for 600–800 msec; this included a 200 msec preperiod with no visual stimulation, the stimulus presentation period, and a 200 msec poststimulus period. If the animal's fixation deviated beyond the small fixation window at any time during the trial, the trial was aborted, and the recorded activity from that trial was discarded.
Because vergence movements may occur when presenting stimuli located in depth, it is important to show that the animal was maintaining steady vergence on the plane of fixation and not changing his vergence in response to the target or contextual stimuli presented. Vergence measurements were calculated off-line for time epochs before, during, and after stimulus presentation. Neither subject in this study made stimulus-induced vergence movements that correlated with stimulus disparity (Fig. 2B,filled circles). However, when the fixation point was moved in depth, vergence movements were recorded (Fig. 2B,open squares). Therefore, we conclude that during the presentation of stimuli containing contextual depth information, when the animal was maintaining fixation on the fixation point, the animal did not make vergence movements driven by the contextual depth information, and therefore, we are confident that our contextual stimuli remained outside of the cell's classical RF and that they did not evoke a neural response that was caused by the simple shifting of the stimulus to within the neuron's core RF after a vergence movement.
Fig. 2.
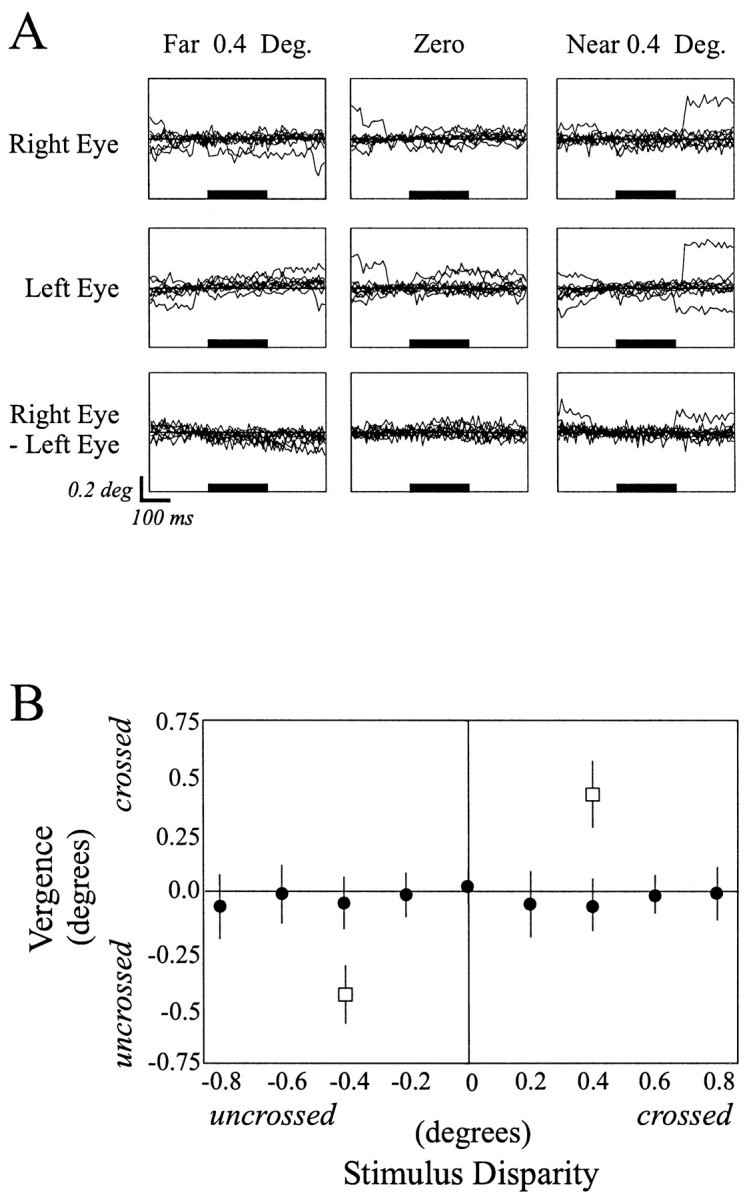
A, Individual eyetraces indicating the horizontal eye positions of the right (top row) and the left (middle row)eyes obtained while the animal maintained fixation during presentation of a disparity capture grating located at 4° eccentricity which was given uncrossed (left column), zero(middle column), or crossed (right column) disparity. The solid horizontal barindicates the onset and duration of the stimulus presented in the near periphery. Note that stimulus onset did not result in any systematic shifts in eye position during stimulus presentation. The bottom row is eye vergence, or the difference in the eye position.B, Averaged horizontal eye position during 10 presentations each of nine disparities given to a single bar presented in the near periphery while the animal maintained eye fixation on a central fixation point. Note that vergence did not vary with the depth of the peripheral stimulus (filled circles). Moving the fixation point in depth did result in corresponding changes in eye vergence (open squares).
Spikes occurring within the 200 msec preperiod were used to calculate the background firing rate of the cell. The magnitude of any stimulus-driven activity was represented by the mean firing rate during stimulus presentation minus the rate of background activity. The time window of the response was adjusted individually for each cell within the range of 100–250 msec after stimulus onset, depending on the latency and the duration of the cell's response profile. Latency was measured from stimulus onset to the first bin containing activity greater than the average background spike rate obtained during the prestimulus period.
RESULTS
In these experiments contextual disparity information was manipulated for features lying outside of the recorded neuron's classical RF. We defined the classical RF by measuring the minimum response field using a single, small line segment. All contextual stimuli were placed beyond RF borders determined by the outer edges of stimulus positions that elicited the smallest significant increase above background firing levels. In other words, we tried to ensure that presentation of the contextual stimuli alone did not elicit responses from the recorded neurons. However, the contextual stimuli were capable of strongly modulating the responses of the neurons to target stimuli placed within the neuron's classical RF.
Recordings were made from both areas V1 and V2, the boundary being determined by the visuotopic maps obtained by a series of electrode penetrations. The signature of a transition from V1 to V2 was the reversal in the progression of receptive fields toward and away from the midline and an increase in their size (Fig.3A,B). This boundary correlated well with cell selectivity for stimulus direction and for disparity (Fig. 3C,D). Basic RF characteristics were obtained from 94 cells in area V1 and 115 cells in area V2, obtained from three hemispheres in two macaque monkeys. After analyzing the cells' local receptive field properties, we then explored their sensitivity to global disparity cues. We were able to characterize the response of 76 V1 cells and 97 V2 cells to at least one of the experimental stimulus programs containing global stereopsis cues.
Fig. 3.

Physiologically defined visual maps. RF maps from each hemisphere were constructed that enabled the location of the V1 and V2 borders to be estimated. A, The reversal in visual field positions of RFs recorded from neurons establishes the location of the border between V1 and V2. Here, a map from the left hemisphere of one monkey is shown. Bold numbers indicate elevation (−4 to −7°), and italicizednumbers indicate azimuth (3, 2, 1, 0, 1, and 2°). B—D, A local clustering of larger RF sizes (B), greater direction preferences (C), and greater degrees of disparity modulation (D) suggest the possible location of a putative thick stripe. In the three maps of physiological properties shown, the larger the filledcircle, the larger the relative magnitude of the measured characteristic. We generated these maps by normalizing the magnitude of the recorded characteristic according to the minimum and maximum values obtained for each property. RF sizes ranged from 0.14 to 3.6 square degrees. Direction preference was the spike rate obtained in response to a stimulus of optimal orientation and size moving in the preferred direction divided by that obtained in response to the same stimulus moving in the opposite direction. This ratio ranged from 1 to 12.17. The disparity modulation ratio was calculated by dividing the spike rate obtained in response to a stimulus of optimal orientation, size, and disparity by the spike rate obtained in response to a stimulus of the same amount of disparity but different phase relationship (i.e., if the cell preferred a near stimulus of 1°, the response of the cell to the near 1° stimulus was divided by the response of the cell to a stimulus given 1° of far disparity). This ratio ranged from 1 to 35.4. Dashed line indicates V1/V2 border.
Contour integration: amodal completion
The responses of cells in V1 have been shown to be as dependent on the global characteristics of contours extending far beyond the minimum response field as they are on the local characteristics of line elements within the receptive field core (Kapadia et al., 1995, 1999). The response of a cell to a line within the receptive field can be as much as tripled by adding a colinear line outside the receptive field (Fig. 4B). This observation correlates with experiments on line detection, which can be performed at a much lower contrast when the target line is presented along with a colinear flanking line separated by a small gap (Dresp, 1993; Field et al., 1993; Polat and Sagi, 1994; Kapadia et al., 1995). It has been suggested that these neural and psychophysical observations are related to the perceptual linkage of line elements within an extended contour (Fig. 4A), in part because the insertion of an orthogonal line between the lines inside and outside of the receptive field blocks both the facilitatory effects on neuronal response rates and the brightness-induced perceptual effect (Kapadia et al., 1995) (Fig. 4B).
Fig. 4.

Flank facilitation signals stimulus contours.A, It is easier to detect a continuous contour composed of individual elements as the number of component elements increases.B, Adding colinear flanking lines outsideof the RF (dashed line-outlined square) core increases, or facilitates, the response of the neuron to a target stimulus locatedinside of the cell's RF. However, interrupting the path of the smooth contour by inserting a bar oriented orthogonal to the path of the contour blocks the flank-induced neural facilitation (adapted from Kapadia et al., 1995). In this, and all other quantified response plots, the response rate [spikes/second (s/s)] of the neuron is plotted on they-axis. C, Quantified responses recorded from a V2 neuron that exhibited flank facilitation are shown. Placing the orthogonal bar either in the same plane as the flank and target stimulus or in the far depth plane (0.16° uncrossed disparity) blocked the flank-induced facilitation of the neural response to the target stimulus. However, when the orthogonal bar was placed in the near depth plane (0.16° crossed disparity; arrow), the flank facilitated the neuron's response to the target stimulus, suggesting that flank facilitation can signal contours even when they are partially occluded. Fix refers to plane of fixation; dot in diagram at left is fixation plane.
On the basis of the idea that flank facilitation contributes to contour integration, we wished to determine how flank facilitation might be affected by occlusion. Objects located closer to the observer partially occlude more distant objects, yet contours belonging to the distant objects are perceived as continuous rather than separate edges. If flank facilitation is a signal for a continuity between contour elements, then one might suppose that it is maintained under circumstances that indicate occlusion but is diminished under those that indicate that the separated colinear line segments belong to distinct objects. Presenting the orthogonal segment closer to the observer than the colinear segments (by giving the orthogonal bar crossed disparity) would be consistent with partial occlusion of a single, unitary line segment. Presenting the orthogonal bar farther from the observer than the colinear segments (by giving the orthogonal bar uncrossed disparity), on the other hand, would result in the colinear line segments being perceived as discreet objects. We therefore tested the effect of varying the disparity of the orthogonal bar on flank facilitation (Fig. 4C).
As illustrated in Figure 4B, placing a flank outside of the RF core produced a marked facilitation in the response of this V2 cell to the preferred stimulus within the RF. The flank presented alone did not drive the cell. The orthogonal line segment blocked the facilitation when placed in the plane of fixation or behind the plane of fixation, situations that interrupted the linkage of the contour elements. However, the facilitation was preserved when the orthogonal bar was given near disparity and appeared to occlude a continuous contour behind it (Fig. 4C, arrow).
To measure the effect of moving the orthogonal bar in depth on the facilitation observed, we calculated the amount of facilitation that occurred in the presence of an orthogonal line segment for each of the three disparity conditions (orthogonal bar given crossed, zero, or uncrossed disparity):
Values >100% indicate that facilitation was preserved in the presence of an orthogonal line segment. Values <100% indicate that the addition of the orthogonal bar reduced the response of the neuron to a level less than its response to presentation of the target and flank together.
Flank facilitation was defined to occur when the response to the stimulus and the flank was at least 20% greater than the response observed to the target alone. This occurred in 17 of 39 (44%) V1 cells and 26 of 68 (38%) V2 cells tested. Of these, placing an orthogonal bar in the same depth plane as the target and flank stimuli blocked facilitation (facilitation < 20%) in 11 (65%) V1 cells and 19 (73%) V2 cells. These 30 cells became the data set used to investigate the effect that moving the orthogonal bar in depth might have on flank facilitation.
To compare the amount of facilitation that occurred when the orthogonal bar was in front of versus behind the plane of the target and flanking stimuli, we plotted the normalized response of each cell for the two conditions versus the amount of driving obtained when the orthogonal bar was presented in the same plane as the target and the flank. Moving the orthogonal bar in front of the plane of the target and flank stimuli resulted in facilitation in only 1 (9%) V1 cell (Fig.5A, filled diamonds) but in 8 (42%) V2 cells (Fig. 5B, filled diamonds). Moving the orthogonal bar behind the plane of the target and flank stimuli never resulted in facilitation of the neuronal response (Fig. 5, open diamonds). Thus, facilitation could be preserved when the orthogonal segment was given crossed disparity (e.g., appeared in front of the flank) and therefore was occluding the colinear target and flank, but was blocked when the orthogonal segment was behind the plane of fixation. This finding is consistent with flank facilitation signaling an occluded, but continuous, contour belonging to a single object.
Fig. 5.

Amount of facilitation produced by a contextual flank in the presence of an orthogonal bar as a function of the disparity of the orthogonal bar for cells in V1 (A)and V2 (B). The x-axis indicates the response of the cell in the presence of an orthogonal bar located in the same depth plane as the target and the flanking line. As observed previously, an orthogonal bar in the same depth plane as the target and flank blocks flank-induced facilitation; responses of most cells to the combined stimulus of a target and a flank were within 20% of the cell's response to the target alone, indicating that little facilitation was observed in this condition. To determine whether flank facilitation might recover during stimulus conditions analogous to occlusion, the depth of the orthogonal bar was varied. Quantified responses of neurons to near and far presentations of the orthogonal bar in conjunction with a target and a flanking line are plotted on they-axis. Data at or belowthe diagonal indicate that the orthogonal bar given disparity continued to block flank-induced facilitation. Dataabove the diagonal indicate that the orthogonal bar no longer blocked flank-induced facilitation. Thus, for each cell exhibiting flank-induced facilitation that was blocked by an orthogonal bar, we plotted two points: the facilitation observed with the orthogonal line in the near depth plane (filled diamonds) and the facilitation with the orthogonal line in the far depth plane (open diamonds). Facilitation was preserved in one V1 cell (left) and eight V2 cells (right) when the orthogonal bar was placed in the near plane (filled diamonds). No facilitation was observed when the orthogonal bar was placed in the far plane in V1 or V2(open diamonds).
Depth-induced illusory contours—modal completion
The Kanisza illusion illustrates how the visual system generates contours from partial information to form surface boundaries. Depth information, generated by adding disparity to the apexes of the triangle (the cutout portions of the pac-man shapes), can produce dramatic shifts in the perceived location of the illusory contours (Fig. 6A,B). We tested disparity-sensitive neurons with a simplified illusory border (Fig.6C,D). Two colinear line segments were placed beyond the borders of a large field stimulus of uniform luminosity. An illusory contour was seen between the outer line segments when they were placed in the near depth plane, appearing in front of the larger field stimulus. In contrast, when the disparity of the line segments was reversed, an illusory contour was perceived to run along the top and bottom of the large field stimulus orthogonal to the orientation of the colinear line segments. Finally, when no disparity was presented to the outer line segments, no illusory contours were perceived. By aligning the orientation of the field and colinear line segments with the orientation axis of the classical RF, it was possible to generate illusory contours that either crossed or did not cross the cell's classical RF. A key feature of this stimulus is that no disparity information and no stimulus contrast were presented within the cell's classical RF.
Fig. 6.

A, Stereogram of a Kanisza triangle that demonstrates how global disparity information dictates a surface-based interpretation and determines the location and orientation of illusory contours. B, Diagram illustrating the stereogram in A. Depending on the depth projection of the triangle, the location and orientation of the illusory contours, and the triangular surface changes.C, Stereogram of simplified illusory contour stimulus used in this experiment. Note that all visual stimuli were of equal contrast and intensity. D, Diagram of the stereogram inC. Note that disparity was only provided to thetabs that extend beyond the larger square stimulus. During the experiment, the stimulus was sized and positioned such that the large square stimulus completely covered the RF core and thetabs were placed beyond the boundaries of the RF core.
Quantified responses obtained from a V2 cell in response to contextual disparity-induced illusory contours are illustrated in Figure7. Over the range tested for this experiment, this cell showed only a slight preference for far stimuli, as indicated by the responses obtained to a single stimulus within its classical RF given disparity [Fig. 7B; over a larger disparity range, this cell would have been classified a Far cell according to Poggio (1995)]. Placing a large stimulus over the entire RF resulted in little activity from the cell (Fig. 7C). The cell did not respond when small line segments given either uncrossed or no disparity were presented in combination with the large field (Fig.7D,E). The cell responded vigorously, however, when the ends of the bars lying outside of the classical RF were presented at near disparity (Fig. 7F, right), the stimulus condition that produced a strong illusion in human observers of a bar bounded by illusory contours crossing in front of a large square. This increase in the response of the cell to the combined tab and square stimulus was nonlinear, because it was greater than the mathematical sum of the responses obtained when the tab ends were presented alone with crossed disparity (Fig. 7F, left) and the response of the neuron to the large square stimulus presented alone (Fig. 7C).
Fig. 7.

Quantified responses to illusory contour stimuli.A, The stimulus configuration used in this experiment. The dashed line-outlined square indicates the minimal RF. B, Disparity responses of a V2 cell. This cell was classified a Far cell during the initial characterization of its response to disparity over a range of values covering ±1.5°. Three disparity values from this larger range were selected for use in this experiment [0.4° far (F), zero (0), and 0.4° near (N)]. The response of the neuron to a bar stimulus given those values of disparity and of equal length to the implied bar connected by the depth-defined illusory contours is illustrated. Over this range, the neuron showed a small preference for the far stimulus.C, The large square stimulus placed over the RF core (symbolized by the dashed line-outlined square) failed to drive the neuron. Note that the size and position of the square stimulus were chosen such that the ends of the field would extend beyond the RF core boundaries. In all cases, no disparity was provided to the large square stimulus. D, Placing the tabs in the far depth plane by adding uncrossed disparity did not drive the cell, when presented either alone (left) or in combination with the large square stimulus (right).E, Placing the tabs in the plane of fixation elicited a weak response from the cell (left). However, this response was not augmented when presented in combination with the large square stimulus (right). F, Placing the tabs in the near depth plane by adding crossed disparity resulted in a weak response from the cell when presented alone(left). However, when presented in combination with the large square stimulus (right), there was a substantial increase in the response of the cell, indicating a response to the depth-defined illusory contours that run between the contextual tabs placed outside of the RF core.
To establish that the cell's response was caused by the presence of the depth-induced illusory contour extending across the RF, we performed two control experiments. The illusory contour, which is perceptually required to form the boundary of the nearer surface, is generated as a response to the difference in depth between the large field and the contextual line segments. Removing the relative depth step between the large field and the contextual line segments by adding equal disparity to the large field generated a percept of a cross-like surface at a uniform near depth plane and eliminated any internal illusory contours. In the absence of this relative depth step, this cell failed to respond (Fig.8H) even though it did respond to the contextual depth-induced illusory contour (Fig.8G). Because all stimuli were presented in a random manner, this implies that the cell distinguished between stimulus conditions with a near illusory contour (Fig. 8G) and those without (Fig. 8H).
Fig. 8.

Illusory contours are induced by a relative depth step. A, Stereograms and diagrams illustrate the critical control condition in this experiment. Left, The relative disparity difference between the bar ends and the large field supports the percept of an illusory contour bounding a line segment located in front of a background square. Right, Removing the depth step between the large field and the contextual bar ends by providing equal disparity to the large field eliminates the perceived illusory contour.B, The stimulus configuration used in this experiment.C, Disparity-tuning curve for a tuned Near V2 cell. The response of the neuron to a bar of equal length as a depth-defined illusory contour stimulus given 0.26° of uncrossed, zero, or crossed disparity is illustrated. Over this range, the neuron showed a strong preference for the near stimulus. D, The large square stimulus placed over the RF core failed to drive the neuron. Note that the size and position of the square stimulus were chosen such that the ends of the field would extend beyond the RF core boundaries. Except for H, no disparity was provided to the large square stimulus. E, F, Placing the tabs in the far depth plane (E) or the plane of fixation (F) by adding appropriate disparity did not drive the cell, when presented either alone (left) or in combination with the large square stimulus (right).G, Placing the tabs in the near depth plane by adding crossed disparity did not drive the cell when presented alone(left). However, when presented in combination with the large square stimulus (right), there was a substantial increase in the response of the cell, indicating a response to the depth-defined illusory contours that run between the contextual tabs placed outside of the RF core. This increase in the response of the cell to the combined tab and square stimulus was nonlinear, because it was greater than the mathematical sum of the responses obtained when the tab ends were presented alone with crossed disparity (G, left) and the response of the neuron to the large square stimulus presented alone (D). H, Additional evidence that this increase in the response of the neuron was a response to the depth-defined illusory contour that crossed the RF is presented. The cell failed to respond when the large square stimulus was presented with an equal amount of crossed disparity, thereby eliminating the relative depth step between the large field and the contextual tabs and consequently eliminating the induced illusory contour.
A second control manipulated the presence of the illusory contour by manipulating the luminance of the visual stimuli. A subtle shift in relative luminance can dramatically alter the perception of the illusory contour. By manipulating the luminance conditions of the large field stimulus and of the contextual bar ends, it is possible to generate two different visual stimuli with the same disparity relationships that do or do not contain an illusory contour (Metelli, 1974; Nakayama et al., 1990) (Fig.9A). If the luminosity of the end line segments is less than that of the intervening large field, an illusory contour extending across the field is perceived when the contextual line segments are presented in the near depth plane. If, however, the relative luminance is reversed and the end segments are darker than the intervening large field, no subjective contour is perceived, and the two end segments now appear to be distinct stimuli located in front of the large field. One configuration (Fig.9A, left, light tabsin front of a darker field) produces an illusory contour that forms the boundary of a transparent bar, whereas the other (Fig. 9A, right, dark tabs in front of alighter field) produces a percept of two separate tabs hovering in front of a larger background field. Two of the three units that demonstrated sensitivity to the Metelli color rules are illustrated in Figure 9, H, I, P, andQ.
Fig. 9.

V2 cells respond to Metelli color rules.A, Stereograms and diagrams of stimulus configurations that support the construction of illusory contours to form the boundaries of a transparent bar. The presence or absence of an illusory contour depends on the relative contrasts of the stimuli involved.Left, Presenting light tabs with crossed disparity and a darker large square supports the generation of a transparent bar (light vertical bar) bounded by illusory contours located infront of a backgroundfield. Right, On the other hand, reversing the contrast relationship generates a percept of two dark tabs hovering in front of a lighter background, with no illusory contours extending between the tabs. B—I, A V2 Far cell (stimulus orientation was 100°) that responds to the illusory contours generated either by an isoluminant stimulus configuration (F, right) or by the transparent stimulus configuration (H) in accordance with Metelli rules is shown. This cell does not respond when the relative stimulus contrast relationships do not support formation of an illusory contour. J—Q, This V2 Near cell (stimulus orientation was 40°) also responded to the illusory contour when the Metelli rules supported the formation of an illusory contour (N, P) but failed to show an enhanced response when the color conditions violated the Metelli rules (Q). Other figure conventions are as described in Figures 7 and 8.
Thus, neurons in V2 appear to respond to the subjective contour induced by contextual disparity cues, as indicated by the strong responses recorded when the contextual end segments were presented in the near depth plane (Fig. 10, filled circles) and the lack of such responses when the end segments were presented either in or behind the plane of fixation (Fig. 10,open triangles, x's, respectively), conditions that do not generate illusory contours. When a neuron responded to the modally completed stimulus, the magnitude of its response was greater than the simple summation of the cell's responses to the individually presented component stimuli (Fig. 10). Eleven of 35 (31%) disparity-sensitive cells tested in V2 signaled modal completion, i.e., completion of a surface bounded by illusory contours in front of the larger background field. In contrast, only 1 of 13 (8%) cells in V1 responded to contextual line segments given crossed disparity. Interestingly, there was no relationship between the disparity tuning of the cell and the signaling of modal completion. As shown in Figures 7B, 8C, and 9, B andJ, both tuned Far and tuned Near cells could signal modal completion (the breakdown of disparity types that responded to a modally completed stimulus was two Far, one tuned Far, two tuned Zero, five tuned Near, and two Near cells). Finally, no cells in V1 or V2 exhibited modal completion in response to the stimuli used in this stimulus set (no stimulus boundary within the RF core).
Fig. 10.

V2 cells could signal modal completion. Scatter plot comparing the measured response of V2 cells to a complex stimulus consisting of a large field over the RF with zero disparity and two contextual bar ends given disparity versus the linear sum of the cell's response to the component stimuli presented in isolation. Cells respond greater than predicted when the contextual bar segments are given crossed (near; filled circles) disparity, suggesting that they can signal the existence of an illusory contour formed between the contextual bar segments. In contrast, cells do not respond with a greater firing rate than predicted when zero (triangles) or uncrossed (far;x's) disparity is added to the contextual bar segments located beyond the RF core. Note that each cell tested contributed three points to this scatter plot; one for each disparity condition.
Disparity capture
Elements in a textured surface assume the depth defined by the boundaries of the surface, a phenomenon known as the “wallpaper illusion” (Brewster, 1884; Mitchison and McKee, 1985, 1987a,b; McKee and Michison, 1988). Observing a grating of equally spaced dots will lead to the judgment of a texture at a single depth, but that depth will vary depending on the observer's trial-by-trial vergence or the disparity apparent at the edges of the gratings. Closely related to this illusion is disparity capture (Fig.11A,B) (Ramachandran and Cavanagh, 1985; Ramachandran, 1986), in which global surface or grouping issues dictate the local interpretation of stimulus depth. We designed a simplified version of this stimulus. The center line segment within a grating of equally spaced line segments will assume the depth value determined by the disparity present at the ends of the grating, even though there is a perfectly matched stereo pair element with zero disparity presented to the other eye (Fig. 11C,D). We used this illusion to probe the ability of disparity-sensitive cells in V1 and V2 to integrate contextual depth information by placing the end elements of gratings beyond the borders of the neuron's classical receptive field. The gratings were composed of line segments of preferred orientation and length, and the interelement spacing was determined by the neuron's own disparity tuning. Responses were recorded to the center-preferred stimulus alone, the entire grating, and the grating ends alone, presented at each of five disparities selected for the cell.
Fig. 11.

Global depth information can influence the perception of local stimulus depth, as illustrated by disparity capture. A, Top row, An illusory squaregenerated by pac-man-like patterns can be perceived either in front of the plane of fixation or behind the plane of fixation through four small apertures, depending on the disparity provided by the pac-man supports. Similar to Figure 1, the location and orientation of the illusory contours vary depending on the surface interpretation dictated by the disparity cues. Middle row, A texture composed of individual vertical line segments presented with zero disparity is perceived to lie on the plane of fixation. Bottom row, Disparity capture occurs when the elements within the illusory squareassume the disparity values dictated by the surface interpretation demanded by the global disparity present in the pac-man supports.B, Diagram representing the percepts obtained by fusing the stereograms in A. In the middle, individual texture elements within the illusory squareare perceived to lie on the square, infront of a background texture of similar elements. On the right, elements within the aperture are perceived to lie on the square's surface, behind a foreground texture. In both cases, however, the individual texture elements contain zero disparity and would be perceived as lying in the plane of fixation if the global disparity information present in the pac-man supports was not present (left). C, A simplified disparity capture stimulus used in this experiment. D, Diagram of stimulus geometry with respect to the neuron's RF core (dashed line-outlined squares). Note that there are perfectly matched elements within each RF core, which would suggest that those stimulus elements should be fused with zero disparity. However, stimulus elements at the end of each grating would not have a matched pair; thus there would be disparity at the ends of the grating.
Responses of a single neuron in area V2 to stimuli showing disparity capture (Fig. 12A) are presented and quantified in Figure 12B. This neuron preferred far stimuli, as indicated by the strong responses to stimuli of preferred orientation and length given uncrossed disparity (Fig. 12B, open squares). Presenting horizontally displaced gratings of iso-oriented line segments to each eye with the same disparity steps as before resulted in moderate responses from the cell (Fig. 12B,filled circles) when the gratings were given far disparity, but no response from the cell when the grating ends were given crossed, or near, disparity. Note that in both cases, the elements presented within the cell's classical RF had no disparity information, because there were matched stimulus pairs presented to each eye. Rather, in terms of pairs, disparity existed only at the ends of the gratings. However, the responses of this cell were not simply responses to the ends of the texture grating, because the cell did not respond to isolated stimuli given disparity and located in the same position as the grating ends (Fig. 12B, open triangles, dotted line). Thus, this cell responded as if the elements within its classical RF were captured to the depth plane of the elements at the end of the texture grating.
Fig. 12.

V2 cells respond to a disparity capture stimulus.A, Geometric layout of the stimulus with respect to the V2 cell's RF core. Note that the ends of the stimulus grating are located well outside of the cell's RF core. B,Quantified responses of a V2 cell during presentation of a disparity capture stimulus. Open symbols are plotted on the left-hand axis; filled symbols are plotted on the right-hand axis. Note that the cell responded to the disparity capture stimulus (filled circles) with the same response profile that it had to a single bar given disparity located in the middle of the RF core (open squares). Furthermore, note that the cell did not respond to the end lines of the gratings given disparity when presented alone (open triangles).
The response profile of a V2 Near cell is illustrated in Figure13. This cell also responded to the capture stimuli in a manner similar to its response pattern obtained for a single stimulus within its classical RF core. Note that presenting the ends of the grating alone, with the same amount of disparity, results in no significant neuronal activity, indicating that these stimuli were indeed outside of the cell's classical RF (Fig.13B, right).
Fig. 13.

A second V2 cell showing disparity capture.A, Geometric relationship of the stimulus to the RF core. B, Quantified responses of the cell to a single bar given disparity located within the RF (left), to the disparity capture grating (middle), and to the ends of the grating stimulus presented alone and given disparity(right). Note that the cell responds similarly to the single bar given disparity and to the disparity capture grating, even though the line segments located within the RF core carry no explicit disparity information for the latter stimulus. Finally, this cell did not respond when isolated stimuli were given disparity and located at the same position as the ends of the disparity capture grating.
As a whole, neurons in V2 were much more sensitive to contextual stimuli containing disparity. As illustrated in Figure14A, individual cells in V2 showed a greater range in their responses to the capture-grating stimulus. Plotted on this graph is the response of the cell to the grating stimulus averaged over the five disparity conditions tested, as well as the cell's maximum and minimum responses obtained to grating stimuli. The stimuli are sorted in ascending order of response ranges: the longer the vertical line (Fig.14A), the greater the amount of response modulation induced by the contextual disparity cues. With the exception of a single cell, most V1 cells showed little modulation in their firing pattern in response to the contextual stimuli. In contrast, a greater percentage of cells in V2 were influenced by the disparity-containing stimuli outside the core RF, as indicated by the abundance oflong vertical lines in the right-hand side of the graph (Fig. 14A). It should be noted that it isnot the case that the population of cells tested in V1 was poorly driven by all stimuli. Responses of the cells to preferred stimuli presented with the core RF are indicated in Figure14A by the x's. Note that both V1 and V2 cells showed strong responses to disparity-containing stimuli presented within their core RF.
Fig. 14.

A, Response modulation of cells in V1 (left) and V2 (right) to contextual disparity. Each cell was tested with five grating stimuli, each containing a different amount of disparity limited to the ends of the grating located beyond the cell's core RF (2y, 1y, 0y, −1y, and −2y, where the disparity y is selected depending on the neuron's own disparity tuning). End points of the vertical lines indicate the maximum and minimum responses of the cell to the grating stimulus, with a circle indicating the cell's average response obtained by averaging responses to all five disparity conditions tested. The x's indicate the cell's maximum response rate to a single stimulus containing disparity presented within the cell's core RF and therefore provide a basis to compare the relative driving of the cell in response to the grating stimulus containing contextual disparity. B, Peak disparity tuning obtained by disparity capture grating and a single stimulus within the RF core. Plotting the disparity values that elicited the maximal response rate from the recorded neuron in response to the disparity capture grating versus the response rate obtained to a single stimulus given disparity reveals the high degree of similarity between the two response profiles. Pointsalong the diagonal indicate cells that responded maximally when the grating and the single bar stimulus had the same amount of disparity. These cells are indicated inA by the filled circles (29 of 47 or 62%). When present, numberswithin thecircles indicate how many cells had similar values for the peak disparity response (circleswithoutnumbers indicate single cases with those disparity values).
To determine whether cells responded to this depth illusion with the same disparity preference as that obtained for a single stimulus presented within their classical RF, we plotted the disparity values that produced the peak response to the two conditions (Fig.14B). Data points locatedalong the diagonal indicate cells that responded with an identical peak preference for each of the stimulus conditions. Twenty-nine of 47 (62%) disparity-sensitive cells in V2 responded to the texture grating with the same preference as to a single stimulus within the classical RF given disparity (Fig. 14B, open circles). In contrast, no V1 cells (0 of 11) responded in such a manner to the grating stimulus (Fig. 14B,filled squares).
Latency of responses to stimuli containing contextual depth information
It is important to note that the capture-induced responses had the same latency as that induced by a single stimulus presented to the center of the RF (Fig. 15, ∼65 msec in one monkey). In no observed case among the population of cells responding to the disparity capture, illusory contour, or flank facilitation stimuli was the latency of the capture response significantly different from that elicited by a single stimulus placed within the RF.
Fig. 15.

A, Peristimulus time histograms obtained for three experiments from a single V2 cell: RF length determination, orientation tuning, and disparity capture. Plotted are the responses to the optimal stimulus for each experiment.Horizontal bar on x-axis represents time of stimulus presentation. Note that the latency to response onset and the duration of the response are the same for all three experiments.B, Distributions of response latencies for all cells recorded from one monkey in response to the three experiments described in the paper are plotted along with the latency distributions obtained from the same cells in response to stimuli consisting of either optimal orientation or RF length. There is no difference between the distributions of neural latency obtained in response to stimuli containing contextual depth information presented beyond the RF core and the distributions obtained in response to preferred stimuli presented within the RF core.
Physiological identification of recording sites
In addition to using physiological properties to identify the V1–V2 border, it was possible to tentatively locate the borders of a V2 thick stripe by comparing additional RF characteristics, such as the strength of disparity tuning, direction preference, and color sensitivity (Hubel and Livingstone, 1987). This putative thick stripe is indicated in Figure 16 as thegray shaded area (these maps are from a single hemisphere, the same one depicted in Fig. 3 in the maps of RF properties). Assuming the localization of the thick stripe on the basis of physiological criteria, it is possible to determine whether the sensitivity to global depth information correlated with this subcompartment of V2 or showed a more uniform distribution across V2 and V1. From all of the classes of experiments shown above, it is clear that the V2 thick stripe region is more likely to be influenced by contextual depth information than are either V2 nonthick stripe cells or V1 cells. This was seen in both experimental animals.
Fig. 16.

Spatial distribution of cells responsive to contextual depth information. A, Map indicating the presumed location of a thick stripe (shaded area) in V2 of a single hemisphere based on the local clustering of cells with high degrees of binocularity, disparity selectivity, and motion/direction preference (these data are from the same hemisphere depicted in Fig.3B–D). B,Filled circles indicate the location of cells in this monkey that exhibited depth-gated flank facilitation. C,Filled circles indicate the location of cells in this monkey that responded to contextual depth-induced illusory contours.D,Filled circles indicate the location of cells in this monkey that exhibited disparity capture. In all cases,open circles indicate cells that were tested but failed to respond to the contextual stimulus plotted. Thick dashed line indicates V1/V2 boundary. Thin dashed-enclosed area indicates putative thick stripe.
DISCUSSION
V2 neurons signal partially occluded contours via flank facilitation, respond to disparity-defined illusory contours, and respond to illusions that support disparity capture. These results demonstrate that V2 cells integrate stimulus information from beyond their classical RF, similar to previous descriptions of contextual stimuli on the responses of neurons in V1 (Maffei and Fiorentini, 1976;Allman et al., 1985; Gilbert and Wiesel, 1990; Gilbert et al., 1990;Gilbert, 1992; Knierim and Van Essen, 1992; Kapadia et al., 1995, 1999;Ito et al., 1998; Ito and Gilbert, 1999). The contextual influences in V1 have been attributed to a plexus of long-range horizontal connections, whose extent and specificity can account for the interactions observed in that area (Gilbert and Wiesel, 1979, 1983,1989; Rockland and Lund, 1982, 1983; Martin and Whitteridge, 1984;Ts'o et al., 1986; Malach et al., 1993; Das and Gilbert, 1995). This intracortical network provides information to a neuron from well beyond the area covered by its own classical RF, or those of its nearby neighbors. The circuits responsible for the lateral interactions observed in V2 remain to be explored.
Critical to the design of the stimuli involved in this study was the use of contextual depth information by placing disparity-containing stimulus elements outside of the RF core. All three experiments described demonstrate that local disparity cues alone do not determine to which stimulus configurations V2 cells will respond. For example, V2 cells responded to the disparity capture stimulus even though the grating elements within the RF core contained no disparity (i.e., there was a matched element presented to the other eye in the same position; Figs. 12-14).
The preferred disparity tuning of the cell did not always predict the ultimate response to the complex surface stimuli, because it varied depending on the particular stimulus configuration studied. For example, V2 cells responded with a similar preference for stimulus capture stimuli as they did for a single stimulus within their RF core (Figs. 12-14). However, there was no relation to the disparity tuning of the cell and the signaling of modal completion (Figs. 7-9). Both Near and Far cells responded to an illusory contour generated in response to crossed disparity given to contextual bar segments located beyond the RF core.
Although disparity-sensitive neurons in V1 track absolute disparity changes and not relative disparity (Cumming and Parker, 1999), visual perception tracks relative disparity relationships (Werner, 1938;Gogel, 1965; Nelson, 1977; Westheimer, 1979; Erkelens and Collewijn, 1985; Regan et al., 1986). Relative disparity of the stimuli, and not absolute disparities, determines how the visual system interprets the surface relationships present in the stimuli (Ramachandran, 1986; He and Nakayama, 1992, 1993). V2 cells responded to the subjective contours generated by these relative disparity differences that support the surface interpretations, as demonstrated in the modal completion experiments (Figs. 7, 8). Furthermore, V2 neurons responded to the disparity capture stimulus, indicating that they might contribute to the perception of depth, rather then local depth per se. In contrast, V1 neurons failed to respond in the same way to these stimuli. This failure of V1 neurons to respond to global disparity cues is not limited to the particulars of the stimulus used in this study, as it has been reported recently using an analogous stimulus consisting of displaced sine wave gratings observed through shifted apertures (Cumming and Parker, 2000). On the other hand, there is evidence of amodal completion in V1 (Sugita, 1999) (although this report of amodal completion found the phenomenon limited to cells with RFs within the central 2° of eccentricity).
It is well documented that area V2 has compartments specialized for the analysis of depth, motion, and color (Hubel and Wiesel, 1970;Livingstone and Hubel, 1984; Hubel and Livingstone, 1985, 1987; Roe and Ts'o, 1995; Zeki and Shipp, 1987). In addition to these attributes, V2 also seems to be more responsive to illusory contours than is V1 (von der Heydt et al., 1984; von der Heydt and Peterhans, 1989a,b; Peterhans and von der Heydt, 1993; Sheth et al., 1996). Previous experiments have demonstrated responses of cells in V2 to illusory contours formed by offset gratings or pac-man-like supports (von der Heydt et al., 1984; von der Heydt and Peterhans, 1989a,b;Peterhans and von der Heydt, 1991, 1993; Sheth et al., 1996). Here we show that V2 cells can respond to disparity-induced illusory contours. V2 sensitivity to surface interpretations of visual stimuli has also been suggested by recent evidence that pairs of V2 neurons in the cat can develop synchronous activity that correlates with surface segmentation rules determined by manipulation of stimulus transparency (Castelo-Branco et al., 2000), but there is debate about the general role of synchrony in surface segmentation (Lamme and Spekreijse, 1998). Synchrony between neurons develops when two intersecting plaids are perceived as separate surfaces, with one transparent surface moving above a background surface, but not when they are perceived as a single surface moving in an intermediate direction.
Further evidence that the phenomena we have studied relate to the higher order perceptual rules of surface relationships, rather than to local disparity selectivity within the RF core or surround, is the sensitivity of the cells to the Metelli rules of luminance and transparency (Fig. 9). In this case, all disparity relationships were identical across the stimuli tested; only the local stimulus contrast changed. Yet, these manipulations alter the percept of the surfaces, from a transparent surface bounded by illusory contours in front of a darker background square to two independent darker bar segments floating in front of a lighter background, with no illusory contours connecting the bar segments. V2 cells respond to the former stimulus configuration but not the latter, indicating sensitivity to the surface representation and not only to local stimulus disparity cues.
We found much more pronounced effects of global depth cues in area V2 than in area V1. The differences were not merely attributable to differences in spatial scale, because our stimuli were tailored to the sizes of the individual receptive fields of the recorded neurons. The difference in the propensity of V2 neurons to be sensitive to global depth cues compared with that of V1 suggests different functional roles for the two areas. Several lines of evidence point toward a role for V1 in coding image characteristics, i.e., orientation, spatial frequency, luminance, wavelength, and binocular disparity. This proceeds more or less independent of what real world scene may have given rise to a particular image. In contrast, the three experiments included in this study suggest that V2 plays a role in the coding of surface properties of a scene, including surface contours, regions of surfaces, opacity, and transparency, particularly as they are influenced by the relative depth between image regions.
Footnotes
This work was supported by National Institutes of Health Grant EY07968. J.S.B. was supported by National Institutes of Health Fellowship F32EY06842. We thank Kaare Christian for programming and Steven Kane and Joel Lopez for surgical assistance.
Correspondence should be addressed to Dr. Charles D. Gilbert, The Rockefeller University, 1230 York Avenue, New York, NY 10021. E-mail:gilbert@rockefeller.edu.
REFERENCES
- 1.Allman JM, Miezin F, McGuiness E. Directions and velocity specific surround in three cortical visual areas of the owl monkey. Perception. 1985;14:105–126. doi: 10.1068/p140105. [DOI] [PubMed] [Google Scholar]
- 2.Barlow HB, Blakemore C, Pettigrew JD. The neural mechanism of binocular depth discrimination. J Physiol (Lond) 1967;193:327–342. doi: 10.1113/jphysiol.1967.sp008360. [DOI] [PMC free article] [PubMed] [Google Scholar]
- 3.Bishop PO. Seeing with two eyes. Aust J Sci. 1970;32:383–391. [Google Scholar]
- 4.Bishop PO. Neurophysiology of binocular single vision and stereopsis. In: Jung R, editor. Central processing of visual information. A: Integrative functions and comparative data. Springer; Heildelberg: 1973. pp. 255–305. [Google Scholar]
- 5.Bishop PO. Stereopsis and fusion. Trans Ophthalmol Soc N Z. 1974;26:17–27. [PubMed] [Google Scholar]
- 6.Blakemore C. The representation of three-dimensional visual space in the cat's striate cortex. J Physiol (Lond) 1970;209:155–178. doi: 10.1113/jphysiol.1970.sp009160. [DOI] [PMC free article] [PubMed] [Google Scholar]
- 7.Brewster D. On the knowledge of distance given by binocular vision. Trans R Soc Edinburgh. 1884;15:663–674. [Google Scholar]
- 8.Castelo-Branco M, Goebel R, Neuenschwander S, Singer W. Neural synchrony correlates with surface segmentation rules. Nature. 2000;405:685–689. doi: 10.1038/35015079. [DOI] [PubMed] [Google Scholar]
- 9.Cumming BG, Parker AJ. Binocular neurons in V1 of awake monkeys are selective for absolute, not relative, disparity. J Neurosci. 1999;19:5602–5618. doi: 10.1523/JNEUROSCI.19-13-05602.1999. [DOI] [PMC free article] [PubMed] [Google Scholar]
- 10.Cumming BG, Parker AJ. Local disparity not perceived depth is signaled by binocular neurons in cortical area V1 of the macaque. J Neurosci. 2000;20:4758–4767. doi: 10.1523/JNEUROSCI.20-12-04758.2000. [DOI] [PMC free article] [PubMed] [Google Scholar]
- 11.Das A, Gilbert CD. Long-range horizontal connections and their role in cortical reorganization revealed by optical recording of cat primary visual cortex. Nature. 1995;375:780–784. doi: 10.1038/375780a0. [DOI] [PubMed] [Google Scholar]
- 12.Dresp B. Bright lines and edges facilitate the detection of small line targets. Spat Vis. 1993;7:213–225. doi: 10.1163/156856893x00379. [DOI] [PubMed] [Google Scholar]
- 13.Erkelens CJ, Collewijn H. Motion perception during dichoptic viewing of moving random-dot stereograms. Vision Res. 1985;25:583–588. doi: 10.1016/0042-6989(85)90164-6. [DOI] [PubMed] [Google Scholar]
- 14.Ferster DA. Comparison of binocular depth mechanisms in areas 17 and 18 of the cat visual cortex. J Physiol (Lond) 1981;311:623–655. doi: 10.1113/jphysiol.1981.sp013608. [DOI] [PMC free article] [PubMed] [Google Scholar]
- 15.Field DJ, Hayes A, Hess RF. Contour integration by the human visual system: evidence for a local “association field.”. Vision Res. 1993;33:173–193. doi: 10.1016/0042-6989(93)90156-q. [DOI] [PubMed] [Google Scholar]
- 16.Freeman RD, Ohzawa I. On the neurophysiological organization of binocular vision. Vision Res. 1990;30:1661–1676. doi: 10.1016/0042-6989(90)90151-a. [DOI] [PubMed] [Google Scholar]
- 17.Gilbert CD. Horizontal integration and cortical dynamics. Neuron. 1992;9:1–13. doi: 10.1016/0896-6273(92)90215-y. [DOI] [PubMed] [Google Scholar]
- 18.Gilbert CD, Wiesel TN. Morphology and intracortical projections of functionally characterised neurones in the cat visual cortex. Nature. 1979;280:120–125. doi: 10.1038/280120a0. [DOI] [PubMed] [Google Scholar]
- 19.Gilbert CD, Wiesel TN. Clustered intrinsic connections in cat visual cortex. J Neurosci. 1983;3:1116–1133. doi: 10.1523/JNEUROSCI.03-05-01116.1983. [DOI] [PMC free article] [PubMed] [Google Scholar]
- 20.Gilbert CD, Wiesel TN. Columnar specificity of intrinsic horizontal and corticocortical connections in cat visual cortex. J Neurosci. 1989;9:2432–2442. doi: 10.1523/JNEUROSCI.09-07-02432.1989. [DOI] [PMC free article] [PubMed] [Google Scholar]
- 21.Gilbert CD, Wiesel TN. The influence of contextual stimuli on the orientation selectivity of cells in primary visual cortex of the cat. Vision Res. 1990;30:1689–1701. doi: 10.1016/0042-6989(90)90153-c. [DOI] [PubMed] [Google Scholar]
- 22.Gilbert CD, Hirsch JA, Wiesel TN. Lateral interactions in visual cortex. Cold Spring Harb Symp Quant Biol. 1990;55:663–677. doi: 10.1101/sqb.1990.055.01.063. [DOI] [PubMed] [Google Scholar]
- 23.Gogel WC. Equidistance tendency and its consequences. Psychol Bull. 1965;64:153–163. doi: 10.1037/h0022197. [DOI] [PubMed] [Google Scholar]
- 24.He ZJ, Nakayama K. Surface versus features in visual search. Nature. 1992;359:231–233. doi: 10.1038/359231a0. [DOI] [PubMed] [Google Scholar]
- 25.He ZJ, Nakayama K. Perceiving textures: beyond filtering. Vision Res. 1993;34:151–162. doi: 10.1016/0042-6989(94)90328-x. [DOI] [PubMed] [Google Scholar]
- 26.Hubel DH, Livingstone MS. Complex-unoriented cells in a subregion of primate area 18. Nature. 1985;315:325–327. doi: 10.1038/315325a0. [DOI] [PubMed] [Google Scholar]
- 27.Hubel DH, Livingstone MS. Segregation of form, color, and stereopsis in primate area 18. J Neurosci. 1987;7:3378–3415. doi: 10.1523/JNEUROSCI.07-11-03378.1987. [DOI] [PMC free article] [PubMed] [Google Scholar]
- 28.Hubel DH, Wiesel TN. Stereoscopic vision in the macaque monkey: cells sensitive to binocular depth in area 18 of the macaque monkey cortex. Nature. 1970;225:41–42. doi: 10.1038/225041a0. [DOI] [PubMed] [Google Scholar]
- 29.Hubel DH, Wiesel TN. A re-examination of stereoscopic mechanisms in area 17 of the cat. J Physiol (Lond) 1973;232:29P–30P. [PubMed] [Google Scholar]
- 30.Ito M, Gilbert CD. Attention modulates contextual influences in the primary visual cortex of alert monkeys. Neuron. 1999;22:593–604. doi: 10.1016/s0896-6273(00)80713-8. [DOI] [PubMed] [Google Scholar]
- 31.Ito M, Westheimer G, Gilbert CD. Attention and perceptual learning modulate contextual influences on visual perception. Neuron. 1998;20:1191–1197. doi: 10.1016/s0896-6273(00)80499-7. [DOI] [PubMed] [Google Scholar]
- 32.Joshua DE, Bishop PO. Binocular single vision and depth discrimination. Receptive field disparities for central and peripheral vision and binocular interaction on peripheral single units in cat striate cortex. Exp Brain Res. 1970;10:389–416. doi: 10.1007/BF02324766. [DOI] [PubMed] [Google Scholar]
- 33.Judge SJ, Richmond BJ, Chu FC. Implantation of magnetic search coils for measurement of eye position: an improved method. Vision Res. 1980;20:535–538. doi: 10.1016/0042-6989(80)90128-5. [DOI] [PubMed] [Google Scholar]
- 34.Julesz B. Binocular depth perception of computer generated patterns. Bell System Tech J. 1960;39:1125–1162. [Google Scholar]
- 35.Kapadia MK, Ito M, Glbert CD, Westheimer G. Improvement in visual sensitivity by changes in local context: parallel studies in human observers and in V1 of alert monkeys. Neuron. 1995;15:843–856. doi: 10.1016/0896-6273(95)90175-2. [DOI] [PubMed] [Google Scholar]
- 36.Kapadia MK, Westheimer G, Gilbert CD. Dynamics of spatial summation in primary visual cortex of alert monkeys. Proc Natl Acad Sci USA. 1999;96:12073–12078. doi: 10.1073/pnas.96.21.12073. [DOI] [PMC free article] [PubMed] [Google Scholar]
- 37.Knierim JJ, Van Essen DC. Neuronal responses to static texture patterns in area V1 of the alert monkey. J Neurophysiol. 1992;67:961–980. doi: 10.1152/jn.1992.67.4.961. [DOI] [PubMed] [Google Scholar]
- 38.Lamme VA, Spekreijse H. Neuronal synchrony does not represent texture segregation. Nature. 1998;396:362–366. doi: 10.1038/24608. [DOI] [PubMed] [Google Scholar]
- 39.Livingstone MS, Hubel D. Anatomy and physiology of a color system in the primate visual cortex. J Neurosci. 1984;4:309–356. doi: 10.1523/JNEUROSCI.04-01-00309.1984. [DOI] [PMC free article] [PubMed] [Google Scholar]
- 40.Maffei L, Fiorentini A. The unresponsive regions of visual cortical receptive fields. Vision Res. 1976;16:1131–1139. doi: 10.1016/0042-6989(76)90253-4. [DOI] [PubMed] [Google Scholar]
- 41.Malach R, Amir Y, Harel M, Grinvald A. Relationship between intrinsic connections and functional architecture revealed by optical imaging and in vivo targeted biocytin injections in primate striate cortex. Proc Natl Acad Sci USA. 1993;90:10469–10473. doi: 10.1073/pnas.90.22.10469. [DOI] [PMC free article] [PubMed] [Google Scholar]
- 42.Martin KAC, Whitteridge D. Form, function and intracortical projections of spiny neurones in striate visual cortex of the cat. J Physiol (Lond) 1984;353:463–504. doi: 10.1113/jphysiol.1984.sp015347. [DOI] [PMC free article] [PubMed] [Google Scholar]
- 43.McKee SP, Mitchison GJ. The role of retinal correspondence in stereoscopic matching. Vision Res. 1988;28:1001–1012. doi: 10.1016/0042-6989(88)90077-6. [DOI] [PubMed] [Google Scholar]
- 44.Metelli F. The perception of transparency. Sci Am. 1974;230:90–98. doi: 10.1038/scientificamerican0474-90. [DOI] [PubMed] [Google Scholar]
- 45.Mitchison GJ, McKee SP. Interpolation in stereoscopic matching. Nature. 1985;315:402–404. doi: 10.1038/315402a0. [DOI] [PubMed] [Google Scholar]
- 46.Mitchison GJ, McKee SP. The resolution of ambiguous stereoscopic matches by interpolation. Vision Res. 1987a;27:285–294. doi: 10.1016/0042-6989(87)90191-x. [DOI] [PubMed] [Google Scholar]
- 47.Mitchison GJ, McKee SP. Interpolation and the detection of fine structure in stereoscopic matching. Vision Res. 1987b;27:295–302. doi: 10.1016/0042-6989(87)90192-1. [DOI] [PubMed] [Google Scholar]
- 48.Nakayama K. Binocular visual surface perception. Proc Natl Acad Sci USA. 1996;93:634–639. doi: 10.1073/pnas.93.2.634. [DOI] [PMC free article] [PubMed] [Google Scholar]
- 49.Nakayama K, Shimojo S, Ramachandran VS. Transparency: relation to depth, subjective contours, luminance, and neon color spreading. Perception. 1990;19:497–513. doi: 10.1068/p190497. [DOI] [PubMed] [Google Scholar]
- 50.Nakayama K, He ZJ, Shimojo S. Visual surface representation: a critical link between lower-level and higher-level vision. In: Kosslyn SM, Osherson DN, editors. Invitation to cognitive science. MIT; Cambridge, MA: 1995. pp. 1–70. [Google Scholar]
- 51.Nelson JI. The plasticity of correspondence: after-effects, illusions, and horopter shifts in depth perception. J Theor Biol. 1977;66:203–266. doi: 10.1016/0022-5193(77)90170-9. [DOI] [PubMed] [Google Scholar]
- 52.Nelson JI, Frost BJ. Intracortical facilitation among co-oriented, co-axially aligned simple cells in cat striate cortex. Exp Brain Res. 1985;6:54–61. doi: 10.1007/BF00235620. [DOI] [PubMed] [Google Scholar]
- 53.Nikara T, Bishop PO, Pettigrew JD. Analysis of retinal correspondence by studying receptive fields of binocular single units in cat striate cortex. Exp Brain Res. 1968;6:353–372. doi: 10.1007/BF00233184. [DOI] [PubMed] [Google Scholar]
- 54.Peterhans E, von der Heydt R. Subjective contours—bridging the gap between psychophysics and physiology. Trends Neurosci. 1991;14:112–119. doi: 10.1016/0166-2236(91)90072-3. [DOI] [PubMed] [Google Scholar]
- 55.Peterhans E, von der Heydt R. Functional organization of area V2 in the alert macaque. Eur J Neurosci. 1993;5:509–524. doi: 10.1111/j.1460-9568.1993.tb00517.x. [DOI] [PubMed] [Google Scholar]
- 56.Pettigrew JD. Binocular neurons which signal change of disparity in area 18 of cat visual cortex. Nat New Biol. 1973;241:123–124. doi: 10.1038/newbio241123a0. [DOI] [PubMed] [Google Scholar]
- 57.Pettigrew JD, Nikara T, Bishop PO. Binocular interaction on single units in cat striate cortex: simultaneous stimulation by single moving slit with receptive fields in correspondence. Exp Brain Res. 1968;6:391–410. doi: 10.1007/BF00233186. [DOI] [PubMed] [Google Scholar]
- 58.Poggio GF. Mechanisms of stereopsis in monkey visual cortex. Cereb Cortex. 1995;3:193–204. doi: 10.1093/cercor/5.3.193. [DOI] [PubMed] [Google Scholar]
- 59.Poggio GF, Fischer B. Binocular interaction and depth sensitivity in striate and pre-striate cortex of behaving rhesus monkey. J Neurophysiol. 1977;40:1392–1405. doi: 10.1152/jn.1977.40.6.1392. [DOI] [PubMed] [Google Scholar]
- 60.Poggio GF, Talbot WH. Mechanisms of static and dynamic stereopsis in foveal cortex of the rhesus monkey. J Physiol (Lond) 1981;315:469–492. doi: 10.1113/jphysiol.1981.sp013759. [DOI] [PMC free article] [PubMed] [Google Scholar]
- 61.Poggio GF, Gonzalez F, Krause F. Stereoscopic mechanisms in monkey visual cortex: binocular correlation and disparity selectivity. J Neurosci. 1988;8:4531–4550. doi: 10.1523/JNEUROSCI.08-12-04531.1988. [DOI] [PMC free article] [PubMed] [Google Scholar]
- 62.Polat U, Sagi D. The architecture of perceptual spatial interactions. Vision Res. 1994;28:115–132. doi: 10.1016/0042-6989(94)90258-5. [DOI] [PubMed] [Google Scholar]
- 63.Prince SJD, Pointon AD, Cumming BG, Parker AJ. The precision of single neuron responses in cortical area V1 during stereoscopic depth judgments. J Neurosci. 2000;20:3387–3400. doi: 10.1523/JNEUROSCI.20-09-03387.2000. [DOI] [PMC free article] [PubMed] [Google Scholar]
- 64.Ramachandran VS. Capture of stereopsis and apparent motion by illusory contours. Percept Psychophys. 1986;39:361–373. doi: 10.3758/bf03203005. [DOI] [PubMed] [Google Scholar]
- 65.Ramachandran VS, Cavanagh P. Subjective contours capture stereopsis. Nature. 1985;317:527–530. [Google Scholar]
- 66.Regan D, Erkelens CJ, Collewijn H. Necessary conditions for the perception of motion in depth. Invest Ophthalmol Vis Sci. 1986;27:584–597. [PubMed] [Google Scholar]
- 67.Rockland KS, Lund JS. Widespread periodic intrinsic connections in the tree shrew visual cortex. Science. 1982;215:1532–1534. doi: 10.1126/science.7063863. [DOI] [PubMed] [Google Scholar]
- 68.Rockland KS, Lund JS. Intrinsic laminar lattice connections in primary visual cortex. J Comp Neurol. 1983;216:303–318. doi: 10.1002/cne.902160307. [DOI] [PubMed] [Google Scholar]
- 69.Roe AW, Ts'o DY. Visual topography in primate V2: multiple representation across functional stripes. J Neurosci. 1995;15:3689–3715. doi: 10.1523/JNEUROSCI.15-05-03689.1995. [DOI] [PMC free article] [PubMed] [Google Scholar]
- 70.Sheth BR, Sharma J, Rao SC, Sur M. Orientation maps of subjective contours in visual cortex. Science. 1996;274:2110–2115. doi: 10.1126/science.274.5295.2110. [DOI] [PubMed] [Google Scholar]
- 71.Sugita Y. Grouping of image fragments in primary visual cortex. Nature. 1999;401:269–272. doi: 10.1038/45785. [DOI] [PubMed] [Google Scholar]
- 72.Ts'o DY, Gilbert CD, Wiesel TN. Relationships between horizontal interactions and functional architecture in cat striate cortex as revealed by cross-correlation analysis. J Neurosci. 1986;6:1160–1170. doi: 10.1523/JNEUROSCI.06-04-01160.1986. [DOI] [PMC free article] [PubMed] [Google Scholar]
- 73.von der Heydt R, Peterhans E. Mechanisms of contour perception in monkey visual cortex. I. Lines of pattern discontinuity. J Neurosci. 1989a;9:1731–1748. doi: 10.1523/JNEUROSCI.09-05-01731.1989. [DOI] [PMC free article] [PubMed] [Google Scholar]
- 74.von der Heydt R, Peterhans E. Mechanisms of contour perception in monkey visual cortex. II. Contours bridging gaps. J Neurosci. 1989b;9:1749–1763. doi: 10.1523/JNEUROSCI.09-05-01749.1989. [DOI] [PMC free article] [PubMed] [Google Scholar]
- 75.von der Heydt R, Peterhans E, Baumgartner G. Illusory contours and cortical neuron responses. Science. 1984;224:1260–1262. doi: 10.1126/science.6539501. [DOI] [PubMed] [Google Scholar]
- 76.Werner H. Binocular depth contrast and the conditions of the binocular field. Am J Psychol. 1938;51:489–497. [Google Scholar]
- 77.Westheimer G. Cooperative neural processes involved in stereoscopic acuity. Exp Brain Res. 1979;36:585–597. doi: 10.1007/BF00238525. [DOI] [PubMed] [Google Scholar]
- 78.Wheatstone C. Contributions to the physiology of vision—part the first. On some remarkable and hitherto unobserved phenomena of binocular vision. Philos Trans R Soc. 1838;128:371–394. [Google Scholar]
- 79.Wheatstone C. Contributions to the physiology of vision—part the second. On some remarkable and hitherto unobserved phenomena of binocular vision. Philos Trans R Soc. 1852;142:1–17. [Google Scholar]
- 80.Wolbarsht ML, MacNichol EF, Jr, Wagner HG. Glass insulated platinum microelectrode. Science. 1960;132:1309–1310. doi: 10.1126/science.132.3436.1309. [DOI] [PubMed] [Google Scholar]
- 81.Zeki S, Shipp S. Functional segregation within area V2 of macaque monkey visual cortex. In: Kulikowski JJ, Dickinson CM, Murray IJ, editors. Seeing contour and color. Pergamon; Oxford: 1987. pp. 102–124. [Google Scholar]
- 82.Zipser K, Lamme VAF, Schiller PH. Contextual modulation in primary visual cortex. J Neurosci. 1996;16:7376–7389. doi: 10.1523/JNEUROSCI.16-22-07376.1996. [DOI] [PMC free article] [PubMed] [Google Scholar]