

Abstract
The orbitofrontal cortex (OF) is strongly and reciprocally connected with the perirhinal (PR) and entorhinal areas of the medial temporal lobe and plays an important role in odor recognition memory. This study characterized firing patterns of single neurons in the OF of rats performing a continuous odor-guided delayed nonmatch to sample (DNMS) task. Most OF neurons fired in association with one or more task events, including the initiation of trials, the sampling of odor stimuli, and the consumption of rewards. OF neurons also exhibited sustained odor-selective activity during the memory delay, and a large proportion of OF cells had odor-specific enhanced or suppressed responses on stimulus repetition. Most OF neurons were activated during several task events, or associated with complex behavioral states. The incidence of cells that fired in association with the critical match/non-match judgement was increased as the DNMS rule was learned, and was higher in OF than in perirhinal and entorhinal cortex. Furthermore, the classification of match and nonmatch trials was correlated with accuracy in performance of that judgement. These findings are consistent with the view that OF is a high order association cortex that plays a role both in the memory representations for specific stimuli and in the acquisition and application of task rules.
Keywords: orbitofrontal cortex, prefrontal cortex, recognition memory, single units, delayed nonmatching, parahippocampal region, medial temporal lobe
Declarative memory is mediated by a network of brain structures including widespread “association” areas of the cerebral cortex that are reciprocally connected with the medial temporal lobe (MTL) (Squire and Alvarez, 1995). Among the cortical areas most strongly interconnected with the MTL is the prefrontal cortex (Deacon et al., 1983; Witter et al., 1989; Suzuki and Amaral, 1994a,b; Burwell et al., 1995). Neurons in the prefrontal cortex of monkeys encode spatial and nonspatial stimuli as well as complex stimulus relationships and rules of various tasks (Wilson et al., 1993; Miller, 1999), suggesting that the prefrontal area mediates performance across a wide range of learning and memory tasks. However, it remains unclear how the prefrontal cortex interacts with MTL structures in mediating memory.
One task that has been used extensively to delineate the roles of cortical areas and components of the MTL is the delayed nonmatching to sample (DNMS) task (Gaffan, 1974; Mishkin and Delacour, 1975). In this task, animals are presented with a memory cue; then, after a variable memory delay, they must distinguish between re-presentation of the familiar cue and other stimuli to obtain a reward. Damage to the parahippocampal region [PHR; including the perirhinal (PR), entorhinal, and parahippocampal/postrhinal cortices] results in a selective impairment in performance at long delay intervals in both monkeys (Zola-Morgan et al., 1989, 1994; Gaffan and Murray, 1992;Meunier et al., 1993; Suzuki et al., 1993; Eacott et al., 1994; Gaffan, 1994; Buffalo et al., 1999) and rats (Otto and Eichenbaum, 1992a; Mumby and Pinel, 1994). In both rats and monkeys, PHR neurons fire in association with DNMS task events, including the initiation of trials, sampling of the memory cues, and consumption of rewards. In addition, PHR neurons exhibit sustained stimulus-selective firing during the memory delay or differential responses to match and nonmatch test stimuli (Suzuki et al., 1997; Young et al., 1997). In monkeys, lateral prefrontal cortex cells also encode the sample stimuli and exhibit memory-related activity in animals performing delayed matching to sample tasks (Miller et al., 1996), suggesting that the prefrontal cortex and PHR are similarly involved in recognition memory.
Rodent model systems offer a particularly good opportunity to study prefrontal–MTL interactions. There is considerable evidence indicating similarity in the pathways between the prefrontal cortex and MTL in rats and primates (Deacon et al., 1983; Witter et al., 1989; Suzuki and Amaral, 1994a,b; Burwell et al., 1995). The role of the MTL in memory has been extensively studied in rats, and the findings of these studies suggest strong correspondence in MTL function among species (for review, see Squire, 1992; Eichenbaum et al., 2000). Furthermore, the orbitofrontal area (OF) of rats, which is strongly interconnected with the PHR (Deacon et al., 1983; Price et al., 1991), plays an important role in acquisition and performance of an odor-guided version of DNMS (Otto and Eichenbaum, 1992a), and neurons in the OF encode odor stimuli and their significance (Schoenbaum and Eichenbaum, 1995a,b;Schoenbaum et al., 1998). The present experiment characterizes the firing patterns of OF in rats performing an odor-guided DNMS task and compares these with the firing patterns of PHR and hippocampal neurons already described (Otto and Eichenbaum, 1992b; Young et al., 1997). The combined results of these studies illuminate our understanding of the set of cortical and MTL structures involved in recognition memory.
MATERIALS AND METHODS
Subjects, surgery, and histology. Subjects were five male Long-Evans rats, weighing between 350 and 400 gm at the beginning of training. The animals were housed individually, maintained on a 12 hr light/dark cycle, and given ad libidum access to Purina chow. Water was restricted to that earned as reward in the continuous delayed nonmatching to sample (cDNM) task and to 1 hr free access immediately after each testing session.
After pretraining and before the beginning of training on the cDNM task, rats were anesthetized using Halothane gas in a 30:70 oxygen/nitrous oxide gas mixture and placed in a stereotaxic headholder. The skull was exposed through a midline incision and leveled along the Bregma–Lambda axis. A small hole was drilled in the skull for the placement of the electrodes, as well as five small holes for the placement of skull screws to secure the headstage and ground wires. A driveable bundle of electrodes was implanted above the right OF (3.2 mm anterior to bregma, 4.0 mm lateral to the midline suture, and 3.5 mm below the surface of the brain) and was secured with dental cement. One rat (rat G10) was implanted after training on the cDNM task and before testing at the 3 and 30 sec delay intervals. This was done to ensure that the rat could be recorded from during the entire complement of delay testing.
At the completion of recording, animals were given an overdose of sodium pentobarbital (100 mg/kg). A 15 mA current was passed through each of the electrodes, and the rat was perfused transcardially with 0.9% saline, followed by a solution of 10% buffered formalin and 4% potassium ferrocyanide. This procedure results in a Prussian Blue reaction for the localization of the tips of the electrodes. Brains were removed and stored in formalin. Twenty-four hours before sectioning, the brains were transferred to a cryoprotectant solution (20% glycerin in 0.1 m phosphate buffer solution) and then sectioned coronally at 50 μm on a freezing microtome. The sections were mounted and stained with thionin.
Behavioral apparatus. Training, testing, and recording were all performed in a 30 × 30 cm aluminum chamber with walls slanting outward at a 5° angle to the floor. Odor stimuli were presented in an odor port located in the center of one wall and 5 cm above the floor. Photodetectors mounted on the sides of the odor port monitored nose pokes into the odor port. A water cup was located 2.5 cm below the odor port and was monitored by a set of photodetectors, and appropriate responses resulted in a delivery of 0.03 ml of water into the water cup. A single 24 V panel lamp was located on the wall above the odor port. Odor delivery to the odor port was controlled through the opening and closing of solenoid valves on an eight-channel flow-dilution olfactometer. The odors consisted of eight commercially available imitation food extracts (anise, coconut, cherry, lemon, orange, almond, vanilla, banana) diluted in deionized water to a concentration of ∼1:100 or to a concentration at which the odors were just detectible to the experimenter. Scrubbed, pressurized air (dehydrated with Dri-Rite, passed through activated charcoal, and rehydrated with deionized water) was split into two streams, one that flowed continually at a rate of 0.5 l/min through the clean air channel to clear the odor channels between odor presentations. Two seconds before stimulus presentation, the second stream (0.5 l/min) was saturated with the selected odor from the olfactometer and combined with the clean air stream, for a total flow of 1 l/min to a three-way solenoid immediately adjacent to the odor port. A continuous vacuum dump (2 l/min) was attached to both the odor port and the three-way solenoid. When the solenoid was closed, this vacuum served to shunt the odor away from the testing apparatus at a negative pressure. In response to an appropriate nose poke (breaking the odor port photobeam), the three-way solenoid diverted the airstream into the odor port, and the vacuum evacuated the odor port at negative pressure, ensuring that no odor escaped into the testing chamber.
Behavioral procedures. Rats were initially pretrained to hold their noses in the odor port to receive a water reward in the water cup. This phase of training was conducted with clean air only and proceeded for up to 400 trials per day. Each rat was initially required to hold its nose in the odor port for 250 msec, and the length of the nose hold was slowly ramped up to 1250 msec in 10 msec intervals. A 3 sec delay was imposed between trials, during which time the house light was extinguished. Nose pokes during this delay interval resulted in a 2 sec increase in the length of the delay. At the end of the delay interval, the house light was illuminated to indicate the beginning of the next trial. Once the rats were consistently holding in the port for 1250 msec (20/20 “correct” trials), training continued as set except that odorized air was presented in the odor port rather than clean air. Each rat was required to hold in the port for 250 msec before the odor was delivered to ensure that it was committed to the trial. The odors were the same as those used in the cDNM task, except that the odors were different on each trial. This phase of training was conducted for 2 d at 400 trials per day. Subsequently, rats were implanted with stereotrode bundles and allowed to recover from surgery for 1 week (with the exception of rat G10, which was implanted after reaching criterion-level performance on the cDNM task).
After recovery, the rats began training on the cDNM task. The cDNM task has been described extensively (Otto and Eichenbaum, 1992a,b; Young et al., 1997), and the procedure described briefly here is the same with two exceptions. In the current study, rats were trained with eight odors rather than the 16 odors used in previous studies. Furthermore, the criterion was more stringent (80% correct over 2 d of testing, rather than 18/20 correct trials in one session). This was done intentionally to make learning the task more difficult and to lengthen the training required to reach criterion-level performance. In this way, the development of patterns of neural firing in the cDNM task could be examined over the course of gradual learning.
Briefly, the cDNM task proceeded as follows. The house light was illuminated, signaling the beginning of a trial. At this time, the rat was allowed to nose poke in the odor port to sample an odor stimulus. In half the trials, the odor was different from the preceding trial (a nonmatch or S+ trial), and a response at the water port within 5 sec (a “go” or R+ response) resulted in the delivery of 0.03 ml of water to the water cup. After the water port response, the house light extinguished, and a 3 sec (correct) delay interval began. On the other half of the trials, the odor was the same as on the preceding trial (a match or S− trial), and the rat had to entirely withhold responding at the water port (a “nogo” or R− response). If the rat withheld responding for 5 sec, the house light was extinguished and a 3 sec (correct) delay interval began. Rats were required to hold in the odor port for the full 1000 msec on both types of trials. Errors of commission and early withdrawals from the odor port resulted in the immediate extinction of the house light and the initiation of a 7 sec (incorrect) delay interval. Initially, rats were trained for up to 400 trials per day, with up to three correction trials per incorrect trial. Once the rats reached criterion-level performance (80% correct performance or better on 2 consecutive days of training), the correction procedure was terminated, and rats were tested on daily sessions of up to 400 trials with either 3 or 30 sec delay intervals.
Electrophysiological recording. The electrode bundle consisted of four stereotrodes and two reference wires (10 wires total) made from 30 μm Formvar-coated nichrome wires. The array was threaded through a 27 gauge cannula that was attached to a custom-made microdrive assembly. The wires were attached at one end to a 10-pin Augat connector and trimmed so that they extended ∼0.5 mm from the tip of the guide cannula at the other end. This entire assembly was secured to the head of the rat using dental cement and skull screws.
After surgery, rats were allowed to recover for 1 week with ad libidum access to food and water, after which they began training on the cDNM task. Electrophysiological recording began immediately on the first day after resumption of training and continued every day either until the electrode had penetrated the extent of the OF cortex or until the rat had completed testing on the 3 and 30 sec delay intervals. After most recording sessions, the electrode was advanced by ∼80 μm. Recordings were made on all sessions with at least one isolatable cell.
Neural activity was acquired through unity gain field effect transistors in the headstage of the recording cable, differentially amplified (gain 10,000), and band-pass-filtered (600–6000 Hz; Neuralynx Digital Amplifiers). Individual spikes and behavioral flags were acquired and digitized (28 kHz, Data Translation DT2821 digital I/O board) using Enhanced Discovery software (DataWave Technologies) on an IBM-compatible Pentium-based PC. Individual units were isolated and differentiated off line using Autocut software (DataWave Technologies). This software allows for the isolation of single units based on multiple spike parameters (including spike height, width, peak time, valley time, etc.) (McNaughton et al., 1989) on both wires of a stereotrode simultaneously. Units were analyzed if they maintained their established parameters throughout the recording session.
Data analysis. Analysis of the patterns of neuronal firing was conducted in three stages. In the first stage, cells were analyzed in relation to specific trial and behavioral events that occurred in the same sequence on each trial. In this event analysis, the activity of each cell was sorted into peri-event histograms time-locked to (1) the onset of the house light signaling the beginning of a trial; (2) entry into the odor port initiating the trial; (3) the onset of the odor presentation; (4) removal of the nose from the sniff port (the “unpoke”); (5) entry of the nose into the water port; and (6) the offset of the house light signaling the beginning of the delay interval. These peri-event histograms were used to classify the cells based on their maximal change in firing rate (increase or decrease) during each of four time intervals. Cells were classified as (1) “trial initiation” if their average maximal change in firing rate occurred just before the nose poke into the odor port; (2) “cue-sampling cells” if their average maximal change occurred during the 1000 msec presentation of the odor stimulus; (3) “reward” if the maximal change occurred during the approach to the water cup or during the reward consumption; or (4) “delay-related” if the maximal change occurred during the delay interval. Any cell with a firing rate that did not significantly change from baseline (defined as the 1 sec immediately before the onset of the house light) during one of these four epochs (paired t tests, two-tailed, significance set at p = 0.05) was classified as having “no correlate.” This analysis was conducted in accordance with procedures established in two previous cDNM recording studies examining the activity of cells in the CA1 of the hippocampus (Otto and Eichenbaum, 1992b) and in the parahippocampal region (Young et al., 1997), so that the activity of cells in OF could be directly compared with the activity in these other brain regions.
The second stage of the analysis focused on the odor-specific coding of each cell, including the coding of the match and nonmatch contingency. For this analysis, two time epochs were considered. The first was the odor-sampling period (from 100–800 msec after the onset of the odor stimulus) while the rat was holding in the odor port. The second was the end of the delay interval (from 2000–2500 msec after the unpoke on 3 sec delay trials, and 29,000–29,500 msec after the unpoke on 30 sec delay trials). One-way ANOVAs were used to compare the firing during the odor-sampling period or the end of the delay interval. Odor-selective cells were defined as having a significant (p < 0.05) differences in firing rates across the eight odors. Cells that were found to be odor selective during the odor-sampling period were further analyzed for differences in firing patterns on match and nonmatch trials. For each of these cells a two-way ANOVA compared the firing rates for the preferred odor (odor associated with the highest firing rate) with the nonpreferred odor (odor associated with the lowest firing rate) on match and nonmatch trials. This analysis was conducted in accordance with the procedures outlined in Young et al. (1997) so that comparisons could be made between the firing of cells in the OF with those in the parahippocampal region on the same cDNM task.
The third stage of the analysis focused on the complexity of the responses (i.e., changes in firing in relation to multiple task and behavioral events) exhibited by most of the cells recorded in the OF. For each cell, the activity was compared with the baseline firing rate (the 1 sec before the onset of the house light) during five epochs (within ANOVAs, significance set at p < 0.05). These included (1) the trial initiation period (250 msec before to 250 msec after the rat's nose poke in the odor port); (2) the pre-odor period (500 msec before the odor onset); (3) the odor-sampling period (100–800 msec after odor onset); (4) the end of the delay period (from 2000 to 2500 msec after the unpoke on 3 sec delay trials, and 29,000–29,500 msec after the unpoke on 30 sec delay trials); and 95) the reward period (100 msec before to 400 msec after the delivery of the water reward). Further analyses were conducted on three of these epochs. Odor selectivity was assessed using one-way ANOVAs (p < 0.05) across all eight odors for (6) the odor sampling period, (7) the end of the delay interval, and (8) the pre-odor period. A final analysis (9) was conducted on the odor sampling period to determine whether there were differences in activity on match and nonmatch trials regardless of odor selectivity (one-way ANOVA, p < 0.05). Any cell that had no significant findings in this analysis was considered to have (10) no correlate. The units were then grouped by the session in which they were recorded, and a proportion of cells in each session exhibiting significant findings were calculated for each of the 10 categories. These proportions were used to compare the coding of neurons across different levels of performance (i.e., the percent correct performance of the rat on each session).
RESULTS
Electrode localization
Figure 1 illustrates the electrode paths through the OF cortex for the five rats. In all five cases, recordings were made from the medial portion of the dorsal agranular insula, just dorsal to the rhinal fissure. Neurons recorded in this study were from all layers of cortex, although predominantly from the more superficial layers. Analysis of the firing patterns of cells along the path of the electrode penetration revealed no systematic localization of characterized cell types.
Fig. 1.

Location of electrode penetration for each of the five rats. Thick lines indicate the approximate extent of the area traversed by the electrode tips. AId, Agranular insula–dorsal; AIv, agranular insula–ventral; GU, gustatory area;ORBl, lateral orbital cortex; PIR, piriform cortex; lot, lateral olfactory tract;rf, rhinal fissure. Numbers represent cortical layers, and levels are noted in millimeters anterior to bregma. Figure adapted from Swanson (1992).
Behavioral performance
As described in Materials and Methods, several changes were made intentionally to lengthen the training period so that the development of the patterns of neural firing could be examined as performance gradually improved. Three of the five rats (rats G7, G8, G10) learned the cDNM task to criterion-level performance at a 3 sec delay interval, requiring an average of 15.3 sessions and 5226 trials. Once the rats had reached criterion, the average delay performance for these three rats was 78% correct (3 sec delay interval) and 79.8% correct (30 sec delay). For the remaining two rats, training was terminated before they reached criterion-level performance because the electrode had penetrated through the entire extent of OF cortex. Training for rat G6 was stopped after 18 sessions (6473 trials, 62.5% correct performance over the final two sessions of testing). Training for rat G11 was stopped after five sessions (1428 trials, 49% correct performance over the final 2 d of testing).
Neuronal activity related to behavioral events
A total of 716 single units were isolated from recordings in OF of five rats. These units were recorded over a total of 73 sessions (average 14.6 sessions per animal). An average of 9.4 units were isolated from each session (range = 2–23 units per session).
Table 1 illustrates the incidence of cells (276 neurons recorded from sessions in which the rats were performing at 80% correct or higher) demonstrating changes to any of the task events. For this Table, all significant responses of each cell are included, and cells were counted more than once if they showed multiple significant responses. Analysis of individual cells in OF revealed significant changes in firing rate (compared with baseline firing rate; individual t tests: all pvalues < 0.05) during the trial initiation period, changes in response to odor onset, as well as changes in firing rate during the duration of the odor-sampling period. Changes in firing were also noted in response to the nose poke at the water port. Analysis of the patterns of firing during the delay interval revealed that cells in OF fired differentially in response to water delivery (e.g., increases in firing on S+R+ but not S-R+ or S-R− trials), and a “ramping” increase in firing during the duration of the delay. These nonspecific changes in firing in relation to behavioral events have been described extensively in the parahippocampal region of rats performing the same cDNM task and so will not be illustrated here (Young et al., 1997, their Figs. 2, 5, and 6; Otto and Eichenbaum, 1992b. their Fig. 1). Odor-specific and memory-related changes in firing will be reported fully in the next sections.
Table 1.
Percentage of cells (and n) in OF with changes in firing associated with each task event (individual cells can have multiple responses)
| Changes in firing associated with: | OF (%) (n = 276) |
|---|---|
| Responsive during odor-sampling period | 65.2 (180) |
| Odor-selective during odor-sampling period | 15.6 (43) |
| Match/nonmatch selective during odor-sampling period | 63.4 (175) |
| Responsive during delay interval | 46.0 (127) |
| Odor-selective during delay interval | 5.1 (14) |
| Responsive at trial initiation | 61.2 (169) |
| Odor-selective during pre-odor period | 2.2 (6) |
| Responsive during reward period | 72.8 (201) |
Although the largest proportion of cells in OF were reward responsive (72.8%), examination of Table 1 reveals that a large proportion of cells in OF were also responsive to cue sampling (65.2%) and to the match/nonmatch contingency (63.4%). In the current study, 88.4% of the 276 cells in Table 1 showed changes in firing during two or more sampling intervals. The complexity of these cellular responses in OF will be addressed at the end of Results.
Cells were also categorized into five major types according to their maximal change from baseline firing rate (i.e., each cell counted only once), so that the firing of cells in OF could be compared with the firing of cells in the parahippocampal region from previous studies. Table 2 shows this categorization of the 276 neurons recorded from OF, cells recorded from the CA1 of the hippocampus (Otto and Eichenbaum, 1992b), and the lateral entorhinal (LER) and PR cortices [the parahippocampal region (Young et al., 1997)] of rats performing the same cDNM task.
Table 2.
Comparison of maximal responses across brain areas (each cell counted only once)
| Cell type | Hippocampus2-a(n = 261) | LER2-b (n = 128) | PR2-b (n = 177) | OF (n = 276) |
|---|---|---|---|---|
| Trial initiation | 10.0% | 28.9% | 32.2% | 15.9% (44) |
| Odor-sampling | 12.3% | 43.0% | 43.5% | 25.0% (69) |
| Reward | 4.6% | 4.7% | 11.3% | 39.9% (110) |
| Delay | 19.2% | 14.8% | 2.8% | 14.6% (40) |
| No behavioral correlate | 54.0% | 9.4% | 10.2% | 4.7% (13) |
LER, Lateral entorhinal cortex; PR, perirhinal cortex.
Data from Otto and Eichenbaum, 1992b.
Data from Young et al., 1997.
The largest percentage of cells in OF (40%) showed maximal firing rate changes during the water reward period. One-quarter of the cells responded most strongly during the odor-sampling period, whereas fewer showed the maximal response during trial initiation or the delay interval. Only a small percentage of the cells exhibited no significant change in firing associated with any of the trial events.
In general, the findings from OF are similar to those of the previous studies in that neurons in each of these areas fired in relation to all of the task events. There were, however, two qualities of the activity of OF cells that distinguished this area from the parahippocampal region (Table 2). First, a relatively high proportion of cells in OF demonstrated a maximal response during the approach and consumption of the reward, and second, very few cells in OF showed no changes in firing with any of the task events.
Odor-specific activity during the cue-sampling period
All 276 neurons recorded from sessions in which performance was >80% correct were included in this analysis. Because averaging across all of the odors could dilute highly odor-selective responses, every cell, rather than just those classified as cue-sampling above, was subjected to a one-way ANOVA (eight odors, mean firing rate during the odor-sampling period). ANOVAs revealed that 15.6% (n = 43) of the cells in OF fired differentially across the odor series (allp values < 0.05) (Table3) [data from Young et al. (1997) are included for comparison].
Table 3.
Percentage of cells (and n) that were odor-selective during the odor-sampling period
| Odor-sampling period | Subiculum3-a(n = 73) | LER3-a(n = 128) | PR3-a(n = 177) | OF (n = 276) |
|---|---|---|---|---|
| Odor-selective | 24.7% (18) | 35.2% (45) | 11.3% (20) | 15.6% (43) |
| Odor-selective that fire differentially on match and nonmatch trials | 11.1% (2) | 26.7% (12) | 15.0% (3) | 48.8% (21) |
| Match enhancement | (2) | (5) | (0) | (10) |
| Match suppression | (0) | (7) | (3) | (11) |
Data from Young et al., 1997.
The firing pattern of a cell with a highly odor-selective response is illustrated in Figure 2. This cell fired more robustly during the odor-sampling period to odor 7 than to any of the other seven odors (F(7,392) = 13.74, p < 0.001) (Fig. 2A). Figure2B illustrates the firing pattern of this cell from 1 sec before odor onset to 1.5 sec after for each of the eight odors. The baseline firing rate of this cell was <1/sec. Its firing rate increased sharply ∼300 msec after the opening of the odor valve (Fig.2B, Odor onset) and began to decrease toward baseline within 3–400 msec after the peak. The maximum absolute firing rate of this cell was similar to other reports of stimulus-selective responses in the OF [e.g., Schoenbaum et al. (1999), their Fig. 4a]. Many OF cells showed considerably larger odor responses under select conditions (see examples in Figs.3, 5). Also, most cells in OF demonstrated a more heterogeneous pattern of activation, with firing rates varying across the odor set [for example, see Fig.8A; see other examples in Schoenbaum and Eichenbaum (1995b), their Fig. 1]. Similar patterns of selective odor responses were described with cells in the subiculum, LER, and PR of rats performing the same cDNM task (Young et al., 1997).
Fig. 2.
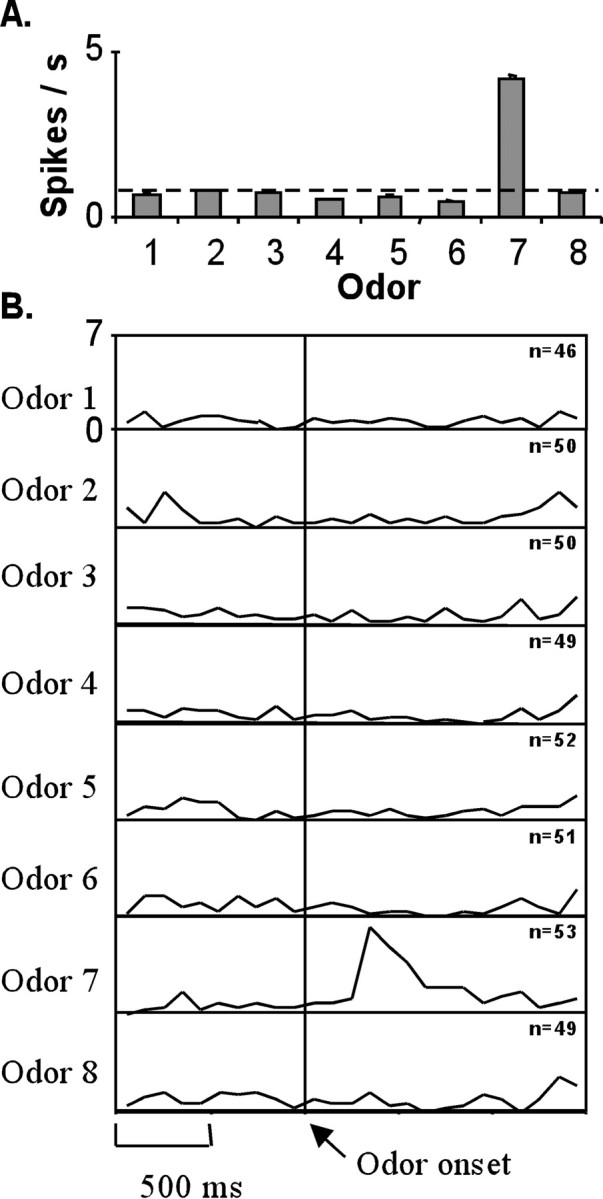
An example of a highly odor-selective cell.A, The mean firing rate of cell g62611 during the odor-sampling period. Dashed line indicates baseline firing rate, and error bars indicate the SEM. B, Activity of cell in A from 1 sec before to 1.5 sec after the opening of the final odor valve (Odor onset) for each of the eight odors. For this panel, and all subsequent panels of similar format, each box illustrates a summary line histogram of peri-event activity. The activity is accumulated in 100 msec bins from 1 sec before the event to 1.5 sec after the event, averaged for each trial type, and displayed as a continuous line illustrating the average firing rate in spikes per second.
Fig. 3.

Examples of odor-selective cells that also showed match suppression and match enhancement of firing. Dark lines indicate averages for nonmatch trials, light lines indicate averages for match trials, nindicates the number of match/nonmatch trials. A, Example of a match suppression cell (g62801). B, Example of a match enhancement cell (g82423).
Fig. 5.

The highly odor-selective cell illustrated in Figure 2 (g62611) fails to code the preferred odor on incorrect trials.A, Mean firing rate for the preferred and nonpreferred odors on correct and incorrect trials, averaged across the odor-sampling period. Dashed line indicates baseline firing rate, and error bars indicate the SEM. B, Line histograms illustrating the activity of cell in A from 1 sec before to 1.5 sec after the opening of the final odor valve (Odor onset) for the most preferred odor (left) and the least preferred odor (right). Average activity on correct trials is shown by a solid line and on incorrect trials by a dashed line, and n indicates the number of correct/incorrect trials.
Fig. 8.

Example of a cell with a complex response spanning several time intervals. A, The mean firing rate of cell g62801 during the odor-sampling period. Dashed lineindicates baseline firing rate, and error bars indicate the SEM.B, Activity of cell in A from 1 sec before to 1.5 sec after the opening of the final odor valve (Odor onset). This cell fired more robustly during the odor-sampling period on nonmatch trials (dark line) than on match trials (light line), and nindicates the number of match/nonmatch trials. The water response on nonmatch trials is indicated by the asterisk and is shown in a summary line histogram timed to the water poke inC.
Odor-selective cells were further analyzed to determine whether the magnitude of responses was affected by immediate stimulus repetition (match trials) relative to the response on trials that were not immediately preceded by an identical odor (nonmatch trials). Two-way ANOVAs were conducted for each of the 43 odor-selective cells, comparing responses with all eight odors on match and nonmatch trials. This 8 × 2 ANOVA revealed that 70% (n = 30/43) of the odor-selective neurons showed significant differences in firing on match versus nonmatch trials (as well as a significant main effect of odor), a significant odor × trial-type interaction, or both (p < 0.05). This finding points to the complex nature of the cellular responses of the neurons recorded in OF. By way of comparison with more general aspects of match/nonmatch coding, it should be noted here that 63.4% (n = 175/276) of all cells in OF showed significant differences in firing rate on match and nonmatch trials (Table 1), indicating that a much larger number of OF cells differentiate the match versus nonmatch trials, although they carry no information about the odor per se (n = 145), as compared with the number of cells that distinguish specific odors as a match or nonmatch (n = 30).
To make the findings from this study directly comparable with the findings from cells recorded in the PHR (Young et al., 1997), we also performed 2 × 2 ANOVAs for each of the 43 odor-selective cells. This analysis focused on the responses to the odors associated with the highest average firing rate during the odor-sampling period (best odor) and that associated with the lowest average firing rate (worst odor) on match and nonmatch trials. The findings are illustrated in Table 3. In this analysis, of the 43 units recorded in OF, 48.8% (n = 21) showed significant differences in firing on match versus nonmatch trials (as well as a significant main effect of odor), a difference in match versus nonmatch responses between the best and worst odors (a significant odor × trial type interaction), or both (p values < 0.05). Approximately half of these cells (n = 10) showed a decrease in firing on stimulus repetition for the best odor (match suppression), and an example is shown in Figure 3A. This cell exhibited a marked increase in firing rate that peaked ∼300 msec after the onset of the best odor on nonmatch trials but showed no increase in the firing rate on match trials. This cell had no odor-related response on either match or nonmatch trials for the worst odor (F(1,90) = 15.18, p < 0.001). The other half of the cells with significant match/nonmatch differences (n = 11) showed an increase in firing on stimulus repetition for the best odor (match enhancement). An example of a match enhancement cell is shown in Figure 3B. This cell exhibited an increase in firing on match trials peaking ∼500 msec after the onset of the best odor but did not show increased firing on nonmatch trials. Furthermore, this cell showed a decreased response on both match and nonmatch trials in relation to the worst odor (a significant odor × trial-type interaction;F(1,93) = 7.16, p < 0.01). Young et al. (1997), in their recordings from the PHR, also reported this greater match suppression or enhancement for the best odor than for the worst odor.
OF firing patterns associated with odor sampling are compared with the findings from cells recorded from the subiculum, LER, and PR (Young et al., 1997) of rats performing the same cDNM task in Table 3. Of the cells recorded in OF, 15.6% were odor selective. This was a significantly lower proportion than was found in the LER (35.2%; χ2(1) = 24.24, p < 0.05), but was similar to the proportion of cells that were odor-selective in the PR (11.3%; χ2(1) = 1.65, p > 0.05) or the subiculum (24.7%; χ2(1) = 3.30, p > 0.05). However, significantly more cells in OF had differential responses associated with odor identity and recent history. Half of the odor-specific cells in OF showed significant differences in firing on match and nonmatch trials. By contrast, only 15% of the cells in PR (n = 3 of 20 odor-selective cells; χ2(1) = 6.63, p < 0.05), 26.7% of cells in the LER (12/45 cells; χ2(1) = 4.61, p < 0.05), and 11.1% in the subiculum (2/18 cells, χ2(1) = 7.69, p < 0.01) showed this complex response. This finding is consistent with the observation that the majority of the cells recorded in OF and reported in Table 1 had significant responses to more than one of the behavioral events. Additional examples of complex cellular responses are reported at the end of Results.
Odor-specific activity during the delay interval
All 276 neurons recorded from sessions in which the rats were performing at >80% correct were included in the analysis. Each unit was subjected to a one-way ANOVA (eight odors, mean firing rate during the final 500 msec of the delay interval). This analysis revealed that 5.1% (n = 14) of the cells in OF fired differentially depending on the odor presented in the previous sampling period (allp values < 0.05). This is similar to the proportion of cells found to be odor-selective during the delay in the PR (7.9%, 14 of 177 cells; χ2(1) = 1.50,p > 0.05) but is a lower proportion than was found in the LER (10.9%; 14/128 cells; χ2(1) = 4.66, p < 0.05) or subiculum (12.3%; 9/73 cells; χ2(1) = 4.94, p < 0.05) (Young et al., 1997).
An example of an odor-selective delay cell is illustrated in Figure4. This cell exhibited a ramping increase in firing rate during the delay after presentation of odors 5, 7, and 8. This increased firing peaked within the final 750 msec of the delay interval (F(7,344) = 2.15,p < 0.01). Unlike the cells that were odor-selective during odor-sampling period, none of the 14 cells that fired differentially to the eight odors at the end of the delay interval showed strongly selective responses, i.e., activation associated with a single odor (Fig. 2). Instead, these delay responses were more complex, showing varying magnitude of response associated with the stimuli in the odor set. In addition, odor-selective delay cells typically increased their firing toward the end of the delay interval to some extent associated with all odors (Fig. 4B). This “ramping up” has been noted in cells recorded from the parahippocampal region (Suzuki et al., 1997; Young et al., 1997) and in the prefrontal cortex of the monkey (Quintana and Fuster, 1992; Miller et al., 1996; Rainer et al., 1999).
Fig. 4.

Example of a cell that is odor selective at the end of the 3 sec delay interval. A, The mean firing rate of cell g11301 at the end of the delay interval. Dashed line indicates baseline firing rate, and error bars indicate the SEM. B, Activity of cell in A from the extinction of the house light (end of the previous trial) to 3 sec after for each of the eight odors.
Accuracy of coding
Performance of the rat on the cDNM task should be reflected in differential coding by the cells in OF. For example, performance on a given trial could be reflected by differential stimulus coding (i.e., differential firing to odors) or by the accurate coding of stimulus contingency (i.e., differential firing to match and nonmatch odors) on that same trial. Both of these possibilities were explored.
The highly odor-selective cell illustrated in Figure 2 was further analyzed to determine whether the selective firing to the preferred odor (odor 7) was present on both correct and incorrect trials. This cell showed an increased firing rate during the odor-sampling period after the onset of the preferred odor on correct trials, but not on trials in which the rat performed incorrectly, and fired little to the nonpreferred odor, regardless of accuracy (Fig.5). A two-way ANOVA, comparing the response with the most and least preferred odors on correct or incorrect trials, revealed a significant interaction between odor and accuracy (F(1,100) = 88.5,p < 0.001). Approximately half (48%;n = 19/40) of the odor-selective cells recorded during learning of the cDNM rule miscoded the preferred odor on incorrect trials (performance between 50 and 75% correct; sessions with higher or lower performance did not contain enough of each trial type for statistical analysis). This finding suggests that the performance accuracy of the rat on the cDNM task is reflected by the differential coding of odors by units in the OF.
A similar error analysis was conducted for the match suppression cell in Figure 3A. This cell is shown again in Figure6, demonstrating that it codes the preferred odor on correct nonmatch trials but miscodes on incorrect nonmatch trials (Fig. 6, top left) (F(1,86) = 6.56, p < 0.05). In other words, the cell showed an increased firing rate during the odor-sampling period for the preferred odor on correct nonmatch trials but not on incorrect trials. By contrast, the cell did not show increased firing on any match trials (Fig. 6, bottom) or on any trials with the nonpreferred odor (Fig. 6, right), regardless of whether the trial was performed correctly or incorrectly. Half (50%; n = 14/28) of the odor-selective match/nonmatch cells recorded during learning of the cDNM rule (performance between 50 and 75% correct) miscoded the match/nonmatch contingency on incorrect trials. This finding is consistent with the idea that the performance of the rat on the cDNM is also reflected by the differential match/nonmatch coding of cells in the OF.
Fig. 6.

The match suppression cell illustrated in Figure3A (g62801) fails to code the match/nonmatch contingency on incorrect trials. Shown are line histograms for the preferred odor and nonpreferred odor on match and nonmatch trials. Dark lines indicate correct trials, dashed linesindicate incorrect trials, and n indicates the number of correct/incorrect trials. Note the response to the water reward on correct nonmatch trials for both the preferred and nonpreferred odors (indicated with an asterisk).
The two cells presented in this section were otherwise typical of units recorded in the OF. Unfortunately, there were too few cells recorded when the rat was performing at moderate levels of accuracy (required to generate sufficient numbers of correct and incorrect trials) to allow a global error analysis.
Changes in OF firing patterns associated with learning
The next two analyses considered the evolution of the neural responses (responses to major events as well as selective odor and match/nonmatch responses) associated with learning the nonmatch rule. A cellular response that becomes more prevalent as the performance of the rat increases likely reflects neural processes important for the performance of the cDNM task. Therefore, the proportion of cells with significant changes in firing was compared across learning of the cDNM task, as well as between the 3 and 30 sec delay intervals.
For each cell, the firing rate during the trial initiation period, the odor sampling period (cue responsive), the end of the delay interval (delay responsive), and the reward interval were compared with the baseline firing rate. ANOVAs were also performed to determine whether cells were odor selective during the odor-sampling period, during the end of the delay interval, or during the pre-odor interval, and whether the firing rate during the odor-sampling period was different on match and nonmatch trials (see Materials and Methods for a more complete definition of these intervals; p values < 0.05 were considered significant). The units were then grouped by the session in which they were recorded, and the proportion of cells in each session with significant findings was calculated for each response. The comparisons made below are based on these proportions.
Correlations
All sessions were subjected to a multiple regression analysis (68 sessions from all five rats, 627 total units). Proportions of cells displaying the following responses were compared across performance: (1) odor responsive during the odor sampling period; (2) odor selective during the odor sampling period; (3) match/nonmatch selective during the odor sampling period (regardless of odor selectivity); (4) delay responsive; (5) odor selective during the delay interval; (6) reward responsive; (7) trial initiation responsive; (8) odor selective during the pre-odor interval. This analysis revealed a significant positive overall relationship between the proportions of cells with significant changes in firing and the performance of the rats (multipleR2 = 0.573, p< 0.01). Partial regressions on all eight responses revealed that the only significant relationship was between the behavioral performance of the rats and the proportion of cells that fired differentially during the odor sampling period on match and nonmatch trials (R2 = 0.235, p< 0.05, regardless of odor selectivity). Figure7A shows that as performance increased, the proportion of cells that fired differentially on match and nonmatch trials also increased. Furthermore, comparison of the proportion of cells showing differential match and nonmatch firing was greater for sessions in which the rats were performing above criterion level (80% correct performance; 62% of cells demonstrated a significant match enhancement or suppression) than those in which the rats were below criterion (43%; t(66)= 1.67, p < 0.05). For comparison, Figure7B illustrates the relationship between the performance of the rat on the cDNM task and the proportion of cells that were odor selective during the odor-sampling period. There was no relationship between performance and odor selectivity during the odor-sampling period (R2 = 0.010,p > 0.05), or during the delay interval (R2 = 0.001, p> 0.05), or between performance and the proportion of cells with significant changes in firing during the delivery of the reward (R2 = 0.124, p> 0.05). To emphasize, these findings suggest that increasing behavioral performance is not associated with increasing stimulus or reward representation in OF. Rather, these findings are consistent with the idea that although odor identity and reward are represented in the OF, changes in the representation critical match/nonmatch contingency relate most closely to the changes in performance of the rats on the cDNM task.
Fig. 7.

The proportion of cells that fired differentially on match versus nonmatch trials increases as the performance of the rat gets better. No other cellular responses were significantly related to the performance of the rat. A, Proportion of cells in each recording session that fired differentially on match and nonmatch trials during the odor-sampling period, plotted against the percent correct performance of the rat. This regression is significant (p < 0.001). B, Proportion of cells that are odor selective during the odor-sampling period plotted against the percent correct performance of the rat. This regression is not significant (p > 0.05).
Delays: 3 versus 30 sec
Given the assumption that longer delay intervals are more difficult, another way to examine the relationship between the patterns of neural firing during the cDNM task and the performance of the rat is to examine the proportions of responses at different delay intervals. An ANOVA (delay interval × eight responses) revealed no effects (F < 1), indicating that there were no differences in the proportion of cells between the two delay intervals. However, this is likely because the rats were performing similarly at the two delays (3 sec delay = 78% correct performance, 30 sec = 79.8%). Because differential firing on match and nonmatch trials was shown to be important in the preceding correlational analysis, and because an effect may have been diluted in the ANOVA, a post hocanalysis was conducted examining the proportion of cells with differential responses on match and nonmatch trials at the two delays. There were no differences at the 3 sec delays (an average of 61.9% of all cells at the 3 sec delay interval had significant differences in firing on match and nonmatch trials) or at the 30 sec delay interval (average = 65.8%; t(18) = 0.34,p > 0.05).
Complex cellular responses
As mentioned above, a predominant quality of the firing patterns of OF cells was the complexity of their responses, revealed in responses to multiple events. The examination of the differential match/nonmatch firing of odor-selective cells in Table 3 only hinted at the complexity of the responses. In fact, 88.4% (n = 244) of the 276 neurons recorded from sessions in which performance was >80% correct showed significant changes in activity during two or more time intervals [including trial initiation, pre-odor, odor sampling, reward, and delay intervals (Table 1)]. Neurons in OF also showed complex responses during single intervals (e.g., cells with odor and match/nonmatch selective responses during the odor sampling period), and cells responded to complex behavioral events such as the “error of commission” cells described below. The complex responses of the cells were extremely varied and included almost every permutation of the eight responses mentioned in the preceding section, defying a simple classification scheme. However, several examples of complex cellular responses will be described. Each of the types of cells described is not unique.
The majority of units recorded in this study showed significant changes (usually increases) in firing rate to the delivery of water reward in addition to any other responses. For example, the match suppression cell illustrated in Figure 6 also showed a response to water delivery on correct nonmatch trials [“go” trials (Fig. 6, top panels, indicated with the asterisk)]. For clarity, this same cell (g62801) is also shown in Figure8. This unit is odor selective during the odor-sampling period (F(7,392) = 4.06,p < 0.001) (Fig. 8A), although it is not as highly selective as the cell illustrated in Figure 2, but rather has a firing rate that varies across the eight odors. It is match suppressive (Fig. 8B) and has a significant response to the water reward (Fig. 8C) (t(113) = 14.8, p < 0.001).
Other cells showed complex responses during the delay interval. Figure9 illustrates one such cell with a complex response during the 3 sec delay interval. This cell (g84023) has a significant odor-selective response at the end of the delay interval (F(7,305) = 3.12,p < 0.001), with a ramping increase in the firing rate at the end of the delay (Fig. 9, left) similar to that seen in cell g11301 (Fig. 4). However, unlike g11301, g84023 also had a response after nonmatch trials, peaking 1000–2000 msec into the delay interval (F(1,78) = 14.98,p < 0.001). This firing presumably reflects some aspect of the water reward that was delivered at the beginning of the delay interval on nonmatch trials.
Fig. 9.

Example of a cell with a complex response during the delay interval (3 sec delay interval). Shown are line histograms illustrating the activity of cell g84023 during the 3 sec after the extinction of the house light for the preferred odor (left) and nonpreferred odor (right) on nonmatch (dark line) and match trials (light line); n indicates the number of match/nonmatch trials. This cell is odor selective at the end of the delay interval (ramping increase in firing rate for the preferred odor) and shows a transient increase in firing during the middle second of the delay after nonmatch trials (presumably reflecting the water reward).
Another class of cells reflected the behavioral intention of the animal. An example of this class of cells is shown in Figure10. This cell showed enhanced firing during the odor-sampling period on match trials when the rat was going to incorrectly go to the waterport (S-R+ trials) and did not show enhanced firing on either S-R− trials or S+R+ trials. This enhanced firing was not simply a go response because the firing was significantly higher on match-go trials than on nonmatch-go trials (t(158) = 1.63, p = 0.05), nor was it a simple match enhancement cell, because the firing rate was higher on match-go trials than match-nogo trials (t(199) = 2.15, p < 0.05). In fact, the average firing rate was above baseline on match-go trials and below baseline for both match-nogo and nonmatch go trials (Fig. 10A). Most of this effect was observed during the initial 500 msec of the odor poke (Fig. 10B). This cell also showed suppression of activity after the odor poke in response to the water reward (i.e., only on nonmatch-go trials). In other words, while the rat was sampling the odor in the odor port, and before the behavioral response was initiated, this “guilt” cell reflected the fact that the rat was about to make an error of commission (i.e., the cell “knew” that the odor was a match and that the rat was going to make a response at the water port regardless of the outcome). This class of cells, although rare, was found only in the latter part of training and during criterion-level testing.
Fig. 10.

Example of a cell (g84023) with a complex response that reflected behavioral intention (error of commission) during the odor-sampling period and before the initiation of behavioral response. A, Average firing rate during the odor sampling period for match-go (error of commission trials), match-nogo, and nonmatch-go trials. Dashed line indicates baseline firing rate, and error bars indicate the SEM. B, Line histograms illustrating the activity of cell in A from 1 sec before to 1.5 sec after the opening of the final odor valve (Odor onset) for match-go trials (dark line; n = 76 trials), match-nogo trials (light line; n = 84), and nonmatch-go trials (dashed line; n = 125).
DISCUSSION
In this present study, neuronal activity in the OF reflected all identifiable trial events during performance of a recognition memory task. Conversely, nearly all OF neurons analyzed (95.3% in sessions in which the rat was performing at or above criterion level) fired in association with at least one of these events. OF cells altered firing rates during the active initiation of trials, during the sampling of the relevant memory cues, during the memory delay, and during the consumption of rewards. In addition, many OF cells fired in association with multiple task events or with complex combinations of events, including most prominently the match/nonmatch judgment critical to task performance.
These findings are consistent with the anatomical connectivity of the OF. The OF in the rat receives direct olfactory information from piriform cortex (Price et al., 1991; Barbas, 1993) and is highly interconnected with other parts of the prefrontal cortex, the amygdala, and the parahippocampal region (Deacon et al., 1983). The firing patterns of neurons in OF therefore reflect the convergence of olfactory stimulus-specific information, information about motivational and emotional significance of stimuli, and memory-related information from the MTL.
Stimulus-selective activity and memory correlates in the OF and PHR
Stimulus-selective and memory-related neuronal firing have been described in the prefrontal cortex of monkeys (Miller et al., 1996), and in the PHR of both rats (Young et al., 1997) and monkeys (Miller et al., 1991, 1993; Miller and Desimone, 1993, 1994; Brown, 1996; Suzuki et al., 1997), performing match and nonmatch to sample tasks. These studies report stimulus-specific responses, enhancement and decrement of responses during the repetition of optimal stimuli (match enhancement and match suppression), and persistent stimulus-related activation firing during the delay interval. The present findings extend these observations to the rodent OF, validating this model for studies of cortical function in memory.
In addition, the present study used the same DNMS task used by Young and colleagues (1997) to characterize the firing patterns of neurons in the PHR, allowing direct comparisons of neural activity in the OF and PHR. Neurons in both areas exhibit odor-selective responses, stimulus-selective match enhancement and match suppression, and odor-selective firing during the memory delay interval. The similarity of these basic sensory- and memory-related firing patterns is consistent with anatomical descriptions of strong interconnections between the OF and PHR.
There were also several potentially important differences between the firing of neurons in the OF and those in the PHR reported by Young et al. (1997). About half as many OF neurons (15.6%) showed odor-selective response as did neurons in the lateral entorhinal cortex (35.2%), a major component of the PHR. This observation is consistent with the notion that OF neurons are more involved in processing behavioral and motivational information and are not simply encoding stimuli for subsequent recognition. In contrast, a greater proportion of the odor-selective cells in OF (48.8%) coded the match/nonmatch contingency, compared with approximately half as many cells of this category in the PHR (PR = 15.0%; LER = 26.7%). Furthermore, the accuracy of coding of the match/nonmatch contingency reflected the performance of the animal, and the proportion of cells that distinguished nonmatch and match trials increased during DNMS acquisition. However, there was no correlation between performance and stimulus specificity in the OF, which would be expected if the OF were representing recognition with a passive, adaptation-like mechanism. Therefore, these findings suggest that the OF makes an active contribution to acquisition and application of the critical nonmatch rule, consistent with the findings from neuropsychological studies showing selective deficits after OF lesions in acquisition of the task under minimal memory demands but not in recognition over long delays, and in situations with high inter-item interference (Otto and Eichenbaum, 1992a).
Conversely, significantly fewer OF cells (5.1%) fired during the memory delay associated with the preceding sample odor than cells in the LER (10.9%), and there was no correlation between the proportions of OF cells showing delay activity and DNMS acquisition. These findings suggest that the PHR is more important than the OF for actively maintaining a representation of the sample during the delay interval.
This pattern of findings bears similarity to observations from studies on monkeys. Miller et al. (1996) and Suzuki et al. (1997) compared the firing patterns of neurons in the lateral prefrontal, perirhinal, and entorhinal cortex in monkeys performing a visual delayed matching to sample task. They reported that perirhinal cells were more stimulus selective than prefrontal cells, consistent with the predominance of unimodal visual input to the perirhinal cortex from area TE (Suzuki and Amaral, 1994a). This comparison parallels our observation of more odor-selective responses in the lateral entorhinal cortex of the rat, which receives strong input from unimodal olfactory areas (Deacon et al., 1983). In addition, Miller and colleagues (1996) found a greater proportion of match suppression and enhancement cells in the prefrontal cortex than in the perirhinal cortex, similar to the predominance of this type of cell in the rodent OF versus lateral entorhinal cortex observed here. On the other hand, there are differences between the findings from the rat and monkey studies. For instance, unlike in the present study, Miller et al. (1996) and Suzuki et al. (1997) found more delay-selective cells in the monkey prefrontal cortex than in the PHR. In this case, the large number of prefrontal cells involved in the match/nonmatch judgment may be attributable to the strong working memory demands of the match to sample task used by this group or to differences in the brain region recorded from (lateral prefrontal in the monkey vs OF in the rat). Interestingly, Colombo and Gross (1994), recording from the inferotemporal cortex of monkeys performing a visual delayed match to sample task, reported that the incidence of sample-selective delay cells increased with increasing performance, consistent with our observation that persistent sample-driven activity is a property of the posterior cortical areas that receive direct sensory input in both species.
This brief survey of electrophysiological evidence suggesting differential roles for the OF and the PHR is consistent with results from studies of selective damage to these cortical areas in animals performing DNMS tasks. In rats, damage to the OF results in an impairment in acquisition of the DNMS rule, even when the memory demands are minimized. By contrast, rats with lesions of the PHR learn the task at the normal rate but are impaired in memory performance at long delay intervals (Otto and Eichenbaum, 1992a). The combination of these behavioral and electrophysiological findings supports our conclusion that the OF is critical for learning and applying the nonmatching rule to specific stimuli, whereas the PHR is critical for maintaining the representation and recognition of a sample stimulus beyond a few seconds.
On a related point, neurons in OF have been shown to strongly represent reward in this study, as well as in other studies of rats (Schoenbaum et al., 1999) and monkeys (Rolls et al., 1996). However, it does not seem likely that reward representation per se can account for the accuracy of performance on DNMS tasks, because we failed to find a change in reward representation across learning of the task. Reward processing by OF could play an important role in the generation of combined representations of stimulus identity, memory, and reward (i.e., learning the rules of the game), which is supported by our observation of the complexity of the cellular responses in OF.
Complexity of cellular responses in the OF
Most OF cells fired in association with combinations of trial events or during multiple trial events. This observation suggests that OF neurons integrate information about the particular stimuli and the reward contingencies and may play a role in the formulation of behavioral responses. Furthermore, these findings on the rodent OF are consistent with the idea that, across species, the prefrontal area participates in a network that integrates memory information from the PHR with perceptual information from sensory cortical areas and information about reward and the behavioral state of the animal from other neocortical regions. Our results support Miller's [1999; see also Fuster (1995)] review of studies on the prefrontal cortex in monkeys, in which he observed that the complex patterns of neuronal firing in the frontal cortex reflect a combing of information across a wide range of modalities and brain regions. Miller (1999) concluded that the prefrontal area is specialized for “knitting together” information necessary for the abstraction and learning of rules and consistencies from the environment, and for their application to behavior.
Role of OF in memory
The present findings are consistent with the view that OF is a high-order association cortex that plays a role both in memory representation and in acquisition of task rules. During performance of the DNMS task, the OF is important for the learning and application of the critical nonmatching rule and may rely on the PHR for the maintenance of a representation of the sample stimulus across the delay interval. This characterization of the rodent OF is consistent with the notion that rule learning is the principal role of the prefrontal cortex (Passingham, 1993; Wise et al., 1996; Miller, 1999). In addition, the complexity of neuronal responses observed in OF here suggest the prefrontal cortex is involved in the integration of task rules, stimulus-specific information, information about motivational and emotional significance of stimuli, and memory-related information from the MTL. This view is consistent with other evidence that prefrontal cortex neurons are involved in attentional selection (Rainer et al., 1998), integration across stimulus modality (Fuster et al., 1982; Watanabe, 1992; Lipton et al., 1999), and association of stimuli and reward valence (Schoenbaum and Eichenbaum, 1995a; Schoenbaum et al., 1998), or association of stimuli with responses or expected consequences (Watanabe, 1996; Asaad et al., 1998). Together, these findings support the view that the prefrontal cortex resides at the top of both the perceptual and response hierarchies (Fuster, 1995), serving an executive role (Cohen and Servan-Schreiber, 1992) biasing processing in other brain regions through feedback connections toward task-relevant information.
Footnotes
This work was supported by National Institute of Mental Health Grant MH51570 and National Research Service Award MH11252 (S.J.R.). We thank Dr. Pablo Alvarez for his assistance in the analysis of the data and for his comments on this manuscript.
Correspondence should be addressed to Dr. Howard Eichenbaum, Department of Psychology, Boston University, 64 Cummington Street, Boston, MA 02215. E-mail: hbe@bu.edu.
REFERENCES
- 1.Asaad WF, Rainer G, Miller EK. Neural activity in the primate prefrontal cortex during associative learning. Neuron. 1998;21:1399–1407. doi: 10.1016/s0896-6273(00)80658-3. [DOI] [PubMed] [Google Scholar]
- 2.Barbas H. Organization of cortical afferent input to orbitofrontal areas in the rhesus monkey. Neuroscience. 1993;56:841–864. doi: 10.1016/0306-4522(93)90132-y. [DOI] [PubMed] [Google Scholar]
- 3.Brown MW. Neuronal responses and recognition memory. Semin Neurosci. 1996;8:23–32. [Google Scholar]
- 4.Buffalo EA, Ramus SJ, Clark RE, Teng E, Squire LR, Zola SM. Dissociation between the effects of damage to perirhinal cortex and area TE. Learning Memory. 1999;6:572–599. doi: 10.1101/lm.6.6.572. [DOI] [PMC free article] [PubMed] [Google Scholar]
- 5.Burwell RD, Witter MP, Amaral DG. Perirhinal and postrhinal cortices in the rat: a review of the neuroanatomical literature and comparison with findings from the monkey brain. Hippocampus. 1995;5:390–408. doi: 10.1002/hipo.450050503. [DOI] [PubMed] [Google Scholar]
- 6.Cohen JD, Servan-Schreiber D. Context, cortex, and dopamine: a connectionist approach to behavior and biology in schizophrenia. Psychol Rev. 1992;99:45–77. doi: 10.1037/0033-295x.99.1.45. [DOI] [PubMed] [Google Scholar]
- 7.Colombo M, Gross CG. Responses of inferior temporal cortex and hippocampal neurons during delayed matching to sample in monkeys (Macaca fascicularis). Behav Neurosci. 1994;108:443–455. doi: 10.1037//0735-7044.108.3.443. [DOI] [PubMed] [Google Scholar]
- 8.Deacon TW, Eichenbaum H, Rosenberg P, Eckman KW. Afferent connections of the perirhinal cortex in the rat. J Comp Neurol. 1983;220:168–290. doi: 10.1002/cne.902200205. [DOI] [PubMed] [Google Scholar]
- 9.Eacott MJ, Gaffan D, Murray EA. Preserved recognition memory for small sets, and impaired stimulus identification for large sets, following rhinal cortex ablations in monkeys. Eur J Neurosci. 1994;6:1466–1478. doi: 10.1111/j.1460-9568.1994.tb01008.x. [DOI] [PubMed] [Google Scholar]
- 10. Eichenbaum H, Alvarez P, Ramus SJ. Animal models of amnesia. Handbook of neuropsychology, Ed 2: memory and its disorders Cermak LS. 2000. 175 198 Elsevier Science; Amsterdam, in press. [Google Scholar]
- 11.Fuster JM. Memory in the cerebral cortex. MIT; Cambridge, MA: 1995. [Google Scholar]
- 12.Fuster JM, Bauer RH, Jervey JP. Cellular discharge in the dorsolateral prefrontal cortex of the monkey in cognitive tasks. Exp Neurol. 1982;77:679–694. doi: 10.1016/0014-4886(82)90238-2. [DOI] [PubMed] [Google Scholar]
- 13.Gaffan D. Recognition impaired and association intact in the memory of monkeys after transection of the fornix. J Comp Physiol Psychol. 1974;86:1100–1109. doi: 10.1037/h0037649. [DOI] [PubMed] [Google Scholar]
- 14.Gaffan D. Dissociated effects of perirhinal cortex ablation, fornix transection, and amygdalectomy: evidence for multiple memory systems in the primate temporal lobe. Exp Brain Res. 1994;99:411–422. doi: 10.1007/BF00228977. [DOI] [PubMed] [Google Scholar]
- 15.Gaffan D, Murray EA. Monkeys (Macaca fascicularis) with rhinal cortex ablations succeed in object discrimination learning despite 24-hr intervals and fail at matching to sample despite double sample presentations. Behav Neurosci. 1992;106:30–38. doi: 10.1037//0735-7044.106.1.30. [DOI] [PubMed] [Google Scholar]
- 16.Lipton PA, Alvarez P, Eichenbaum H. Crossmodal associative memory representations in rodent orbitofrontal cortex. Neuron. 1999;22:349–359. doi: 10.1016/s0896-6273(00)81095-8. [DOI] [PubMed] [Google Scholar]
- 17.McNaughton BL, Barnes CA, Meltzer J, Sutherland RJ. Hippocampal granule cells are necessary for normal spatial learning but not for spatially selective pyramidal cell discharge. Exp Brain Res. 1989;76:485–496. doi: 10.1007/BF00248904. [DOI] [PubMed] [Google Scholar]
- 18.Meunier M, Bachevalier J, Mishkin M, Murray EA. Effects on visual recognition of combined and separate ablations of the entorhinal and perirhinal cortex in rhesus monkeys. J Neurosci. 1993;13:5418–5432. doi: 10.1523/JNEUROSCI.13-12-05418.1993. [DOI] [PMC free article] [PubMed] [Google Scholar]
- 19.Miller EK. The prefrontal cortex: complex neural properties for complex behavior. Neuron. 1999;22:15–17. doi: 10.1016/s0896-6273(00)80673-x. [DOI] [PubMed] [Google Scholar]
- 20.Miller EK, Desimone R. Scopolamine affects short-term memory but not inferior temporal neurons. NeuroReport. 1993;4:81–84. doi: 10.1097/00001756-199301000-00021. [DOI] [PubMed] [Google Scholar]
- 21.Miller EK, Desimone R. Parallel neuronal mechanisms for short-term memory. Science. 1994;263:520–522. doi: 10.1126/science.8290960. [DOI] [PubMed] [Google Scholar]
- 22.Miller EK, Li L, Desimone R. A neural mechanism for working and recognition memory in inferior temporal cortex. Science. 1991;254:1377–1379. doi: 10.1126/science.1962197. [DOI] [PubMed] [Google Scholar]
- 23.Miller EK, Li L, Desimone R. Activity of neurons in anterior inferior temporal cortex during a short-term memory task. J Neurosci. 1993;13:1460–1478. doi: 10.1523/JNEUROSCI.13-04-01460.1993. [DOI] [PMC free article] [PubMed] [Google Scholar]
- 24.Miller EK, Erickson CA, Desimone R. Neural mechanism of visual working memory in prefrontal cortex of the macaque. J Neurosci. 1996;16:5154–5167. doi: 10.1523/JNEUROSCI.16-16-05154.1996. [DOI] [PMC free article] [PubMed] [Google Scholar]
- 25.Mishkin M, Delacour J. An analysis of short-term visual memory in the monkey. J Exp Psychol Anim Behav Process. 1975;1:326–334. doi: 10.1037//0097-7403.1.4.326. [DOI] [PubMed] [Google Scholar]
- 26.Mumby DG, Pinel JPJ. Rhinal cortex lesions and object recognition in rats. Behav Neurosci. 1994;108:11–18. doi: 10.1037//0735-7044.108.1.11. [DOI] [PubMed] [Google Scholar]
- 27.Otto T, Eichenbaum H. Complementary roles of orbital prefrontal cortex and the perirhinal-entorhinal cortices in an odor-guided delayed non-matching to sample task. Behav Neurosci. 1992a;106:763–776. doi: 10.1037//0735-7044.106.5.762. [DOI] [PubMed] [Google Scholar]
- 28.Otto T, Eichenbaum H. Neuronal activity in the hippocampus during delayed non-match to sample performance in rats: evidence for hippocampal processing in recognition memory. Hippocampus. 1992b;2:323–334. doi: 10.1002/hipo.450020310. [DOI] [PubMed] [Google Scholar]
- 29.Passingham R. The frontal lobes and voluntary action. Oxford UP; Oxford: 1993. [Google Scholar]
- 30.Price JL, Carmichael T, Carnes KM, Clugnet M, Kuroda M, Ray JP. Olfactory input to the prefrontal cortex. In: Davis J, Eichenbaum H, editors. Olfaction as a model for computational neuroscience. MIT; Cambridge, MA: 1991. pp. 101–120. [Google Scholar]
- 31.Quintana J, Fuster J-M. Mnemonic and predictive functions of cortical neurons in a memory task. NeuroReport. 1992;3:721–724. doi: 10.1097/00001756-199208000-00018. [DOI] [PubMed] [Google Scholar]
- 32.Rainer G, Asaad WF, Miller EK. Selective representation of relevant information by neurons in the primate prefrontal cortex. Nature. 1998;393:577–579. doi: 10.1038/31235. [DOI] [PubMed] [Google Scholar]
- 33.Rainer G, Rao SC, Miller EK. Prospective coding for objects in primate prefrontal cortex. J Neurosci. 1999;19:5493–5505. doi: 10.1523/JNEUROSCI.19-13-05493.1999. [DOI] [PMC free article] [PubMed] [Google Scholar]
- 34.Rolls ET, Critchley H, Mason R, Wakeman EA. Orbitofrontal cortex neurons: role in olfactory and visual association learning. J Neurophysiol. 1996;75:1970–1981. doi: 10.1152/jn.1996.75.5.1970. [DOI] [PubMed] [Google Scholar]
- 35.Schoenbaum G, Eichenbaum H. Information coding in the rodent prefrontal cortex. I. Single-neuron activity in orbitofrontal cortex compared with that in pyriform cortex. J Neurophysiol. 1995a;74:733–750. doi: 10.1152/jn.1995.74.2.733. [DOI] [PubMed] [Google Scholar]
- 36.Schoenbaum G, Eichenbaum H. Information coding in the rodent prefrontal cortex. II. Ensemble activity in orbitofrontal cortex. J Neurophysiol. 1995b;74:751–762. doi: 10.1152/jn.1995.74.2.751. [DOI] [PubMed] [Google Scholar]
- 37.Schoenbaum G, Chiba AA, Gallagher M. Orbitofrontal cortex and basolateral amygdala encode expected outcomes during learning. Nat Neurosci. 1998;1:155–159. doi: 10.1038/407. [DOI] [PubMed] [Google Scholar]
- 38.Schoenbaum G, Chiba AA, Gallagher M. Neural encoding in orbitofrontal cortex and basolateral amygdala during olfactory discrimination learning. J Neurosci. 1999;19:1876–1884. doi: 10.1523/JNEUROSCI.19-05-01876.1999. [DOI] [PMC free article] [PubMed] [Google Scholar]
- 39.Squire LR. Memory and the hippocampus: a synthesis of findings with rats, monkeys, and humans. Psychol Rev. 1992;99:195–231. doi: 10.1037/0033-295x.99.2.195. [DOI] [PubMed] [Google Scholar]
- 40.Squire LR, Alvarez P. Retrograde amnesia and memory consolidation: a neurobiological perspective. Curr Opin Neurobiol. 1995;5:169–177. doi: 10.1016/0959-4388(95)80023-9. [DOI] [PubMed] [Google Scholar]
- 41.Suzuki WA, Amaral DG. The perirhinal and parahippocampal cortices of the macaque monkey: cortical afferents. J Comp Neurol. 1994a;350:497–533. doi: 10.1002/cne.903500402. [DOI] [PubMed] [Google Scholar]
- 42.Suzuki WA, Amaral DG. Topographic organization of the reciprocal connections between the monkey entorhinal cortex and the perirhinal and parahippocampal cortices. J Neurosci. 1994b;14:1856–1877. doi: 10.1523/JNEUROSCI.14-03-01856.1994. [DOI] [PMC free article] [PubMed] [Google Scholar]
- 43.Suzuki WA, Zola-Morgan S, Squire LR, Amaral DG. Lesions of the perirhinal and parahippocampal cortices in the monkey produce long-lasting memory impairment in the visual and tactual modalities. J Neurosci. 1993;13:2430–2451. doi: 10.1523/JNEUROSCI.13-06-02430.1993. [DOI] [PMC free article] [PubMed] [Google Scholar]
- 44.Suzuki WA, Miller EK, Desimone R. Object and place memory in the macaque entorhinal cortex. J Neurophysiol. 1997;78:1062–1081. doi: 10.1152/jn.1997.78.2.1062. [DOI] [PubMed] [Google Scholar]
- 45.Swanson LW. Brain maps: structure of the rat brain. Elsevier; Amsterdam: 1992. [Google Scholar]
- 46.Watanabe M. Frontal units of the monkey coding the associative significance of visual and auditory stimuli. Exp Brain Res. 1992;89:233–247. doi: 10.1007/BF00228241. [DOI] [PubMed] [Google Scholar]
- 47.Watanabe M. Reward expectancy in primate prefrontal neurons. Nature. 1996;382:629–632. doi: 10.1038/382629a0. [DOI] [PubMed] [Google Scholar]
- 48.Wilson FA, Scalaidhe SP, Goldman-Rakic PS. Dissociation of object and spatial processing domains in primate prefrontal cortex. Science. 1993;260:1955–1958. doi: 10.1126/science.8316836. [DOI] [PubMed] [Google Scholar]
- 49.Wise SP, Murray EA, Gerfen CR. The frontal cortex-basal ganglia system in primates. Crit Rev Neurobiol. 1996;10:317–356. doi: 10.1615/critrevneurobiol.v10.i3-4.30. [DOI] [PubMed] [Google Scholar]
- 50.Witter MP, Groenewegen HJ, Lopes da Silva Lohman AHM. Functional organization of the extrinsic and intrinsic circuitry of the parahippocampal region. Prog Neurobiol. 1989;33:161–254. doi: 10.1016/0301-0082(89)90009-9. [DOI] [PubMed] [Google Scholar]
- 51.Young BJ, Otto T, Fox GD, Eichenbaum H. Memory representation within the parahippocampal region. J Neurosci. 1997;17:5183–5195. doi: 10.1523/JNEUROSCI.17-13-05183.1997. [DOI] [PMC free article] [PubMed] [Google Scholar]
- 52.Zola-Morgan S, Squire LR, Amaral DG, Suzuki WA. Lesions of perirhinal and parahippocampal cortex that spare the amygdala and hippocampal formation produce severe memory impairment. J Neurosci. 1989;9:4355–4370. doi: 10.1523/JNEUROSCI.09-12-04355.1989. [DOI] [PMC free article] [PubMed] [Google Scholar]
- 53.Zola-Morgan S, Squire LR, Ramus SJ. Severity of memory impairment in monkeys as a function of locus and extent of damage within the medial temporal lobe memory system. Hippocampus. 1994;4:483–495. doi: 10.1002/hipo.450040410. [DOI] [PubMed] [Google Scholar]