

Abstract
The putamen of the human striatum is a heterogeneous nucleus that contains the primary site of loss of dopamine (DA) in Parkinson's disease (PD). Furthermore, different functional domains of the putamen are heterogeneously susceptible to DA loss, and yet the dynamic regulation of extracellular DA concentration ([DA]o) and comparison between domains has not been explored in the primate brain. In these studies, DA was measured in real time using fast-scan cyclic voltammetry at a carbon-fiber microelectrode in vitro in striatal sections from the common marmoset (Callithrix jacchus). [DA]o released by a single stimulus pulse varied threefold along a ventromedial–dorsolateral axis. DA uptake was via the DA transporter (GBR12909 sensitive, desipramine insensitive). On the basis of data modeling with simulations of Michaelis–Menten kinetics, rate maximum, Vmax, varied with region: both [DA]o andVmax were greatest in regions most vulnerable in PD. These differences were reflected in part by regional variation in DA content. [DA]o,Vmax, and regional variation were two- to threefold greater than in rodent caudatoputamen.
In addition, steady-state [DA]o at physiological firing rates in primate striatum was controlled by depolarization frequency, uptake, and presynaptic autoreceptors. Furthermore, regulation of [DA]o by these mechanisms differed significantly between limbic- and motor-associated domains.
These data indicate interspecies heterogeneity in striatal DA dynamics that must be considered when extrapolating behavioral and drug responses from rodent to the primate brain. Moreover, the heterogeneity demonstrated within the primate putamen in the availability and dynamic regulation of DA may be central to understanding DA function in health, cocaine abuse, and disease.
Keywords: Parkinson's disease, basal ganglia, DA transporter, DA uptake, autoreceptor, cocaine
The putamen of the primate striatum performs major sensorimotor, cognitive, and emotive functions. A central component of the basal ganglia, the putamen receives the main corticostriatal inputs from the motor, premotor, supplementary motor, and sensorimotor cortices (Kunzle, 1975, 1977, 1978; Jones et al., 1977; Selemon and Goldman-Rakic, 1985). In turn, loss of dopaminergic innervation underlies the motor dysfunctions of Parkinson's disease (PD) (Hornykiewicz, 1966; Kish et al., 1988). Furthermore, studies using [18F]-dopa positron emission tomography imaging, HPLC, and [3H]-mazindol binding in PD and in intermediate primate 1-methyl-4-phenyl-1,2,3,6,-tetrahydropyridine (MPTP)–parkinsonism indicate that dopamine (DA) deinnervation follows a region-specific pattern of vulnerability, beginning in dorsolateral putamen (Elsworth et al., 1987; Kish et al., 1988;Moratella et al., 1992; Antonini et al., 1995). The functions of the intact putamen are topographically compartmentalized along a dorsolateral–ventromedial axis (Haber and McFarland, 1999) with respect to corticostriatal (Kunzle, 1975, 1977; Selemon and Goldman-Rakic, 1985; Goldman-Rakic and Selemon, 1986), meso/nigrostriatal (Szabo, 1980; Parent et al., 1983; Smith and Parent, 1986; Lynd-Balta and Haber, 1994), thalamostriatal (McFarland and Haber, 2000), amygdalostriatal (Russchen et al., 1985), and striatopallidal projections (Hazrati and Parent, 1992), and somatotopic organization (the activity of putaminal neurons is related to specific body parts) (Crutcher and DeLong, 1984; Alexander and DeLong, 1985). Functionally related striatal areas thus share similar afferentation, somatotopy, susceptibility of mesostriatal input to degeneration, and in addition, modulation by cocaine (Bradberry et al., 2000).
Because mesostriatal projection neurons differ in expression levels of DA regulatory proteins, e.g., D2-like receptor, DA transporter (DAT) (Shimada et al., 1992; Blanchard et al., 1994;Hurd et al., 1994; Sanghera et al., 1994; Haber et al., 1995), there may be as yet unappreciated regional differences in the regulation, and thus role, of [DA]o within primate putamen that may be of key consequence not only to normal basal ganglia function but also to modulation by substances of abuse and susceptibility to degeneration.
Fast-scan cyclic voltammetry at a carbon-fiber microelectrode offers spatially discrete observations of dynamic changes in [DA]o in “real-time” and has been used to study striatal DA mechanistics extensively in rodents [e.g., rat (Garris et al., 1994; Jones et al., 1995), mice (Giros et al., 1996;Jones et al., 1998), guinea pig (Cragg and Greenfield, 1997)] in which striatal organization differs from primates, e.g., in limbic-associated afferents and efferents (Selemon and Goldman-Rakic, 1985; Lynd-Balta and Haber, 1994; Haber and McFarland, 1999) and anatomically by division of caudate and putamen by the internal capsule. It is essential to our understanding of primate striatal DA function that we study the primate directly.
We have explored in the putamen of the nonhuman primate, the common marmoset, the dynamics of extracellular DA and regulation by firing frequency, uptake kinetics, and autoreceptors. These dynamics are compared (1) in rodents and (2) between limbic- and motor-associated subdivisions of putamen to evaluate the predictive value of nonprimate data to primates, and moreover to gain directly insights into the operation of the primate striatum in health, substance abuse, and pathology.
MATERIALS AND METHODS
Brain slice preparation. Striatal slices (400 μm) were prepared from male marmosets (age 1–2 years) from an established colony after overdose of pentobarbitone (intraperitoneal) or from male albino guinea pigs (200–350 gm) as described previously (Rice et al., 1997) in ice-cold, HEPES-buffered physiological saline saturated with 95% O2/5% CO2 and using aVibratome (Lancer Series 1000). The mid to rostral range of slices that was used corresponds to anterior–posterior (AP) 9.5–11.75 mm, marmoset (Stephan et al., 1980) and approximately A12.0–13.5 mm, guinea pig (Rapisarda and Bacchelli, 1977). All recordings were made at 31–32°C in bicarbonate-buffered artificial CSF (aCSF; 95% O2/5% CO2) as described previously (Rice et al., 1997). We defined three function-related recording sites in marmoset putamen (see Fig. 2): ventromedial (close to ventromedial edge of internal capsule), mid, and dorsolateral, which according to distinct frontal cortical inputs serve emotive/limbic-associated (orbital and medial prefrontal cortex), cognitive (dorsolateral prefrontal cortex), and sensorimotor functions, respectively (Selemon and Goldman-Rakic, 1985; Goldman-Rakic and Selemon, 1986; Haber and McFarland, 1999).
Fig. 2.
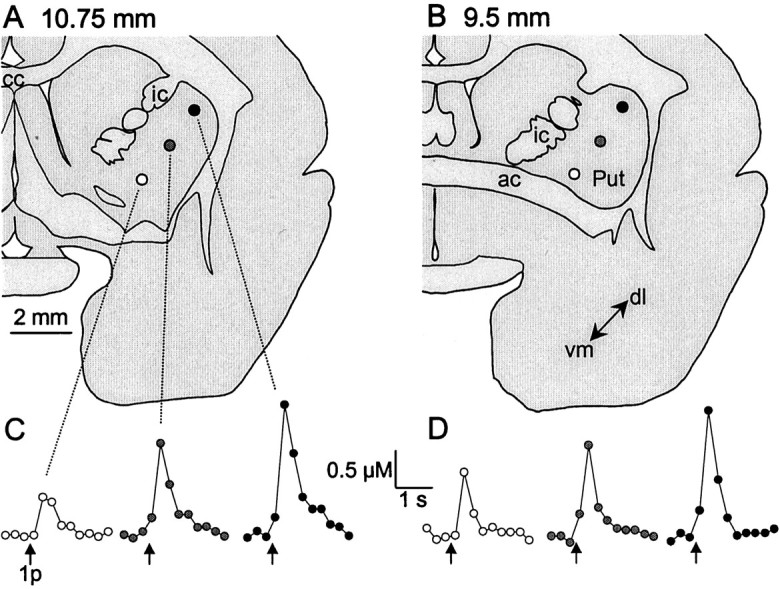
Regional variation in single pulse-evoked [DA]o between domains of marmoset putamen.A, B, Schematic illustrations of right hemispheres of coronal sections of marmoset striatum at two coordinates, 10.75 and 9.5 mm anterior to bregma, indicating typical ventromedial–dorsolateral recording sites. Lateral is to theright. cc, Corpus callosum;ic, internal capsule; ac, anterior commissure; Put, putamen. C,D, Typical y-t plots of [DA]o versus time after a single pulse (arrows) at three ventromedial–dorsolateral coordinates within single slices at each of the AP coordinates depicted inA and B. At both AP coordinates, [DA]o varies according to medial–lateral coordinates: [DA]o evoked in ventromedial putamen (open circles) are less than those in mid-putamen (gray circles), which in turn are less than in dorsolateral putamen (filled circles). Calibration: 0.5 μm, 1 sec.
Voltammetry and microelectrodes.[DA]o was measured using fast-scan cyclic voltammetry at a beveled carbon-fiber microelectrode (CFM) (diameter: tip to 6 μm; tip length: ∼30 μm; MPB Electrodes, London) using a Millar Voltammeter (PD Systems) as described previously (Cragg and Greenfield, 1997; Cragg et al., 1997; Rice et al., 1997). Scan rate was 800 V/sec; scan range was −0.7 to + 1.3 V to −0.7 V versus Ag/AgCl, and the sampling frequency was 4–8 Hz. Illustrated voltammograms are faradaic currents obtained by subtraction of background current. Identification of the released substance as DA was confirmed by comparison in situ and in DA calibration of oxidation and reduction potentials (+540 and −180 mV vs Ag/AgCl, respectively). Contributions from the monoamine oxidase (MAO)-metabolite 3,4-dihydroxyphenyl-acetic acid (DOPAC) or norepinephrine (NE) were determined as minimal from experiments including MAO-inhibition (pargyline) and NE uptake inhibition (desipramine). Electrodes were calibrated in 1–2 μm DA in aCSF. Sensitivity to DA was typically 2–7 nA/μm. The minimum detection limit for [DA]o was 20–40 nm.
Electrical stimulation. Electrical stimulation was at local, surface bipolar electrodes as described previously (Cragg and Greenfield, 1997). Stimulus pulses (0.1 msec pulse width, 10 V) were applied either singly or in trains lasting 3 sec. Some experiments used a high-intensity stimulation (100 Hz, ∼20 V, ≤0.5 sec train) to evoke high [DA]o (>10 ×Km of DAT) at which DA uptake rate,V, approaches Vmax.
HPLC analysis of striatal dopamine tissue content. After voltammetric studies, striatal tissue was subdissected in ice-cold aCSF (95% O2/5% CO2) using a tissue punch method to sample ventromedial and dorsolateral regions, snap-frozen in liquid N2, and stored at −80°C. The tissue was thawed on ice and homogenized in 50–100 vol of 0.1 mm HClO4/4.5 mm EDTA using an ultrasonic disintegrator (20 sec, SONIPREP 150) and centrifuged at 17,000 × g for 15 min (Sigma 3K10, rotor Nr 12154-N). The supernatant was eluted and centrifuged at 17,000 × g for 2 × 15 min, and the final supernatant was stored before analysis of DA content at −80°C. The HPLC consisted of a delivery pump (Pharmacia LKB 2248), a column (APEX I Octadecyl, 5 μm, 4.6 × 100 mm), and an electrochemical detector (Waters 46V) set at a potential of 0.7 V versus an Ag/AgCl reference electrode. Mobile phase consisted of 0.1m citric acid, 0.1 mNa2HPO4, pH 3.7, 2.5 mm hexanesulfonic acid/acetonitrile/methanol (92:3:5) and was pumped at 0.8 ml/min.
Data analysis. Voltammetric data were acquired and analyzed on a PC running Strathclyde Whole Cell Program (J. Dempster, University of Strathclyde, Scotland). Data simulations for kinetic analysis used software written by Prof. R. M. Wightman (University of North Carolina, Chapel Hill, NC) to fit experimental data curves (concentration vs time) with theoretical curves that simulate the concentration of DA detected ([DA]o) at a CFM probe after a single stimulus pulse and DA uptake by a transporter (DAT) operating with Michaelis–Menten kinetics (described by Km andVmax). The profile of extracellular DA released into the extracellular space because of a single pulse appears as an instantaneous concentration increase, [DA]p, followed by a rapid decline that is caused predominantly by transporter-mediated uptake (Giros et al., 1996). This profile can be described byd[DA]/dt = [DA]p−Vmax/{(Km/[DA]) + 1}. This model has been described previously in detail (Wightman and Zimmerman 1990; Kawagoe et al., 1992; Jones et al., 1995) and incorporates a correction for electrode response time caused by surface coatings or other diffusional delays and a decrease in measured response, peak [DA]o, from true value, [DA]p. Diffusional delays on these uncoated electrodes were incorporated as a function of DA diffusion through a layer equivalent to a fine Nafion coating of thickness,d = 140–230 nm, as described previously (Cragg et al., 2000). Thin-layer distance, d, for each electrode in situ was verified from control data in guinea pig striatum, from multiple best-fit simulations of several single data sets (>20), by constraining Vmax andKm to typical literature values (2400 nm/sec to 3000 nm/sec, 210 nm, respectively) (coefficient of determination,R2 > 0.9). Best-fit values of [DA]p and Vmaxwere subsequently determined with this mean, constant d, in guinea pig caudatoputamen (CPu) and marmoset putamen. Minimum values ofVmax yieldingR2 > 0.9 were used to provide the most conservative estimate in marmoset. Small changes in variable parameter values could sometimes give equal degrees of fit (equivalentR2). Both sets were included for analysis; n = number of simulations. Data simulations were undertaken blind with respect to recording site.
The assumed value of the DAT Km for both species was the rodent literature value of 210 nm. Although phylogenic conservation ofKm has not been directly demonstratedin situ, the DAT itself is strongly conserved: rat and mouse DAT are ≥92% homologous to human DAT, differing by only one amino acid (Giros et al., 1992; Wu and Gu, 1999). Furthermore, when cloned DAT are expressed stably in cell lines, the absolute potencies (Ki) of psychostimulants (e.g.,d-amphetamine) are highly correlated for rat and human DAT (Giros et al., 1992), and values ofKm (although different from those observed in situ) are similar for mouse and human (Wu and Gu, 1999).
Data are mean ± SEM, and sample size, n, is the number of recording sites unless stated otherwise. The number of animals in each sample ranges from 3 to 10. Comparisons for differences in means were assessed by one- or two-way ANOVAs and post hocmultiple comparison t tests (Neuman–Keuls). In pulse train experiments, ti is the time of initial peak [DA]o, andtss is the period during a control stimulation train when [DA]o is typically at steady state. Note, steady state does not necessarily occur when uptake or autoreceptors are overridden by antagonists and/or at some high frequencies. CPu is guinea pig caudatoputamen, and putamen refers only to marmoset.
Solutions. All drugs and solutions were obtained from Sigma (St. Louis, MO) except GBR 12909 (RBI, Natick, MA) and TTX (Tocris). In Ca2+-free solutions, CaCl2 was substituted with equimolar MgCl2.
RESULTS
Identification of evoked release of DA
A single, electrical stimulus pulse in marmoset putamen evoked the rapid release and removal of the electroactive substance DA (Fig.1A). The substance was identified as DA by a characteristic voltammogram with peak potentials for oxidation (∼500 mV) and reduction currents (approximately −200 mV vs Ag/AgCl) that are identical for exogenously applied DA and DA signals obtained in guinea pig and rat CPu here and previously (Fig.1A) (Cragg and Greenfield, 1997; Cragg et al., 2000). The metabolite DOPAC did not contribute significantly to evoked signals: inhibition of monoamine oxidases A and B for up to 5 hr (pargyline, 20 μm) had no effect on the magnitude of signal observed (n = 4; data not illustrated).
Fig. 1.

Basic characteristics of evoked release of striatal DA. A, Typical voltammograms obtained after a single pulse in marmoset putamen (Marmoset Put) and guinea pig CPu (gray lines) and in the presence of applied DA (1 μm, black line). Peak oxidation and reduction potentials for DA (approximately +500 mV and −180 mV, respectively, vs Ag/AgCl) are indicated by dashed lines. Calibration, 2 nA. B, Mean plots of [DA]o versus time evoked by a single pulse (arrow, 0.1 msec) in marmoset mid-putamen (●,n = 19) and guinea pig mid-CPu (▵,n = 23). Peak [DA]o is significantly greater in marmoset putamen. C, Mean peak [DA]o versus stimulation intensity (V) in marmoset putamen and guinea pig CPu. Release is voltage dependent in both species (one-way ANOVAs,p < 0.001, hyperbolic curve fitsR2 > 0.97). [DA]ois greatest in marmoset putamen at each voltage tested (4 <n < 23). **p < 0.01, ***p < 0.001.
Release was abolished in a reversible manner in Ca2+-free/Mg2+-substituted media (n = 3; data not illustrated) or in the presence of TTX (1 μm) (n = 3; data not illustrated). Mean peak [DA]o evoked by a single pulse (0.1 msec) was significantly greater in mid-putamen (Fig.1B) (1.0 ± 0.04 μm,n = 19) than in guinea pig mid-CPu (0.48 ± 0.03 μm, n = 23, p< 0.001). [DA]o in guinea pig is equivalent to that observed in the rat with the same stimuli in this experimental setup (data not illustrated). This approximately twofold difference in [DA]o attributable to a single stimulus pulse in primate versus rodent striata was not caused by an overall difference in voltage sensitivity: the difference was maintained across a range of stimulus voltages tested (Fig. 1C) (two-way ANOVA, F(1,42) = 220.1,p < 0.001; post hoc t tests, putamen vs CPu, p < 0.001–0.01). The stimulation intensity used in all subsequent experiments was approximately half-maximal in both species.
Regional variation in single pulse-evoked [DA]obetween striatal domains
The evoked [DA]o observed in marmoset mid-putamen (Fig. 1) was not representative of those seen throughout the putamen: there was significant regional variation in evoked [DA]o within marmoset putamen attributable to the ventromedial–dorsolateral (Fig.2) (two-way ANOVA,F(2,46) = 18.8, p < 0.001) but not the anterior–posterior coordinate (two analysis groups: anterior, A10.5–11.5 mm; posterior, A9.5–10.5 mm). Evoked [DA]o in dorsolateral putamen was typically 1.5- to twofold greater than in mid-putamen and two to three times greater than that released ventromedially throughout the anterior–posterior range of putamen investigated (Fig. 2) (n = 4–22).
When data from the anterior–posterior range of putamen investigated were collated, the mean peak [DA]o values evoked by a single pulse in three regions along the ventromedial–dorsolateral axis were all significantly different from each other (Fig. 3A) (post hoc t tests, all p< 0.001, n = 11–30): ventromedial, 0.63 ± 0.06 μm; mid (as Fig. 1), 1.0 ± 0.03 μm (159% of ventromedial); and dorsolateral, 1.86 ± 0.13 μm (296% of ventromedial).
Fig. 3.

Regional variation in [DA]o in marmoset versus guinea pig striata. A, B, Mean [DA]o versus time evoked by a single pulse (arrows) at varying ventromedial (vm) to dorsolateral (dl) coordinates in (A) marmoset putamen and (B) guinea pig CPu. A, In marmoset putamen, lateral variation in [DA]o over a threefold range of concentration (one-way ANOVA,F(2,57) = 3.16, p< 0.001) was attributable to significant differences between each of the three regions. ***p < 0.001 versus ventromedial unless indicated otherwise; post hoct tests. B, In guinea pig CPu, there was a small but significant lateral variation in peak [DA]oover only a 1.5-fold concentration range (one-way ANOVA,F(2,47) = 3.2, p < 0.001) because of significant differences between each of the three regions. *p < 0.05, ***p < 0.001 versus ventromedial unless indicated otherwise; post hoct tests. C, Comparison of mean peak [DA]o evoked by a single pulse in marmoset putamen versus guinea pig CPu at each ventromedial–dorsolateral coordinate indicates differences attributable both to species (two-way ANOVA, F(1,103) = 62.03,p < 0.001) and region (two-way ANOVA,F(2,103) = 25.78, p< 0.001). [DA]o is greater in marmoset putamen than guinea pig CPu at all loci. **p < 0.01, ***p < 0.001 versus guinea pig; post hoct tests. Effect of lateral coordinate is most pronounced in marmoset. Inset numbers are [DA]o expressed as a percentage of ventromedial in that species.
This gradient in evoked [DA]o cannot be fully appreciated with a typical rodent model (Fig.3B,C). There was significant regional variation in [DA]o evoked within guinea pig CPu along a ventromedial–dorsolateral axis (Fig.3B) (one-way ANOVA, F(2,47)= 3.2, p < 0.001). However, although the concentration gradient detected in marmoset putamen was over a 300% concentration range (micromolar), the heterogeneity in [DA]o in guinea pig CPu was only over half the range (nanomolar) (Fig. 3). Mean peak [DA]o values evoked in guinea pig CPu were ventromedial, 0.38 ± 0.03 μm; mid (as Fig. 1), 0.48 ± 0.03 μm (126% of ventromedial,p < 0.001, post hoc t test); and dorsolateral, 0.60 ± 0.05 μm (158% of ventromedial, p < 0.001).
Evoked [DA]o in marmoset putamen is significantly greater than in guinea pig CPu at all corresponding loci, ranging from 166 ± 16% (ventromedial, p < 0.01,post hoc t tests) to 310 ± 22% of CPu (dorsolateral, p < 0.001).
Striatal DA content
In marmoset striatum, DA content was highest in the dorsolateral halves of the putamen and caudate (Fig.4) (145% and 154% of ventromedial areas, respectively). DA contents of dorsolateral and ventromedial caudate and putamen were all significantly higher than most ventromedially, in the nucleus accumbens (Fig. 4A) (one-way ANOVA, F(4,10) = 10.16,post hoc Student Newman–Keuls, p < 0.01–0.05). DOPAC content, although higher in the dorsolateral region of both the caudate and putamen (118 and 114% of ventromedial areas, respectively), was not significantly different from levels observed in the accumbens (Fig. 4B). Ratios of DA/DOPAC content ranged from ∼5 to 11.
Fig. 4.

DA and DOPAC content of marmoset striatum.A, DA content in pmol/mg (wet weight). Dopamine content in the dorsolateral and ventromedial caudate and putamen were significantly higher than those levels observed in the nucleus accumbens (NAcc) (one-way ANOVA;F(4,10) = 10.16, followed by Student Newman–Keuls, **p < 0.01, *p< 0.05, c.f. nucleus accumbens). There is a clear trend toward higher levels in dorsolateral compared with ventromedial regions.B, DOPAC content in pmol/mg (wet weight). DOPAC content did not vary significantly between regions, although lower levels in the accumbens and higher levels in the dorsolateral regions paralleled the pattern observed in DA content.
DA uptake pharmacology
DA uptake by the DAT avidly regulated the extracellular concentration and lifetime of DA in marmoset putamen (Fig.5A): after a single pulse during competitive inhibition of the DAT by GBR 12909 (500 nm), the extracellular lifetime and, in turn, availability (peak [DA]o), across putamen were significantly elevated [[DA]o: one-way ANOVA,F(1,24 = 24.4, p < 0.001, n = 12 (four applications)]. Desipramine (300 nm), an uptake inhibitor selective for the NE transporter (NET), had no significant effect on extracellular lifetime or [DA]o (Fig. 5B) [n = 9 (three applications)], thus confirming that the substance measured was not NE.
Fig. 5.

DA uptake: pharmacology and modeling.A, B, Mean [DA]o versus time evoked by a single pulse (arrows) in marmoset putamen in control and in the presence of an uptake inhibitor for (A) DA (GBR 12909, 500 nm,squares) or (B) norepinephrine (desipramine, 300 nm, triangles).A, GBR 12909 slowed rate of removal and significantly enhanced [DA]o in putamen (n = 12, ***p < 0.001). B, Desipramine had no effect on peak [DA]o or removal rate (n = 9). C, Data simulations for determination of Vmax and [DA]p. Typical simulated data curves (see Materials and Methods) superimposed on raw data points of a single observation in dorsolateral putamen (dl put) caused by a single pulse (arrow). Simulated data describe the [DA]o detected after release of DA caused by a single pulse ([DA]p) and removal by transporter-mediated uptake operating with Michaelis–Menten kinetics, with (solid curve) and, for comparison, without (dotted curve) a delay attributable to electrode response time (see Materials and Methods). In this example,R2 = 0.98, d= 155 nm, Km = 210 nm; phase delay between stimulation and scan was 20 msec. D,E, Graphs of mean Vmax and [DA]p of simulations in (D) guinea pig CPu and (E) marmoset putamen across a ventromedial (v-m) through dorsolateral (d-l) axis. D, There is a small but significant increase in [DA]p but notVmax with increasing dorsolateral coordinate in guinea pig CPu (one-way ANOVA,F(2,74) = 3.12, *p< 0.05, **p < 0.01; post hoct tests). E, Both [DA]p andVmax increase significantly with each increase in dorsolateral coordinate in marmoset putamen (**p < 0.01, ***p < 0.001;post hoct tests). All values of [DA]p and Vmax in marmoset putamen are significantly greater than in corresponding regions in guinea pig CPu (p < 0.001).F, Plots of Vmax versus [DA]p indicate significant positive correlations (lines) for both marmoset putamen (circles) and guinea pig CPu (triangles) (r = 0.82 and 0.57, respectively,p < 0.001). G, Typical decay phases of [DA]o after high-intensity stimulation to large [DA]o in marmoset mid-putamen and guinea pig CPu using the same electrode. At large [DA]o, clearance rate approaches Vmax (i.e., zero order). Direct comparison of approximate, zero order clearance rates (dotted lines) at the same range of [DA]o with the same electrode (d = 215; see Materials and Methods) indicates an approximately twofold greater clearance rate in marmoset mid putamen than in guinea pig CPu.
DA uptake and release: Vmax and [DA]p from data modeling
Each experimental observation of [DA]o was modeled with simulations of Michaelis–Menten kinetics to evaluateVmax of the DAT and [DA]p (Fig. 5C). For each accepted simulation, R2 was >0.9. [DA]p varied significantly ventromedially–dorsolaterally in parallel with [DA]o, both in guinea pig CPu (Fig.5D) [0.93 ± 0.04 μm(ventromedial) to 1.15 ± 0.06 μm(dorsolateral), one-way ANOVA, F(2,74)= 3.12, p < 0.01)] and in marmoset putamen (Fig.5E) [1.45 ± 0.07 μm(ventromedial) to 3.38 ± 0.20 μm(dorsolateral), one-way ANOVA, F(2,75= 3.12, p < 0.001], and also between species (two-way ANOVA, F(1,148 = 189.7,p < 0.001).
Best-fit estimates of Vmax were not significantly different between regions in guinea pig CPu (Fig.5D) [2.52 ± 0.09 μm/sec (ventromedial) to 2.84 ± 0.10 μm/sec (dorsolateral), n = 23–30], but there was large, significant variation between regions in marmoset putamen (Fig.5E) [3.27 ± 0.13 μm/sec (ventromedial) to 5.02 ± 0.16 μm/sec (dorsolateral), one-way ANOVA, p < 0.001]. Two-way ANOVA revealed a significant difference inVmax between species (p < 0.001,F(1,148 = 251.5) at all corresponding loci (post hoc t tests, p< 0.001). Vmax was positively correlated with [DA]p in both marmoset putamen (Fig. 5F) (Pearson test, p < 0.001,r = 0.82) and guinea pig CPu (p< 0.001, r = 0.57). The plot of marmoset data appears to be an extrapolation of the plot of guinea pig data.
By applying a high-intensity stimulation, [DA]ocan become sufficiently high (≫Km of the DAT) such that the DAT becomes saturated, and thus clearance rate of DA approachesVmax (i.e., zero order, independent of [DA]o and constant with time). This method was used to obtain approximately linear clearance rates (−d[DA]o/dt) at similar [DA]o in guinea pig and marmoset to provide an additional, comparative measure of V approachingVmax, without dependence onKm. Using the same electrode (and therefore standardized response times), the clearance rate after high-intensity stimulation was approximately linear above low micromolar concentrations in both striata and, in support of theVmax derived by data simulations, was approximately twofold greater in marmoset than guinea pig striata over the same range of [DA]o (n = 11–13) (Fig. 5G).
Frequency sensitivity of [DA]o during pulse trains
[DA]o was compared in ventromedial versus dorsolateral marmoset putamen (and guinea pig CPu) during pulse trains (3 sec duration), over a range of frequencies (2–20 Hz) at which DA neurons may fire action potentials in situ (Grace and Bunney, 1983, 1984a,b; Schultz et al., 1983; Schultz, 1984, 1986). Evoked [DA]o in marmoset peaked rapidly (t = 0.5 sec, ti) after the start of the stimulus to a concentration resembling that observed after a single pulse (Fig. 3) and subsequently either declined to, remained constant at, or increased to a steady-state concentration (at time, tss = 2–3 sec) depending on frequency and region (Fig.6A,B). Steady-state [DA]o attained during pulse trains was a function both of frequency of stimulation (Fig. 6C) (two-way ANOVA, F(3,33) = 31.6,p < 0.001) and of region (Fig. 6C) (two-way ANOVA, F(1,33) = 4.4, p < 0.05). In ventromedial, limbic-associated putamen, each increase in stimulation frequency (>2 Hz) significantly increased steady-state [DA]o (compared with previous frequency) (Neuman–Keuls t test, p < 0.001–0.05). In dorsolateral motor putamen, each increase in stimulation frequency significantly increased steady-state [DA]o(compared with previous frequency) up to 10 Hz (Neuman–Keuls,p < 0.001–0.01): at 20 Hz, no further increase in [DA]o was observed. [DA]o was frequency dependent in guinea pig CPu, with significant increases observed after each increase in stimulation frequency up to 20 Hz (Fig. 6C) (Neuman–Keuls,p values < 0.001–0.01, n = 3–4).
Fig. 6.

Frequency–sensitivity of steady-state [DA]o during pulse trains. A,B, Plots of [DA]o versus time during 3 sec stimulation trains (stim, solid bar) over a range of frequencies (2–20 Hz) in (A) dorsolateral and (B) ventromedial putamen, 4 < n < 8. SEMs are excluded for clarity. Steady-state [DA]o (attss) varies differently with frequency in each domain. C, The relationship between [DA]o and frequency compared in dorsolateral (dl) and ventromedial (vm) putamen (Put) and guinea pig CPu. Steady-state [DA]o is a function of frequency of stimulation (two-way ANOVA, F(3,41) = 33.9,p < 0.001) and region (F(2,41) = 4.4, p< 0.01). In dorsolateral putamen, each increase in frequency (up to 10 Hz) significantly increased [DA]o attss (post hoc t tests, p < 0.001–0.01,n = 5–8); in ventromedial putamen, [DA]o increased with each frequency above 2 Hz (p < 0.01–0.05, n = 4–7); in guinea pig CPu, [DA]o attss increased with each frequency (p < 0.001–0.01, n = 3–4). Steady-state [DA]o in dorsolateral was significantly greater than in ventromedial putamen at frequencies <10 Hz and yet significantly less at 20 Hz (**p < 0.01). Steady-state [DA]o values in guinea pig CPu were significantly less than in dorsolateral putamen at frequencies <20 Hz (††p < 0.01 to †p < 0.05), and less than in ventromedial putamen only at frequencies >10 Hz (‡p < 0.05). D, Comparison of [DA]o versus time during 3 sec stimulation trains at 10 Hz in different domains. At 10 Hz, [DA]o attss does not differ between any region of putamen (ventromedial, mid, and dorsolateral) despite significant variation in initial [DA]o (at timeti) between all three regions (t tests, p < 0.001–0.05,n = 9–15). During 10 Hz stimulation in guinea pig CPu, steady-state [DA]o is significantly less than in all three regions of marmoset (p < 0.001,n = 14); peak [DA]o atti is significantly less than in dorsolateral and mid (p < 0.001) but not ventromedial putamen. *p < 0.05 and ***p < 0.001 indicate comparison versus ventromedial putamen.
Consistent with the regional difference in [DA]o observed after a single pulse, [DA]o at tss in dorsolateral putamen was significantly greater (approximately twofold) than in ventromedial putamen at all low frequencies (<10 Hz) (t tests, p < 0.01, n = 3–6). However, at 10 Hz, steady-state [DA]o in dorsolateral putamen was not different from ventromedial (Fig.6C,D) (n = 15,9), and conversely, at 20 Hz, “steady-state” [DA]o in ventromedial putamen was significantly greater than in dorsolateral putamen (p < 0.01, n = 5). As a reference point, steady-state [DA]o in guinea pig CPu was significantly less than in dorsolateral marmoset putamen at all frequencies <20 Hz (p < 0.001–0.01) and less than in ventromedial putamen at frequencies ≥10 Hz (p < 0.01–0.05).
[DA]o at tssversus ti
At a stimulation frequency of 10 Hz, [DA]oin marmoset putamen reaches a steady state at a concentration that does not differ between any region of putamen (ventromedial, mid, and dorsolateral) (Fig. 6C,D) (range 0.77 ± 0.09 μm to 0.97 ± 0.09 μm, n = 9–15). On the other hand, initial peak [DA]o (atti) is markedly different in all three regions (post hoc t tests,p < 0.001–0.05) as demonstrated previously for single-pulse studies (Figs. 1-3). Thus, the relationship between [DA]o at ti versustss is apparently regulated differently in each region: initial [DA]o at ti(or [DA]p in single pulse studies) does not predict steady-state [DA]o maintained at this or higher (Fig. 6B, 20 Hz) frequencies. In other words, release must be controlled differently during ongoing depolarization in ventromedial versus dorsolateral putamen (see below). By comparison, during 10 Hz stimulation in guinea pig mid-CPu, steady-state [DA]o is significantly less than in all three regions of marmoset (t tests, p< 0.001, n = 14), despite equivalent [DA]o at ti to ventromedial putamen.
Regulation of net [DA]o at physiological firing rate in marmoset putamen: uptake
During a train of stimulus pulses, autoregulatory processes, such as autoreceptor feedback and DA uptake between pulses, regulate net [DA]o (Wightman and Zimmerman 1990; Limberger et al., 1991; Kawagoe et al., 1992; Cragg and Greenfield, 1997). In the case of autoreceptors, regulation is different at ti andtss (Trout and Kruk 1992; Cragg and Greenfield, 1997). The mechanisms by which steady-state [DA]o is regulated in primate striatum were explored further in ventromedial and dorsolateral marmoset putamen at the frequency (10 Hz) at which steady state [DA]o values were similar. By inhibiting DA uptake, GBR 12909 (500 nm) significantly enhanced [DA]o (at tss) evoked by a 10 Hz stimulation train in both ventromedial and dorsolateral regions of marmoset putamen (Fig.7A) (1723 ± 177 and 1666 ± 81%, respectively, n = 4, ttests p < 0.001 in both regions). Although in control, steady-state [DA]o in dorsolateral versus ventromedial putamen is not significantly different, in the presence of GBR 12909, [DA]o attss was slightly but significantly greater in dorsolateral than ventromedial putamen (Fig.7A,B) (p < 0.001). However, the ratio of dorsolateral to ventromedial [DA]o at tss did not approach the ratio seen at ti (Fig.7B). Given this discrepancy in ratios atti versustss, an additional mechanism or mechanisms must be differently operational in the regulation of [DA]o at ti versustss.
Fig. 7.

Regulation of steady-state [DA]o by uptake and autoreceptors. A,C, Mean [DA]o versus time during 3 sec stimulation trains (10 Hz, solid bar) in ventromedial (vm) and dorsolateral (dl) marmoset putamen in control (circles) and in the presence (squares) of the (A) DA uptake inhibitor GBR 12909 (500 nm) or (C) autoreceptor antagonist sulpiride (1 μm). B, D, Ratio of [DA]o in dorsolateral versus ventromedial putamen atti and attss in controls and (B) GBR 12909 or (D) sulpiride. A, GBR 12909 significantly enhanced evoked [DA]o throughout putamen (n = 4, ***p < 0.001, cf. controls). B, The ratios of [DA]o in dorsolateral versus ventromedial putamen illustrate that [DA]o in control is significantly greater in dorsolateral than ventromedial putamen atti but nottss (as in Fig.6D), unless GBR 12909 is present: [DA]o at tss in GBR is slightly but significantly greater in dorsolateral than ventromedial putamen (***p < 0.001 vs ventromedial). The ratio of dorsolateral to ventromedial [DA]o attss in GBR 12909 remains less than the ratio observed in control at ti(dotted line). C, Sulpiride significantly enhanced evoked [DA]o throughout putamen (n = 7, ***p < 0.001, cf. controls) after 0.5 sec of stimulation (see also Cragg and Greenfield, 1997). (d) The ratios of [DA]o in dorsolateral versus ventromedial putamen illustrate that [DA]o at tss becomes significantly greater in dorsolateral than ventromedial putamen when in the presence of sulpiride (***p < 0.001 vs ventromedial). The ratio of dorsolateral to ventromedial [DA]o at tss in sulpiride approaches the ratio observed in control atti (dotted line).
Regulation of [DA]o at physiological firing rate in marmoset putamen: autoreceptors
By inhibiting presynaptic D2-like autoreceptors, sulpiride (1 μm) significantly enhanced [DA]o evoked by a 10 Hz stimulation train after >0.5 sec of stimulation in both ventromedial and dorsolateral regions of marmoset putamen (Fig. 7C) to 283 ± 54 and 453 ± 60%, respectively (n = 7, p < 0.001 in both cases). Note that initial [DA]o<0.5 sec (and single pulse-evoked [DA]o, data not illustrated) is not controlled by autoreceptors. Autoreceptors are not constitutively activated at rest in vitro in slice preparations either of rodents (Trout and Kruk, 1992; Cragg and Greenfield, 1997), or as now demonstrated here, of the marmoset (Fig.7C). Although in control, net steady-state [DA]o in dorsolateral versus ventromedial putamen is not significantly different, in the presence of sulpiride, [DA]o at tss was significantly greater in dorsolateral than ventromedial putamen (Fig.7C,D) (p < 0.001). The ratio of dorsolateral to ventromedial [DA]o attss approached the ratio seen atti (Fig. 7D).
DISCUSSION
This study demonstrates how extracellular DA is dynamically controlled in the primate putamen and how such DA dynamics differ between limbic- and motor-associated domains. These findings not only lend themselves to an understanding of striatal DA signaling in the primate brain, but they also may be central to understanding the effects of cocaine and regional vulnerability to DA loss in PD (Hornykiewicz, 1966; Elsworth et al., 1987; Kish et al., 1988;Moratella et al., 1992; Antonini et al., 1995). For example, such regional heterogeneity in DA homeostasis may clearly be accompanied by regional vulnerability to DA-related mechanisms of parkinsonian cell death such as DA-dependent oxidative stress and vulnerability to DAT-dependent toxins (Olanow and Tatton, 1999).
Characteristics and regional heterogeneity in single pulse-evoked [DA]o
DA was released from marmoset putamen and guinea pig CPu by voltage-sensitive Na+ channel- and Ca2+-dependent exocytotic-like mechanisms, but with a two- to threefold species difference in [DA]o. Because mean tissue DA content of marmoset putamen was approximately double the documented levels in guinea pig CPu (Wetherell et al., 1989), these (and other, see below) data together suggest a species difference in striatal innervation or DA packing density. Phylogenic differences in extent and density of DA innervation have been observed previously in cerebral cortex (Berger et al., 1991). How interspecies variation in DA availability/packing density impinges on postsynaptic neuromodulation will further depend on receptor expression levels, affinities, and effector coupling.
Furthermore, [DA]o was a function of the ventromedial–dorsolateral domain: [DA]o in dorsolateral, motor-related putamen was 300% of that in ventromedial, limbic-associated putamen. This extent of variation was not predicted from guinea pig CPu data (only ∼150% variation). However, variations in [DA]o within primate putamen mirror the variations in basal [DA]o along a parallel axis within the caudate of rhesus monkeys (Bradberry et al., 2000), and because they reflect, at least in part, tissue DA content, are probably caused by variable DA innervation or other packing density.
DA uptake and release: Vmax and [DA]p from data modeling
DAT, a major site of action for psychostimulants (e.g., cocaine, amphetamine) (Giros et al., 1996), and not the NET, was pivotal in determining [DA]o and lifetime in marmoset putamen as previously defined in rodent CPu (Giros et al., 1996). Data simulations of release and Michaelis–Menten uptake revealed that not only [DA]p (consistent with [DA]o) but alsoVmax varied significantly within the putamen. This was not the case in rodent CPu: a small regional variation in [3H]-mazindol binding density (Marshall et al., 1990; Cline et al., 1995) was reflected in only a trend toward variation in Vmax. Because Vmax is a function of the concentration (and turnover number) of the DAT, greaterVmax values in dorsolateral primate putamen indicate greatest concentrations of the DAT in motor (PD susceptible) striatum. This hypothesis is strongly supported by (1) a similar ventromedial–dorsolateral gradient of density of [3H]-cocaine-binding and [3H]-CFT (WIN 35,428)-binding sites (25–40% elevation dorsolaterally) in the putamen of squirrel monkeys (Kaufman and Madras, 1991, 1992; Madras and Kaufman, 1994), (2) the regional neurotoxicity of the DAT substrate, 1-methyl-4-phenyl-pyridinium (MPP+)/MPTP (Elsworth et al., 1987; Moratella et al., 1992), and (3) DAT mRNA expression levels in dorsolateral- versus ventromedial-projecting mesostriatal cells (Shimada et al., 1992; Blanchard et al., 1994; Hurd et al., 1994;Sanghera et al., 1994; Haber et al., 1995). Furthermore, concurrent elevations of Vmax, [DA]p, and DA content in dorsolateral putamen are consistent not only with increased DAT expression but also with increased axonal density.
Vmax (and pseudolinear, zero-order clearance rates) in marmoset putamen were approximately double corresponding values in rodent CPu in this study and previously in ratin vitro (Jones et al., 1995; Cragg et al., 2000). Comparative data are not yet available regarding DAT expression level or turnover number (molecules transported per transporter per second) in both species; however, the correlated elevation ofVmax with [DA]p supports the hypothesis of greater DA innervation density in primate striatum. Species variations in [DA]o and Vmaxhave important consequences for extrapolation of sensitivity to therapeutic, abused, and toxic drugs that require access to the DAT. Higher doses of the psychostimulants cocaine andd-amphetamine/methamphetamine are routinely required in rodents than in primates for experimental and neurotoxic actions (Davis et al., 1978; Melega et al., 1998); although they are caused in part by differing drug metabolism (Melega et al., 1998), dose differences may also result from underlying variation in DAT [or DAT/VMAT (Miller et al., 1999)] activity.
Frequency sensitivity
[DA]o evoked by pulse trains better reflects the integrated dynamics occurring during ongoing neuronal firing in situ. Mesostriatal DA neurons in vivodemonstrate two modes of spontaneous neuronal discharge: single spiking at low, irregular frequencies (0.5–8 Hz) or bursts with interspike rates of ∼13–20 Hz (or instantaneously higher, task-related) (Aghajanian and Bunney, 1973; Bunney et al., 1973; Grace and Bunney, 1983, 1984a,b; Schultz et al., 1983; Schultz, 1986). There were notable differences in frequency–sensitivity of steady-state [DA]o between functional domains. At low frequencies (5 Hz), regional (and species) differences in [DA]o paralleled those observed in single-pulse studies. However, at high frequencies (>10 Hz), when the ability to remove extracellular DA between pulses and neuronal repolarization rate become limiting in the control of [DA]o, net [DA]o in ventromedial putamen exceeded those dorsolaterally. This behavior is not clearly any simple concentration–response function of initial [DA]o because steady-state [DA]o values in ventromedial putamen also greatly exceeded those in guinea pig CPu despite equivalent initial [DA]o.
This difference in frequency–sensitivity of [DA]o within primate putamen indicates that despite an increased DA availability in dorsolateral putamen indicated by single-pulse studies and DA content, the largest range of [DA]o occurs paradoxically in limbic rather than motor striatum. Similar findings have been described in rat for CPu versus nucleus accumbens (NAc) in vitro (Trout and Kruk, 1992). These differences may thus reflect as yet unclarified differences between mesolimbic versus motor-associated DA projections that are common across species in the regulation of releasable transmitter pools, presynaptic excitability/repolarization (Jackson, 1995; Meir et al., 1999), and/or differential regulation of [DA]o by the presynaptic mechanisms described below. Intriguingly, Horvitz (2000) has speculated that rigid homeostatic control of [DA]o in sensorimotor striatum would permit temporal precision that is suited to facilitate switching of response components of a behavioral act. In contrast, limbic-associated target sites associated with motivational, mood states or working memory might require less temporal precision in control of [DA]o and even a sustained accumulation of [DA]o.
Regulation of [DA]o at physiological firing rate by uptake and autoreceptors
Both DA uptake and autoreceptor control of release were powerful regulatory mechanisms of net [DA]o at a physiological firing rate in marmoset putamen, as previously observed in rodent striata (Wightman and Zimmerman, 1990; Limberger et al., 1991; Kawagoe et al., 1992; Cragg and Greenfield, 1997; Cragg et al., 1997). Furthermore, both mechanisms demonstrated a ventromedial–dorsolateral variation in activity between putaminal domains. Intriguingly, despite the higher DA content and single pulse-evoked [DA]o in the region most susceptible to deinnervation in PD (dorsolateral putamen), [DA]o is in fact most restricted in this region by these presynaptic homeostatic mechanisms.
Stricter homeostatic control of [DA]o by uptake in dorsolateral putamen is in agreement with the elevatedVmax of the DAT that we report, and yet an increase in DA transmission in mesostriatal circuits by cocaine, caused at least in part by inhibition of the DAT (Roberts et al., 1977;Ritz et al., 1987; Volkow et al., 1997), is most pronounced in vivo in ventromedial striatum of primates (Bradberry et al., 2000) and rodents (Carboni et al., 1990; Cass et al., 1992; Kuczenski and Segal, 1992). Thus, although the reinforcing effects of cocaine may not depend solely on DAT inhibition (Rocha et al., 1998), the magnitude of elevation of striatal [DA]o by cocaine may depend not only on DAT inhibition but also on the activities of mesostriatal and regulatory afferent projections and other mechanisms of control of [DA]o. For example, our finding that autoreceptor control is also less stringent in ventromedial putamen, consistent with lower D2-dopamine receptor mRNA levels in mesolimbic projections (Hurd et al., 1994;Haber et al., 1995) (and less stringent homeostatic regulation of [DA]o at high depolarization frequencies), may thus be one such factor contributing to the loci of cocaine effect.
Conclusions
By investigating the dynamic control of [DA]o within the marmoset putamen, we have determined for the first time features of the release, uptake, and autoreceptor control of DA in the nonhuman primate putamen. A basic finding that emerges is that striatal DA dynamics and inter-regional variation in primates can only be partly appreciated with a rodent scenario. Extrapolation to primates must take into account these differences in availability and extracellular dynamics of DA.
Moreover, we have illustrated how, in primate striatum, different functional striatal domains are differentiated by heterogeneous regulation of [DA]o. The regional differences in DA dynamics observed here between limbic- and motor-associated functional domains of the intact putamen known to be differently susceptible to both modulation by cocaine and degeneration in PD may thus be of key consequence not only to the normal functioning of the striatum but also in drug abuse and susceptibility to degeneration.
Footnotes
S.J.C. was funded by an E. P. Abraham Research Fellowship (Keble College, Oxford) and Novartis Pharma; C.J.H. was funded by Synaptica Ltd. We thank Dr. A. Whatham, Dr. J. Roeper, E. Mann, P. W. Tynan, and E. Howse for their contributions, advice, and technical assistance.
Correspondence should be addressed to Dr. S. J. Cragg, University Department of Pharmacology, Oxford OX1 3QT, UK. E-mail:stephanie.cragg@pharm.ox.ac.uk.
REFERENCES
- 1.Aghajanian GK, Bunney BS. Central dopaminergic neurons: neurophysiological identification and responses to drugs. In: Snyder SH, Usdin E, editors. Frontiers in catecholamine research. Pergamon; London: 1973. pp. 643–648. [Google Scholar]
- 2.Alexander GE, DeLong MR. Microstimulation of the primate neostriatum: II. Somatotopic organization of striatal microexcitable zones and their relation to neuronal response properties. J Neurophysiol. 1985;53:1433–1446. doi: 10.1152/jn.1985.53.6.1417. [DOI] [PubMed] [Google Scholar]
- 3.Antonini A, Vontobel P, Psylla M, Gunther I, Maguire PR, Missimer J, Leenders KL. Complementary positron emission tomographic studies of the striatal dopaminergic system in Parkinson's disease. Arch Neurol. 1995;52:1183–1190. doi: 10.1001/archneur.1995.00540360061017. [DOI] [PubMed] [Google Scholar]
- 4.Berger B, Gaspar P, Verney C. Dopaminergic innervation of the cerebral cortex: unexpected differences between rodents and primates. Trends Neurosci. 1991;14:21–27. doi: 10.1016/0166-2236(91)90179-x. [DOI] [PubMed] [Google Scholar]
- 5.Blanchard V, Raisman-Vozari R, Vyas S, Michel PP, Javoy-Agid F, Uhl G, Agid Y. Differential expression of tyrosine hydroxylase and membrane dopamine transporter genes in subpopulations of dopaminergic neurons of the rat mesencephalon. Mol Brain Res. 1994;22:29–40. doi: 10.1016/0169-328x(94)90029-9. [DOI] [PubMed] [Google Scholar]
- 6.Bradberry CW, Barrett-Larimore RL, Jatlow P, Rubino SR. Impact of self-administered cocaine and cocaine cues on extracellular dopamine in mesolimbic and sensorimotor striatum in rhesus monkeys. J Neurosci. 2000;20:3874–3883. doi: 10.1523/JNEUROSCI.20-10-03874.2000. [DOI] [PMC free article] [PubMed] [Google Scholar]
- 7.Bunney BS, Walters JR, Roth RH, Aghajanian GK. Dopaminergic neurons: effect of antipsychotic drugs and amphetamine on single cell activity. J Pharmacol Exp Ther. 1973;185:560–571. [PubMed] [Google Scholar]
- 8.Carboni E, Tanda GL, Frau R, Di Chiara G. Blockade of the noradrenaline carrier increases extracellular dopaine concentrations in the prefrontal cortex: evidence that dopamine is taken up in vivo by noradrenergic terminals. J Neurochem. 1990;55:1060–1070. doi: 10.1111/j.1471-4159.1990.tb04599.x. [DOI] [PubMed] [Google Scholar]
- 9.Cass WA, Gerhardt GA, Mayfield RD, Curella P, Zahniser NR. Differences in dopamine clearance and diffusion in rat striatum and nucleus accumbens following systemic cocaine administration. J Neurochem. 1992;59:259–266. doi: 10.1111/j.1471-4159.1992.tb08899.x. [DOI] [PubMed] [Google Scholar]
- 10.Cline EJ, Adams CE, Larson GA, Gerhardt GA, Zahniser NR. Medial dorsal striatum is more sensitive than lateral dorsal striatum to cocaine inhibition of exogenous dopamine clearance: relation to [3H]-mazindol binding, but not striosome/matrix. Exp Neurol. 1995;134:135–149. doi: 10.1006/exnr.1995.1044. [DOI] [PubMed] [Google Scholar]
- 11.Cragg SJ, Greenfield SA. Differential autoreceptor control of somatodendritic and axon terminal dopamine release in substantia nigra, ventral tegmental area and striatum. J Neurosci. 1997;17:5738–5746. doi: 10.1523/JNEUROSCI.17-15-05738.1997. [DOI] [PMC free article] [PubMed] [Google Scholar]
- 12.Cragg SJ, Rice ME, Greenfield SA. Heterogeneity of dopamine release and reuptake in substantia nigra, ventral tegmental area and striatum. J Neurophysiol. 1997;77:863–873. doi: 10.1152/jn.1997.77.2.863. [DOI] [PubMed] [Google Scholar]
- 13.Cragg SJ, Clarke DJ, Greenfield SA. Real-time dynamics of dopamine released from neuronal transplants in experimental Parkinson's disease. Exp Neurol. 2000;164:145–153. doi: 10.1006/exnr.2000.7420. [DOI] [PubMed] [Google Scholar]
- 14.Crutcher MD, DeLong MR. Single cell studies of the primate putamen. I. Functional organization. Exp Brain Res. 1984;53:233–243. doi: 10.1007/BF00238153. [DOI] [PubMed] [Google Scholar]
- 15.Davis WM, Bedford JA, Buelke JL, Guinn MM, Hatoum HT, Waters IW, Wilson MC, Braude MC. Acute toxicity and gross behavioural effects of amphetamine, four methoxyamphetamines, and mescaline in rodents, dogs and monkeys. Toxicol Appl Pharmacol. 1978;45:49–62. doi: 10.1016/0041-008x(78)90027-3. [DOI] [PubMed] [Google Scholar]
- 16.Elsworth JD, Deutch AY, Redmond DE, Jr, Sladek JR, Jr, Roth RH. Effects of 1-methyl-4-phenyl-1,2,3,6,-tetrahydropyridine (MPTP) on catecholamines and metabolites in primate brain and CSF. Brain Res. 1987;415:293–299. doi: 10.1016/0006-8993(87)90211-3. [DOI] [PubMed] [Google Scholar]
- 17.Garris PA, Ciolkowski EL, Pastore P, Wightman RM. Efflux of dopamine from the synaptic cleft in the nucleus accumbens of the rat brain. J Neurosci. 1994;14:6084–6093. doi: 10.1523/JNEUROSCI.14-10-06084.1994. [DOI] [PMC free article] [PubMed] [Google Scholar]
- 18.Giros B, El Mestikawy S, Godinot N, Zheng K, Han H, Yang-Fen T, Caron MG. Cloning, pharmacological characterisation and chromosome alignment of the human dopamine transporter. Mol Pharmacol. 1992;42:383–390. [PubMed] [Google Scholar]
- 19.Giros B, Jaber M, Jones SR, Wightman RM, Caron MG. Hyperlocomotion and indifference to cocaine and amphetamine in mice lacking the dopamine transporter. Nature. 1996;379:606–612. doi: 10.1038/379606a0. [DOI] [PubMed] [Google Scholar]
- 20.Goldman-Rakic PS, Selemon LD. Topography of corticostriatal projections in nonhuman primates and implications for functional parcellation of the neostriatum. In: Jones EG, Peters A, editors. Cereb cortex, Vol 5. Plenum; New York: 1986. pp. 447–466. [Google Scholar]
- 21.Grace AA, Bunney BS. Intracellular and extracellular electrophysiology of nigral dopaminergic neurons. I. Identification and characterisation. Neuroscience. 1983;10:301–315. doi: 10.1016/0306-4522(83)90135-5. [DOI] [PubMed] [Google Scholar]
- 22.Grace AA, Bunney BS. The control of firing pattern in nigral dopamine neurons: single spike firing. J Neurosci. 1984a;4:2866–2876. doi: 10.1523/JNEUROSCI.04-11-02866.1984. [DOI] [PMC free article] [PubMed] [Google Scholar]
- 23.Grace AA, Bunney BS. The control of firing pattern in nigral dopamine neurons: burst firing. J Neurosci. 1984b;4:2877–2890. doi: 10.1523/JNEUROSCI.04-11-02877.1984. [DOI] [PMC free article] [PubMed] [Google Scholar]
- 24.Haber SN, McFarland NR. The concept of the ventral striatum in nonhuman primates. Ann NY Acad Sci. 1999;877:33–48. doi: 10.1111/j.1749-6632.1999.tb09259.x. [DOI] [PubMed] [Google Scholar]
- 25.Haber SN, Ryoo H, Cox C, Lu W. Subsets of midbrain dopaminergic neurons in monkeys are distinguished by different levels of mRNA for the dopamine transporter: comparison with the mRNA for the D2 receptor, tyrosine hydroxylase and calbindin immunoreactivity. J Comp Neurol. 1995;362:400–410. doi: 10.1002/cne.903620308. [DOI] [PubMed] [Google Scholar]
- 26.Hazrati L-N, Parent A. The striatopallidal projection displays a high degree of anatomical specificity in the primate. Brain Res. 1992;592:213–227. doi: 10.1016/0006-8993(92)91679-9. [DOI] [PubMed] [Google Scholar]
- 27.Hornykiewicz O. Dopamine (and 3-hydroxytyramine) and brain function. Pharmacol Rev. 1966;18:925–964. [PubMed] [Google Scholar]
- 28.Horvitz JC. Mesolimbocortical and nigrostriatal dopamine responses to salient non-reward events. Neuroscience. 2000;96:651–656. doi: 10.1016/s0306-4522(00)00019-1. [DOI] [PubMed] [Google Scholar]
- 29.Hurd YL, Pristupa ZB, Herman MM, Niznik HB, Kleinman JE. The DA transporter and DA D2 receptor mRNAs are differentially expressed in limbic- and motor-related subpopulations of human mesencephalic neurons. Neuroscience. 1994;63:357–362. doi: 10.1016/0306-4522(94)90535-5. [DOI] [PubMed] [Google Scholar]
- 30.Jackson MB. Presynaptic excitability. Int Rev Neurobiol. 1995;38:210–251. doi: 10.1016/s0074-7742(08)60527-9. [DOI] [PubMed] [Google Scholar]
- 31.Jones EG, Coulter JD, Burton H, Porter R. Cells of origin and terminal distribution of corticostriatal fibers arising in the sensory-motor cortex of monkeys. J Comp Neurol. 1977;173:53–80. doi: 10.1002/cne.901730105. [DOI] [PubMed] [Google Scholar]
- 32.Jones SR, Garris PA, Kilts CD, Wightman RM. Comparison of dopamine uptake in the basolateral amygdaloid nucleus, caudate-putamen and nucleus accumbens of the rat. J Neurochem. 1995;64:2581–2589. doi: 10.1046/j.1471-4159.1995.64062581.x. [DOI] [PubMed] [Google Scholar]
- 33.Jones SR, Gainetdinov RR, Wightman RM, Caron MG. Mechanisms of amphetamine action revealed in mice lacking the dopamine transporter. J Neurosci. 1998;18:1979–1986. doi: 10.1523/JNEUROSCI.18-06-01979.1998. [DOI] [PMC free article] [PubMed] [Google Scholar]
- 34.Kaufman MJ, Madras BK. Severe depletion of cocaine recognition sites associated with the dopamine transporter in Parkinson's-diseased striatum. Synapse. 1991;9:43–49. doi: 10.1002/syn.890090107. [DOI] [PubMed] [Google Scholar]
- 35.Kaufman MJ, Madras BK. Distribution of cocaine recognition sites in monkey brain: II. Ex vivo autoradiography with [3H]-CFT and [125I]-RTI-55. Synapse. 1992;12:99–111. doi: 10.1002/syn.890120203. [DOI] [PubMed] [Google Scholar]
- 36.Kawagoe KT, Garris PA, Wiedemann DJ, Wightman RM. Regulation of transient dopamine concentration gradients in the microenvironment surrounding nerve terminals in the rat striatum. Neuroscience. 1992;51:55–64. doi: 10.1016/0306-4522(92)90470-m. [DOI] [PubMed] [Google Scholar]
- 37.Kish SJ, Shannak K, Hornykiewicz O. Uneven pattern of dopamine loss in the striatum of patients with idiopathic Parkinson's disease. N Engl J Med. 1988;318:876–880. doi: 10.1056/NEJM198804073181402. [DOI] [PubMed] [Google Scholar]
- 38.Kuczenski R, Segal DS. Differential effects of amphetamine and dopamine uptake blockers (cocaine, nomifensine) on caudate and accumbens dialysate dopamine and 3-methoxytyramine. J Pharmacol Exp Ther. 1992;262:1085–1094. [PubMed] [Google Scholar]
- 39.Kunzle H. Bilateral projections from precentral motor cortex to the putamen and other parts of the basal ganglia. Brain Res. 1975;88:195–209. doi: 10.1016/0006-8993(75)90384-4. [DOI] [PubMed] [Google Scholar]
- 40.Kunzle H. Projections from the primary somatosensory cortex to basal ganglia and thalamus in the monkey. Exp Brain Res. 1977;30:481–492. doi: 10.1007/BF00237639. [DOI] [PubMed] [Google Scholar]
- 41.Kunzle H. An autoradiographic analysis of the efferent connections from premotor and adjacent prefrontal regions (areas 6 and 9) in macaca fascularis. Brain Behav Evol. 1978;15:185–234. doi: 10.1159/000123779. [DOI] [PubMed] [Google Scholar]
- 42.Limberger N, Trout SJ, Kruk ZL, Starke K. “Real-time” measurement of endogenous DA release during short trains of pulses in slices of rat neostriatum and nucleus accumbens: role of autoinhibition. Naunyn Schmiedebergs Arch Pharmacol. 1991;344:623–629. doi: 10.1007/BF00174745. [DOI] [PubMed] [Google Scholar]
- 43.Lynd-Balta E, Haber SN. The organization of midbrain projections to the striatum in the primate: sensorimotor-related striatum versus ventral striatum. Neuroscience. 1994;59:625–640. doi: 10.1016/0306-4522(94)90182-1. [DOI] [PubMed] [Google Scholar]
- 44.Madras BK, Kaufman MJ. Cocaine accumulates in dopamine-rich regions of primate brain after i.v. administration: comparison with mazindol distribution. Synapse. 1994;18:261–275. doi: 10.1002/syn.890180311. [DOI] [PubMed] [Google Scholar]
- 45.Marshall JF, O'Dell SJ, Navarrete R, Rosenstein AJ. Dopamine high-affinity transport site topography in rat brain: major differences between dorsal and ventral striatum. Neuroscience. 1990;37:11–21. doi: 10.1016/0306-4522(90)90187-9. [DOI] [PubMed] [Google Scholar]
- 46.McFarland NR, Haber SN. Convergent inputs from thalamic motor nuclei and frontal cortical areas to the dorsal striatum in the primate. J Neurosci. 2000;20:3798–3813. doi: 10.1523/JNEUROSCI.20-10-03798.2000. [DOI] [PMC free article] [PubMed] [Google Scholar]
- 47.Melega WP, Lacan G, Harvey DC, Huang S-C, Phelps ME. Dizocilpine and reduced body temperature do not prevent methamphetamine-induced neurotoxicity in the vervet monkey: [11C]-WIN 35,428-positron emission tomography studies. Neurosci Lett. 1998;258:17–20. doi: 10.1016/s0304-3940(98)00845-3. [DOI] [PubMed] [Google Scholar]
- 48.Meir A, Ginsburg S, Butkevich A, Kachalsky SG, Kaiserman I, Ahdut R, Demirogoren S, Rahamimoff R. Ion channels in presynaptic nerve terminals and control of transmitter release. Physiol Rev. 1999;79:1019–1088. doi: 10.1152/physrev.1999.79.3.1019. [DOI] [PubMed] [Google Scholar]
- 49.Miller GW, Gainetdinov RR, Levey AI, Caron MG. Dopamine transporters and neuronal injury. Trends Pharmacol. 1999;20:424–429. doi: 10.1016/s0165-6147(99)01379-6. [DOI] [PubMed] [Google Scholar]
- 50.Moratella R, Quinn B, DeLanney LE, Irwin I, Langston W, Graybiel AM. Differential vulnerability of primate caudate-putamen and striosome-matrix dopamine systems to the neurotoxic effects of 1-methyl-4-phenyl-1,2,3,6-tetrahydropyridine. Proc Natl Acad Sci USA. 1992;89:3859–3863. doi: 10.1073/pnas.89.9.3859. [DOI] [PMC free article] [PubMed] [Google Scholar]
- 51.Olanow CW, Tatton WG. Etiology and pathogenesis of Parkinson's disease. Annu Rev Neurosci. 1999;22:123–144. doi: 10.1146/annurev.neuro.22.1.123. [DOI] [PubMed] [Google Scholar]
- 52.Parent A, Mackey A, DeBellefeuille L. The subcortical afferents to caudate nucleus and putamen in primates: a fluorescence retrograde double labelling study. Neuroscience. 1983;4:1137–1150. doi: 10.1016/0306-4522(83)90104-5. [DOI] [PubMed] [Google Scholar]
- 53.Rapisarda C, Bacchelli B. The brain of the guinea-pig in stereotaxic coordinates. Arch Sci Biol. 1977;61:1–37. [PubMed] [Google Scholar]
- 54.Rice ME, Cragg SJ, Greenfield SA. Characteristics of electrically evoked somatodendritic dopamine release in substantia nigra and ventral tegmental area in vitro. J Neurophysiol. 1997;77:853–862. doi: 10.1152/jn.1997.77.2.853. [DOI] [PubMed] [Google Scholar]
- 55.Ritz MC, Lamb RJ, Goldberg SR, Kuhar MJ. Cocaine receptors on dopamine transporters are related to self-administration of cocaine. Science. 1987;237:1219–1223. doi: 10.1126/science.2820058. [DOI] [PubMed] [Google Scholar]
- 56.Roberts DCS, Corcoran ME, Fiber HC. On the role of ascending catecholaminergic systems in intravenous self-administration. Pharmacol Biochem Behav. 1977;6:615–620. doi: 10.1016/0091-3057(77)90084-3. [DOI] [PubMed] [Google Scholar]
- 57.Rocha BA, Fumagalli F, Gainetdinov RR, Jones SR, Ator R, Giros B, Miller GW, Caron MG. Cocaine self-administration in dopamine-transporter knockout mice. Nat Neurosci. 1998;1:132–137. doi: 10.1038/381. [DOI] [PubMed] [Google Scholar]
- 58.Russchen FT, Bakst I, Amaral DG, Price JL. The amygdalostriatal projections in the monkey. An anterograde tracing study. Brain Res. 1985;329:241–257. doi: 10.1016/0006-8993(85)90530-x. [DOI] [PubMed] [Google Scholar]
- 59.Sanghera MK, Manaye KF, Liang C-L, Iacopino AM, Bannon MJ, German DC. Low dopamine transporter mRNA levels in mid-brain regions containing calbindin. NeuroReport. 1994;5:1641–1644. doi: 10.1097/00001756-199408150-00025. [DOI] [PubMed] [Google Scholar]
- 60.Schultz W. Primate dopamine cell activity in relation to behavioural acts. Clin Neuropharmacol. 1984;7:48–49. [Google Scholar]
- 61.Schultz W. Responses of midbrain dopamine neurons to behavioural trigger stimuli in the monkey. J Neurophysiol. 1986;55:660–677. doi: 10.1152/jn.1986.56.5.1439. [DOI] [PubMed] [Google Scholar]
- 62.Schultz W, Ruffieux A, Aebischer P. The activity of pars compacta neurons of the monkey substantia nigra in relation to motor activation. Exp Brain Res. 1983;51:377–387. [Google Scholar]
- 63.Selemon LD, Goldman-Rakic PS. Longitudinal topography and interdigitation of corticostriatal projections in the rhesus monkey. J Neurosci. 1985;5:776–795. doi: 10.1523/JNEUROSCI.05-03-00776.1985. [DOI] [PMC free article] [PubMed] [Google Scholar]
- 64.Shimada S, Kitayama S, Walther D, Uhl G. Dopamine transporter mRNA: dense expression in ventral midbrain neurons. Mol Brain Res. 1992;13:359–362. doi: 10.1016/0169-328x(92)90220-6. [DOI] [PubMed] [Google Scholar]
- 65.Smith Y, Parent A. Differential connections of caudate nucleus and putamen in the squirrel monkey (Saimiri sciureus). Neuroscience. 1986;18:347–371. doi: 10.1016/0306-4522(86)90159-4. [DOI] [PubMed] [Google Scholar]
- 66.Stephan H, Baron G, Schwerdtfeger WK. The brain of the common marmoset (Callithrix jacchus): a stereotaxic atlas. Springer; New York: 1980. [Google Scholar]
- 67.Szabo J. Organization of the ascending striatal afferents in monkeys. J Comp Neurol. 1980;189:307–321. doi: 10.1002/cne.901890207. [DOI] [PubMed] [Google Scholar]
- 68.Trout SJ, Kruk ZL. Differences in evoked dopamine efflux in rat caudate putamen, nucleus accumbens and tuberculum olfactorium in the absence of uptake inhibition: influence of autoreceptors. Br J Pharmacol. 1992;106:452–458. doi: 10.1111/j.1476-5381.1992.tb14355.x. [DOI] [PMC free article] [PubMed] [Google Scholar]
- 69.Volkow ND, Wang GJ, Fischman MW, Foltin RW, Fowler JS, Abumrad NN, Vitkun S, Logan J, Gatley SJ, Pappas N, Hitzemann R, Shea CE. Relationship between subjective effects of cocaine and dopamine transporter occupancy. Nature. 1997;386:827–830. doi: 10.1038/386827a0. [DOI] [PubMed] [Google Scholar]
- 70.Wetherell JR, Fosbraey P, French MC. A comparison of the distribution of neurotransmitters in brain regions of the rat and guinea-pig using a chemiluminescent method and HPLC with electrochemical detection. J Neurochem. 1989;53:1519–1526. doi: 10.1111/j.1471-4159.1989.tb08547.x. [DOI] [PubMed] [Google Scholar]
- 71.Wightman RM, Zimmerman JB. Control of dopamine extracellular concentration in rat striatum by impulse flow and uptake. Brain Res Bull. 1990;15:135–144. doi: 10.1016/0165-0173(90)90015-g. [DOI] [PubMed] [Google Scholar]
- 72.Wu W, Gu HH. Molecular cloning of the mouse dopamine transporter and pharmacological comparison with the human homologue. Gene. 1999;233:163–170. doi: 10.1016/s0378-1119(99)00143-2. [DOI] [PubMed] [Google Scholar]