

Abstract
Microglia are equipped with a strong proton (H+) extrusion pathway, a voltage-gated H+ channel, probably to compensate for the large amount of H+generated during phagocytosis; however, little is known about how this channel is regulated in pathological states. Because neural damage is often associated with intracellular and extracellular acidosis, we examined the regulatory mechanisms of the H+ current of rat spinal microglia in acidic environments. More than 90% of round/amoeboid microglia expressed the H+ current, which was characterized by slow activation kinetics, dependencies on both intracellular and extracellular pH, and blockage by Zn2+. Extracellular lactoacidosis, pH 6.8, induced intracellular acidification and cell swelling. Cell swelling was also induced by intracellular dialysis with acidic pipette solutions, pH 5.5–6.8, at normal extracellular pH 7.3 in the presence of Na+. The H+ currents were increased in association with cell swelling as shown by shifts of the half-activation voltage to more negative potentials and by acceleration of the activation kinetics. The acidosis-induced cell swelling and the accompanying potentiation of the H+ current required nonhydrolytic actions of intracellular ATP and were inhibited by agents affecting actin filaments (phalloidin and cytochalasin D). The H+ current was also potentiated by swelling caused by hypotonic stress. These findings suggest that the H+ channel of microglia can be potentiated via cell swelling induced by intracellular acidification. This potentiation might operate as a negative feedback mechanism to protect microglia from cytotoxic acidification and hence acidosis-induced swelling in pathological states of the CNS.
Keywords: H+ channel, lactoacidosis, cell swelling, microglia, pH regulation, ATP, cytochalasin D, cytoskeleton, spinal cord
Microglia are activated in response to various disorders of the CNS, including infection, ischemia, trauma, and neurodegenerative diseases, and they participate in both neuroprotective and neuropathological events (Streit, 1996). They are sensitive to the minor changes in their microenvironment present during very early stages of brain damage, such as subtle imbalances in ion homeostasis, and transform rapidly from the resting to the activated state (Gehrmann et al., 1993; Kreutzberg, 1996). Various ion channels in microglia are considered to contribute to the high responsiveness to pathological events and to be involved in maintenance of the neural microenvironment (Kettenmann et al., 1990; Nörenberg et al., 1994; Schlichter et al., 1996; Eder, 1998).
A voltage-gated proton (H+) channel, first found in snail neurons (Thomas and Meech, 1982), has been suggested to be the mechanism for H+ extrusion responsible for compensation of intracellular acidification and for the dissipation of depolarization found in phagocytes that generate a massive amount of H+ during respiratory bursts (Lukacs et al., 1993; DeCoursey and Cherny, 1994). Similar H+ currents have been described in murine (Eder et al., 1995), rat (Visentin et al., 1995), and human (McLarnon et al., 1997) microglia. Because the H+channel may work as a powerful mechanism to regulate microglial pH, the activity of the channel is likely to be linked intimately with microglial functions. Neural ischemia, injury, and seizures are often associated with intracellular and extracellular acidosis (Siesjö, 1988) and glial cell swelling (Kimelberg et al., 1990; Staub et al., 1990, 1994; Choi, 1992), but little is known about how the H+ channel responds to these pathological conditions.
This study aimed to elucidate regulatory mechanisms of the H+ channel of microglia in acidic environments. We found that sizable H+currents that share electrical features with those in other types of cells (Lukacs et al., 1993; DeCoursey and Cherny, 1994) were present in a major population of the round/amoeboid type of rat spinal microglia, which were generally designated as either proliferating or activated phenotypes. Intracellular acidification induced cell swelling by modulating actin-cytoskeletal organization via pathways dependent on nonhydrolytic ATP binding. The H+ current increased in association with cell swelling induced by either intracellular acidification or hypotonic stress. Cell swelling is likely to be a significant modulator of the H+ channel in microglia. Because extrusion of H+ through the channel could correct intracellular acidosis quickly, potentiation of the H+ channel may work to protect cells from acidosis-induced swelling in pathological states of the CNS.
A preliminary report has been published previously (Morihata et al., 1998).
MATERIALS AND METHODS
Cells. Spinal cord cells were obtained from 14-d-old embryos or 1- to 3-d-old newborn Wistar rats under anesthesia with ether as described elsewhere (Ogata et al., 1993). Briefly, after the meninges were carefully removed in the PBS containing 0.1% glucose, the spinal cords were minced into 1 mm3blocks with razor blades and then incubated with 0.25% trypsin for 15 min at 37°C. Five milliliters of horse serum (HS) (ICN Biomedicals, Costa Mesa, CA) supplemented with DNase I (0.1 mg/ml) were added to the cell suspension. After centrifugation at 700 rpm for 5 min, cells were resuspended in DMEM (Nissui Pharmaceutical Co., Tokyo, Japan), and tissue debris was removed by filtration with a lens-cleaning paper. Cells were plated at a density of 1.0–2.0 × 10⁵ cells/ml on coverslips or in culture flasks in the DMEM containing 100 U/ml penicillin, 0.1 mg/ml streptomycin, and 0.25 ng/ml amphotericin B and either 15% fetal calf serum (FCS) (Equitech-Bio, Inc. Ingram, TX) or 10% FCS plus 5% HS, and were incubated at 37°C in a 95% air–5% CO2 atmosphere. The culture medium was changed every 3–4 d. Within 1–2 weeks, round/amoeboid-shaped cells appeared on the glial cell monolayer, and these proliferated for 3–6 weeks. In some experiments, the cells, which adhered weakly to the glial cell layer, were collected by gentle shaking and then harvested on coverslips. This procedure produced preparations highly enriched with microglia (>90–95%) as described elsewhere (Nörenberg et al., 1994; Visentin et al., 1995). After the purification, the ramified cells, characterized by long branched processes and elongated flattened cell bodies, appeared in 1–2 d in the absence of FCS (Tanaka et al., 1998).
Identification of cells. Microglia were identified by immunostaining with a microglial marker, isolectin-B4 (IL-B4) (Streit, 1990). Cells were fixed in 4% paraformaldehyde in PBS for 1 hr, rinsed with PBS, and then reacted with biotinylated IL-B4 for 2 hr at room temperature. Cell-bound lectin was visualized by 3,3′-diaminobenzidine tetrahydrochloride. Most round/ameoboid cells (>90–95%) on a glial monolayer or in isolated culture were stained with IL-B4.
Solutions. The standard external solution contained (in mm): 150 Na-isethionate, 1 CaCl2, 1 MgCl2, 10 glucose, 0.1% bovine serum albumin, and 10 HEPES. The pHo was adjusted to 7.3 by NaOH. The alkaline solution, pHo 7.8, was made by addition of NaOH. In the acidic external solution, pHo 6.5–6.8, 2-morpholinoethanesulfonic acid (MES) was substituted for HEPES. A Na+-free solution was made by replacement of Na-isethionate byN-methyl-d-glucamine (NMDG) chloride. To load cells with lactic acid, Na-isethionate was replaced by Na-lactate, and the pH was adjusted to 6.8. The osmolarities of the external solutions were measured using a freezing-point depression osmometer (OS osmometer, Fiske, MA) and were maintained between 296 and 299 mOsm/l by changing the concentrations of Na-isethionate. Hypotonic solutions were prepared by reducing the concentration of Na-isethionate. Reduction of Na+ from 150 to ∼75 mm did not affect the hypotonically induced cell swelling. The standard pipette solution contained (in mm): 60 Cs-methanesulfonate, 1 BAPTA, 3 MgCl2, 1 Na2ATP, 100 HEPES–45 CsOH, pHp 7.3. The pH of the acidic solutions, pH 6.2, was buffered by 120 mm MES. The osmolarities of the pipette solutions were maintained between 284 and 293 mOsm/l by changing the concentration of Cs-methanesulfonate. In some experiments, Cs-methanesulfonate was replaced by CsCl.
Electrophysiological recordings. Whole-cell currents were recorded from microglia cultured on the glial layer or after purification. The reference electrode was a Ag-AgCl wire connected to the bath solution through a Ringer-agar bridge. The potentials were corrected for the liquid junction potential before formation of the gigaseal. The pipette resistances ranged between 5 and 15 MΩ. Series resistance compensation (40–70%) was used to reduce the voltage error. The cell capacitance was estimated with the capacitance cancellation circuitry of the amplifier (33.8 ± 1.0 pF,n = 278). Current signals were amplified (L/M EPC7, Darmstadt, Germany), digitized at 2 kHz with an analog-to-digital converter (Maclab 4, AD Instruments, New South Wales, Australia), stored, and analyzed by a personal computer. The leak currents were determined from the linear portions of the current–voltage (I–V) relationships when either inward or outward currents were absent and subtracted from the current records. In some experiments, voltage ramps (0.2 mV msec from −100 to +100 mV) were applied at −60 mV every 10 sec. Data are expressed as means ± SEM and were tested using Student's unpaired t test unless stated otherwise. All experiments were performed at room temperature (22–24°C). The temperatures were monitored throughout the experiments, because the H+ current was highly temperature-dependent (Kuno et al., 1997).
Measurements of intracellular pH using 2′,7′-bis-(2-carboxyethyl)-5 (and -6) carboxyfluorescein. The intracellular pHs (pHi) of single cells were determined with digital fluorescence microscopy (Attoflour, Zeiss) using a pH-sensitive fluorescent dye, 2′,7′-bis-(2-carboxyethyl)-5 (and -6) carboxyfluorescein (BCECF). Cells were plated on glass coverslips for 10–24 hr and loaded with the acetoxymethyl ester form of BCECF (BCECF-AM) (1 μm) for 30 min at 37°C. After the dye was washed out, the ratios of fluorescence images [the emission wavelength (520 nm) excited at two wavelengths (488 and 460 nm)] were measured every 10 sec with 30–100 msec exposures. Data (80–120 pixels) for each illumination were averaged and plotted against time. Calibration of pHi was performed by dissipating the plasma membrane pH gradient with 10 μm nigericin in a K+-rich solution with known pH values (Thomas et al., 1979; Grinstein and Furuya, 1988).
Estimation of cell swelling. Cell swelling during lactoacidosis was determined by a microfluorimetric study essentially as described (Muallem et al., 1992; Lo et al., 1995). Briefly, the isosbestic point of BCECF was used to measure the relative volume changes as a function of dye dilution. The fluorescence that was excited at 439 nm, an excitation wavelength providing fluorescence signals independent of pH, was monitored using an inverted microscope (TMD-Diaphot, Nikon, Japan) attached to a photomultiplier and a spectrofluorometer (CAM230, Nihonbunko, Japan). The optical field of interest was restricted to single cells with an objective aperture that was adjusted to be slightly smaller than the cell body; therefore, the fluorescence emitted from 80–90% of the cell area was measured. Illumination was automatically shuttered on for 2 sec and off for 32 sec. The data were analyzed after correction for the photobleaching estimated before each experiment, because the fluorescence of the dye tended to fade over time.
The method of dye dilution could not be used for the whole-cell recordings where the cell interiors were dialyzed continually by pipette solutions. We used the cell diameters to monitor the changes in cell volumes of voltage-clamped cells, because the increases in the cell diameters were almost proportional to the dilution of the dye and the increases in the cell thicknesses during swelling induced by lactoacidosis (see Fig. 5). The cell dimensions were determined as described elsewhere (Drewnowska and Baumgarten, 1991; Jackson et al., 1996). Cell images displayed on a video monitor (PVM-1454Q, Sony, Japan) via a CCD camera (KY-F55MD, Olympus, Japan) were printed out by means of a high quality videocopy processor (CP700A, Mitsubishi, Japan), or were analyzed by a computer program (NIH image) with an image-processing computer board. Cell thicknesses were obtained by focusing on the top and bottom surfaces of cells using the microscale on the microscope-focusing knob. The tops were identified by locating the tip of the micropipette. Five to 10 readings of the parameters were averaged for each cell; the average ratio of the thickness and the diameter of single cells obtained by the focusing method was 0.64 ± 0.10 (n = 12), not significantly different from that obtained by the three-dimensional measurement with a confocal microscope (0.71 ± 0.08, n = 7). The relative increases in the thickness during swelling were generally greater than those in cell diameter (see Fig. 5B); however, measurements of the thickness could not follow rapid time-dependent changes. The estimates of changes of cell volume from the diameters were used only for rounded cells that swelled symmetrically in the focal plane.
Fig. 5.
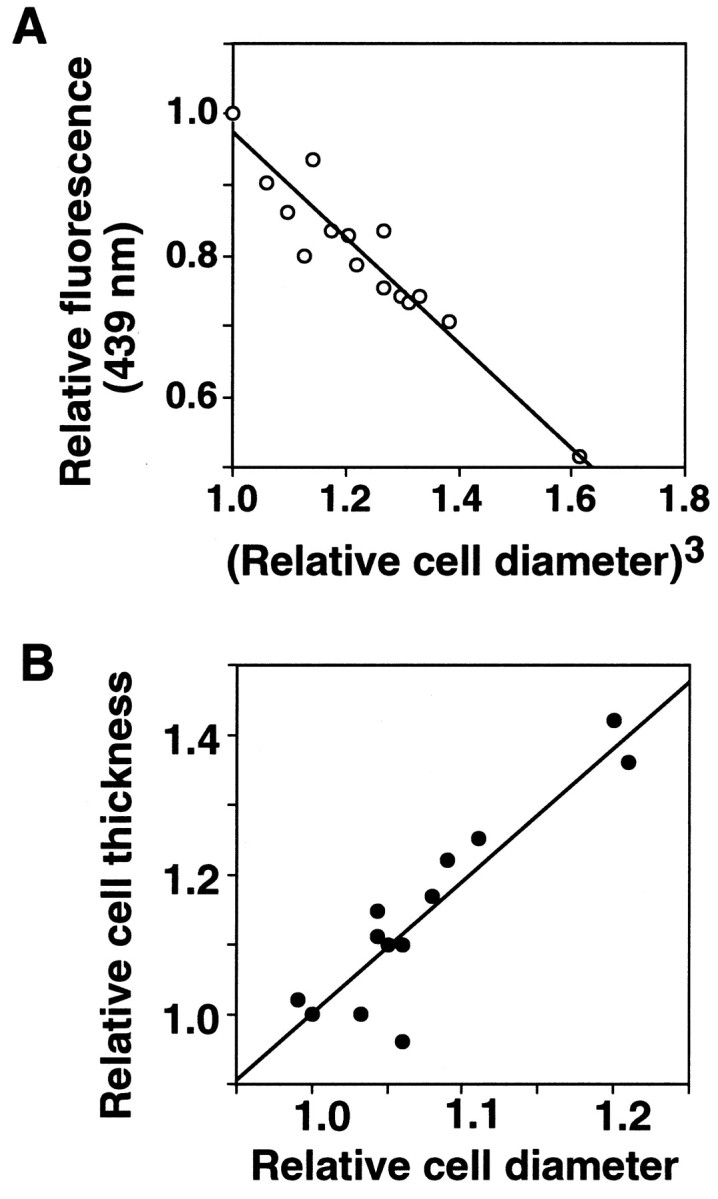
Relationships among parameters for changes in the cell volume. Data were obtained from rounded microglia (n = 3 in A, n = 12 in B) exposed to Na-lactate, pH 6.8, and normalized by the values before the exposure. A, The intensities of BCECF fluorescence at the isosbestic point (439 nm) plotted against the cube of the relative cell diameters. The line indicates the regression line (r = 0.96). B, The relative cell thicknesses plotted against the relative cell diameters (r = 0.82). The diameter and thickness were 23.2 ± 1.1 and 14.0 ± 2.3 μm before swelling (n = 12).
Substances. MES, BAPTA, and BCECF-AM were purchased from Dojindo Laboratories (Kumamoto, Japan), and all other chemicals were obtained from Sigma (St. Louis, MO). The concentrations of Zn2+ described herein are only nominal, because Zn2+ forms complexes with anions. 5′-Adenylylimido-diphosphate (AMP-PNP) was dissolved in distilled water. Concentrated stock solutions of cytochalasin D and 4,4′-diisothiocyano-2,2′-stilbenedisulfonic acid (DIDS) were prepared in DMSO, and those of phalloidin, bafilomycin A1, and nigericin were prepared in ethanol. The final concentrations of DMSO and ethanol were <0.1 and 1%, respectively, which affected neither the current nor the cell shape.
RESULTS
A voltage-gated proton current of rat microglia
Representative whole-cell currents evoked in a microglia by voltage pulses applied at a holding potential (−60 mV) with an acidic pipette solution, pHp 5.5, are shown in Figure1A. The cell was perfused with the extracellular solutions of pHo7.3, 6.5, and then 7.8. The currents were characterized by strong outward rectification and time- and voltage-dependent activation kinetics. The currents were reduced in an acidic extracellular solution and augmented in an alkaline solution. The tail currents at −60 mV (arrows) were inward at pHo 6.5 and outward at pHo 7.8. Superimposition of currents normalized by the amplitude at the end of a voltage pulse (+100 mV) shows that the activation rate was accelerated and the activation delay was decreased by extracellular alkalinization (Fig.1B).
Fig. 1.

Effects of external pH on whole-cell currents. A, Families of currents evoked by 1-sec-long voltage pulses applied at −60 mV with an acidic pipette solution (pHp = 5.5). The cell was perfused sequentially with external solutions of different pH (pHo = 7.3, 6.5, 7.8). The tail currents at −60 mV (arrows) were negligible at pHo 7.3, inward at pHo 6.5, and outward at pHo 7.8. B, Normalized currents at different pHo were superimposed. Eachtrace represents the relative current normalized by the amplitudes at the end of voltage pulse (+100 mV).C, Whole-cell currents in a cell at pHp/pHo of 5.5/7.3 before (top) and after addition of 100 μm DIDS (middle). The interrupted line indicates the holding current level at −60 mV in the presence of DIDS. Thebottom traces show the results of the subtraction of the middle traces from the top traces. D, Current–voltage (I–V) relationships for the current amplitudes measured at the end of 1-sec-long voltage pulses with different pHo (6.8–7.8) at a constant pHp (5.5). The current amplitudes were normalized by cell capacitance.E, I–V relationships with a constant pHo (7.3) at different pHp(5.5–7.3). Data are means ± SEM. The numbers of cells tested are given in the parentheses.
Although the recordings were made in Cl−-free external solutions with K+-free pipette solutions to minimize contamination by outward Cl− and K+ currents, rapidly activating currents occasionally contaminated the slowly activating currents (Fig.1C). Addition of a Cl− channel blocker, DIDS, decreased the early part of the currents (middle). The currents blocked by DIDS were characterized by rapid activation and voltage-dependent inactivation and were inward at −60 mV (Fig.1C, bottom). The reversal potential was approximately −15 mV with the [Cl−/anion]o/[Cl−/anion]iratio (154/66 mm), and the current was increased with cell swelling (Fig. 7A). Thus the DIDS-sensitive currents were most likely the Cl−/anion currents reported previously (Eder, 1998). Addition of 100 μm DIDS reduced the rapidly activating currents to 5.4 ± 1.5% (n = 5). Although the degree of contamination by DIDS-sensitive currents varied among cells, 50–100 μm DIDS was added to decrease this current in later experiments.
Fig. 7.

A, Whole-cell currents in a swelled cell before (A1) and after addition of 100 μm DIDS (A2) (pHp/pHo = 6.2/7.3). Most of the currents that remained in the presence of DIDS were blocked by 0.1 mm Zn (A3). A4 shows the DIDS-sensitive currents obtained by subtraction of A2from A1. The interrupted line indicates the holding current level at −60 mV in the presence of DIDS. The DIDS-sensitive current was inward at −60 mV (A4). B, Relationship between the cell diameters and the H+ current amplitudes in acidosis-induced swelling (pHp/pHo= 5.5/7.3). The current amplitudes were measured at +80 mV from theI–V curves obtained by voltage ramps applied at −60 mV, normalized by the cell capacitance, and were plotted against the relative cell diameters. The current amplitudes tended to be larger as the cells swelled. Theline is a least square fit for all data (102 points from 42 cells) (r = 0.81). The closed circles and bars are the mean and SEM for each bin of 0.1 of the abscissal unit.
The amplitudes of the currents were measured at the end of the 1-sec-long voltage pulses and normalized by the cell capacitance (current density). The current densities at any voltage were increased with extracellular alkalization when the pHp was maintained at 5.5 (Fig. 1D) as well as with intracellular acidification at a constant pHo of 7.3 (Fig. 1E), although the currents often did not reach the steady-state level during the duration of voltage pulses.
To determine the ion species mediating the slowly activating currents, the reversal potentials (Vrev) were measured from the I–V plots of the tail currents after a prepotential (+60–80 mV) applied at −80–60 mV in the presence of 100 μm DIDS (Fig.2A,B). Decreasing the pHo from 7.3 to 6.3 shiftedVrev to a more positive potential (Fig. 2B). The values ofVrev were linearly related to pHo with a slope of 45 mV per ΔpH of 1 over pHo of 6.3–7.3 (Fig. 2C). The data at 7.8 deviated from the regression line. In these experiments, theECl estimated from the [Cl−]o/[Cl−]iratio (4/86 mm) was maintained at +77 mV, far positive to Vrev at any pHo, and there was also little change in the concentrations of other ions (Na+, Ca2+, Mg2+, Cs+). These results suggest that the H+ ion was the major carrier for the current.
Fig. 2.

The reversal potential and pH. A, Tail currents at −100 to −50 mV after a prepotential of +60 mV (pHo = 7.3). B,I–V plots for tail currents in a cell perfused subsequently with extracellular media of different pHs (○, pHo 7.3; ●, pHo 6.3). The amplitudes of the tail currents at the start of each test pulse were estimated from the single exponential fit. C, Reversal potentials plotted against the external pH. Data are means ± SEM with the numbers of cells tested. The line is a least square fit for data. The pHp for A–C was 5.5, and the external medium contained 100 μm DIDS.
External application of ZnCl2 reversibly blocked the H+ current (Fig.3A), as has been reported for the voltage-gated H+ currents in many types of cells (Lukacs et al., 1993; DeCoursey and Cherny, 1994). The current amplitudes were decreased to 9.7 ± 3.8% (n = 23) of the control by 0.1 mmZnCl2, and to 1.8 ± 1.3% (n = 8) by 0.2–0.5 mm (Fig.3B). The current amplitudes were not decreased by either 0.2 mm amiloride, which blocks the Na+-H+exchanger completely, or 0.2 μm bafilomycin A1, which blocks the vacuolar type H+-ATPase completely (Fig.3B).
Fig. 3.

Effects of blockers on the H+current. A, Reversible blockage of the H+ current by ZnCl2 (0.1 mm). Whole-cell currents were evoked by the voltage-pulse protocol displayed at the bottom. B, The amplitudes of the H+ currents after application of ZnCl2, amiloride, and bafilomycin A1. Currents (means ± SEM) are expressed as percentage of that before the application. The pHp/pHo was 5.5/7.3.
The H+ currents were detected in 225 of 242 (93%) of the round/amoeboid microglia cultivated either in the presence or absence of the glial layer, but in only 7 of 19 ramified microglia. In addition, the current densities in the ramified types were much smaller, so that round/amoeboid cells were used in later experiments unless described otherwise.
Intracellular acidification-induced microglial swelling
Neural dysfunction is often associated with lactoacidosis that induces marked intracellular acidification (Grinstein et al., 1984;Siesjö, 1988; Staub et al., 1990). Before exposure to a Na-lactate solution, pH 6.8, the averaged intracellular pH (pHi) of microglia in the resting state measured with BCECF was 7.31 ± 0.06 (n = 7) (Fig.4A). It was decreased to 6.03 ± 0.15 by the extracellular lactoacidosis. The pHi recovered rapidly (7.25 ± 0.19) within 2–3 min after washout of lactate with a Na+-free K+-rich solution that depolarized the cells and thereby activated the H+ channel (Kuno et al., 1997). Washout of Na-lactate, pH 6.8, by the standard Ringer's solution containing 145 mm NaCl and 5 mm KCl increased the pHifrom 6.23 ± 0.02 (n = 4) to 6.69 ± 0.05 (n = 4) at 5 min. Thus the actions of the H+ channel were involved in at least a portion of the rapid recovery of pHi in the K+-rich solution. During the lactoacidosis, the fluorescence intensity excited at a pH-insensitive wavelength was decreased; this dilution of the dye (Fig.4B, closed circles) was associated with an increase in the cell diameter (open circles). The diameter increased to 110 ± 3% (n = 5) of the control value after 15–30 min in Na-lactate and returned to 102 ± 3% at 60 min after washout (data not shown). Thus extracellular lactoacidosis induced intracellular acidification and swelling of microglia as has been reported in other types of cells (Grinstein et al., 1984; Staub et al., 1990).
Fig. 4.

Extracellular lactoacidosis-induced intracellular acidification and microglial swelling. A, Averaged changes in the intracellular pH after exposure to a Na-lactate solution, pH 6.8, in single cells (n = 7). The bars represent SEM. The cells were loaded with BCECF, and the pHs were measured as the ratio of the fluorescence at two wavelengths. The pH recovered rapidly after washout of the Na-lactate by a K+-rich solution. B, Changes of cell volume as a function of the dilution of BCECF at the isosbestic point (439 nm) (●) and the cell diameter (○) during exposure of a single cell to Na-lactate, pH 6.8.
To examine the relation between pHi and microglial swelling, cells were dialyzed intracellularly by pipette solutions with different pHs. The cell diameters were used to monitor the changes in cell volume in dialyzed cells, because the cube of the relative changes in cell diameter correlated well with dilution of the dye (Fig. 5A), and the changes in cell diameter correlated with those in cell thickness (Fig.5B). The relative cell diameters measured within 10 min of the intracellular perfusion tended to increase with stepwise increases in the intracellular acidity from pHp 7.3 to 6.8, 6.2, and 5.5 (Fig. 6). The pHo was 7.3 for all of the recordings. The relative diameters at pHp 6.2 and 5.5 were significantly larger than that at pHp 7.3 (p < 0.05). The cell capacitance remained unchanged (99.3 ± 6.0% of controls, n = 15) with the increase in the diameters, indicating that the cell enlargement was not accompanied by massive exocytosis. The acidosis-induced swelling, pHp 5.5, was inhibited when the extracellular Na+ was replaced by NMDG+ (Fig. 6, rightmost column) (the relative cell diameter: 1.08 ± 0.03,n = 7), suggesting that Na+ influx mediated this swelling as has been reported in other types of cells (Grinstein et al., 1984; Staub et al., 1990). Cell swelling caused by intracellular acidification was observed in both rounded and amoeboid cells, but the swelling-induced events were analyzed only in the round types because it was difficult to estimate the cell size of the amoeboidal cells.
Fig. 6.

Swelling induced by intracellular dialysis with pipette solutions of different pH. Changes in cell diameter within 10 min of intracellular dialysis with pipette solutions of different pH (pHp = 7.3–5.5) were estimated from the diameters of the cells during the whole-cell recordings divided by those before the rupture of the patch membrane (relative cell diameter). Therightmost column shows the relative diameters in pHp 5.5 in the absence of Na+. The extracellular Na+ was replaced by NMDG. Data are means ± SEM with the numbers of cells tested. Data are compared with the data in pHp 7.3. *p < 0.05; **p < 0.01. The effect of Na+was compared at pHp 5.5.
Cell swelling increased the H+ current
We next examined how cell swelling affected the H+ current in the presence of 50–100 μm DIDS. When cells swelled in the absence of DIDS, the H+ current was often contaminated by the rapidly activating currents (Fig.7A1). After addition of 100 μm DIDS, the slowly activating, Zn2+-sensitive H+ current remained (Fig. 7A2,A3). When cells swelled in the presence of 100 μm DIDS, the increase in the current amplitude at the onset (+80 mV) was 2.4 ± 0.8% (mean ± SEM,n = 7) of that at the end of a 1 sec voltage pulse. Considering that the rapidly activating currents were inactivated during the voltage pulses (Fig. 7A4), >95% of the value measured at the end of voltage pulses was likely to be mediated by the H+ current. The amplitudes of the H+ currents were measured in cells where the contamination of the rapidly activating currents was estimated to be <5–10%. The amounts of cell swelling among cells varied greatly, even at a constant pHp (Fig. 6). At pHp/pHo of 5.5/7.3, there was a positive correlation between the current densities and the relative cell diameters (Fig. 7B). The averaged current density was 4.1 ± 0.6 pA/pF (n = 28) at +80 mV in cells with little or no swelling (relative cell diameter <1.1), and it then increased in association with an increase in diameter. Thus microglial swelling is likely to increase the H+ current, but not vice versa, because the acidosis-induced swelling was observed even when the H+ current was blocked by 0.1 mm ZnCl2 (n= 3) or when the membrane potential was held at −60 mV, at which level the channels were closed.
With swelling, the current amplitudes increased greatly at all potentials tested (Fig.8A). In addition, swelling accelerated the time course of the activation on depolarization. The time constant of activation, estimated from a single exponential fit for the current at +60 mV, was reduced significantly from 1020 ± 170 msec (n = 7) to 720 ± 140 msec (p < 0.05 with pairedt test) when the average current amplitude was increased to 200 ± 23% (n = 7) by swelling (Fig.8B). The tail currents recorded at 0 mV after various prepotentials were also augmented (Fig. 8A,arrows). When the tail currents were normalized by the maximum value for each cell and averaged (n = 7), the activation curves for the tail currents were shifted to lower potentials after swelling (Fig. 8C). The half-activation voltage, estimated from the Boltzmann fit (curves), was shifted by −12.7 ± 5.2 mV (n = 7) with swelling. These findings suggest that cell swelling modified the activation mechanisms of the H+ channels to open more rapidly and more readily at less depolarized membrane potentials.
Fig. 8.

Changes in activation kinetics of the H+ current after swelling. A, H+ currents in a microglia at pHp/pHo of 5.5/7.3 before (left) and after (right) swelling. Tail currents (arrows) were recorded at 0 mV after 1-sec-long prepotentials of −60 to +100 mV. B, Activation time constants estimated from single exponential fits for the currents evoked by a voltage pulse of +60 mV, before (○) and after (●) swelling in seven cells. *p < 0.05 with pairedt test. C, Relationships between the tail current and prepotentials before (○) and after (●) swelling. The amplitudes of tail currents at the start of test pulse (0 mV) were estimated from the single exponential fit and were normalized by the maximum value before swelling. Data are means ± SEM (n = 7). Curves are fits by the Boltzmann equation.B and C were obtained from cells in which the relative cell diameters after swelling ranged from 1.18 to 1.43.
Requirements of intracellular ATP for acidosis-induced swelling and H+ current potentiation
Omission of ATP from the pipette solution suppressed the acidosis-induced cell swelling. The mean relative cell diameter at pHp 5.5 in the absence of ATP was 1.07 ± 0.05 (n = 16), i.e., significantly smaller than the control with 1 mm ATP (p< 0.01) (Fig. 9A). The H+ current amplitude was also decreased significantly in the absence of ATP (Fig. 9B). However, when ATP was replaced by 1 mm AMP-PNP, a nonhydrolyzable ATP analog, the acidosis-induced swelling was not inhibited (Fig. 9A). The H+current amplitude was somewhat smaller than the control, but the difference was not significant (p = 0.31) (Fig.9B). These findings suggest that although ATP is involved in the acidosis-induced cell swelling and the accompanying increase of the H+ current, ATP hydrolysis is not necessary.
Fig. 9.

Effects of ATP, phalloidin, and cytochalasin D on the acidosis-induced swelling and potentiation of the H+ current. pHp/pHo = 5.5/7.3.A, The relative cell size when ATP (1 mm) of the pipette solution was omitted or replaced by 1 mm AMP-PNP, when phalloidin (10 μm) was applied to the pipette solution, when cells were preincubated with cytochalasin D (10 μm) for 30 min to 2 hr, and when external Na+ was replaced by NMDG+. B, The H+current amplitudes in these cells. The current amplitudes were measured at +80 mV from the I–V relation evoked by voltage ramps applied at −60 mV and normalized by the cell capacitance. Data are means ± SEM with the numbers of cells tested. The data were compared with the control. *p< 0.05; **p < 0.01; † p = 0.08.
Effects of phalloidin and cytochalasin D on the acidosis-induced cell swelling and the H+ current potentiation
Generally cell swelling is related to alteration of the actin cytoskeletal network. Intracellular perfusion with 10 μmphalloidin, an actin-stabilizing agent, significantly inhibited both microglial swelling (relative cell diameter = 1.14 ± 0.04,n = 14; p < 0.05) and the increment in the H+ current density (6.7 ± 2.1 pA/pF, n = 14; p < 0.1) (Fig.9A,B). The effects of intracellular dialysis with cytochalasin D (10–20 μm) were inconsistent, possibly because cytochalasin D would not be effective at this low pH. When cells were pretreated with 10 μm cytochalasin D for 30 min–2 hr, the relative cell diameters (1.08 ± 0.02, n = 16;p < 0.001) and the H+current densities (4.4 ± 0.9 pA/pF, n = 12;p < 0.05) during perfusion were significantly smaller than were the controls. The cells deformed slightly during the pretreatment, but the H+ currents did not differ from those in untreated cells with relative cell diameters <1.1 (4.2 ± 0.6 pA/pF, n = 28), indicating that this pretreatment with cytochalasin D did not disturb the channel activity in the absence of swelling. In addition, when acidosis-induced swelling was prevented by removal of extracellular Na+, the H+current failed to increase (4.9 ± 2.4 pA/pF, n = 5) (Fig. 9B, rightmost column).
Hypotonically induced cell swelling also increased the H+ current
Hypotonic stress is a common stimulus to induce cell swelling and to modulate ion channel activities (Okada, 1997; Lang et al., 1998). The time course of the average changes in the amplitudes of the H+ currents after exposure to the hypotonic solutions (40–70% of the control osmolarity) in cells in which swelling was negligible before the stimulation at pHp of 5.5–6.8 is shown in Figure10A. The currents were recorded for at least 10 min before the hypotonic stimulation to confirm that the current amplitudes remained constant in the control solution. The amplitudes were measured at +80 mV from the I–V curves obtained by voltage ramps applied at −60 mV every 10 sec and were normalized by the value immediately before the hypotonic stimulation. We adopted the voltage-ramp protocol because the H+current often declined during repetitive applications of voltage steps (DeCoursey and Cherny, 1994), but not with the voltage-ramp protocol (Morihata et al., 2000). The amounts of the hypotonically induced cell swelling varied greatly among cells. The H+ current increased considerably in six cells that swelled with the relative diameters ≥1.05 (Fig.10A, closed circles), but the increment was small in two cells that swelled only slightly (relative diameters <1.05) (open circles). A plot of the maximum current amplitudes of these eight cells against the cell diameter relative to that before the hypotonic stimulation shows that the H+ current increased in association with hypotonically induced cell swelling (Fig. 10B).
Fig. 10.

Hypotonically induced swelling and activation of the H+ current. A, Time courses of changes in the H+ current amplitude in cells exposed to hypotonic solutions (40–70% of the control osmolarity). The hypotonic stress was applied at time 0, and at least 10 min after the whole-cell configuration was set. Closed and open circles are averaged data obtained from cells with (n = 6) and without (n = 2) swelling. The current amplitudes were measured at +80 mV from theI–V relation evoked by voltage ramps applied at −60 mV and are expressed as the ratios to those before hypotonic stimulation (inset). B, Maximum amplitudes of the relative currents during the hypotonic stress are plotted against the relative cell diameters. Data in Aand B were obtained from the same cells. pHp/pHo = 5.5–6.8/7.3.
In the dialyzed cells, the regulatory volume decreases (RVDs) were not detectable during a 10–30 min exposure to the hypotonic stress. In addition, the diameters of four of five dialyzed cells were increased further at 15 min after washout of the hypotonic solution, whereas the diameters of intact cells were decreased by 30–70% (n= 5). Thus in the dialyzed cells the persistent acidification or some unknown disturbance may impede the regulation of cell volume.
DISCUSSION
A voltage-gated H+ current in rat microglia
Microglia are often classified into two types on a morphological basis: process-bearing (ramified) and non-process-bearing (round/amoeboid) cells. Functionally, the ramified type is considered to be in the resting state, and the round/amoeboid type, in the activated or proliferating state. H+currents were recorded in 93% of the round/amoeboid type of rat spinal microglia. However, the H+ currents were small or negligible in the ramified type, suggesting that their expression was highly dependent on the phenotype (Korotzer and Cotman, 1992; Eder, 1998).
The Vrev calculated from pHp and pHo deviated from the theoretical values predicted from the Nernst equation. However, this deviation of Vrev is a common feature of voltage-gated H+ currents and is usually attributed to imperfect control of pH despite the high buffer concentrations (>100 mm) (Lukacs et al., 1993; DeCoursey and Cherny, 1994): the pHi might be less acidic by at least 0.2–0.6 than pHp, and pHi increases in association with H+ efflux during depolarization. TypicallyVrev changes ∼40 mV/pH or less, but the channels are assumed to be highly selective to H+ because the H+ concentration is much smaller than that of other ions (DeCoursey and Cherny, 1994). These results suggest that the H+ ion was the major carrier for the current. The H+ currents of rat spinal microglia shared common electrophysiological features with those in other cell types, such as time- and voltage-dependent activation, strong outward rectification, dependencies on both intracellular and extracellular pH, and block by heavy metals but not by either amiloride or bafilomycin A1 (Lukacs et al., 1993; DeCoursey and Cherny, 1994; Kuno et al., 1997). The H+ current activity was also highly dependent on temperature (preliminary observation) as reported previously (Kuno et al., 1997; DeCoursey and Cherny, 1998).
Microglial swelling induced by intracellular acidification
Cerebral ischemia, injury, and seizures often disturb pH and induce cell swelling (Siesjö et al., 1985; Siesjö,1988;Chesler and Kraig, 1989; Kimelberg et al., 1990; Choi, 1992; Largo et al., 1996). For example, arachidonic acid and lactate accumulate after brain damage and induce both glial swelling and intracellular acidosis (Staub et al., 1990, 1994). We showed above that extracellular lactoacidosis induced profound intracellular acidification and swelling of microglia. The protonated forms of weak organic acids (lactate−) enter cells rapidly and induce intracellular acidification. This may activate the Na+–H+exchanger, leading to Na+ accumulation inside cells, which in turn leads to water uptake (Grinstein et al., 1984; Hoffmann and Simonsen, 1989). The whole-cell clamp study demonstrated that intracellular acidification could induce microglial swelling even at normal extracellular pH. This would be a crucial mechanism to regulate microglial function, because microglia are acidified intracellularly during respiratory bursts without extracellular acidosis. The acidosis-induced swelling was inhibited by removal of Na+, suggesting that Na+ influx may be a common mechanism of cell swelling induced by extracellular lactoacidosis and intracellular acidification.
Microglial activation is accompanied by alteration of the cytoskeletal network, such as changes in cell shape and volume, proliferation, migration to injured areas, phagocytosis, and secretion of chemicals. The swelling induced by intracellular acidosis was inhibited by both phalloidin (actin stabilizer) and cytochalasin D (actin destabilizer). The sites of action and the mechanisms of the two agents differ, but both impede flexible regulation of cytoarchitecture (Janmey, 1998). Bundling of F-actin (Edmonds et al., 1995) and actin reorganization (Sampath and Pollard, 1991; Demaurex et al., 1996) are also pH dependent, so that the pHi could regulate cell motility and cell shape via modulation of the F-actin network (Stossel, 1993). Intracellular acidification would increase the level of strong free radicals in brain tissue homogenates (Siesjö et al., 1985) and lead to swelling of glial cells (Staub et al., 1990). These findings suggest that the pHi may be a potent regulator of cytoarchitecture, and hence of microglial behavior.
In the present study, depletion of ATP did not affect the amplitudes of the H+ currents before swelling but inhibited acidosis-induced swelling, suggesting that ATP was a crucial requirement for the induction of swelling. Reorganization of the actin cytoskeletal network underlies hypotonically induced swelling (for review, see Lang et al., 1998), and nonhydrolytic ATP binding is often required to activate volume-sensitive Cl−channels (Jackson et al., 1996; Bond et al., 1999; Sakai et al., 1999). Depletion of intracellular ATP alters actin cytoskeleton (Molitoris et al., 1991), which may explain the inhibitory effects of its absence on cell swelling.
Potentiation of the H+ current in association with cell swelling
It is interesting that microglial swelling, induced by either intracellular acidification or hypotonic stress, increased the H+ current when pHp/pHo was constant. The enhancement was accompanied by an acceleration of the rate of channel openings and a shift of the activation voltage to more negative potentials. Intracellular acidification itself increased the H+ current and lowered the activation voltage; however, the H+ current was increased further even if swelling was imposed under very acidic intracellular conditions, pHp 5.5, and the potentiation was inhibited when swelling was suppressed by phalloidin, cytochalasin D, omission of ATP, and removal of Na+. There is no literature on the swelling-induced potentiation of the H+current, but cell swelling regulates various ion channels (Okada, 1997;Janmey, 1998). The present findings suggest that cell swelling is a crucial modulator of the H+ channel.
Can this swelling-mediated potentiation of the H+ current operate in intact cells? The measurements of pHi with BCECF suggested that exposure to lactoacidosis, pH 6.8, decreased the pHi of intact microglia reversibly to ∼6.0 (Fig. 4A). During global ischemia, the pHo could drop to 6.2 (Siesjö et al., 1985); thus pHi of microglia could vary over the pH range tested herein. The degree of swelling in clamped cells was generally greater than in intact cells, possibly because of disturbances of cellular machinery caused by intracellular dialysis. However, the amounts of lactoacidosis-induced swelling in intact cells were sufficient to increase the H+ currents. At normal intracellular pH, pHp 7.3, the H+currents were detectable but required very large depolarizations to be activated. Thus potentiation of the H+extrusion by swelling seems to be effective at low intracellular pH, mostly under pathological conditions. Severe intracellular acidification may be encountered only in microglia in a hyperactive state, but glial swelling has been demonstrated to precede neuronal death (Kimelberg et al., 1990). It is conceivable that the H+ channel would be activated in association with slight swelling at an early phase of neural disturbances.
Pathophysiological implications of the H+ channel of microglia
Pathological CNS states offer conditions to increase the H+ current, including intracellular acidification attributable to H+generation during phagocytosis and extracellular acidosis, depolarization attributable to accumulation of intracellular H+ and extracellular K+([K+]o) (Sykova, 1983), and cell swelling caused by pH or osmotic imbalances. The H+ channel participates in the rapid recovery from intracellular acidosis, and the H+ released thereby may contribute to alterations of extracellular pH homeostasis, and hence neuronal activity.
The H+ current was unlikely to contribute directly to RVD on exposure to hypotonic stress: the concentration of H+ was small, and H+ itself is a weak osmolyte. In addition, intracellular acidification and depolarization would be required to activate the H+ current. However, one cannot exclude the possibility that the changes in pH caused by the H+ current modify channels or transporters responsible for RVD when the hypotonic stress is accompanied by severe intracellular acidification.
Not only does acidification induce cell swelling, but swelling leads to intracellular acidification (Muallem et al., 1992; Lo et al., 1995; Lang et al., 1998). Thus acidification and swelling might exacerbate each other. In microglia, intracellular acidosis induces swelling, swelling increases the activity of the H+ channel, and activation of the channel leads to a rapid recovery from intracellular acidosis. This process might operate as a crucial negative feedback mechanism to protect microglia from the vicious cycle of acidosis and hence acidosis-induced swelling.
Footnotes
This work was supported by grants from The Assistant Program of Graduate Student Fellowship of Osaka City University, The Hoh-ansha Foundation, and a Grant-in-Aid for Scientific Research from The Ministry of Education, Science, and Culture, Japan. We thank Dr. S. Matsuura for encouragement, J. Kawawaki for technical assistance in measurements of intracellular pH, C. H. Kim for preparing this manuscript, and Dr. C. Edwards for critically reading this manuscript.
Correspondence should be addressed to Dr. Miyuki Kuno, Department of Physiology, Osaka City University Medical School, Abeno-ku, Osaka 545-8585. E-mail: kunomyk@med.osaka-cu.ac.jp.
REFERENCES
- 1.Bond T, Basavappa S, Christensen M, Strange K. ATP dependence of the ICl, swell channel varies with rate of cell swelling. J Gen Physiol. 1999;113:441–456. doi: 10.1085/jgp.113.3.441. [DOI] [PMC free article] [PubMed] [Google Scholar]
- 2.Chesler M, Kraig RP. Intracellular pH transients of mammalian astrocytes. J Neurosci. 1989;9:2011–2019. doi: 10.1523/JNEUROSCI.09-06-02011.1989. [DOI] [PMC free article] [PubMed] [Google Scholar]
- 3.Choi DW. Excitotoxic cell death. J Neurobiol. 1992;23:1261–1276. doi: 10.1002/neu.480230915. [DOI] [PubMed] [Google Scholar]
- 4.DeCoursey TE, Cherny VV. Voltage-activated hydrogen ion currents. J Membr Biol. 1994;141:203–223. doi: 10.1007/BF00235130. [DOI] [PubMed] [Google Scholar]
- 5.DeCoursey TE, Cherny VV. Temperature dependence of voltage-gated H+ currents in human neutrophils, rat alveolar epithelial cells, and mammalian phagocytes. J Gen Physiol. 1998;112:503–522. doi: 10.1085/jgp.112.4.503. [DOI] [PMC free article] [PubMed] [Google Scholar]
- 6.Demaurex N, Downey GP, Waddell TK, Grinstein S. Intracellular pH regulation during spreading of human neutrophils. J Cell Biol. 1996;133:1391–1402. doi: 10.1083/jcb.133.6.1391. [DOI] [PMC free article] [PubMed] [Google Scholar]
- 7.Drewnowska K, Baumgarten CM. Regulation of cellular volume in rabbit ventricular myocytes: bumetanide, chlorothiazide, and ouabain. Am J Physiol. 1991;260:C122–C131. doi: 10.1152/ajpcell.1991.260.1.C122. [DOI] [PubMed] [Google Scholar]
- 8.Eder C. Ion channels in microglia (brain macrophages). Am J Physiol. 1998;275:C327–342. doi: 10.1152/ajpcell.1998.275.2.C327. [DOI] [PubMed] [Google Scholar]
- 9.Eder C, Fischer H-G, Hadding U, Heinemann U. Properties of voltage-gated currents of microglia developed using macrophage colony-stimulating factor. Pflügers Arch. 1995;430:526–533. doi: 10.1007/BF00373889. [DOI] [PubMed] [Google Scholar]
- 10.Edmonds B, Murray J, Condeelis J. pH regulation of the F-actin binding properties of Dictyostelium elongation factor 1a. J Biol Chem. 1995;270:15222–15230. doi: 10.1074/jbc.270.25.15222. [DOI] [PubMed] [Google Scholar]
- 11.Gehrmann J, Mies G, Bonnekoh P, Banati R, Iijima T, Kreutzberg GW, Hossmann K-A. Microglial reaction in the rat cerebral cortex induced by cortical spreading depression. Brain Pathol. 1993;3:11–17. doi: 10.1111/j.1750-3639.1993.tb00720.x. [DOI] [PubMed] [Google Scholar]
- 12.Grinstein S, Furuya W. Assessment of Na+-H+ exchange activity in phagosomal membranes of human neutrophils. Am J Physiol. 1988;254:C272–C285. doi: 10.1152/ajpcell.1988.254.2.C272. [DOI] [PubMed] [Google Scholar]
- 13.Grinstein S, Goetz JD, Furuya W, Rothstein A, Gelfand EW. Amiloride-sensitive Na+-H+ exchange in platelets and leukocytes: detection by electronic cell sizing. Am J Physiol. 1984;247:C293–C298. doi: 10.1152/ajpcell.1984.247.3.C293. [DOI] [PubMed] [Google Scholar]
- 14.Hoffmann EK, Simonsen LO. Membrane mechanisms in volume and pH regulation in vertebrate cells. Physiol Rev. 1989;69:315–382. doi: 10.1152/physrev.1989.69.2.315. [DOI] [PubMed] [Google Scholar]
- 15.Jackson PS, Churchwell K, Ballatori N, Boyer JL, Strange K. Swelling-activated anion conductance in skate hepatocytes: regulation by cell Cl− and ATP. Am J Physiol. 1996;270:C57–C66. doi: 10.1152/ajpcell.1996.270.1.C57. [DOI] [PubMed] [Google Scholar]
- 16.Janmey PA. The cytoskeleton and cell signaling: component localization and mechanical coupling. Physiol Rev. 1998;78:763–781. doi: 10.1152/physrev.1998.78.3.763. [DOI] [PubMed] [Google Scholar]
- 17.Kettenmann H, Hoppe D, Gottmann K, Banati R, Kreutzberg GW. Cultured microglial cells have a distinct pattern of membrane channels different from peritoneal macrophages. J Neurosci Res. 1990;26:278–287. doi: 10.1002/jnr.490260303. [DOI] [PubMed] [Google Scholar]
- 18.Kimelberg HK, Barron KD, Bourke RS, Nelson LR, Cragoe EJ. Brain anti-cytoxic edema agents. Prog Clin Biol Res. 1990;361:363–385. [PubMed] [Google Scholar]
- 19.Korotzer AR, Cotman CW. Voltage-gated current expressed by rat microglia in culture. Glia. 1992;6:81–88. doi: 10.1002/glia.440060202. [DOI] [PubMed] [Google Scholar]
- 20.Kreutzberg GW. Microglia: a sensor for pathological events in the CNS. Trends Neurosci. 1996;19:312–318. doi: 10.1016/0166-2236(96)10049-7. [DOI] [PubMed] [Google Scholar]
- 21.Kuno M, Kawawaki J, Nakamura F. A highly temperature-sensitive proton current in bone marrow-derived mast cells. J Gen Physiol. 1997;109:731–740. doi: 10.1085/jgp.109.6.731. [DOI] [PMC free article] [PubMed] [Google Scholar]
- 22.Lang F, Busch GL, Ritter M, Völkl H, Waldegger S, Gulbins E, Häussinger D. Functional significance of cell volume regulatory mechanisms. Physiol Rev. 1998;78:247–306. doi: 10.1152/physrev.1998.78.1.247. [DOI] [PubMed] [Google Scholar]
- 23.Largo C, Cuevas P, Somjen GG, del Río RM, Hereras O. The effect of depressing glial function in rat brain in situ on ion homeostasis, synaptic transmission, and neuron survival. J Neurosci. 1996;16:1219–1229. doi: 10.1523/JNEUROSCI.16-03-01219.1996. [DOI] [PMC free article] [PubMed] [Google Scholar]
- 24.Lo C, Ferrier J, Tenenbaum HC, McCulloch CAG. Regulation of cell volume and intracellular pH in hypoosmotically swollen rat osteosarcoma cells. Biochem Cell Biol. 1995;73:535–544. doi: 10.1139/o95-059. [DOI] [PubMed] [Google Scholar]
- 25.Lukacs GL, Kapus S, Nanda A, Romane R, Grinstein S. Proton conductance of the plasma membrane: properties, regulation, and functional role. Am J Physiol. 1993;265:C3–C14. doi: 10.1152/ajpcell.1993.265.1.C3. [DOI] [PubMed] [Google Scholar]
- 26.McLarnon JG, Xu R, Lee YB, Kim SU. Ion channels of human microglia in culture. Neuroscience. 1997;78:1217–1228. doi: 10.1016/s0306-4522(96)00680-x. [DOI] [PubMed] [Google Scholar]
- 27.Molitoris BA, Geerdes J, McIntosh JR. Dissociation and redistribution of Na+, K+-ATPase from its surface membrane actin cytoskeletal complex during cellular ATP depletion. J Clin Invest. 1991;88:462–469. doi: 10.1172/JCI115326. [DOI] [PMC free article] [PubMed] [Google Scholar]
- 28.Morihata H, Nakamura F, Kuno M. Electrophysiological properties of a voltage-gated proton (H+) current in rat spinal microglia. Neurosci Res [Suppl] 1998;22:S62. [Google Scholar]
- 29.Morihata H, Kawawaki J, Sakai H, Sawada M, Tsutada T, Kuno M (2000) Temporal fluctuations of voltage-gated proton currents in rat spinal microglia via pH-dependent and -independent mechanisms. Neurosci Res, in press. [DOI] [PubMed]
- 30.Muallem S, Zhang B-X, Loessberg PA, Star RA. Simultaneous recording of cell volume changes and intracellular pH or Ca2+ concentration in single osteosarcoma cells UMR-106–01. J Biol Chem. 1992;267:17658–17664. [PubMed] [Google Scholar]
- 31.Nörenberg W, Gebicke-Haerter PJ, Illes P. Voltage-dependent potassium channels in activated rat microglia. J Physiol (Lond) 1994;475:15–32. doi: 10.1113/jphysiol.1994.sp020046. [DOI] [PMC free article] [PubMed] [Google Scholar]
- 32.Ogata T, Nakamura Y, Tsuji K, Shibata T, Kataoka K, Shibata T, Kataoka K. Steroid hormones protect spinal cord neurons from glutamate toxicity. Neuroscience. 1993;55:445–449. doi: 10.1016/0306-4522(93)90513-f. [DOI] [PubMed] [Google Scholar]
- 33.Okada Y. Volume expansion-sensing outward rectifier Cl− channel: fresh start to the molecular identity and volume sensor. Am J Physiol. 1997;273:C755–789. doi: 10.1152/ajpcell.1997.273.3.C755. [DOI] [PubMed] [Google Scholar]
- 34.Sakai H, Nakamura F, Kuno M. Synergetic activation of outwardly rectifying Cl− currents by hypotonic stimulation and external Ca2+ in murine osteoclasts. J Physiol (Lond) 1999;515:157–168. doi: 10.1111/j.1469-7793.1999.157ad.x. [DOI] [PMC free article] [PubMed] [Google Scholar]
- 35.Sampath P, Pollard TD. Effects of cytochalasin, phalloidin, pH on the elongation of actin filaments. Biochemistry. 1991;30:1973–1980. doi: 10.1021/bi00221a034. [DOI] [PubMed] [Google Scholar]
- 36.Schlichter LC, Sakellaropoulos G, Ballyk B, Pennefather PS, Phipps DJ. Properties of K+ and Cl− channels and their involvement in proliferation of rat microglial cells. Glia. 1996;17:225–236. doi: 10.1002/(SICI)1098-1136(199607)17:3<225::AID-GLIA5>3.0.CO;2-#. [DOI] [PubMed] [Google Scholar]
- 37.Siesjö BK. Acidosis and ischemic brain damage. Neurochem Pathol. 1988;9:31–88. doi: 10.1007/BF03160355. [DOI] [PubMed] [Google Scholar]
- 38.Siesjö BK, Bendek G, Koide T, Westerberg E, Wieloch T. Influence of acidosis on lipid peroxidation in brain tissues in vitro. J Cereb Blood Flow Metab. 1985;5:253–258. doi: 10.1038/jcbfm.1985.32. [DOI] [PubMed] [Google Scholar]
- 39.Staub F, Beathmann A, Peters J, Weigt H, Kempski O. Effects of lactoacidosis on glial cell volume and viability. J Cereb Blood Flow Metab. 1990;10:866–876. doi: 10.1038/jcbfm.1990.143. [DOI] [PubMed] [Google Scholar]
- 40.Staub F, Winkler A, Haberstok J, Pelesnila N, Peters J, Chang RCC, Kempski O, Baethmann A. Swelling, acidosis, and irreversible damage of glial cells from exposure to arachidonic acid in vitro. J Cereb Blood Flow Metab. 1994;14:1030–1039. doi: 10.1038/jcbfm.1994.135. [DOI] [PubMed] [Google Scholar]
- 41.Stossel TP. On the crawling of animal cells. Science. 1993;260:1086–1094. doi: 10.1126/science.8493552. [DOI] [PubMed] [Google Scholar]
- 42.Streit WJ. An improved staining method for rat microglial cells using the lectin from Griffonia simplicifolia (GSA I-B4). J Histochem Cytochem. 1990;38:1683–1686. doi: 10.1177/38.11.2212623. [DOI] [PubMed] [Google Scholar]
- 43.Streit WJ. The role of microglia in brain injury. Neurotoxicology. 1996;17:671–678. [PubMed] [Google Scholar]
- 44.Sykova E. Extracellular K+ accumulation in the central nervous system. Prog Biophys Mol Biol. 1983;42:135–189. doi: 10.1016/0079-6107(83)90006-8. [DOI] [PubMed] [Google Scholar]
- 45.Tanaka J, Toku K, Matsuda S, Sudo S, Fujita H, Sakanaka M, Maeda N. Induction of resting microglia in culture medium devoid of glycine and serine. Glia. 1998;24:198–215. [PubMed] [Google Scholar]
- 46.Thomas JA, Buchsbaum RN, Zimniak A, Racker E. Intracellular pH measurements in Ehrlich ascites tumor cells utilizing spectroscopic probes generated in situ. Biochemistry. 1979;18:2210–2218. doi: 10.1021/bi00578a012. [DOI] [PubMed] [Google Scholar]
- 47.Thomas RC, Meech RW. Hydrogen ion currents and intracellular pH in depolarized voltage-clamped snail neurons. Nature. 1982;299:826–828. doi: 10.1038/299826a0. [DOI] [PubMed] [Google Scholar]
- 48.Visentin S, Agresti C, Patrizio M, Levi G. Ion channels in rat microglia and their different sensitivity to lipopolysaccharide and interferon-γ. J Neurosci Res. 1995;42:439–451. doi: 10.1002/jnr.490420402. [DOI] [PubMed] [Google Scholar]