

Abstract
The central nucleus of the inferior colliculus (IC) is the site of convergence for nearly all ascending monaural and binaural projections. Several of these inputs, including inhibitory connections from the dorsal nucleus of the lateral lemniscus (DNLL), are highly ordered and organized into series of afferent bands or patches. Although inputs to the IC from the contralateral DNLL are present in the rat by birth [postnatal day 0 (P0)], the earliest indications of band formation are not evident until P4. Subsequently, the initially diffuse projection segregates into a pattern of bands and interband spaces, and by P12 adult-like, afferent-dense patches are established (Gabriele et al., 2000). To determine the role of the auditory periphery in the development of bands and patches before the onset of hearing (P12/P13), unilateral cochlear ablations were performed at P2 (before any evidence of banding). Rat pups were reared to P12, at which time glass pins coated with 1,1′-dioctodecyl-3,3,3′,3′-tetramethylindocarbocyanine perchlorate were placed in fixed tissue in the commissure of Probst where DNLL fibers cross the midline. The results indicate that a unilateral cochlear ablation disrupts the normal development of afferent patches in the IC. Although the crossed DNLL projections labeled via commissural dye placement always mirrored each other in P12 controls, ablation cases exhibited a consistent, bilateral asymmetry in pattern formation and relative density of the labeled projections. Possible developmental mechanisms likely to be involved in the establishment of afferent bands and patches before the onset of hearing are discussed.
Keywords: afferent patterns, inferior colliculus, DNLL, cochlear ablation, auditory midbrain, commissure of Probst, carbocyanine dye, bands, patches, rat
The inferior colliculus (IC) is the site of convergence for nearly all ascending and descending auditory pathways. Based on regional variations in cellular anatomy, neuropil, and afferent and efferent connectivity, the auditory midbrain can be broken down into nuclear subdivisions (Morest and Oliver, 1984; Oliver and Morest, 1984), each with its distinct hierarchy of organization. The central nucleus of the IC (see Fig. 1) receives inputs from essentially all ascending pathways en route to higher auditory centers of thalamus and cortex. The majority of neurons residing within the central nucleus exhibit disk-shaped dendritic arbors that are oriented parallel to the numerous afferent fibers. The arrangement of incoming lemniscal fibers as afferent layers and their association with the underlying cellular architecture of the central nucleus together constitute fibrodendritic laminae (Oliver and Morest, 1984; Faye-Lund and Osen, 1985; Oliver et al., 1991; Malmierca et al., 1993). This laminar organization preserves the frequency order of the cochlea (Clopton and Winfield, 1973; Merzenich and Reid, 1974; Semple and Aitkin, 1979; Huang and Fex, 1986; Ryan et al., 1988; Kelly et al., 1998). Several inputs terminate primarily within alternating sublayers of neighboring lamina, thereby giving the projection distribution a banded or patchy appearance.
Fig. 1.

Levels of organization in the auditory midbrain. The central nucleus of the IC (CNIC) is one nuclear subdivision that consists of tonotopically (LF, low frequency; HF, high frequency) arranged fibrodendritic laminae. Together, disk-shaped cells tuned to similar frequencies and intermingling afferent layers (purple) make up fibrodendritic laminae. Afferent bands (red andblue) occupy specific sublayers within a given lamina. Afferents that terminate within restricted zones of a target sublayer are termed patches (green). D, Dorsal; V, ventral; M, medial;L, lateral.
Recently, we described the normal development of a banded afferent projection to the IC arising from the dorsal nucleus of the lateral lemniscus (DNLL) (Gabriele and Henkel, 1999; Gabriele et al., 2000). Although the DNLL sends inhibitory, GABAergic projections bilaterally to the IC (Beyerl, 1978; Adams, 1979; Brunso-Bechtold et al., 1981;Kudo, 1981; Adams and Mugnaini, 1984; Thompson et al., 1985; Coleman and Clerici, 1987; Roberts and Ribak, 1987; Glendenning and Baker, 1988; Shneiderman et al., 1988, 1993; Shneiderman and Oliver, 1989;Hutson et al., 1991; Bajo et al., 1993; Merchán et al., 1994; van Adel et al., 1999), a preparation was designed to specifically examine the development of the crossed projection. Dye placement in the commissure of Probst where DNLL fibers cross the midline invariably resulted in equivalent, bilaterally labeled bands in the IC (Gabriele et al., 2000). The results of this recent study in prenatal and postnatal rats indicated that mature afferent bands and patches are established before the onset of hearing [postnatal day 12/13 (P12/13) in rat] (Jewett and Romano, 1972; Puel and Uziel, 1987), suggesting that evoked activity may not be required for the initial organization of patterned projections in the ascending auditory pathway.
Despite considerable debate (for review, see Hübener and Bonhoeffer, 1999), it appears that both endogenously generated patterns of activity and molecular gradients contribute to the initial patterning that occurs in the absence of visual experience (i.e., thalamic eye-specific layers and cortical ocular dominance columns) (Stryker and Harris, 1986; Shatz and Stryker, 1988; Sretavan et al., 1988; Katz and Shatz, 1996; Penn et al., 1998; Crowley and Katz, 1999;Donoghue and Rakic, 1999; Miyashita-Lin et al., 1999; Rubenstein et al., 1999). It may be that these same developmental mechanisms are also influential in guiding the formation of projection patterns in the auditory system before experience. Mounting evidence suggests that spontaneous rhythmic discharges similar to those first described in the retina (Galli and Maffei, 1988; Meister et al., 1991; Wong et al., 1993; Feller et al., 1996, 1997) are present at various levels of the developing auditory system before the onset of hearing (Romand and Ehret, 1990; Rübsamen and Schäfer, 1990; Gummer and Mark, 1994; Lippe, 1994, 1995; Kotak and Sanes, 1995; Kros et al., 1998;Jones and Jones, 2000). Findings in the embryonic chick (Lippe, 1994,1995) suggest that the synchronous and rhythmic firing observed in the auditory nerve and brainstem is generated peripherally because it is abolished after cochlear removal or injection of tetrodotoxin into the perilymph (Koerber et al., 1966; Born and Rubel, 1988; Born et al., 1991; Lippe, 1994).
To determine the role of the sensory epithelia in pattern formation in the absence of auditory experience, we performed unilateral cochlear ablations on P2 rats, before segregation of the crossed DNLL projection (see Fig. 2). The results suggest that the density of the projection is determined by the target environment (IC), whereas pattern formation within the target depends on the activity of the afferent source (DNLL).
Fig. 2.

Summary figure illustrating the normal developmental progression of the crossed DNLL input to the IC before hearing onset. A–C, Pattern of anterogradely filled DNLL fibers within the right IC at P0, P4, and P12, respectively. Dashed contours represent the ventromedial border of the IC. White arrowheads inB denote the earliest indication of contralateral DNLL bands forming within alternating sublayers of the central nucleus of the IC. By onset of hearing (C), adult-like afferent patches are readily apparent (paired arrowheads). D–F, Retrograde transport from a midline dye placement in the commissure of Probst labels contralaterally projecting DNLL cells (right DNLL is depicted). In the present study, unilateral cochlear ablations were performed at P2, before any evidence of afferent banding. Rat pups were then reared to P12 to determine the effect of unilateral cochlear ablation before experience on the development of the crossed DNLL projection.D, Dorsal; V, ventral;M, medial; L, lateral. Scale bars: A–E, 100 μm; F, 150 μm.
Preliminary findings have been published previously (Gabriele and Henkel, 2000).
MATERIALS AND METHODS
Experimental design and cochlear surgery. All procedures were approved by the institution's Animal Care and Use Committee and conform to National Institutes of Health standards. Data compiled from a total of 26 postnatal Sprague Dawley rats were included in the results of the present study (Table1). To test the influence of the auditory periphery on formation of afferent patterns in the IC (Fig.1), unilateral cochlear ablations were performed on P2, before the appearance of afferent banding (Fig.2). Rat pups were anesthetized by hypothermia, and an incision was made just inferior and ventral to the left pinna. The external auditory canal was identified and followed to the tympanic membrane. The middle ear cavity was exposed and cleared of mesenchyme, and the ossicles were identified. At this stage, surgical control animals were sutured and placed on a heating pad until consciousness was regained. In the ablation cases, the footplate of the stapes was carefully removed and access to the cochlear spaces was gained through the oval window. Exposure of the round window was also achieved in several of the cases. In an effort to disrupt the delicate ionic composition of the scalae, distilled water was perfused through the cochlea. Using a pulled Pasteur pipette, remaining cochlear contents were aspirated. The animals were sutured and placed on a heating pad. After recovery, pups were returned as a group to the litter and reared to P12.
Table 1.
Summary of experiments
| Experimental groups | Age at experimental manipulation | Tracer placement in fixed tissue (P12) | Incubation period | n = number of animals included in results |
|---|---|---|---|---|
| Control | No manipulation | DiI in commissure of Probst | 2–3 months | n = 7 |
| Surgical control | (P2) | DiI in commissure of Probst | 2–3 months | n = 12 |
| Unilateral cochlear ablation1-a | (P2) | DiI in commissure of Probst | 2–3 months | n = 7 |
Ablation cases met the following criteria: (1) showed a 20% greater reduction in CN volume on the side of the ablation relative to the unaffected side and (2) exhibited some degree of cochlear damage as evidenced by temporal bone histology.
Fixation, tracer placement, and sectioning. At P12, pups (control, surgical control, and experimental groups) were given an overdose of ketamine (100 mg/kg) and xylazine (12 mg/kg) and perfused through the heart with 4% paraformaldehyde fixative. The brains were subsequently removed from the skull, blocked in the coronal plane just rostral to the superior colliculus, and embedded in an egg yolk/gelatin mixture (5 ml 8% gelatin in dH2O/10 ml egg yolk). Coronal sections (50–75 μm) were cut on a vibratome from rostral to caudal through the block of tissue until the rostral boundary of the commissure of Probst was identified. The commissure was completely severed in the remaining block of tissue, and glass pins coated with crystals of the lipophilic dye 1,1′-dioctodecyl-3,3,3′,3′-tetramethylindocarbocyanine perchlorate (DiI) (Molecular Probes, Eugene, OR) were positioned in the midline (Fig. 3) [see Gabriele et al. (2000) for a more detailed description of the technique, DiI properties, and tracer limitations]. After dye placement, the block was placed in fresh 4% paraformaldehyde fixative and incubated at 37°C in the dark for 2–3 months. Fixative was changed monthly during the incubation period. Coronal sections were then cut (75 μm), mounted onto charged slides, and coverslipped while still wet with 0.1 mphosphate buffer, pH 7.4. Immediately after data collection, the temporary coverslips were removed, and the sections were remounted onto gelatin-subbed slides for Nissl staining with cresyl violet. Slides were then permanently coverslipped with Cytoseal (Stephens Scientific, Riverdale, NJ).
Fig. 3.

Low-magnification photomicrograph of a coronal section through the auditory midbrain of a unilateral cochlear ablation case (dorsal is up). DiI placement in the commissure of Probst (black arrow) results in labeling of the contralateral projection to the IC from each DNLL. Thus, afferent fibers within the IC ipsilateral to the ablation arise from the contralateral DNLL, and vice versa. Note the marked asymmetry in labeling of the retrogradely filled DNLLs, as well as the contralaterally projecting DNLL fibers within the ICs. Such bilateral asymmetry was characteristic in all of the ablation cases and was striking even at very low magnification. Dashed contoursrepresent the ventromedial borders of the ICs. Scale bar, 500 μm.
Fluorescence microscopy and image acquisition. Sections were viewed with an epifluorescent microscope (Nikon) equipped with a rhodamine filter set (ChromaTechnology, Brattleboro, VT). Because of the unstable nature of the fluorescent dye after sectioning, data collection was performed immediately and was completed within 48 hr. Images of all sections containing the DNLL and IC were video-captured and digitized using the public domain NIH Image program [developed at National Institutes of Health and available on the internet athttp://rsb.info.nih.gov/nih-image/; modified by Scion Corp. (Frederick, MD) for Windows system]. To qualitatively assess changes in the development of the projection pattern within the IC, comparable levels of the central nucleus (standardized region comprising the caudal extent of the rostral third of the central nucleus where banding was most evident in P12 controls) were determined on the two sides, and 35 mm photographs were taken. The midpoint of the DNLL along the rostrocaudal axis was also determined and photographed for each case to facilitate comparisons with the contralateral DNLL. Negatives were digitized using an AGFA DuoScan (Brockton, MA). Scanned images then were cropped in Adobe Photoshop (Adobe Systems Inc., San Jose, CA), and only the brightness and contrast were modified. The minimal image processing was standardized, such that minor manipulations in brightness and contrast were uniform for all digitized images.
Quantification of afferent bands in the IC. Digitized images of representative sections of the DiI-labeled DNLL projections to the central nucleus of the IC were processed and analyzed similar to that described previously for quantification of ocular dominance columns (Cabelli et al., 1995; Finney and Shatz, 1998). Briefly, images were smoothed with a low-pass Fourier filter (20% filter size and transition width) using NIH Image software (Scion Corp.). A brightness profile was derived along a line drawn from ventromedial to dorsolateral orthogonal to the axonal layers. Gray levels were normalized by the mean level for each profile. Peaks and troughs in the brightness profiles were identified and (1) band amplitude (peak-to-trough), (2) periodicity of banding (peak-to-peak), and (3) band width (at 50% maximal height) were determined. The mean and SD were calculated for each parameter. The data for the right and left side in unilateral ablation cases and controls were compared using a Student's t test, two-tailed. The data were also processed using a nonlinear regression to best fit a sine wave (GraphPad Prism, San Diego, CA) to the brightness profiles. Coefficient of determination (R2) values within the range 0.5 to 1.0 suggest periodicity of the labeled afferent pattern.
In addition, an index of the overall density (integrated density/unit area) of the projections in the central nucleus of the IC was measured (Scion Image Software) by determining the integrated density for an outlined selection of the central nucleus. In this way, overall density of the labeled projections on each side could be compared in the control and experimental groups.
Histology and data analysis. An essential part of any manipulation study is verification that the desired manipulation was accomplished. Thus, histological preparations of the cochlear nuclei and temporal bones containing the cochleas were assessed for each case.
It has been well documented in the literature that cochlear ablations result in a marked reduction in cochlear nucleus (CN) volume on the side of the ablation (Trune, 1982; Nordeen et al., 1983; Moore and Kowalchuk, 1988; Hashisaki and Rubel, 1989; Hardie and Shepherd, 1999). Using Neurolucida software (Microbrightfield, Colchester, VT), CN areas were traced directly from alternating Nissl sections. The total volume of each CN was estimated from the compiled data using Neuroexplorer (part of the Neurolucida software package). Volumetric comparisons were then calculated for individual cases (percentage reduction; left CN relative to right CN; positive percentages reflect a left CN volume reduction), and means for the three experimental groups were compared using statistical tests.
Temporal bone histology was performed to assess the degree of cochlear damage. Briefly, temporal bones containing the cochleas were harvested for each case after fixation and brain removal. Temporal bones were decalcified in 1% nitric acid in 10% formalin for 2 weeks, dehydrated, embedded in celloidin, and serially sectioned at 20 μm. Sections were then stained with hematoxylin and eosin, mounted, and coverslipped with Solvent-100 medium (IMEB, Inc., San Marcos, CA). Cochlear assessments were performed blindly, and determination of a compromised periphery was made on the basis of several factors (i.e., gross physical disruption or presence of blood in scalae, integrity of the Organ of Corti, presence of hair cells and spiral ganglion neurons, appearance of the stria vascularis).
Cochlear ablation cases (n = 7) were defined on the basis of two criteria: (1) cases showing a 20% or greater reduction in cochlear nucleus volume on the side of the ablation, and (2) cases exhibiting some degree of cochlear damage on the left side as evidenced by the temporal bone histology. Cases that failed to meet both criteria (n = 5) were not considered unilateral cochlear ablations and were included with surgical controls.
RESULTS
DiI labeling of the crossed DNLL projections to the IC
In each of the 26 cases, dye placement in paraformaldehyde-fixed tissue from P12 rat pups was consistently centered in the commissure of Probst. Given the relative isolation of decussating DNLL fibers from other ascending inputs to the IC, the midline commissure was severed to ensure complete labeling of the projections of interest. Labeling in every case yielded detectable axonal labeling that spanned the entire frequency-axis of the central nucleus, as well as retrogradely labeled cells present throughout DNLL isofrequency contours (Tanaka et al., 1985; Merchán et al., 1994; Bajo et al., 1999; Saint-Marie et al., 1999). Importantly, examination of retrogradely filled DNLL cells under high magnification revealed no evidence of collaterals to the ipsilateral IC. In addition, examination of cochlear nuclear subdivisions and the superior olivary complex revealed no retrogradely labeled cells in these hindbrain sources of afferent projections to the IC. Such observations not only provided confidence that the entirety of the crossed DNLL projections was labeled, but also excluded the possibility of partial labeling of other pathways known to send banded inputs to the IC (Kudo, 1981; Oliver, 1987; Shneiderman and Henkel, 1987; Shneiderman et al., 1988; Bajo et al., 1993; Oliver et al., 1997).
Control cases
In all P12 control cases (both normal and surgical controls), dye placement in the midline commissure resulted in symmetrical labeling (Fig. 4). The density and organization of labeled afferents within the IC in normal animals (Fig.4A,B), as well as retrograde filling of their cells of origin within the DNLL (Fig.4C,D), were always equivalent on the two sides. Despite unavoidable differences in the depth of pin placement and the amount of DiI that diffused into the DNLL commissure, the relative density of labeled afferent patterns and retrogradely labeled cells was remarkably consistent across controls. A quantitative index of the density of labeled fibers in the central nucleus of the IC (integrated density/unit area) when compared for the left and right sides varied <5%, thus supporting the qualitative observations.
Fig. 4.

Photomicrographs illustrating the crossed DNLL projections to the IC in a P12 control animal. A,B, DiI-labeled DNLL fibers terminating within the IC, left and right, respectively. Note the symmetry between the two sides in both termination pattern and relative density of the input. Such balance was typical of all control cases. The most lateral band inA and B is evidence of a developing projection from the contralateral DNLL to the deep layer of the external cortex of the IC. The vast majority of fibers, however, terminate within the central nucleus of the IC, forming an adult-like pattern of afferent patches. The approximate thickness (ventromedial–dorsolateral dimension) of patches measures 75 μm.D, Dorsal; V, ventral; M, medial; L, lateral. Dashed contoursrepresent the ventromedial borders of the ICs. C,D, Retrogradely filled cells in left and right DNLL, respectively. As was evident for IC, labeling within the DNLL on the two sides appeared to be symmetric. Scale bars, 150 μm.
Despite the absence of auditory experience during this early postnatal period, each of the labeled DNLL projections had segregated from a homogeneous distribution into an unmistakable pattern of afferent bands and patches that encompassed the entire frequency-axis of the central nucleus. The dense region of axonal labeling within the central nucleus was distinguished by fibers running parallel to the presumed fibrodendritic laminae. In all cases, these parallel afferent fibers appeared to terminate most heavily within alternating sublayers, thereby creating a pattern of afferent bands. Regions along bands that exhibited the heaviest labeling were termed afferent patches. An isolated band of fibers was consistently observed ending lateral to the central nucleus, confirming the presence of a crossed projection from the DNLL to deep layers of the external cortex of the IC [see Gabriele et al. (2000), their Fig. 8, for further detail]. Such reliable symmetry in the density, nuclear distribution, and patterns on the two sides provided an ideal model system for comparison of labeling from equivalent tracer placements in unilaterally lesioned animals.
Unilateral ablation cases
After unilateral cochlear ablation at P2, commissural dye placement at P12 revealed significant changes in the development of the crossed DNLL inputs to the IC. In contrast to the symmetry of anterograde and retrograde labeling observed in controls, each of the seven ablation cases exhibited notable differences in the density and pattern of afferents within the IC on the two sides, as well as in the densities of labeled cells in the DNLLs (Fig.5). A qualitative index of projection density (density/unit area) supports the qualitative observations of asymmetry in that the density of labeling on the left side (ipsilateral to the ablation) was at least five times greater than on the right side (contralateral to ablation) in the experimental group.
Fig. 5.

Photomicrographs illustrating the crossed DNLL inputs to the IC at P12 after unilateral cochlear ablation.A, B, DiI-labeled DNLL fibers terminating within the IC, left and right, respectively. Note the asymmetry between the two sides in the termination pattern and relative density of the input. Afferents within the IC ipsilateral to the ablation (those arising from the deprived DNLL) terminate within appropriate subdivisions of the IC (i.e., as a band in deep layer of external cortex with the majority of the termination within the central nucleus). The heaviest labeling within the central nucleus in this and all experimental cases, ipsilateral and contralateral to the ablation, occupies the correct dorsomedial–ventrolateral position for DNLL patches. The normal pattern of afferent patches within this area of the central nucleus, however, is not evident (A). Although qualitatively fewer, afferents were visible at low magnification in the IC opposite the ablation (B). It is apparent that these fibers not only project to the appropriate region within the central nucleus, but also segregate into distinct afferent bands or patches within this target area. D, Dorsal; V, ventral;M, medial; L, lateral. Dashed contours represent the ventromedial borders of the ICs.C, D, Retrogradely filled cells in the left and right DNLL, respectively. As in all cochlear ablation cases, fewer cells are labeled in the DNLL contralateral to the ablation relative to the DNLL on the side of the ablation. Scale bars, 150 μm.
Differences in the amount and relative organization of labeled fibers within the ICs were most striking (Fig.5A,B). Considerably more afferent fibers were apparent within the ipsilateral IC (input from DNLL on the intact side) compared with the contralateral IC (input from the DNLL on the affected side). However, in no experimental case did either of these labeled projections appear as dense as the DNLL projections labeled in control cases (compare with Fig. 4). In addition to differences in the relative density of labeled afferent fibers, the two sides also displayed obvious differences in projection pattern. Although the bulk of labeling for each projection appeared to occupy the appropriate target area (normal DNLL patch location) within the central nucleus, a normal projection pattern within the IC ipsilateral to the ablation was no longer apparent (Fig. 5A). Bands and patches either failed to segregate within the central nucleus or were obscured by increased branching within intervening spaces. Although the normal banding pattern was not observed in the IC on the side of the ablation, the sparsely labeled projection in the opposite IC was clearly segregated (Fig. 5B), resembling the organization described in control cases. Like P12 controls, the thickness of bands and patches (ventromedial–dorsolateral dimension) within the contralateral IC measured ∼75 μm after unilateral cochlear ablation.
Asymmetric labeling also was apparent in retrograde filling of the DNLLs (Fig. 5C,D). Qualitatively fewer cells were observed in the DNLL contralateral to the ablation. This asymmetric distribution of labeled cells between the ipsilateral and contralateral DNLL was observed in all experimental cases. Although the differences in apparent number of retrogradely filled cells between the ipsilateral and contralateral DNLL was greater in some cases than in others, there were always more labeled cells in the DNLL ipsilateral to the ablation. Although the number of labeled cells appeared to be greater on the side receiving excitatory drive from the intact ear, morphometric analysis indicated no differences in either the volume of the ipsilateral and contralateral DNLL or the mean cell size (data not shown).
Experimental analyses
Quantification of DNLL afferent banding
To quantify the described effects of unilateral cochlear ablation on the establishment of DNLL bands and patches within the central nucleus of the IC, brightness profiles were generated from acquired images of standardized sections (see Materials and Methods). Brightness profiles of a representative control (Fig.6A) and an experimental case (Fig. 6B) illustrate the presence or absence of periodicity for the crossed DNLL projections. A regular sinusoidal periodicity was apparent for the left and right profiles of the control case (Fig. 6A, stippled and solid curves, respectively) as well as for the right profile of the experimental case (Fig. 6B, solid curve), whereas the left profile of the experimental case exhibited no periodicity (Fig. 6B, stippled curve). As a measure of sinusoidal periodicity, nonlinear regressions were performed to best fit a sine wave to each of the individual brightness profiles (offsets of Fig. 6, A and B; see Materials and Methods for significance of nonlinear regressions andR2 values). The meanR2 values for controls and experimental right sides suggest a regular periodicity and were not considered different (0.56 and 0.52, respectively), but the meanR2 value for experimental left sides was significantly different (0.09). Such a low meanR2 value supports the qualitative assessment that the labeled projection distributions for the crossed DNLL inputs terminating within the IC ipsilateral to the ablation were not periodic.
Fig. 6.

Quantification of DNLL afferent band features within the central nucleus of the IC. A, Brightness profile of control case illustrated in Figure 4. Stippled curve corresponds to brightness profile of banding in the left IC; solid curve corresponds to brightness profile for the right IC. Periodicity, band width, and peak-to-trough amplitude were not significantly different between the two sides. Offset to theright are linear regression plots that show a best fit sine wave (solid line) for the left andright profiles. B, Brightness profile of unilateral ablation case shown in Figure 5. Stippled curve represents the brightness profile of labeling in the IC ipsilateral to the ablation (left); solid curve reflects brightness profile for the IC contralateral to the ablation (right). Afferent band features (periodicity, band width, amplitude) in the ipsilateral IC were significantly different from controls, whereas features in the contralateral IC were comparable with controls. Offset to theright are linear regression plots that show a best fit sine wave (solid line) for the left andright profiles. Note the lack of periodicity as evidenced by the poor fit for the left side(R2 = 0.06).
In addition, peaks and troughs in the afferent pattern were identified from the brightness profiles, and peak-to-trough amplitude, period length, and band width were measured. Means and SDs are shown in Table2. The banding parameters were not different between the left and right sides of any controls. In all experimental cases, left side values were significantly different from controls, whereas right side values were not significantly different from controls. Although the period and band width appeared to decrease on the left side relative to controls, it should be emphasized that these measures were not actually periodic based on best sine wave curve fit (Fig. 6B). Therefore, these parameters cannot be compared directly in the experimental cases. It should also be noted that when comparing the amplitudes the data were normalized by the mean in each sample. Thus, the relative change in density of labeling between the peaks and troughs for the right side in the experimental group is not different from controls, but the absolute values of amplitude are greatly reduced given that overall density (integrated density/unit area) is at least five times less than the left side or control density.
Table 2.
Quantification of afferent bands in the central nucleus of IC
| Amplitude | Period | Band width | |
|---|---|---|---|
| Mean and SD for control group | 0.67 ± 0.20 | 156.35 ± 40.33 | 82.40 ± 16.18 |
| Mean and SD for experimental group ipsilateral to ablation (left) | 0.26 ± 0.222-160 | 111.21 ± 44.54* | 57.60 ± 22.902-160 |
| Mean and SD for experimental group contralateral to ablation (right) | 0.74 ± 0.72 | 129.85 ± 28.2 | 68.08 ± 21.69 |
p value < 0.05;
F2-160: p value < 0.005.
Cochlear nucleus degeneration
Unilateral cochlear ablation resulted in a significant reduction in cochlear nucleus volume on the side of the lesion (Fig.7). Although different divisions of the CN appeared to be affected to varying degrees as previously described (Trune, 1982; Moore and Kowalchuk, 1988), percentages reflect reductions in total volume. In experimental animals, reduction in volume of the left CN relative to the right CN ranged from 20 to 57%, with a mean value of 42%. The extent of volume reduction appeared to correlate with the severity of the cochlear lesion.
Fig. 7.

Graph of CN volumes. Each data point represents the percentage difference between the left and right CN volumes for each individual case. Positive data points reflect a reduction of the left CN relative to the right CN. Histogrambars indicate mean percentages, and accompanying error bars represent the SEM for each group. A nonparametric ANOVA was significant (p < 0.001), and a multiple comparison post-test between groups revealed a significant difference (asterisk) between the mean of the experimental group and the means of both the control and the surgical control groups (p < 0.001 and p < 0.01, respectively). A statistical comparison between the control and surgical control means was not considered significant. Thedashed line at the 20% reduction value denotes the CN volume criterion for ablation cases.
Large reductions in CN volume determined by quantitative measurements were evident qualitatively as well, especially in the anteroventral division of the cochlear nucleus (AVCN). Coronal sections through comparable regions of the AVCN are shown for a control and an ablation case (Fig. 8). In the control case, the left and right AVCN appeared similar (Fig.8A,B), whereas the AVCN ipsilateral to the cochlear ablation (Fig. 8C) appeared much smaller than the AVCN on the normal side (Fig. 8D).
Fig. 8.
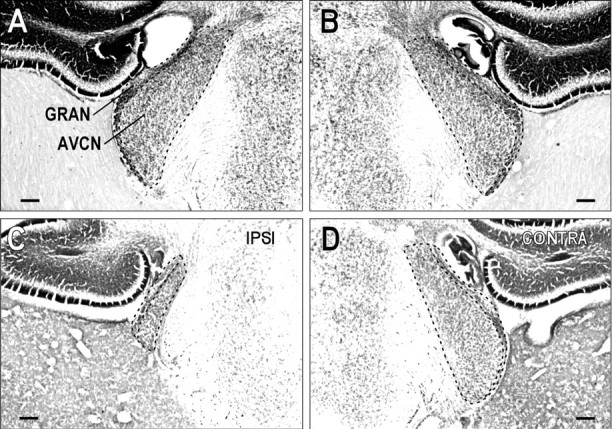
Comparison of CN in a normal animal and after a left cochlear ablation. Low-magnification photomicrographs of comparable regions of the anteroventral cochlear nucleus (AVCN) in a control (A,B) and a unilateral ablation case (C,D) in Nissl-stained sections. Dashed contours delineate the boundaries of the AVCN and demarcate its border with the granule (GRAN) cell region. InC, note the drastic reduction in size of the AVCN ipsilateral to the cochlear ablation relative to that on the side opposite the ablation (D). Scale bars, 150 μm.
Cochlear assessment
Cochlear damage was determined based on the overall physical appearance of the structure, including the relative integrity of the Organ of Corti, the presence or lack of hair cells and spiral ganglion neurons, and the appearance of the stria vascularis. Examination of temporal bone histology revealed evidence of cochlear damage on the operated side (left) in each of the ablation cases. Disruption of cochlear spaces, substantial hair cell loss, and a compromised stria vascularis were common indications of an affected cochlea (Fig.9). Although there was considerable variation in the extent of cochlear damage among cases, the disruption in each case was sufficient not only to cause a substantial reduction in CN volume on the affected side, but also to result in significant reorganization of the developing DNLL circuitry within the auditory midbrain. It is noteworthy that the spiral ganglion appeared unaffected on the ablated side in a few cases, despite evidence of widespread hair cell loss (Fig. 9C). These cases provided confidence that the observed changes were not simply caused by transneuronal degeneration.
Fig. 9.
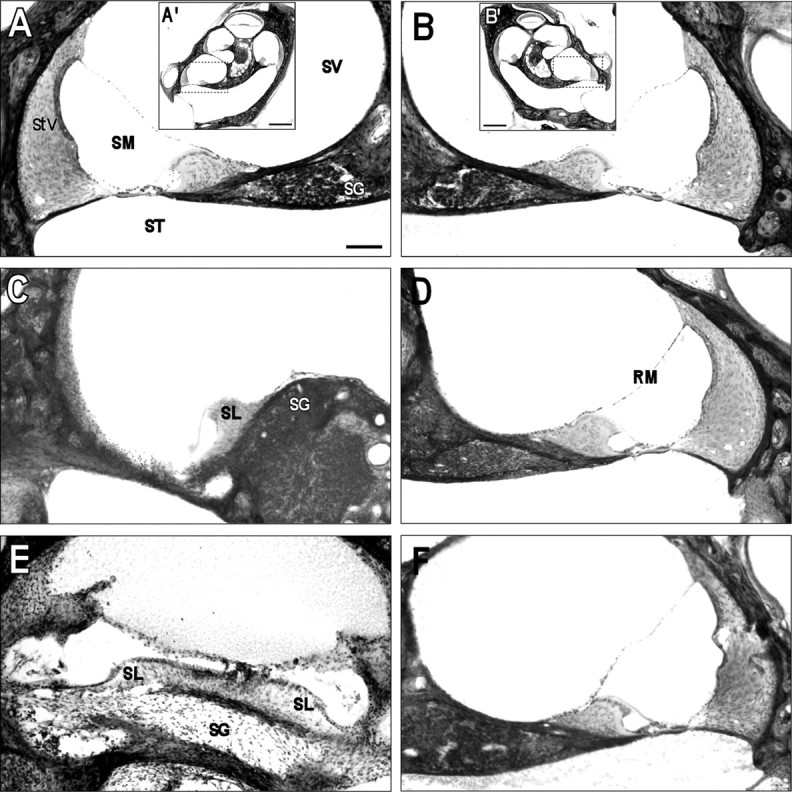
Cochlear histology of control (A, A', B,B') and unilateral ablation cases (C, D, and E,F). A', B', Low-magnification photomicrographs of the left and right cochleas in a control case. Dashed inset boxes are shown at higher magnification in A and B.SV, Scala vestibuli; SM, scala media;ST, scala tympani; SG, spiral ganglion;StV, stria vascularis. C,D, Photomicrographs of the ablated (C) and intact side (D) in an experimental case. Note the atrophied stria vascularis, the absence of Reissner's membrane (RM), and the lack of hair cells on the ablated side. The spiral limbus (SL) was left intact, and there was no evidence of degeneration in the spiral ganglion. E, F, Photomicrographs of the ablated (E) and intact side (F) in an experimental case with a more complete ablation. Despite abundant debris in the cochlear spaces, remnants of the spiral limbus were distinguishable. Considerable degeneration of the spiral ganglion was apparent on the ablated side in this and similar cases. Scale bars: A′, B′, 500 μm; A–F, 100 μm.
DISCUSSION
The results of these experiments in control and unilaterally ablated postnatal rats indicate considerable plasticity in the development of DNLL afferent patterns within the IC. This plasticity suggests that the auditory periphery influences the development of afferent patterns within the IC before the onset of hearing. Although DiI placements in the commissure of Probst in P12 control rats resulted in symmetrical labeling of the DNLL afferent projections, such a balance was altered dramatically after unilateral cochlear ablation (Fig. 10). Specifically, the relative amplitude, periodicity, and band width that were quantitatively assessed from brightness profiles of the labeled afferent projections were significantly asymmetric in experimental animals (Fig. 6, Table2). These results support the possibility that segregation of this binaural projection into bands and patches before the onset of hearing is dependent on a balance of cochlear activity. To further test this notion, future experiments are planned to examine the development of afferent bands and patches in the central nucleus of the IC after bilateral cochlear ablation.
Fig. 10.
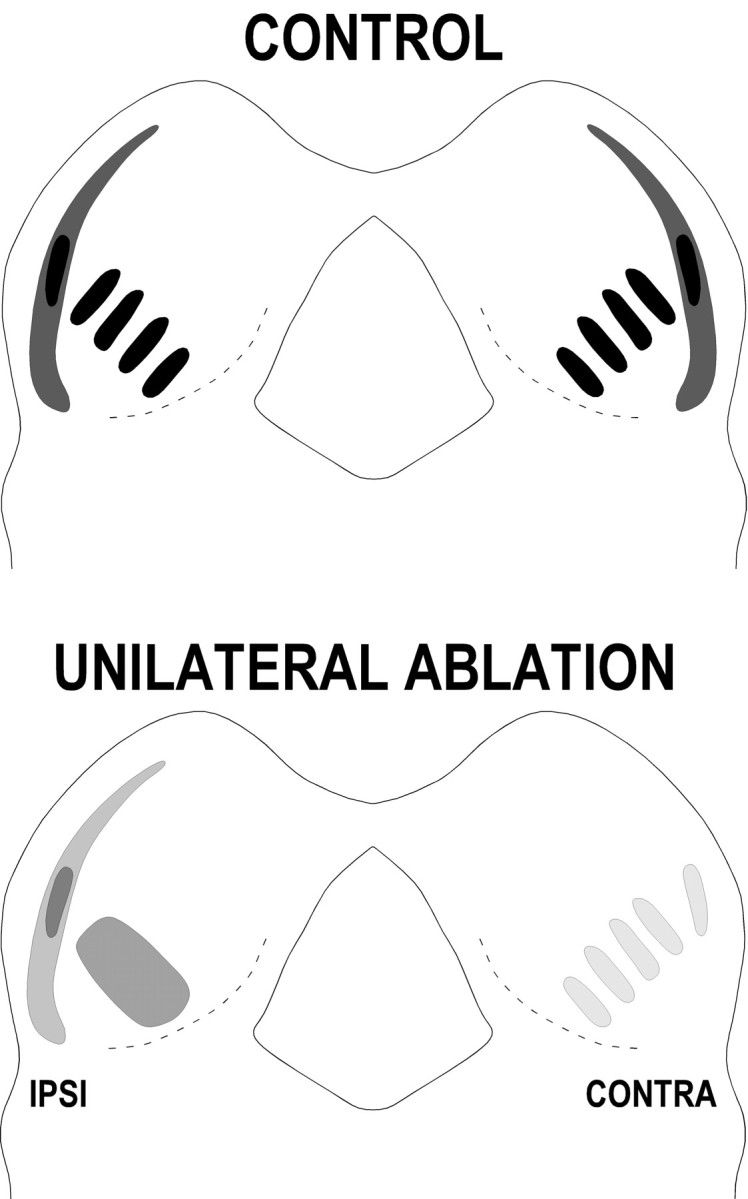
Schematic diagram summarizing the effects of a unilateral cochlear ablation on the development of the crossed DNLL projections to the IC before onset of hearing. Afferent termination within the IC is markedly less dense on both sides when qualitatively compared with P12 control cases. Moreover, in contrast to control cases, all seven ablation cases exhibited striking asymmetry in both distribution pattern and relative density of DNLL afferents. The crossed input from the deprived DNLL to the IC ipsilateral to the ablation always appeared heavier but less organized into bands and patches than the input arising from the nondeprived DNLL to the IC contralateral to the ablation.
Band and patch formation: what guides them?
The initial, diffuse arrangement of DNLL fibers and subsequent segregation into afferent bands previously described (Gabriele et al., 2000), together with the present findings, suggest that developmental factors influence the establishment of projection domains before the onset of experience. For an afferent fiber to project to the appropriate domain within the IC, it not only must identify the appropriate sublayer (afferent bands) of a given fibrodendritic lamina, it also must determine the specific population of neurons within the target sublayer with which to form connections (afferent patches).
In adult cats, it has been shown that injections in matched frequency regions of the dorsal cochlear nucleus and the lateral superior olive (LSO) that are driven by the same ear produced labeled bands of afferent fibers that appeared to terminate within the same sublayer of the contralateral IC (Oliver et al., 1997). Despite being driven by the same ear and occupying the same sublayers, the distribution of these two inputs was shown to preferentially target spatially distinct regions of specific sublayers. These data suggest that laterality of input may guide afferents to their appropriate sublayers, whereas the establishment of patches within sublayers may follow a nucleotopic order that is determined by origin of inputs.
Potential role of the auditory periphery
DNLL bands and patches form before the onset of evoked auditory experience in rat (Gabriele et al., 2000), and the banded pattern of afferents within IC appears to be related to the laterality of inputs. These observations, paired with the present data demonstrating considerable developmental plasticity after unilateral cochlear ablation, suggest that the auditory periphery plays a role in the development of afferent patterns within the IC. Although the rat cochlea is still immature during the first 2 postnatal weeks and compound action potentials recorded at the round window do not appear until between P12 and P13 (Uziel et al., 1981; Rybak et al., 1992), there is rhythmic endogenous activity within the ascending system of various species before hearing onset that is thought to be generated peripherally (Koerber et al., 1966; Born and Rubel, 1988; Romand and Ehret, 1990; Rübsamen and Schäfer, 1990; Born et al., 1991;Gummer and Mark, 1994; Lippe, 1994, 1995; Kotak and Sanes, 1995; Kros et al., 1998; Jones and Jones, 2000). If such endogenous activity conveys meaningful representations of correlated, peripheral events to the IC, then the segregation of afferents within the central nucleus into ear-specific sublayers (i.e., formation of afferent bands within sublayers based on laterality) may involve activity-dependent mechanisms.
Segregation of afferents into appropriate sublayers then may be conceptualized as a pattern of “aural dominance bands,” analogous to ocular dominance columns in the visual cortex (for review, see Katz and Shatz, 1996). In the formation of these aural dominance bands, it is possible that any of the full complement of afferent projections in the interband spaces driven by the opposite ear actively compete with crossed DNLL projections for synaptic space. A number of bilaterally projecting inputs to the IC, including those from the DNLL, distribute endings within parallel interdigitating bands or sublayers (Shneiderman and Henkel, 1987; Oliver et al., 1997; Gabriele et al., 2000). Competition with the uncrossed DNLL projections would be analogous to competitive interactions of pathways from right and left eyes in eye-specific layers in thalamus or ocular dominance columns in visual cortex. Nevertheless, the present data do not provide sufficient information about the potential players in the competitive process to conclude the specific role of competition in forming aural dominance bands.
Results from our experimental animals suggest that segregation of the DNLL input into aural dominance bands depends in some manner on the activity originating in the cochlea. Considering both excitatory and inhibitory ascending auditory circuits, predictions can be made regarding the net effect that a unilateral cochlear ablation has on the activity level in specific auditory nuclei (Fig.11). For example, both DNLL and IC receive most of their excitatory drive contralaterally, whereas ipsilaterally driven inputs are mostly inhibitory in nature (Clopton and Winfield, 1974; Silverman and Clopton, 1977; Beyerl, 1978; Semple and Aitkin, 1979; Brunso-Bechtold et al., 1981; Glendenning et al., 1981; Markovitz and Pollak, 1994; Wu and Kelly, 1995a,b, 1996; Kelly and Li, 1997; Pollak, 1997). The local environments of the DNLL and the IC opposite the lesion, therefore, theoretically will be deprived, because ipsilateral suppression is unaffected, and contralateral excitation is compromised by the ablation. The opposite is true for the DNLL and the IC on the side of the ablation. Decreased inhibition coupled with intact excitatory pathways should result in activity levels that are likely to be enhanced relative to normal.
Fig. 11.

Theoretical model of conditions induced by a unilateral cochlear ablation. The “X” indicates ablation of the left cochlea. Arrows represent hypothesized changes in the levels of intrinsic activity of brainstem auditory nuclei known to send patterned inputs to the IC. No arrow is indicated for the CN contralateral to the ablation because it receives monaural input from the unaffected cochlea. Segregation of the crossed DNLL projections into afferent bands appeared to be dependent on afferent activity, whereas the density of the input appeared to be determined by the postsynaptic environment. The ability of the input to locate the appropriate DNLL position or patch location within the central nucleus was unaffected by the ablation.
Segregation of the crossed projection from the deprived DNLL into distinct bands after cochlear ablation was invariably less evident than in control animals, whereas fibers arising from the DNLL receiving excitatory input from the intact ear consistently separated into bands within the contralateral IC (Fig. 11). A brain slice study performed in neonatal gerbils (Sanes and Takács, 1993) is particularly relevant to these findings (specifically the projection arising from the deprived DNLL), because it demonstrated activity-dependent refinement of another inhibitory brainstem circuit early in auditory development. After cochlear removal in P7 gerbils, individual axons arising from the functionally denervated medial nucleus of the trapezoid body failed to restrict their terminal arbors into isofrequency bands (Henkel and Gabriele, 1999) within the target LSO as previously described (Sanes and Siverls, 1991). The effect of cochlear removal on the LSO environment is analogous to that hypothesized for the IC ipsilateral to the ablation in our study. Similarly, the inhibitory connections from the denervated medial nucleus of the trapezoid body can be likened to the crossed projection from the deprived DNLL. Despite an absence of change in total arbor length and bouton number, Sanes and Takács (1993) reported a significant increase in the number of branch points after denervation of the fibers, perhaps indicative of de novo sprouting. Increased branching and lack of refinement of the crossed projection from the deprived DNLL may contribute to the lack of evident banding within the IC on the side of the ablation. Similar brain slice studies looking at single DNLL axons will be needed to confirm this hypothesis.
Mechanisms of pattern formation before onset of hearing
As described previously, there is considerable evidence that correlated patterns of spontaneous neural activity are present at various levels of the ascending auditory system long before the onset of hearing. These patterns of activity that are thought to be of peripheral origin may direct activity-dependent development of aural dominance bands in the central nucleus of IC. To address appropriately the potential role of activity in early circuit formation, interpretation of the results should not simply consider the amount of afferent activity but rather focus on the correlation between presynaptic and postsynaptic activity. Segregation of the labeled projections within the IC into afferent bands after unilateral cochlear ablation appeared to be dependent on presynaptic activity (activity of DNLL fibers). Fibers arising from the nondeprived DNLL clearly were able to segregate, whereas axons arising from the deprived DNLL failed to form distinct bands within the target. Interestingly, the amount of afferent activity appeared to be unimportant for determining the density of the projection distribution within the target. Instead, the results suggest that the postsynaptic environment (activity of IC cells) determines the relative density of the projection within the target (Fig. 11).
Differential mechanisms for presynaptic and postsynaptic activity might explain the present findings that the denser projection arises from the deprived DNLL with qualitatively fewer retrogradely labeled cells, whereas the sparser projection arises from the nondeprived DNLL exhibiting more retrogradely labeled cells. Terminal arbors from the few cells in the deprived DNLL do not segregate clearly, presumably because of the decrease in afferent activity, yet they appear to elaborate extensively within their target. The relative density of this input likely reflects target conditions favorable for axon elaboration, i.e., normal or enhanced levels of excitation and presumably a normal trophic environment. Conversely, the projection from the nondeprived DNLL likely encounters a target unfavorable for elaboration, i.e., loss of excitation and presumably a decrease in trophic support. Thus, despite being an active input, it fails to display a normal degree of axon elaboration. A recent study in the visual system reported evidence that the differential effects of activity of the afferent axons in comparison with the activity of the target cells regulate the growth and retraction of geniculocortical fibers (Hata et al., 1999). Such findings suggest that it is not merely the amount of activity in afferent fibers but rather the correlation between presynaptic and postsynaptic activity that is important for different aspects of afferent organization.
Although segregation into afferent bands and the relative density of the crossed DNLL projections appeared to be contingent on activity levels of the afferent fibers and the target cells, the ability of these projections to recognize appropriate terminal zones (i.e., DNLL patch location) appeared to be unaffected by cochlear ablation. In all experimental cases, the area along the frequency-axis of the central nucleus with the heaviest label was consistent with the patch location for the crossed DNLL input defined in P12 controls (Gabriele et al., 2000). It may be that the auditory periphery exerts no influence over the nucleotopic ordering of afferents within the central nucleus of the IC. Instead, signaling between presynaptic and postsynaptic elements, including receptor/ligand interactions and/or molecular cues (i.e., neurotrophic or extracellular matrix gradients), may provide sufficient instruction for the organization of afferents based on origin of input. Future experiments are planned to further assess what developmental mechanisms drive circuit formation in the ascending auditory system before experience.
Footnotes
This work was supported by National Institutes of Health (National Institute on Deafness and Other Communication Disorders) Grant DC000813. We thank Dr. David Riddle and Dr. John McHaffie for their helpful comments during the preparation of this manuscript. Technical assistance for temporal bone histology provided by Stephanie Evans and Joan Schnute was invaluable.
Correspondence should be addressed to Dr. Mark L. Gabriele, Department of Neurobiology and Anatomy, Wake Forest University School of Medicine, Medical Center Boulevard, Winston-Salem, NC 27157-1010. E-mail:gabriele@wfubmc.edu.
REFERENCES
- 1.Adams JC. Ascending projections to the inferior colliculus. J Comp Neurol. 1979;183:519–538. doi: 10.1002/cne.901830305. [DOI] [PubMed] [Google Scholar]
- 2.Adams JC, Mugnaini E. Dorsal nucleus of the lateral lemniscus: a nucleus of GABAergic projection neurons. Brain Res Bull. 1984;13:585–590. doi: 10.1016/0361-9230(84)90041-8. [DOI] [PubMed] [Google Scholar]
- 3.Bajo VM, Merchán MA, López DE, Rouiller EM. Neuronal morphology and efferent projections of the dorsal nucleus of the lateral lemniscus in the rat. J Comp Neurol. 1993;334:241–262. doi: 10.1002/cne.903340207. [DOI] [PubMed] [Google Scholar]
- 4.Bajo VM, Merchán MA, Malmierca MS, Nodal FR, Bjaalie JG. Topographic organization of the dorsal nucleus of the lateral lemniscus in the cat. J Comp Neurol. 1999;407:349–366. doi: 10.1002/(sici)1096-9861(19990510)407:3<349::aid-cne4>3.0.co;2-5. [DOI] [PubMed] [Google Scholar]
- 5.Beyerl BD. Afferent projections to the central nucleus of the inferior colliculus in the rat. Brain Res. 1978;145:209–223. doi: 10.1016/0006-8993(78)90858-2. [DOI] [PubMed] [Google Scholar]
- 6.Born DE, Rubel EW. Afferent influences on brain stem auditory nuclei of the chicken: presynaptic action potentials regulate protein synthesis in nucleus magnocellularis neurons. J Neurosci. 1988;8:901–919. doi: 10.1523/JNEUROSCI.08-03-00901.1988. [DOI] [PMC free article] [PubMed] [Google Scholar]
- 7.Born DE, Durham D, Rubel EW. Afferent influences on brainstem auditory nuclei of the chick: nucleus magnocellularis neuronal activity following cochlea removal. Brain Res. 1991;557:37–47. doi: 10.1016/0006-8993(91)90113-a. [DOI] [PubMed] [Google Scholar]
- 8.Brunso-Bechtold JK, Thompson GC, Masterton RB. HRP study of the organization of auditory afferents ascending to central nucleus of inferior colliculus in cat. J Comp Neurol. 1981;197:705–722. doi: 10.1002/cne.901970410. [DOI] [PubMed] [Google Scholar]
- 9.Cabelli RJ, Hohn A, Shatz CJ. Inhibition of ocular dominance column formation by infusion of NT-4/5 or BDNF. Science. 1995;267:1662–1666. doi: 10.1126/science.7886458. [DOI] [PubMed] [Google Scholar]
- 10.Clopton BM, Winfield JA. Tonotopic organization of the inferior colliculus of the rat. Brain Res. 1973;56:355–358. doi: 10.1016/0006-8993(73)90352-1. [DOI] [PubMed] [Google Scholar]
- 11.Clopton BM, Winfield JA. Unit responses in the inferior colliculus of rat to temporal auditory patterns of tone sweeps and noise bursts. Exp Neurol. 1974;42:532–540. doi: 10.1016/0014-4886(74)90076-4. [DOI] [PubMed] [Google Scholar]
- 12.Coleman JR, Clerici WJ. Sources of projections to subdivisions of the inferior colliculus in the rat. J Comp Neurol. 1987;262:215–226. doi: 10.1002/cne.902620204. [DOI] [PubMed] [Google Scholar]
- 13.Crowley JC, Katz LC. Development of ocular dominance columns in the absence of retinal input. Nat Neurosci. 1999;2:1125–1130. doi: 10.1038/16051. [DOI] [PubMed] [Google Scholar]
- 14.Donoghue MJ, Rakic P. Molecular gradients and compartments in the embryonic primate cerebral cortex. Cereb Cortex. 1999;9:586–600. doi: 10.1093/cercor/9.6.586. [DOI] [PubMed] [Google Scholar]
- 15.Faye-Lund H, Osen KK. Anatomy of the inferior colliculus in rat. Anat Embryol. 1985;171:1–20. doi: 10.1007/BF00319050. [DOI] [PubMed] [Google Scholar]
- 16.Feller MB, Wellis DP, Stellwagen D, Werblin FS, Shatz CJ. Requirement for cholinergic synaptic transmission in the propagation of spontaneous retinal waves. Science. 1996;272:1182–1187. doi: 10.1126/science.272.5265.1182. [DOI] [PubMed] [Google Scholar]
- 17.Feller MB, Butts DA, Aaron HL, Rokhsar DS, Shatz CJ. Dynamic processes shape spatiotemporal properties of retinal waves. Neuron. 1997;19:293–306. doi: 10.1016/s0896-6273(00)80940-x. [DOI] [PubMed] [Google Scholar]
- 18.Finney EM, Shatz CJ. Establishment of patterned thalamocortical connections does not require nitric oxide synthase. J Neurosci. 1998;18:8826–8838. doi: 10.1523/JNEUROSCI.18-21-08826.1998. [DOI] [PMC free article] [PubMed] [Google Scholar]
- 19.Gabriele ML, Henkel CK. Developmental plasticity of afferents to the inferior colliculus in the rat: projection from the dorsal nucleus of the lateral lemniscus. Assoc Res Otolaryngol Abstr. 1999;22:220. [Google Scholar]
- 20.Gabriele ML, Henkel CK. Changes in development of afferent patterns in the inferior colliculus of the rat following unilateral cochlear ablation. Assoc Res Otolaryngol Abstr. 2000;23:180. doi: 10.1523/JNEUROSCI.20-18-06939.2000. [DOI] [PMC free article] [PubMed] [Google Scholar]
- 21.Gabriele ML, Brunso-Bechtold JK, Henkel CK. Development of afferent patterns in the inferior colliculus of the rat: projection from the dorsal nucleus of the lateral lemniscus. J Comp Neurol. 2000;416:368–382. doi: 10.1002/(sici)1096-9861(20000117)416:3<368::aid-cne8>3.0.co;2-c. [DOI] [PubMed] [Google Scholar]
- 22.Galli L, Maffei L. Spontaneous impulse activity of rat retinal ganglion cells in prenatal life. Science. 1988;242:90–91. doi: 10.1126/science.3175637. [DOI] [PubMed] [Google Scholar]
- 23.Glendenning KK, Baker BN. Neuroanatomical distribution of receptors for three potential inhibitory neurotransmitters in the brainstem auditory nuclei of the cat. J Comp Neurol. 1988;275:288–308. doi: 10.1002/cne.902750210. [DOI] [PubMed] [Google Scholar]
- 24.Glendenning KK, Brunso-Bechtold JK, Thompson GC, Masterton RB. Ascending auditory afferents to the nuclei of the lateral lemniscus. J Comp Neurol. 1981;197:673–703. doi: 10.1002/cne.901970409. [DOI] [PubMed] [Google Scholar]
- 25.Gummer AW, Mark RF. Patterned neural activity in brain stem auditory areas of a prehearing mammal, the tammar wallaby (Macropus eugenii). NeuroReport. 1994;5:685–688. doi: 10.1097/00001756-199402000-00006. [DOI] [PubMed] [Google Scholar]
- 26.Hardie NA, Shepherd RK. Sensorineural hearing loss during development: morphological and physiological response of the cochlea and auditory brainstem. Hear Res. 1999;128:147–165. doi: 10.1016/s0378-5955(98)00209-3. [DOI] [PubMed] [Google Scholar]
- 27.Hashisaki GT, Rubel EW. Effects of unilateral cochlea removal on anteroventral cochlear nucleus neurons in developing gerbils. J Comp Neurol. 1989;283:5–73. doi: 10.1002/cne.902830402. [DOI] [PubMed] [Google Scholar]
- 28.Hata Y, Tsumoto T, Stryker MP. Selective pruning of more active afferents when cat visual cortex is pharmacologically inhibited. Neuron. 1999;22:375–381. doi: 10.1016/s0896-6273(00)81097-1. [DOI] [PubMed] [Google Scholar]
- 29.Henkel CK, Gabriele ML. Organization of the disynaptic pathway from the anteroventral cochlear nucleus to the lateral superior olivary nucleus in the ferret. Anat Embryol. 1999;199:149–160. doi: 10.1007/s004290050216. [DOI] [PubMed] [Google Scholar]
- 30.Huang C, Fex J. Tonotopic organization of the inferior colliculus of the rat demonstrated with the 2-deoxyglucose method. Exp Brain Res. 1986;61:506–512. doi: 10.1007/BF00237575. [DOI] [PubMed] [Google Scholar]
- 31.Hübener M, Bonhoeffer T. Eyes wide shut. Nat Neurosci. 1999;2:1043–1045. doi: 10.1038/15964. [DOI] [PubMed] [Google Scholar]
- 32.Hutson KA, Glendenning KK, Masterton RB. Acoustic chiasm. IV: Eight midbrain decussations of the auditory system in the cat. J Comp Neurol. 1991;312:105–131. doi: 10.1002/cne.903120109. [DOI] [PubMed] [Google Scholar]
- 33.Jewett DL, Romano MN. Neonatal development of auditory system potentials averaged from the scalp of rat and cat. Brain Res. 1972;36:101–115. doi: 10.1016/0006-8993(72)90769-x. [DOI] [PubMed] [Google Scholar]
- 34.Jones S, Jones T. Bursting discharge pattern of cochlear ganglion cells in the E15–E18 chicken embryo. Assoc Res Otolaryngol Abstr. 2000;23:248. [Google Scholar]
- 35.Katz LC, Shatz CJ. Synaptic activity and the construction of cortical circuits. Science. 1996;274:1133–1138. doi: 10.1126/science.274.5290.1133. [DOI] [PubMed] [Google Scholar]
- 36.Kelly JB, Li L. Two sources of inhibition affecting binaural evoked responses in the rat's inferior colliculus: the dorsal nucleus of the lateral lemniscus and the superior olivary complex. Hear Res. 1997;104:112–126. doi: 10.1016/s0378-5955(96)00182-7. [DOI] [PubMed] [Google Scholar]
- 37.Kelly JB, Liscum A, van Adel B, Ito M. Projections from the superior olive and lateral lemniscus to tonotopic regions of the rat's inferior colliculus. Hear Res. 1998;116:43–54. doi: 10.1016/s0378-5955(97)00195-0. [DOI] [PubMed] [Google Scholar]
- 38.Koerber KC, Pfeiffer WB, Kiang NY-S. Spontaneous spike discharges from single units in the cochlear nucleus after destruction of the cochlea. Exp Neurol. 1966;16:119–130. doi: 10.1016/0014-4886(66)90091-4. [DOI] [PubMed] [Google Scholar]
- 39.Kotak VC, Sanes DH. Synaptically evoked prolonged depolarizations in the developing auditory system. J Neurophysiol. 1995;74:1611–1620. doi: 10.1152/jn.1995.74.4.1611. [DOI] [PubMed] [Google Scholar]
- 40.Kros CJ, Ruppersberg JP, Rusch A. Expression of a potassium current in inner hair cells during development of hearing in mice. Nature. 1998;394:281–284. doi: 10.1038/28401. [DOI] [PubMed] [Google Scholar]
- 41.Kudo M. Projections of the nuclei of the lateral lemniscus in the cat: an autoradiographic study. Brain Res. 1981;221:57–69. doi: 10.1016/0006-8993(81)91063-5. [DOI] [PubMed] [Google Scholar]
- 42.Lippe WR. Rhythmic spontaneous activity in the developing avian auditory system. J Neurosci. 1994;14:1486–1495. doi: 10.1523/JNEUROSCI.14-03-01486.1994. [DOI] [PMC free article] [PubMed] [Google Scholar]
- 43.Lippe WR. Relationship between frequency of spontaneous bursting and tonotopic position in the developing avian auditory system. Brain Res. 1995;703:205–213. doi: 10.1016/0006-8993(95)01096-3. [DOI] [PubMed] [Google Scholar]
- 44.Malmierca MS, Blackstad TW, Osen KK, Karagulle T, Molowny RL. The central nucleus of the inferior colliculus in rat: a Golgi and computer reconstruction study of neuronal and laminar structure. J Comp Neurol. 1993;333:1–27. doi: 10.1002/cne.903330102. [DOI] [PubMed] [Google Scholar]
- 45.Markovitz NS, Pollak GD. Binaural processing in the dorsal nucleus of the lateral lemniscus. Hear Res. 1994;73:121–140. doi: 10.1016/0378-5955(94)90290-9. [DOI] [PubMed] [Google Scholar]
- 46.Meister M, Wong RO, Baylor DA, Shatz CJ. Synchronous bursts of action potentials in ganglion cells of the developing mammalian retina. Science. 1991;252:939–943. doi: 10.1126/science.2035024. [DOI] [PubMed] [Google Scholar]
- 47.Merchán MA, Saldaña E, Plaza I. Dorsal nucleus of the lateral lemniscus in the rat: concentric organization and tonotopic projection to the inferior colliculus. J Comp Neurol. 1994;342:259–278. doi: 10.1002/cne.903420209. [DOI] [PubMed] [Google Scholar]
- 48.Merzenich MM, Reid MD. Representation of the cochlea within the inferior colliculus of the cat. Brain Res. 1974;77:397–415. doi: 10.1016/0006-8993(74)90630-1. [DOI] [PubMed] [Google Scholar]
- 49.Miyashita-Lin EM, Hevner R, Wassarman KM, Martinez S, Rubenstein JL. Early neocortical regionalization in the absence of thalamic innervation. Science. 1999;285:906–909. doi: 10.1126/science.285.5429.906. [DOI] [PubMed] [Google Scholar]
- 50.Moore DR, Kowalchuk NE. Auditory brainstem of the ferret: effects of unilateral cochlear lesions on cochlear nucleus volume and projections to the inferior colliculus. J Comp Neurol. 1988;272:503–515. doi: 10.1002/cne.902720405. [DOI] [PubMed] [Google Scholar]
- 51.Morest DK, Oliver DL. The neuronal architecture of the inferior colliculus in the cat: defining the functional anatomy of the auditory midbrain. J Comp Neurol. 1984;222:209–236. doi: 10.1002/cne.902220206. [DOI] [PubMed] [Google Scholar]
- 52.Nordeen KW, Killackey HP, Kitzes LM. Ascending projections to the inferior colliculus following unilateral cochlear ablation in the neonatal gerbil, Meriones unguiculatus. J Comp Neurol. 1983;214:144–153. doi: 10.1002/cne.902140204. [DOI] [PubMed] [Google Scholar]
- 53.Oliver DL. Projections to the inferior colliculus from the anteroventral cochlear nucleus in the cat: possible substrates for binaural interaction. J Comp Neurol. 1987;264:24–46. doi: 10.1002/cne.902640104. [DOI] [PubMed] [Google Scholar]
- 54.Oliver DL, Morest DK. The central nucleus of the inferior colliculus in the cat. J Comp Neurol. 1984;222:237–264. doi: 10.1002/cne.902220207. [DOI] [PubMed] [Google Scholar]
- 55.Oliver DL, Kuwada S, Yin TC, Haberly LB, Henkel CK. Dendritic and axonal morphology of HRP-injected neurons in the inferior colliculus of the cat. J Comp Neurol. 1991;303:75–100. doi: 10.1002/cne.903030108. [DOI] [PubMed] [Google Scholar]
- 56.Oliver DL, Beckius GE, Bishop DC, Kuwada S. Simultaneous anterograde labeling of axonal layers from lateral superior olive and dorsal cochlear nucleus in the inferior colliculus of cat. J Comp Neurol. 1997;382:215–229. doi: 10.1002/(sici)1096-9861(19970602)382:2<215::aid-cne6>3.0.co;2-6. [DOI] [PubMed] [Google Scholar]
- 57.Penn AA, Riquelme PA, Feller MB, Shatz CJ. Competition in retinogeniculate patterning driven by spontaneous activity. Science. 1998;279:2108–2112. doi: 10.1126/science.279.5359.2108. [DOI] [PubMed] [Google Scholar]
- 58.Pollak GD. Roles of GABAergic inhibition for the binaural processing of multiple sound sources in the inferior colliculus. Ann Otol Rhinol Laryngol [Suppl] 1997;168:44–54. [PubMed] [Google Scholar]
- 59.Puel JL, Uziel A. Correlative development of cochlear action potential sensitivity, latency, and frequency selectivity. Brain Res. 1987;465:179–188. doi: 10.1016/0165-3806(87)90239-2. [DOI] [PubMed] [Google Scholar]
- 60.Roberts RC, Ribak CE. GABAergic neurons and axon terminals in the brainstem auditory nuclei of the gerbil. J Comp Neurol. 1987;258:267–280. doi: 10.1002/cne.902580207. [DOI] [PubMed] [Google Scholar]
- 61.Romand R, Ehret G. Development of tonotopy in the inferior colliculus. I. Electrophysiological mapping in house mice. Dev Brain Res. 1990;54:221–234. doi: 10.1016/0165-3806(90)90145-o. [DOI] [PubMed] [Google Scholar]
- 62.Rubenstein JL, Anderson S, Shi L, Miyashita-Lin E, Bulfone A, Hevner R. Genetic control of cortical regionalization and connectivity. Cereb Cortex. 1999;9:524–532. doi: 10.1093/cercor/9.6.524. [DOI] [PubMed] [Google Scholar]
- 63.Rübsamen R, Schäfer M. Ontogenesis of auditory fovea representation in the inferior colliculus of the Sri Lankan rufous horseshoe bat, Rhinolophus rouxi. J Comp Physiol. 1990;167:757–769. doi: 10.1007/BF00189766. [DOI] [PubMed] [Google Scholar]
- 64.Ryan AF, Furlow Z, Woolf ND, Keithley EM. The spatial representation of frequency in the rat dorsal cochlear nucleus and inferior colliculus. Hear Res. 1988;36:181–190. doi: 10.1016/0378-5955(88)90060-3. [DOI] [PubMed] [Google Scholar]
- 65.Rybak LP, Whitworth C, Scott V. Development of endocochlear potential and compound action potential in the rat. Hear Res. 1992;59:189–194. doi: 10.1016/0378-5955(92)90115-4. [DOI] [PubMed] [Google Scholar]
- 66.Saint-Marie RL, Luo L, Ryan AF. Spatial representation of frequency in the rat dorsal nucleus of the lateral lemniscus as revealed by acoustically induced c-fos mRNA expression. Hear Res. 1999;128:70–74. doi: 10.1016/s0378-5955(98)00188-9. [DOI] [PubMed] [Google Scholar]
- 67.Sanes DH, Siverls V. The development and specificity of inhibitory terminal arborizations in the central nervous system. J Neurobiol. 1991;22:837–854. doi: 10.1002/neu.480220805. [DOI] [PubMed] [Google Scholar]
- 68.Sanes DH, Takács C. Activity-dependent refinement of inhibitory connections. Eur J Neurosci. 1993;5:570–574. doi: 10.1111/j.1460-9568.1993.tb00522.x. [DOI] [PubMed] [Google Scholar]
- 69.Semple MN, Aitkin LM. Representation of sound frequency and laterality by units in central nucleus of cat inferior colliculus. J Neurophysiol. 1979;42:1626–1639. doi: 10.1152/jn.1979.42.6.1626. [DOI] [PubMed] [Google Scholar]
- 70.Shatz CJ, Stryker MP. Prenatal tetrodotoxin infusion blocks segregation of retinogeniculate afferents. Science. 1988;242:87–89. doi: 10.1126/science.3175636. [DOI] [PubMed] [Google Scholar]
- 71.Shneiderman A, Henkel CK. Banding of lateral superior olivary nucleus afferents in the inferior colliculus: a possible substrate for sensory integration. J Comp Neurol. 1987;266:519–534. doi: 10.1002/cne.902660406. [DOI] [PubMed] [Google Scholar]
- 72.Shneiderman A, Oliver DL. EM autoradiographic study of the projections from the dorsal nucleus of the lateral lemniscus: a possible source of inhibitory inputs to the inferior colliculus. J Comp Neurol. 1989;286:28–47. doi: 10.1002/cne.902860103. [DOI] [PubMed] [Google Scholar]
- 73.Shneiderman A, Oliver DL, Henkel CK. Connections of the dorsal nucleus of the lateral lemniscus: an inhibitory parallel pathway in the ascending auditory system? J Comp Neurol. 1988;276:188–208. doi: 10.1002/cne.902760204. [DOI] [PubMed] [Google Scholar]
- 74.Shneiderman A, Chase MB, Rockwood JM, Benson CG, Potashner SJ. Evidence for a GABAergic projection from the dorsal nucleus of the lateral lemniscus to the inferior colliculus. J Neurochem. 1993;60:72–82. doi: 10.1111/j.1471-4159.1993.tb05824.x. [DOI] [PubMed] [Google Scholar]
- 75.Silverman MS, Clopton BS. Plasticity of binaural interaction. I. Effect of early auditory deprivation. J Neurophysiol. 1977;40:1266–1274. doi: 10.1152/jn.1977.40.6.1266. [DOI] [PubMed] [Google Scholar]
- 76.Sretavan DW, Shatz CJ, Stryker MP. Modification of retinal ganglion cell axon morphology by prenatal infusion of tetrodotoxin. Nature. 1988;336:468–471. doi: 10.1038/336468a0. [DOI] [PubMed] [Google Scholar]
- 77.Stryker MP, Harris WA. Binocular impulse blockade prevents the formation of ocular dominance columns in cat visual cortex. J Neurosci. 1986;6:2117–2133. doi: 10.1523/JNEUROSCI.06-08-02117.1986. [DOI] [PMC free article] [PubMed] [Google Scholar]
- 78.Tanaka K, Otani K, Tokunaga A, Sugita S. The organization of neurons in the nucleus of the lateral lemniscus projecting to the superior and inferior colliculi in the rat. Brain Res. 1985;341:252–260. doi: 10.1016/0006-8993(85)91064-9. [DOI] [PubMed] [Google Scholar]
- 79.Thompson GC, Cortez AM, Lam DM. Localization of GABA immunoreactivity in the auditory brainstem of guinea pigs. Brain Res. 1985;339:119–122. doi: 10.1016/0006-8993(85)90628-6. [DOI] [PubMed] [Google Scholar]
- 80.Trune DR. Influence of neonatal cochlear removal on the development of mouse cochlear nucleus: I. Number, size, and density of its neurons. J Comp Neurol. 1982;209:409–424. doi: 10.1002/cne.902090410. [DOI] [PubMed] [Google Scholar]
- 81.Uziel A, Romand R, Marot M. Development of cochlear potentials in rats. Audiology. 1981;20:89–100. doi: 10.3109/00206098109072687. [DOI] [PubMed] [Google Scholar]
- 82.van Adel BA, Kidd SA, Kelly JB. Contribution of the commissure of Probst to binaural evoked responses in the rat's inferior colliculus: interaural time differences. Hear Res. 1999;130:115–130. doi: 10.1016/s0378-5955(98)00226-3. [DOI] [PubMed] [Google Scholar]
- 83.Wong RO, Meister M, Shatz CJ. Transient period of correlated bursting activity during development of the mammalian retina. Neuron. 1993;11:923–938. doi: 10.1016/0896-6273(93)90122-8. [DOI] [PubMed] [Google Scholar]
- 84.Wu SH, Kelly JB. In vitro brain slice studies of the rat's dorsal nucleus of the lateral lemniscus. I. Membrane and synaptic response properties. J Neurophysiol. 1995a;73:780–793. doi: 10.1152/jn.1995.73.2.780. [DOI] [PubMed] [Google Scholar]
- 85.Wu SH, Kelly JB. In vitro brain slice studies of the rat's dorsal nucleus of the lateral lemniscus: II. Physiological properties of biocytin-labeled neurons. J Neurophysiol. 1995b;73:794–809. doi: 10.1152/jn.1995.73.2.794. [DOI] [PubMed] [Google Scholar]
- 86.Wu SH, Kelly JB. In vitro brain slice studies of the rat's dorsal nucleus of the lateral lemniscus: III. Synaptic pharmacology. J Neurophysiol. 1996;75:1271–1282. doi: 10.1152/jn.1996.75.3.1271. [DOI] [PubMed] [Google Scholar]