

Abstract
Secretion of the neuropeptide arginine vasopressin (AVP) from the neurohypophysis is optimized by short phasic bursts of action potentials with a mean intraburst frequency around 10 Hz. Several hypotheses, most prominently action-potential broadening and buildup of residual calcium, have been proposed to explain this frequency dependence of AVP release. However, how either of these mechanisms would optimize release at any given frequency remains an open question. We have addressed this issue by correlating the frequency-dependence of intraterminal calcium dynamics and AVP release during action-potential stimulation.
By monitoring the intraterminal calcium changes with low-affinity indicator dyes and millisecond time resolution, the signal could be dissected into three separate components: rapid Ca2+rises (Δ[Ca2+]tr) related to action-potential depolarization, Ca2+ extrusion and/or uptake, and a gradual increase in residual calcium (Δ[Ca2+]res) throughout the stimulus train. Action-potential stimulation modulated all three components in a manner dependent on both the stimulation frequency and number of stimuli. Overall, the cumulative Δ[Ca2+]tr amplitude initially increased with fStim and then rapidly deteriorated, with a maximum aroundfStim ≤ 5 Hz. Residual calcium levels, in contrast, increased monotonically with stimulation frequency.
Simultaneously with the calcium measurements we determined the amount of AVP release evoked by each stimulus train. Hormone release increased with fStim beyond the peak in Δ[Ca2+]tr amplitudes, reaching its maximum between 5 and 10 Hz before returning to its 1 Hz level. Thus, AVP release responds to the temporal patterning of stimulation, is sensitive to both Δ[Ca2+]tr and Δ[Ca2+]res, and is optimized at a frequency intermediate between the frequency-dependent maxima in Δ[Ca2+]tr and Δ[Ca2+]res.
Keywords: calcium dynamics, excitation-secretion coupling, arginine vasopressin, exocytosis, neurohypophysis, action potential, residual calcium
Secretion of the peptide hormones arginine vasopressin (AVP) and oxytocin (OXT) from the mammalian posterior pituitary is differentially regulated by the pattern of action-potential activity that evokes release (Poulain and Wakerley, 1982; Cazalis et al., 1985; Gainer et al., 1986; Bicknell, 1988). AVP secretion is optimized by phasic bursts of action potentials, whereas optimal OXT release is associated with sustained high-frequency stimulation. Frequency-dependent action-potential broadening is thought to be one of the mechanisms involved in this pattern-dependent regulation of secretion (Gainer et al., 1986; Bourque, 1990; Jackson et al., 1991). Buildup of residual calcium levels during bursts of action potentials is considered another contributing factor (Jackson et al., 1991; Stuenkel and Nordmann, 1993; Stuenkel, 1994). In addition, P/Q-type Ca2+-channels are expressed in AVP terminals, but not OXT terminals, and are believed to play a direct role in AVP secretion in the rat (Wang et al., 1997).
The purpose of our present study was twofold. First, we aimed to resolve the relative changes of Δ[Ca2+]iwithin a given stimulation train, i.e., on a millisecond time scale. This time resolution would enable us to track relative changes in the near-membrane level of intraterminal Ca2+, as well as in the kinetics of the Ca2+ extrusion and/or uptake process, and to follow the amplitude and kinetics of residual calcium levels during trains of action potentials. Furthermore, for a meaningful comparison of stimulation-induced [Ca2+]i changes, on the one hand, and the corresponding amount of hormone secretion, on the other hand, we wanted to measure both quantities simultaneously from the same preparation. To accomplish these goals, we used the low-affinity calcium indicator dye Mag-Fluo-4, which improved the temporal resolution of the Δ[Ca2+]i records from ∼1 sec (Jackson et al., 1991; Stuenkel and Nordmann, 1993;Stuenkel, 1994) to ≤1 msec. Concurrently, we applied a quantitative enzyme immunoassay (EIA) to sample aliquots withdrawn from the bathing saline immediately after a given stimulation train to assess the amount of evoked hormone secretion.
The improved temporal resolution of the Δ[Ca2+]imeasurements permitted us to isolate different components of Δ[Ca2+]i and to determine their distinct patterns of modulation within a given train of action potentials. We demonstrate that these patterns vary with both the frequency of stimulation and the number of action potentials within the train. We also show that AVP release is shaped by the detailed and distinct dependence of transient and residual calcium on the temporal patterning of stimulation.
Portions of this work have been published previously in abstract form (Muschol et al., 1999; Muschol and Salzberg, 2000).
MATERIALS AND METHODS
Preparation and apparatus. Details of the preparation and apparatus have been described previously (Salzberg et al., 1983,1985, 2000a; Gainer et al., 1986; Obaid et al., 1989). Briefly, 30- to 60-d-old CD-1 female mice (Jackson Laboratories, Bar Harbor, ME) were sacrificed using CO2 asphyxiation followed by decapitation. The neurohypophysis, together with the pars intermedia and a short segment of the infundibular stalk, was separated from the anterior pituitary. The preparation was mounted in an optical recording chamber and perfused with oxygenated (95% O2, 5% CO2) physiological saline containing (in mm): NaCl 155, KCl 5.6, CaCl2 2.2, MgCl2 1, glucose 10, HEPES 20, pH 7.4, at a rate of 300 μl/min. Trains of action potentials were generated in the nerve terminals of the neurohypophysis by field depolarization of their axons at the level of the infundibular stalk with a pair of Teflon-insulated platinum (90%)–iridium (10%) wires. A Master-8 pulse generator (A.M.P.I., Jerusalem, Israel), driving two ISO-Flex stimulus isolators (A.M.P.I.), provided the bipolar pulses of 500 μsec duration that were used for field depolarization. All experiments were performed at room temperature (23 ± 2°C). All chemicals used were from Sigma (St. Louis, MO) unless indicated otherwise.
Fluorescence measurements of calcium changes. The neurohypophysis was incubated for 90 min in a physiological saline containing 5 μm of the AM form of the low-affinity (KD,Ca = 22 μm) calcium indicator dye Mag-Fluo-4 (Molecular Probes, Eugene, OR), 0.9% dimethyl sulfoxide, and 0.1% Pluronic F-127 (BASF Wyandotte, Wyandotte, MI). All fluorescence measurements were performed on an upright UEM Microscope (Zeiss, Jena, Germany) using a Nikon 10× Fluor objective (NA = 0.5). Light from a 300 W tungsten halogen lamp was passed through a 470 ± 20 nm excitation filter (Zeiss). Dye fluorescence was monitored at λ > 515 nm (Schott Optical Glass Co., Duryea, PA) with a single large-area photodiode (PV-444, Perkin Elmer Optoelectronics, Vaudreuil, Canada). The photocurrent was converted into a voltage signal using a custom-built two-stage sample-and-hold amplifier (Cellular and Molecular Physiology Electronics Shop, Yale University School of Medicine, New Haven, CT). The sample-and-hold circuitry enabled us to measure and subtract the resting fluorescence, F0, before second-stage amplification of the small, stimulation-induced fluorescence changes, ΔF, superimposed on the fluorescence background F0. The output from the second-stage amplifier was filtered at 1 kHz with a LPF-8 low-pass eight-pole Bessel filter (Warner Instrument Corporation, Hamden, CT) and acquired at 16-bit resolution with an AT-MIO-16XE-50 data acquisition board (National Instruments, Austin, TX) running under the control of LabView Software (National Instruments). The fluorescence changes, ΔF, were corrected for dye bleaching by subtracting a stimulation-free reference record collected immediately after each measurement. Total measurement duration for the fluorescence records varied from 45 sec at 1 Hz down to 6 sec for all stimulation frequencies above 10 Hz. In a typical experiment, the tissue was allowed to rest for 15 min between stimulation trains. Trapping of calcium ionophores (A23187, ionomycin) in the outer layers of the neurohypophysis prevented us from using them to convert the ΔF/F0 values into absolute changes in [Ca2+]i.
Enzyme immunoassay of AVP release. The amount of AVP released during a given stimulus train was determined using a solid-phase EIA Assay kit (Assay Designs, Ann Arbor, MI). To counteract the proteolytic activity in the tissue, the protease inhibitors phenylmethanesulfonyl fluoride (0.1 mm; Fluka Chemical Corp., Ronkonkoma, NY), leupeptin (2 μg/ml), and aprotinin (5.2 × 10⁻³TIU/ml) were added to the physiological saline. Immediately before stimulation, superfusion flow through the recording chamber was halted. After a 5 min waiting period, 350 μl of the perfusate surrounding the tissue was collected and kept at 4°C. A 96-well EIA kit was used to analyze the AVP content in the samples. At the end of the second incubation period, sample absorbance at λ = 405 nm was determined with a Titertek Multiskan MCC/340 plate reader (Flow Laboratories, McLean, VA). Absorbance readings were converted into absolute AVP concentrations by interpolation from the absorbance of eight AVP calibration standards fitted to a four-parameter logistic equation [for details, see Chan (1987)].
Data analysis. Fluorescence data were processed using the IGOR data analysis software (Wavemetrics, Lake Oswego, OR). We used a seven-point binomial smoothing algorithm to reduce noise in the ΔF/F0 traces. This considerably improved the reliability of subsequent peak-detection procedures without affecting the time course or amplitude of the ΔF/F0 changes. Furthermore, the amplitudes of the first stimulation-induced peak in ΔF/F0 from all records within one experiment were matched to each other. As can be seen in Figure 1B, these amplitudes were already within 10% of one another before normalization. Values for ΔF/F0 before and at the peak immediately after each stimulus were extracted using a custom macro. These values were used to determine the amplitudes of the transient Ca2+ rise, Δ[Ca2+]tr, and the change in residual calcium, Δ[Ca2+]res.
Fig. 1.

Frequency dependence of intraterminal calcium changes. A, Superposition of the fluorescence changes, ΔF/F0, recorded with the low-affinity calcium indicator dye Mag-Fluo-4/AM (KD, Ca = 22 μm) in the mouse neurohypophysis during trains of 40 action potentials at the indicated frequencies. The fluorescence data were low-pass-filtered at 1 kHz and corrected for dye bleaching by subtraction of a reference trace without stimulation. The data in A were also passed through a seven-point smoothing algorithm, and their final amplitudes were matched to the amplitude of the first Δ[Ca2+]tr of the control trace at 15 Hz. In the inset, the complete time course of the truncated 1 Hz fluorescence trace is shown. B, Initial Δ[Ca2+]tr amplitudes from the data in Figure 1 before matching their peaks. Even without peak matching, ΔF/F0 values are within 10% of one another. In contrast, the corresponding values for the resting fluorescence F0 (not in chronological order) changed nearly twofold during the course of these recordings, as shown in C.
Potential artifacts: relative fluorescence change, ΔF/F0, and intraterminal Ca2+-dynamics. We were concerned about excluding contributions to or distortions of ΔF/F0 from sources other than stimulation-induced calcium changes inside the nerve terminals. Dye signals from AM-loaded preparations might represent a superposition of Δ[Ca2+]ichanges from several cellular components within the preparation. The neurohypophysis (pars nervosa) comprises millions of nerve terminals and secretory swellings (Herring bodies), and these are the most abundant structure in this tissue, accounting for some 99% of the excitable membrane in rat (Nordmann, 1977). The only other cellular structures with significant total volume are pituicytes. Because pituicytes apparently lack voltage-gated calcium channels, we do not expect these glial elements to contribute to stimulation-induced changes of ΔF/F0. Furthermore, the considerably larger volume of pituicytes (275 μm3) versus nerve endings (2–14 μm3) (Nordmann, 1977), and their correspondingly smaller surface to volume ratio, should result in substantially higher dye concentrations inside AM-loaded nerve terminals than inside pituicytes. That expectation was confirmed by the dramatically lower resting fluorescence observed after AM loading of the large cells in the neighboring pars intermedia (>20 μm diameter) (Bourque, 1990). This difference in dye concentration will significantly enhance the contributions of nerve terminals to ΔF/F0signals. Another possible concern is the heterogeneity of the nerve terminal population itself, which contains both AVP- and OXT-secreting terminals. Although different types and distributions of Ca channels have been identified pharmacologically (Wang et al., 1997), patch-clamp measurements showed nerve terminals to be homogeneous in their Ca-channel properties (Branchaw et al., 1997). Calcium measurements from isolated nerve terminals (Stuenkel, 1994; Fisher and Fernandez, 1999) or in tissue slices (Jackson et al., 1991) showed calcium kinetics to be insensitive to terminal peptide identity.
Uptake of AM-loaded dyes into subcellular compartments presents another potential source of ΔF/F0distortions (Almers and Neher, 1985). Indeed, loading of Fura-2 into the subcellular compartments of the rat neurohypophysis has been reported (Troadec et al., 1998). If compartmentalization occurs with Mag-Fluo-4, it does not appear to contribute to the stimulation-induced fluorescence changes. In Figure 1B we have superimposed ΔF/F0 data from the first action potential at each stimulation frequency. Figure1C illustrates the corresponding values of the resting fluorescence F0 for each of these measurements. Note that the ΔF/F0 amplitudes remain constant throughout the experiment, whereas loss of dye from the tissue typically resulted in a reduction inF0 by a factor of 2 or more. Given this dye loss, the relative proportion of cytosolic versus compartmentalized dye is bound to change over time. If compartmentalized dye contributed to ΔF/F0, this dye redistribution in turn would alter ΔF/F0 amplitudes. This was not observed.
Dye properties such as binding kinetics, dye saturation, or sensitivity to Mg2+ can distort both the time course and the relative amplitudes of ΔF/F0 measurements (Baylor and Hollingworth, 1988; Helmchen et al., 1997). Mag-Fluo-4 is a low-affinity calcium indicator (KD,Ca= 22 μm) (Haugland, 1996) with fast on/off rates. Because we estimate the maximal dye concentration in the terminals at 100–200 μm, distortions of the time course of ΔF/F0 are not expected. In fact, the intrinsically fast kinetics of this indicator dye compared with its high-affinity variants (i.e., Fluo-4 or Fluo-3) enabled us to detect the rapidly changing components of Δ[Ca2+]i. Distortions of ΔF/F0amplitudes resulting from dye saturation are also negligible. For typical resting levels of intraterminal [Ca2+]i of 100–300 nm (Jackson et al., 1991; Stuenkel, 1994), the resting fluorescence F0 of Mag-Fluo-4 will be close to its zero-calcium value,Ffree, whereas the dynamic range, (Fbound −Ffree)/Ffree,of Mag-Fluo-4 exceeds a factor of 25 in our microscope measurement system. The maximal value of ΔF/F0 during measurements did not exceed 15%, well within the compass of linear dye response. In addition, ΔF/F0amplitudes obtained with KCl depolarization ranged from 50 to 200% without showing signs of dye saturation (data not shown).
Finally, to evaluate potential ΔMg2+contributions to the measurements, we repeated ΔF/F0 measurement with two additional low-affinity Ca2+indicators, Magnesium Green and Mag-Fura-2. The relative Ca/Mg sensitivities among these three dyes differ by as much as a factor of 4, with Mag-Fluo-4 being the least Mg2+sensitive. Nevertheless, all three dyes yielded identical ΔF/F0 traces (results not shown). We therefore presume that Mg2+changes make no discernable contribution to ΔF/F0 on the time scale of our measurements, in agreement with observations on nerve terminals in the Calyx of Held (Helmchen et al., 1997). On the basis of all of these arguments, we conclude that the observed fluorescence changes, ΔF/F0, reported below are linear and that they provide a reliable, if uncalibrated, representation of intraterminal calcium changes.
RESULTS
Intraterminal calcium changes (Δ[Ca]i) during trains of action potentials
Figure 1 presents a summary of intraterminal Ca2+ changes, Δ[Ca2+]i, in the neurohypophysis resulting from stimulation with trains of action potentials (NStim = 40) at the indicated frequencies. For any given train, Δ[Ca2+]i can be separated into three distinct phases. Each action potential triggers a rapid (≅15 msec), transient calcium rise, Δ[Ca2+]tr. Between stimuli, a slower decay phase, Δ[Ca2+]dec, related to Ca2+ extrusion and/or uptake, prevails. In addition, residual calcium, [Ca2+]res, accumulates as a result of incomplete Ca2+removal during the interstimulus period.
It is instructive to compare the overall shape of the observed Δ[Ca2+]i traces with the predictions from a simple one-compartment model of Ca2+ kinetics during repetitive stimulation (Regehr et al., 1994). This model accounts for periodic Ca2+ influx during stimulation trains, Ca2+ buffering by endogenous buffers and Ca2+ indicators, and a Ca2+ extrusion process linearly proportional to [Ca2+]i, the free calcium concentration in the terminal. For a typical nerve terminal of radius r ≅ 1–3 μm (Nordmann, 1977; Sattelle, 1988), and presuming an intraterminal diffusion coefficient of 6 × 10⁻⁶cm2/sec (Blaustein and Hodgkin, 1969), the time for spatial Ca2+ gradients to dissipate can be estimated as τDiff ≅r2/6DCa≤ 2.5 msec (Crank, 1975). The neglect of diffusion effects is therefore a good approximation for the experimental situation with which we are concerned. The model readily reproduces the overall shape of the Δ[Ca2+]itraces. In particular, it predicts that for any given stimulation frequency, fStim, residual calcium levels will increase until they reach a steady-state plateau at which the Ca2+-dependent extrusion/uptake rate between stimuli exactly balances the Ca2+rise during stimulation. The amplitude of the residual calcium plateau is expected to increase linearly withfStim, because the time-averaged Ca2+ influx is presumed constant. The model therefore provides an important reference point against which to compare the experimentally observed Ca2+dynamics. In the remainder of this section we will explore the effects of various stimulation parameters on the transient Ca2+ rises (Δ[Ca2+]tr), Ca2+ extrusion/uptake (Δ[Ca2+]dec), and residual calcium changes (Δ[Ca2+]res), as well as their impact on AVP release.
Facilitation and depression of Δ[Ca2+]tr amplitudes during trains of action potentials
In Figure 2 we have plotted Δ[Ca2+]tramplitudes versus the stimulus number,nStim, from the data in Figure 1. Both stimulation frequency, fStim, and total number of stimuli, NStim, affect Δ[Ca2+]tramplitudes. At fStim = 1 Hz, a barely perceptible facilitation of Δ[Ca2+]tramplitudes occurs within the first few stimuli. As stimulation extends beyond 10 stimuli, Δ[Ca2+]tramplitudes begin to deteriorate, declining to 80% of their initial value at the end of a 40 stimulus train. AtfStim = 3 Hz, facilitation of early Δ[Ca]tr amplitudes is dramatic, with the amplitude of the fifth response >60% greater then the initial response. Again, as stimulation continues, Δ[Ca2+]trdeteriorates within the train. With increasing stimulation frequency, facilitation does not persist beyond the first few stimuli: e.g., at 15 Hz, Δ[Ca2+]trreturns to its initial amplitude within <10 stimuli. Above 15 Hz, depression of Δ[Ca2+]trdominates throughout the stimulation train. Δ[Ca2+]trdepression progresses further withfStim, until at 40 Hz the Δ[Ca2+]tramplitude at the end of 40 stimuli has deteriorated to only 20% of its value at the onset of the stimulus train.
Fig. 2.

Amplitude variation of the transient Ca2+ rise. Shown are fractional changes in the amplitude of the transient Ca2+ rise, Δ[Ca2+]tr, during a train of 40 action potentials at the indicated stimulation frequencies (●, 1 Hz; ○, all other frequencies), normalized to the first transient of each train. Three different patterns of facilitation and depression emerge. At low frequencies (fStim ≤ 1 Hz), Δ[Ca2+]tr amplitudes are essentially constant throughout the train (●). At moderate frequencies (1 Hz < fStim ≤ 15 Hz), Δ[Ca2+]tr amplitudes facilitate during the initial stimuli but deteriorate later in the train. Finally, at higher frequencies, depression of Δ[Ca2+]tr amplitudes dominates throughout the train, resulting in Δ[Ca2+]tr amplitudes deteriorating to <20% of their initial values at the end of 40 stimuli.
Action-potential stimulation therefore produces three distinct patterns of Ca2+ rises as a function of frequency. At or below fStim = 1 Hz, Δ[Ca2+]tramplitudes are nearly constant, with mild depression developing slowly during extended stimulation. Between 1 and 10 Hz, early facilitation of Δ[Ca2+]tramplitudes dominates throughout the stimulation train. Beginning at ∼10 Hz, early facilitation is eroded by subsequent depression. Overall, depression develops at progressively smallernStim and at an increasingly rapid rate as fStim increases. Eventually, Δ[Ca2+]tramplitudes deteriorate monotonically throughout the train.
To evaluate the physiological significance of the observed facilitation and depression of Δ[Ca2+]tr, we need to consider the factors that might contribute to Δ[Ca2+]tr: Ca2+ influx, Ca2+ mobilization, and Ca2+ extrusion and uptake, as well as Ca2+ buffering by the endogenous Ca2+ buffers and the Ca2+ indicator dye. As we have argued in Materials and Methods, distortion of the intrinsic Ca2+ dynamics resulting from dye saturation, slow dye kinetics, or competition with the intrinsic Ca2+ buffers is negligible. Furthermore, Ca2+ binding by both dye and buffer and diffusion of Ca2+ in these small terminals are fast enough that the Ca2+-indicator dye is always in quasi-equilibrium with [Ca2+]i. Studies on isolated nerve terminals have shown that >99% of the Ca2+ influx is rapidly bound to endogenous Ca2+ buffer(s), thereby dramatically limiting the amplitude of Δ[Ca2+]tr(Stuenkel, 1994). Saturation of the endogenous Ca2+ buffer therefore might produce the apparent facilitation of Δ[Ca2+]tr. The linear relationship between ICa and [Ca2+]i observed in these nerve terminals using Fura-2 (Stuenkel, 1994, his Fig. 2) suggests that Ca2+ influx does not saturate the endogenous buffer under these conditions. Furthermore, numerical calculations, using the above-mentioned one-compartment model (Regehr et al., 1994; Tank et al., 1995), indicate that buffer saturation results in a sigmoidal shape for [Ca2+]res, which was not observed in our experiments. Given the slow time course of Ca2+ extrusion and/or uptake (see below), these factors are also unlikely to affect the time course or amplitudes of Δ[Ca2+]tr.
This leaves changes in Ca2+ influx and, potentially, Ca2+ mobilization as the relevant sources for the observed changes in Δ[Ca2+]tramplitudes. The role of Ca2+ influx in excitation–secretion coupling is well established (Douglas, 1963;Douglas and Poisner, 1964). Release of Ca2+ from intracellular stores is tightly coupled to secretion in many other secretory cells (Tse and Tse, 1999). Mobilization of Ca2+ from isolated granules themselves, for example, has been reported in pancreatic acinar (Gerasimenko et al., 1996) and chromaffin cells (Yoo and Albanesi, 1990). We have recently localized both Type 2 Ryanodine and Type 1 InsP3 Ca2+release channels on the dense-core secretory granules in the mouse neurohypophysis (Salzberg et al., 2000b). Together with reports of high Ca2+ concentrations in these granules (Thirion et al., 1997), the possibility of Ca2+ mobilization from secretory granules (or other intraterminal stores) cannot be excluded. However, because there is as yet no direct evidence for Ca2+ release from intraterminal compartments in the neurohypophysis, we will treat the terms “Ca2+ influx” and “Δ[Ca2+]tr” as equivalent.
Ca2+ extrusion or uptake
Figure 3 shows the Ca2+ decay (Δ[Ca2+]dec) immediately after the last Δ[Ca2+]tr rise, on a linear (Fig. 3A) and a logarithmic (Fig. 3B) time scale. As is apparent from Figure 3A, Δ[Ca2+]decdisplays a bimodal decay pattern: an initial rapid decay switches over to a very slow decay as [Ca2+]i approaches resting levels. The initial rapid decay phase, in turn, contains two distinct components. Figure 3D summarizes the results from double-exponential fits to this initial decay phase. The two components of the rapid decay phase display a significantly different dependence on residual calcium levels. The time constant τ1fast of the faster component increases from a low of ∼25 msec to a maximum of 200 msec at the highest level of residual calcium. This increase is directly reflected in Figure 3B in the increasing delay before the onset of the steep decay. Any single Ca2+-sensitive Ca2+ extrusion/uptake mechanism would be expected to increase its macroscopic rate of Ca2+ extrusion with increasing Ca2+ load. The observed decrease, therefore, might result from a transition between two distinct extrusion mechanisms with separate times scales of τ1fast(min) and τ1fast(max), respectively.
Fig. 3.

Decay of intraterminal calcium levels after stimulation. Shown is the decay of [Ca2+]i at the end of stimulation with 40 action potentials at the indicated fStimon linear (A) and logarithmic (B) time scales. The y-axis scale in B is identical to the one in A. Thesolid lines in A represent the raw data points. In B the raw data from A were resampled uniformly on a logarithmic time scale. The open circles in B are the results from double-exponential fits through the data. C, Changes in the shape of the decay phase of the 1st (——), 5th, and 15th (– – –) Δ[Ca2+]i response during action-potential stimulation atfStim = 15 Hz. D, Dependence of the amplitudes (open symbols) and time constants (closed symbols) of the double-exponential fits in B on stimulation frequency (⋄, constant background; ■, ▪, first and ○, ●, second fast component).
In contrast, the time constant of the second fast component, τ2fast, remains fairly constant at 400 ± 50 msec. The slow decay is not well resolved in this record and, for the purpose of the double-exponential fit shown in Figure 3, was set equal to a constant background. Quantitative measurement of the slow time constant was hampered by its sensitivity to small errors in the bleaching correction (see Materials and Methods). Nevertheless, from extended ΔF/F0 recordings we estimate the slow time constant to be τslow = 15–25 sec, i.e., 50-fold slower than the initial decay. Inspection of the raw data in Figure 3A reveals clearly that the relative contributions of the three decay components of [Ca2+]i vary with the level of residual calcium. Although the amplitudes of the slow and the second fast component both saturate aroundfStim = 10 Hz, the amplitude and time constant of the first fast component increase essentially monotonically with stimulation frequency.
The presence of at least three different decay components with both amplitudes and decay rates dependent on the level of residual calcium adds another level of complexity to the temporal coding of [Ca2+]i transients during stimulation trains. The dominant role of the slow decay component at low frequencies, for example, provides the terminals with a “long-term” memory for their stimulation history even after brief, low-frequency stimulation. Similarly, the changing amplitudes and time constants of the fast decay components modulate the kinetics of Δ[Ca2+]idecay, particularly within the first few stimuli of a given train of action potentials. This is highlighted in Figure 3C, which shows a superposition of the 1st, 5th, and 15th response in a 15 Hz stimulus train. Initially, Δ[Ca2+]decbetween stimuli is clearly bimodal, whereas it becomes essentially single exponential as τ1fast increases beyond the interstimulus period. Without definitive pharmacological data, however, any specific assignment of different Ca2+ decay components to particular extrusion/uptake mechanisms must remain tentative.
Buildup and decay of residual calcium levels
Figure 4A depicts the net increase in residual calcium during stimulation by plotting the ΔF/F0 values at the foot of each individual Δ[Ca2+]tr within a train. The initial mismatch between Ca2+influx during stimulation and the rate of Ca2+ extrusion between action potentials effects this net increase in [Ca2+]res. For any given stimulus train, [Ca2+]resincreases until the Ca2+ extrusion rate begins to match the time-averaged Ca2+influx. This behavior is in overall agreement with a one-compartment model for Δ[Ca2+]ikinetics that predicts a single-exponential rise in [Ca2+]res (Regehr et al., 1994; Tank et al., 1995). With increasing stimulation frequency, however, single-exponential fits only conform to progressively shorter segments of the rising phase of residual calcium and overestimate its plateau amplitudes (Fig. 4B,solid lines). This deviation from the model behavior is caused by the rapid depression of calcium influx during continuous stimulation in this frequency range.
Fig. 4.
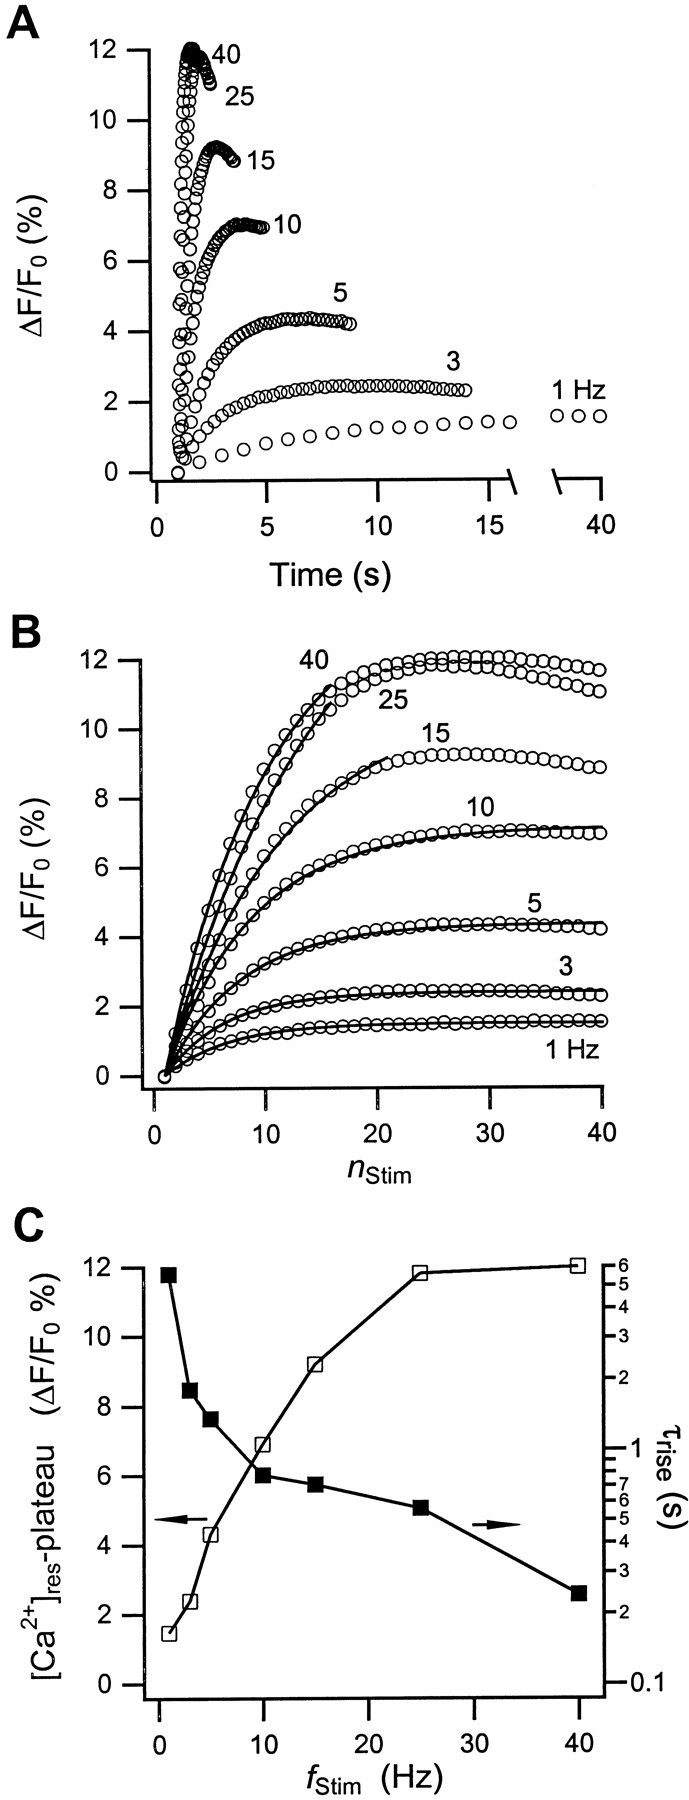
Changes in residual calcium during stimulation. Shown is the increase of residual calcium, Δ[Ca2+]res, in the nerve terminals of the neurohypophysis as a function of (A) time and (B) the stimulus number, nStim, during a train of 40 action potentials at the indicatedfStim. The open circlesrepresent the values of indicator fluorescence changes (ΔF/F0) immediately before a transient Ca2+ rise. In B, the spacing between data points (○) at differentfStim represents an increment in time of Δt = (fStim)−1sec, respectively. The solid lines represent single-exponential fits through the data. With increasingfStim, the range of data points conforming to this single-exponential rise rapidly decreases.C, Initial rise times (▪) of Δ[Ca2+]res obtained from the single-exponential fits. The open squares represent the values of the plateau amplitudes of Δ[Ca2+]res. Because the single-exponential fits did not reproduce plateau amplitudes properly, their values were instead set equal to Δ[Ca2+]res atnStim = 25. The solid lines in C are only guides to the eye.
Figure 4C shows both the plateau amplitude (■) and rise time (▪) of [Ca2+]res versusfStim. Several features are noteworthy. First, the plateau amplitude does not pass through the zero-Ca2+ origin but appears to have a finite offset. This offset is caused by the presence of the slow decay component, which keeps [Ca2+]res elevated for many tens of seconds after a stimulation train is completed. The corresponding low-frequency component of Ca2+ extrusion is not resolved on the frequency scale of our experiments. Second, the saturation of [Ca2+]res at higher frequencies arises from the pronounced depression of Δ[Ca2+]tr during action-potential stimulation. In contrast, fixed Δ[Ca2+]tramplitudes would result in a strictly linear increase of the [Ca2+]res plateau with frequency, as observed in the crayfish neuromuscular junction [Tank et al. (1995), their Fig. 3B]. Finally, the rise time of residual calcium is a highly nonlinear function of stimulation frequency because, apparently, increasingly effective extrusion pathways are activated during the rapid Ca2+ rise at high-frequency stimulation.
Frequency dependence of AVP secretion
Figure 5A summarizes the dependence of AVP release on fStim. The aliquots used for the EIA analysis were obtained from the same preparation, immediately after collection of the ΔF/F0 data for a given frequency. Although the absolute amount of AVP release varied somewhat from one assay to the other, the relative changes in AVP release withfStim were readily reproducible. Even at the lowest fStim of 1 Hz, AVP secretion was elevated well above basal release. Secretion further increased to a broad peak value aroundfStim = 5–10 Hz and then declined again. At fStim = 40 Hz, release had declined to the levels elicited with 1 Hz stimulation. Because we do not have a millisecond time-resolved measure of release, we constructed a time-averaged measure for the frequency dependence of the transient and residual components of Δ[Ca2+]iinstead. Figure 5B displays the cumulative amplitudes, Σ[Ca2+]tr and Σ[Ca2+]res, i.e., the amplitude of each component summed over the stimulus train, as a function of fStim. Comparison of the frequency dependence of release with that of Σ[Ca2+]tr and Σ[Ca2+]respermits several conclusions. Clearly, Ca2+influx during action-potential stimulation alone is sufficient to induce secretion in this preparation, as has been established for nearly 40 years (Douglas, 1963; Douglas and Poisner, 1964). More interestingly, the pattern of action-potential firing plays an active role in enhancing release through facilitation of Ca2+ rises at low-stimulation frequencies. This is particularly apparent during the steep increase in AVP release from 1 to 5 Hz, which correlates with the pronounced Δ[Ca2+]trfacilitation in this frequency range. On the other hand, the peak in AVP secretion does not coincide with the peak in Σ[Ca2+]tr. Furthermore, for fStim beyond 15 Hz, Σ[Ca2+]tr drops well below its 1 Hz level, whereas release remains at or above the 1 Hz level out to fStim = 40 Hz. These results indicate how the increase in [Ca2+]res can sustain elevated release levels despite a substantial reduction in Ca2+ influx.
Fig. 5.

AVP release and cumulative Ca2+changes. A, Basal release (○) and changes in AVP secretion (●) from the neurohypophysis in response to a train of 40 action potentials at the indicated fStim. The hormone levels were measured with an EIA. Aliquots from the recording chamber were collected for analysis immediately after the measurement of the stimulation-induced changes in [Ca2+]i. B, Relative changes in the cumulative amplitudes of the transient Ca2+ rise (ΣΔ[Ca2+]tr, ▪) during the action potential, and the cumulative residual calcium increase (ΣΔ [Ca2+]res, ■) throughout the stimulus train versus fStim. Data in B are normalized to their respective peak values. Solid lines in A andB are guides to the eye. The error bars reflect the SDs from six different experiments.
Effect of burst stimulation on Δ[Ca2+]i and AVP secretion
We used a burst-stimulation protocol to explore the facilitation, depression, and recovery behavior of Δ[Ca2+]tr. This protocol has the additional virtue that short stimulation bursts will reduce the net amplitude of [Ca2+]res and permit us to examine its relevance to AVP release. The preparation was stimulated with a continuous train of 40 stimuli at 5 Hz (reference) or shorter bursts of 4 × 10, 8 × 5, or 20 × 2 stimuli, each at an intraburst frequency of 5 Hz, and separated by interburst intervals of 4, 2 or 1 sec, respectively. We chose 5 Hz as intraburst frequency because it was close to the optimal frequency for AVP release and displayed strong Δ[Ca2+]trfacilitation during continuous stimulation. Figure6A–C shows the Δ[Ca2+]tramplitudes for these four stimulation protocols. From these traces it is apparent that facilitation and depression of Δ[Ca2+]troperate as separate mechanisms. For example, each one of the 10 stimuli bursts in Figure 6A facilitates to a comparable degree, indicating that facilitation does not persist beyond the 4 sec burst separation. For the shorter burst separations of 2 sec (Fig.6B, five stimuli/burst) and 1 sec (Fig.6C, two stimuli/burst), facilitation sometimes followed the reference curve for one or two bursts before falling off in subsequent bursts (data not shown). At the same time, the amplitude of the first Ca2+ transient in each subsequent burst follows the pattern of depression established by the reference record. Clearly, long-term depression persists beyond the burst separation but does not interfere with the facilitation within each burst. Σ[Ca2+]tramplitudes for burst stimulation drop by ∼10–20% from their value during continuous stimulation (Fig. 6D, white bars). AVP release, however, is reduced by nearly 40% (Fig.6D, gray bars). The substantial difference between the reduction in ΣΔ[Ca2+]tr and the decline in AVP secretion using burst stimulation suggests that the reduced plateau level of [Ca2+]res is the main reason for the disproportionate deterioration in AVP secretion.
Fig. 6.
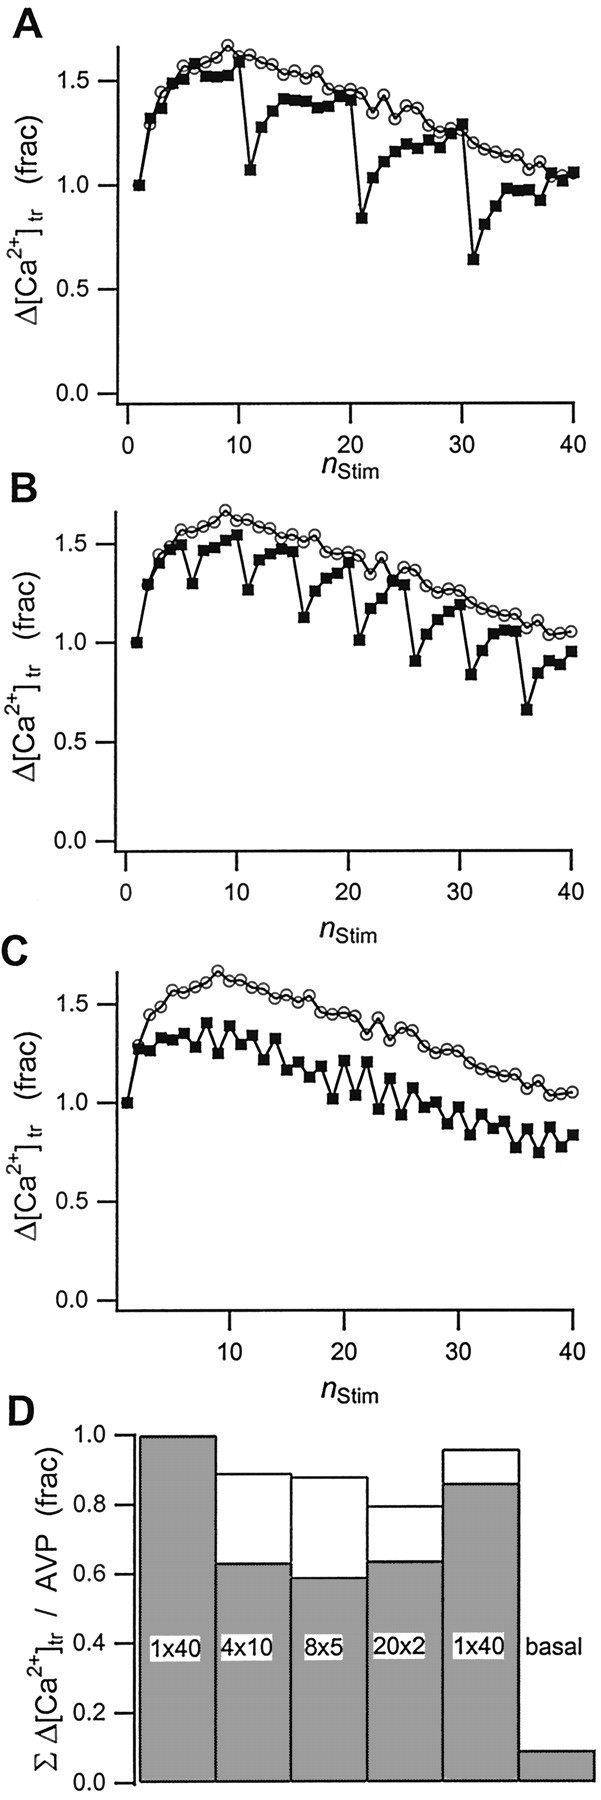
Effect of burst stimulation on transient Ca2+ rise and AVP release. Shown are Δ[Ca2+]tr amplitudes during stimulation of the neurohypophysis with trains of action-potential bursts at 5 Hz. The bursts (▪) consisted of either (A) 4 × 10, (B) 8 × 5, or (C) 20 × 2 stimuli at 5 Hz, separated by interburst intervals of 4, 2, and 1 sec, respectively. The reference trace (○) in Figure6A–C represents the initial, continuous action-potential train of 40 stimuli at 5 Hz. Thesolid lines through the data are guides to the eye.D, Changes in cumulative Δ[Ca2+]tr amplitudes (white bars) and AVP release (gray bars) for the data in A–C with respect to the values observed with the first reference trace. Values for a second reference trace at the end of the experiments and for the basal release of AVP are shown as well. Results are normalized to the values obtained with the first reference stimulus train.
DISCUSSION
At first sight, the shape of intraterminal Ca2+ changes conforms well to the predictions of a simplified one-compartment model of Ca2+ dynamics (Regehr et al., 1994; Tank et al., 1995), which presumes fixed Ca2+influx and a single Ca2+ extrusion mechanism. In particular, the model clearly embodies the essential features underlying the development of a steady-state plateau of residual calcium and the increase of the plateau amplitude with stimulation frequency.
On closer inspection, however, a more complex picture emerges. Most importantly, trains of action potential at different frequencies cause dramatically different patterns of Ca2+influx. Amplitudes of Ca2+ influx can undergo pronounced facilitation and depression in the course of a single action-potential train. Dependent not only onfStim but also onNStim, the net Ca2+ influx can be enhanced or depressed. To our knowledge, this is the first time concurrent facilitation and depression of Ca2+ influx during action-potential stimulation has been described in the neurohypophysis. In addition, [Ca2+]i decay occurs on at least three distinct, widely separated time scales. Both of these factors conspire to alter the rise times, decay times, and plateau amplitudes of residual calcium. Thus, residual calcium itself is intricately and inextricably coupled to the shifting balance between Ca2+ influx and extrusion, and the underlying pattern of action-potential stimulation. This raises the question of the physiological origin(s) of the observed changes in Ca2+ influx and [Ca2+]i decay.
Changes in Ca2+ influx
Changes in the action-potential shape have long been postulated as an important factor contributing to the frequency dependence of release (Gainer et al., 1986; Bourque, 1990; Jackson et al., 1991). Conceivably, changes in action-potential shape might be sufficient to produce both facilitation and depression of Δ[Ca2+]tr. For example, broadening of the action potential (Gainer et al., 1986;Bourque, 1990) might enhance the influx of Ca2+ early in a train, whereas the decrease in action-potential amplitude (Salzberg et al., 1985; Bourque, 1990) would result in depression. On the other hand, the rapid onset of facilitation of Ca2+ influx does not agree well with the gradual development of action-potential broadening [Bourque (1990), their Fig. 9].
Inactivation of Ca2+ channels might be another factor altering Ca2+ influx. Measurements on slices of the rat neurohypophysis demonstrated pronounced voltage-dependent Ca2+ channel inactivation, with recovery rates from this inhibition noticeably reduced by intraterminal Ca2+ (Branchaw et al., 1997). Hence, during low-frequency stimulation, inactivation should be minimal because the separation between action potentials is long and [Ca2+]resrises are slow and small in amplitude. AsfStim increases, depression sets in earlier and proceeds at a faster rate because action-potential separation decreases and [Ca2+]res rises with increasing rapidity to higher levels. This behavior agrees well with our observations (Fig. 2). High-frequency depression of Ca2+ influx could also result from the buildup of extracellular potassium (Frankenhaeuser and Hodgkin, 1956) during repetitive stimulation (Salzberg et al., 1985; Leng and Shibuki, 1987). Indeed, its contribution to Ca2+influx depression might be exaggerated under our stimulation protocol as a result of the unphysiologically synchronous stimulation of the axons in the infundibular stalk. Failure of action-potential propagation (Jackson and Zhang, 1995; Obaid and Salzberg, 1996), with a reduction in the number of activated terminals, is another mechanism that could contribute to the measured depression of Ca2+ influx with increasing stimulation frequency.
Thus, there are several possible mechanisms for the depression of Ca2+ influx. The physiological origin of the observed facilitation of the Ca2+influx is less obvious. Clearly, this is an important factor in the frequency-dependent regulation of intraterminal calcium changes and deserves additional scrutiny.
Ca2+ extrusion and/or uptake
The engagement of different Ca2+extrusion/uptake pathways with different pump rates and Ca2+ sensitivities has to be considered an active part of the cellular control of Ca2+ dynamics during exocytosis. For example, an important transient release component of fast synaptic transmission depends critically on the decay rate of [Ca2+]res (Chen and Regehr, 1999). In the neurohypophysis, the most obvious effect of changes in Ca2+ extrusion/uptake dynamics is on the buildup and decay of residual Ca2+ levels during repetitive stimulation.
Our attempts to identify the different sources of Ca2+ extrusion/uptake pharmacologically have been clouded by uncertainties regarding drug permeance across the plasma membrane, or by direct drug interference with excitability in the intact tissue. A comprehensive patch-clamp study on Ca2+ buffering and removal in isolated nerve terminals identified mitochondrial (ruthenium red sensitive) uptake as the dominant pathway of Ca2+removal during repetitive depolarization, with minor contributions from Ca2+ ATPases (Stuenkel, 1994). Mitochondrial Ca2+ uptake during exocytosis has also been observed in bullfrog presynaptic peptidergic terminals (Peng, 1998). Secretory granules themselves might contribute to Ca2+ uptake in nerve terminals as well (Troadec et al., 1998). These findings would suggest that the slow extrusion in our data is associated with a plasmalemmal Ca2+ ATPase, whereas the fast component(s) reflects high-capacity, low-affinity uptake processes inside the terminals.
AVP release and Δ[Ca2+]i
Several hypotheses, most prominently action-potential broadening (Gainer et al., 1986; Bourque, 1990; Jackson et al., 1991) and buildup of residual calcium (Jackson et al., 1991; Stuenkel and Nordmann, 1993;Stuenkel, 1994), have been proposed to explain the frequency dependence of AVP release from the neurohypophysis. None of these hypotheses directly addressed the issue of why release should be optimal at any specific frequency, rather than simply increasing monotonically with frequency. The results of our Δ[Ca2+]imeasurements suggest a compelling solution to this question. AVP secretion is sensitive to both the Ca2+rise during action potentials and the amplitude of residual Ca2+ levels between action potentials. Action-potential stimulation facilitates Ca2+ rises at lowfStim but eventually depresses Ca2+ rises with increasingfStim. In contrast, residual Ca2+ increases monotonically throughout the whole frequency range. Therefore, AVP release should be optimized at some frequency beyond the maximum in Ca2+ influx, consistent with the release data in this and many previous experiments (Cazalis et al., 1985;Gainer et al., 1986; Bicknell, 1988). The data also suggest a patterning of action potentials for optimizing AVP release within any given burst: initial high-frequency stimulation to quickly raise residual Ca2+, followed by stimulation in the maximal range of release around 3–10 Hz. This protocol precisely matches the firing pattern reported for AVP neurons in the hypothalamus (Poulain and Wakerley, 1982). Finally, the extended interburst quiescence observed in AVP neurons fits well with the extended recovery period required to overcome long-term depression of Ca2+ influx. It remains to be seen how Δ[Ca2+]tr and Δ[Ca2+]resinteract and how they couple into various components of the secretory pathway to accomplish the frequency modulation of release.
Footnotes
This work was supported by United States Public Health Service Grant NS16824. We are grateful to Dr. E. L. Stuenkel for useful discussions and, in particular, for bringing the EIA assay for AVP measurements to our attention. We also acknowledge Dr. Meyer Jackson for helpful comments on this manuscript, Dr. S. Kraner for her help in implementing the EIA assay, and Dr. J. Lindstrom for making his cold room and plate reader available. We have also received valuable input and support from our colleague Dr. A. L. Obaid.
Correspondence should be addressed to Dr. Brian M. Salzberg, Department of Neuroscience, 234 Stemmler Hall, Philadelphia, PA 19104-6074. E-mail: bmsalzbe@mail.med.upenn.edu.
REFERENCES
- 1.Almers W, Neher E. The Ca signal from fura-2 loaded mast cells depends strongly on the method of dye loading. FEBS Lett. 1985;192:13–18. doi: 10.1016/0014-5793(85)80033-8. [DOI] [PubMed] [Google Scholar]
- 2.Baylor SM, Hollingworth S. Fura-2 calcium transients in frog skeletal muscle fibres. J Physiol (Lond) 1988;403:151–192. doi: 10.1113/jphysiol.1988.sp017244. [DOI] [PMC free article] [PubMed] [Google Scholar]
- 3.Bicknell RJ. Optimizing release from peptide hormone secretory nerve terminals. J Exp Biol. 1988;139:51–65. doi: 10.1242/jeb.139.1.51. [DOI] [PubMed] [Google Scholar]
- 4.Blaustein MP, Hodgkin AL. The effect of cyanide on the efflux of calcium from squid axon. J Physiol (Lond) 1969;200:497–527. doi: 10.1113/jphysiol.1969.sp008704. [DOI] [PMC free article] [PubMed] [Google Scholar]
- 5.Bourque CW. Intraterminal recordings from the rat neurohypophysis in vitro. J Physiol (Lond) 1990;421:247–262. doi: 10.1113/jphysiol.1990.sp017943. [DOI] [PMC free article] [PubMed] [Google Scholar]
- 6.Branchaw JL, Banks MI, Jackson MB. Ca2+- and voltage-dependent inactivation of Ca2+ channels in nerve terminals of the neurohypophysis. J Neurosci. 1997;17:5772–5781. doi: 10.1523/JNEUROSCI.17-15-05772.1997. [DOI] [PMC free article] [PubMed] [Google Scholar]
- 7.Cazalis M, Dayanithi G, Nordmann JJ. The role of patterned burst and interburst interval on the excitation-coupling mechanism in the isolated rat neural lobe. J Physiol (Lond) 1985;369:45–60. doi: 10.1113/jphysiol.1985.sp015887. [DOI] [PMC free article] [PubMed] [Google Scholar]
- 8.Chan DW. Immunoassay: a practical guide. Academic; Orlando, FL: 1987. [Google Scholar]
- 9.Chen C, Regehr WG. Contributions of residual calcium to fast synaptic transmission. J Neurosci. 1999;19:6257–6266. doi: 10.1523/JNEUROSCI.19-15-06257.1999. [DOI] [PMC free article] [PubMed] [Google Scholar]
- 10.Crank J. The mathematics of diffusion, Ed 2. Oxford UP; New York: 1975. [Google Scholar]
- 11.Douglas WW. A possible mechanism of neurosecretion-release of vasopressin by depolarization and its dependence on calcium. Nature. 1963;197:81–82. [Google Scholar]
- 12.Douglas WW, Poisner AM. Stimulus-secretion coupling in a neurosecretory organ and the role of calcium in the release of vasopressin from the neurohypophysis. J Physiol (Lond) 1964;172:1–18. doi: 10.1113/jphysiol.1964.sp007399. [DOI] [PMC free article] [PubMed] [Google Scholar]
- 13.Fisher TE, Fernandez JM. Pulsed laser imaging of Ca2+ influx in a neuroendocrine terminal. J Neurosci. 1999;19:7450–7457. doi: 10.1523/JNEUROSCI.19-17-07450.1999. [DOI] [PMC free article] [PubMed] [Google Scholar]
- 14.Frankenhaeuser B, Hodgkin AL. The after-effects of impulses in the giant nerve fibres of Loligo. J Physiol (Lond) 1956;131:341–376. doi: 10.1113/jphysiol.1956.sp005467. [DOI] [PMC free article] [PubMed] [Google Scholar]
- 15.Gainer H, Wolfe SA, Jr, Obaid AL, Salzberg BM. Action potentials and frequency-dependent secretion in the mouse neurohypophysis. Neuroendocrinology. 1986;43:557–563. doi: 10.1159/000124582. [DOI] [PubMed] [Google Scholar]
- 16.Gerasimenko OV, Gerasimenko JV, Belan PV, Petersen OH. Inositol trisphosphate and cyclic ADP-ribose-mediated release of Ca2+ from single isolated pancreatic zymogen granules. Cell. 1996;84:473–480. doi: 10.1016/s0092-8674(00)81292-1. [DOI] [PubMed] [Google Scholar]
- 17.Haugland RP. Handbook of fluorescent probes and research chemicals, Ed 6. Molecular Probes; Eugene, OR: 1996. [Google Scholar]
- 18.Helmchen F, Borst JGG, Sakmann B. Calcium dynamics associated with a single action potential in a CNS presynaptic nerve terminal. Biophys J. 1997;72:1458–1471. doi: 10.1016/S0006-3495(97)78792-7. [DOI] [PMC free article] [PubMed] [Google Scholar]
- 19.Jackson MB, Zhang SJ. Action potential propagation and propagation block by GABA in rat posterior pituitary nerve terminals. J Physiol (Lond) 1995;483:597–611. doi: 10.1113/jphysiol.1995.sp020609. [DOI] [PMC free article] [PubMed] [Google Scholar]
- 20.Jackson MB, Konnerth A, Augustine GJ. Action potential broadening and frequency-dependent facilitation of calcium signals in pituitary nerve terminals. Proc Natl Acad Sci USA. 1991;88:380–384. doi: 10.1073/pnas.88.2.380. [DOI] [PMC free article] [PubMed] [Google Scholar]
- 21.Leng G, Shibuki K. Extracellular potassium changes in the rat neurohypophysis during activation of the magnocellular neurosecretory system. J Physiol (Lond) 1987;392:97–111. doi: 10.1113/jphysiol.1987.sp016771. [DOI] [PMC free article] [PubMed] [Google Scholar]
- 22.Muschol M, Salzberg BM. Frequency dependence of intraterminal calcium changes and vasopressin release in the neurohypophysis. Biophys J. 2000;78:260A. [Google Scholar]
- 23.Muschol M, Dasgupta BR, Salzberg BM. Calcium and barium kinetics in mammalian nerve terminals during exocytosis. Biophys J. 1999;76:A400. [Google Scholar]
- 24.Nordmann JJ. Ultrastructural morphometry of the rat neurohypophysis. J Anat. 1977;123:213–218. [PMC free article] [PubMed] [Google Scholar]
- 25.Obaid AL, Salzberg BM. Micromolar 4-aminopyridine enhances invasion of a vertebrate neurosecretory terminal arborization: optical recording of action potential propagation using an ultrafast photodiode-MOSFET camera and a photodiode array. J Gen Physiol. 1996;107:353–368. doi: 10.1085/jgp.107.3.353. [DOI] [PMC free article] [PubMed] [Google Scholar]
- 26.Obaid AL, Flores R, Salzberg BM. Calcium channels that are required for secretion from intact nerve terminals of vertebrates are sensitive to ω-conotoxin and relatively insensitive to dihydropyridines. J Gen Physiol. 1989;93:715–729. doi: 10.1085/jgp.93.4.715. [DOI] [PMC free article] [PubMed] [Google Scholar]
- 27.Peng YY. Effects of mitochondrion on calcium transients at intact presynaptic terminals depend on frequency of nerve firing. J Neurophysiol. 1998;80:186–195. doi: 10.1152/jn.1998.80.1.186. [DOI] [PubMed] [Google Scholar]
- 28.Poulain DA, Wakerley JB. Electrophysiology of hypothalamic magnocellular neurones secreting oxytocin and vasopressin. Neuroscience. 1982;7:773–808. doi: 10.1016/0306-4522(82)90044-6. [DOI] [PubMed] [Google Scholar]
- 29.Regehr WG, Delaney KR, Tank DW. The role of presynaptic calcium in short-term enhancement at the hippocampal mossy fiber synapse. J Neurosci. 1994;14:523–537. doi: 10.1523/JNEUROSCI.14-02-00523.1994. [DOI] [PMC free article] [PubMed] [Google Scholar]
- 30.Salzberg BM, Obaid AL, Senseman DM, Gainer H. Optical recording of action potentials from vertebrate nerve terminals using potentiometric probes provides evidence for sodium and calcium components. Nature. 1983;306:36–40. doi: 10.1038/306036a0. [DOI] [PubMed] [Google Scholar]
- 31.Salzberg BM, Obaid AL, Gainer H. Large and rapid changes in light scattering accompany secretion by nerve terminals in the mammalian neurohypophysis. J Gen Physiol. 1985;86:395–411. doi: 10.1085/jgp.86.3.395. [DOI] [PMC free article] [PubMed] [Google Scholar]
- 32.Salzberg BM, Muschol M, Obaid AL. Rapid changes in light scattering associated with secretion from peptidergic nerve terminals. In: Yuste R, Lanni F, Konnerth A, editors. Imaging neurons. A laboratory manual. Cold Spring Harbor Laboratory; Cold Spring Harbor, NY: 2000a. pp. 48.1–48.8. [Google Scholar]
- 33.Salzberg BM, Muschol M, Kraner SD, Obaid AL. Localization of calcium release channels to secretory granules in terminals of the mouse neurohypophysis. Biophys J. 2000b;78:260A. [Google Scholar]
- 34.Sattelle DB. Quasielastic laser light scattering and laser doppler electrophoresis as probes of synaptic and secretory terminal function. J Exp Biol. 1988;139:233–253. doi: 10.1242/jeb.139.1.233. [DOI] [PubMed] [Google Scholar]
- 35.Stuenkel EL. Regulation of intracellular calcium and calcium buffering properties of rat isolated neurohypophysial nerve endings. J Physiol (Lond) 1994;481:251–271. doi: 10.1113/jphysiol.1994.sp020436. [DOI] [PMC free article] [PubMed] [Google Scholar]
- 36.Stuenkel EL, Nordmann JJ. Intracellular calcium and vasopressin release of rat isolated neurohypophysial nerve endings. J Physiol (Lond) 1993;468:335–355. doi: 10.1113/jphysiol.1993.sp019775. [DOI] [PMC free article] [PubMed] [Google Scholar]
- 37.Tank DW, Regehr WG, Delaney KR. A quantitative analysis of presynaptic calcium dynamics that contribute to short-term enhancement. J Neurosci. 1995;15:7940–7952. doi: 10.1523/JNEUROSCI.15-12-07940.1995. [DOI] [PMC free article] [PubMed] [Google Scholar]
- 38.Thirion S, Troadec JD, Pagnotta S, Andrews SB, Leapman RD, Nicaise G. Calcium in secretory vesicles of neurohypophysial nerve endings: quantitative comparison by X-ray microanalysis of cryosectioned and freeze-substituted specimens. J Microsc. 1997;186:28–34. doi: 10.1046/j.1365-2818.1997.1980760.x. [DOI] [PubMed] [Google Scholar]
- 39.Troadec JD, Thirion S, Laugier JP, Nicaise G. Calcium-induced calcium increase in secretory vesicles of permeabilized rat neurophyophysial nerve terminals. Biol Cell. 1998;90:339–347. [PubMed] [Google Scholar]
- 40.Tse FW, Tse A. Regulation of exocytosis via release of Ca2+ from intracellular stores. BioEssays. 1999;21:861–865. doi: 10.1002/(SICI)1521-1878(199910)21:10<861::AID-BIES8>3.0.CO;2-9. [DOI] [PubMed] [Google Scholar]
- 41.Wang G, Dayanithi G, Kim S, Horn D, Nadasdi L, Kristipati R, Ramachandran J, Stuenkel EL, Nordmann JJ, Newcomb R, Lemos JR. Role of Q-type channels in vasopressin secretion from neurohypophysial terminals of the rat. J Physiol (Lond) 1997;502:351–362. doi: 10.1111/j.1469-7793.1997.351bk.x. [DOI] [PMC free article] [PubMed] [Google Scholar]
- 42.Yoo SH, Albanesi JP. Inositol 1,4,5-trisphosphate-triggered Ca2+ release from bovine adrenal medullary secretory vesicles. J Biol Chem. 1990;265:13446–13448. [PubMed] [Google Scholar]