

Abstract
A growing body of evidence proposes that glial cells have the potential to play a role as modulators of neuronal activity and synaptic transmission by releasing the neurotransmitter glutamate (Araque et al., 1999). We explore the spatial nature of glutamate release from astrocytes with an enzyme-linked assay system and CCD imaging technology. In the presence of glutamate,l-glutamic dehydrogenase (GDH) reduces NAD+ to NADH, a product that fluoresces when excited with UV light. Theoretically, provided that GDH and NAD+ are present in the bathing saline, the release of glutamate from stimulated astrocytes can be optically detected by monitoring the accumulation of NADH. Indeed, stimuli that induce a wave of elevated calcium among astrocytes produced a corresponding spread of extracellular NADH fluorescence. Treatment of cultures either with thapsigargin, to deplete internal calcium stores, or with the membrane-permeant calcium chelator BAPTA AM significantly decreased the accumulation of NADH, demonstrating that this fluorometric assay effectively monitors calcium-dependent glutamate release. With a temporal resolution of 500 msec and spatial resolution of ∼20 μm, discrete regions of glutamate release were not reliably resolved. The wave of glutamate release that underlies the NADH fluorescence propagated at an average speed of ∼26 μm/sec, correlating with the rate of calcium wave progression (10–30 μm/sec), and caused a localized accumulation of glutamate in the range of 1–100 μm. Further analysis of the fluorescence accumulation clearly demonstrated that glutamate is released in a regenerative manner, with subsequent cells that are involved in the calcium wave releasing additional glutamate.
Keywords: calcium waves, l-glutamic dehydrogenase (GDH), glutamate release, regenerative glutamate waves, astrocyte signaling, glutamate physiology
A growing amount of evidence suggests that glial cells are key modulators of neuronal activity. The first evidence came from the discovery of temporally related changes in intracellular calcium concentration ([Ca2+]i) in glial and neuronal cells that could underline a bidirectional communication between those two cell types (Dani et al., 1992; Charles, 1994;Nedergaard, 1994; Parpura et al., 1994; Hassinger et al., 1995, Pasti et al., 1997; Newman and Zahs, 1998). The neurotransmitter glutamate is the candidate intercellular messenger used in such cellular cross-talk (Parpura et al., 1994; Hassinger et al., 1995; Araque et al., 1998a,b). These observations led to the hypothesis that glial cells could release glutamate through a calcium-dependent mechanism that resembles the synaptic release of neurotransmitters at the nerve terminal. Three different experimental results support this hypothesis. First, an elevation in [Ca2+]i is necessary and sufficient to elicit glutamate release from astrocytes (Parpura et al., 1994; Pasti et al., 1997; Newman and Zahs, 1997; Bezzi et al., 1998). Second, cortical astrocytes are endowed with classical synaptic proteins, or their analogs (Parpura et al., 1995; Hepp et al., 1999; Maienschein et al., 1999). Third, clostridial toxins, which cleave synaptic proteins, can block glutamate release from astrocytes (Jeftinija et al., 1997; Bezzi et al., 1998).
Although it is known that glutamate can be released from astrocytes, the spatiotemporal nature of this signal has not been defined. This is in marked contrast to our knowledge of the calcium signal that stimulates glutamate release, which is known to be able to spread as a radial wave from its point of origin (Charles et al., 1991). Previous work has shown that l-glutamic dehydrogenase can be used as a detector of glutamate release from cortical and hippocampal astrocytes in slice (Bezzi et al., 1998). However, fluorometric measurements on cell populations, such as HPLC analysis (Parpura et al., 1994), cannot provide both spatial and temporal resolution of glial glutamate release. Therefore, in this study we have asked whether we can use the l-glutamic dehydrogenase-based approach at the level of single cells to visualize glutamate release. We demonstrate fluorescence detection of glutamate release and provide the first demonstration of regenerative waves of extracellular glutamate.
MATERIALS AND METHODS
Cell culture. Purified cortical astrocyte cultures were prepared as previously described (Parpura et al., 1995). Briefly, cortices were dissected from 1- to 2-d-old Sprague Dawley rats and enzymatically treated (papain, 20 IU/ml; 1 hr, 37° C). After mechanical dissociation in α-minimum essential medium (α-MEM; Life Technologies, Gaithersburg, MD), the cells were plated into culture flasks. They were grown to confluence at 37°C in a humidified 5% CO2/95% air atmosphere. Culture medium consisted of α-MEM supplemented with fetal bovine serum (Hyclone, Logan, UT) and containing 40 mm glucose, 2 mml-glutamine, 1 mm pyruvate, 14 mmNaHCO3, penicillin (100 IU/ml) and streptomycin (100 μg/ml), pH 7.35. After ∼8 d the flasks were shaken twice on a horizontal orbital shaker at 260 rpm, first for 1.5 hr, and then, after replacement of the medium, again for 18 hr. The remaining adherent cells were enzymatically detached with trypsin (0.1%). Cells were then pelleted (100 × g, 10 min), resuspended in α-MEM, and plated onto glass coverslips inserted into Petri dishes. The cells were used in experiments after 1–4 d in culture.
Glutamate measurement. Glutamate levels were detected using an enzymatic assay (Nicholls and Sihra, 1986; Nicholls et al., 1987;Ayoub and Dorst, 1998; Ayoub et al., 1998; Bezzi et al., 1998; Maguire et al., 1998). In the presence of glutamate, l-glutamic dehydrogenase (GDH) reduces β-nicotinamide adenine dinucleotide (NAD+) to NADH, a product that fluoresces when excited with UV light. Provided that GDH and NAD+ are added to the saline in which astrocytes were bathed, any glutamate released in the medium can be detected as an increase in NADH fluorescence.
Experiments were performed using an inverted microscope (Diaphot 200; Nikon, Tokyo, Japan) equipped for epifluorescence microscopy. The light from a xenon arc lamp (100 W) was filtered at 360 nm (D360/10X; Chroma Technology Corp., Brattleboro, VT) and delivered to the sample through a 40× oil immersion objective (1.3 numerical aperture). Fluorescent emission was collected through a dichroic mirror (510DRLP; Omega Optical, Brattleboro, VT) and filtered with a 515EFLP filter (Omega Optical). Light was detected using either a cooled digital camera (ORCA; Hamamatsu, Hamamatsu City, Japan) or a photomultiplier tube (PMT; Thorn EMI Gencom Inc., West Byfleet, UK).
Cells were bathed in an enzymatic assay solution (GDH saline) composed of external solution containing (in mm): NaCl, 140; KCl, 5; MgCl2, 2; CaCl2, 2; HEPES, 10; glucose, 10 and supplemented with GDH (∼56 U/ml) and NAD+ (1 mm), pH 7.35. The presence of cells or cell stimulation did not have any apparent effect on the intrinsic activity of GDH (Nicholls and Sihra, 1986). All the experiments were performed at room temperature (20–23°C) using confluent astrocyte culture, unless stated otherwise.
PMT data acquisition and analysis. In initial studies the fluorescence arising from the entire optical field was collected by a PMT at an acquisition rate of 0.3 kHz. Background subtraction of the fluorescent signals was performed by subtracting values recorded from the cells bathed in the solution lacking GDH and NAD+. Data were expressed as dF/Fo (%), where Fo represents the fluorescence level of the optical field before cell stimulation, and dF represents the change in fluorescence. When using this approachFo represents the sum of fluorescence emitted from GDH plus NAD+ plus basal NADH (either as a contaminant or because of enzymatic activity). Normalization to this baseline fluorescence value allowed day-to-day comparisons between experiments. For each different experimental condition, data were collected from at least three different cultures. Statistical significance was established using the Mann–WhitneyU test.
Imaging acquisition and processing. For time-lapse image acquisition, the epifluorescence microscope was equipped with a cooled digital camera (ORCA, Hamamatsu) that was controlled by Metamorph software (Universal Imaging Corp., West Chester, PA). For quantitative studies, the temporal dynamics in fluorescence were expressed as background-subtracted dF/Fo as described for the PMT experiments. Images presented in the figures have been spatially filtered with a low-pass filter.
Measurement of intracellular Ca2+.Calcium measurements were performed in order to monitor the ability of the mechanical stimulation to evoke a wave of elevated calcium in astrocytes. [Ca2+]i was measured by monitoring the fluorescence of the Ca2+ indicator fluo-3. This indicator was loaded into cells by incubation for 30 min, at room temperature, in the AM ester derivative of the dye. Fluorescent excitation was provided using a 480DF10 band-pass filter (Omega Optical). The dichroic mirror and the emission filter used to collect the fluorescence from fluo-3 were identical to those used in imaging experiments assaying glutamate levels. Because visible calcium indicators are also excited by UV light and because of the weak fluorescence signal arising from NADH, we were unable to perform simultaneous glutamate and calcium imaging experiments.
Calibration of extracellular glutamate levels. To estimate the extracellular levels of glutamate in the vicinity of astrocytes, we performed a simple calibration procedure in which known concentrations of glutamate were added to NAD+ and GDH containing saline. Experimentally this was performed by mixing the solutions from two inlet tubes in our perfusion chamber. One solution contained NAD+ (1 mm) and GDH (concentrated 2×), and the other contained glutamate (2× concentration) and NAD+ (1 mm). Initially both solutions were washed through the laminar flow perfusion chamber in a rapid manner so that they only mixed with one another for ∼0.5 sec. Subsequently, the flow of the solution was stopped to allow the reaction to continue and for the fluorescent product to accumulate in a concentration- and time-dependent manner. Although the amplitude of the fluorescence signal can approach a plateau after tens of seconds to minutes, we performed a calibration by determining the fluorescence intensity after 20 sec of the reaction, a time frame similar to the period needed to achieve the peak fluorescence signal recorded when astrocytes release glutamate. This calibration can only be taken as a rough estimate of concentration of glutamate around astrocytes, because the release of glutamate from cells is transient and because released glutamate is diluted within the volume of the perfusion chamber.
Mechanical stimulation. To evoke radially propagating waves of elevated calcium in astrocytes, we used mechanical stimuli. Although this is probably not a physiological stimulus, it is known to activate intracellular signal transduction pathways and provides a method with both temporal and spatial control (Charles et al., 1991). Furthermore, because, in these experiments, we must allow small quantities of neurotransmitter and reaction products to accumulate extracellularly, it offers a stimulus that does not require mixing of the bathing solution, as would be necessary if neurotransmitters were applied as the proximate stimulus. To provide mechanical stimuli to astrocytes (Charles et al., 1991; Araque et al., 1999), a glass pipette was gently brought into contact with the cell surface. To control contact between the cell and the pipette we monitored the pipette resistance during delivery of 10 mV square pulses (3900 integrating patch-clamp amplifier; Dagan Instruments, Minneapolis, MN). In control experiments, using calcium indicators, we reliably found that contact between the cell and pipette, as monitored by an increase in pipette resistance, resulted in a calcium wave.
Electrical stimulation. In some experiments astrocytes were stimulated extracellularly (100–150 V, 100 msec duration, 2 Hz) using glass pipettes filled with GDH saline. Identical results were found using either mechanical or electrical stimulation.
Materials. α-MEM was purchased from Life Technologies. Thapsigargin, GDH (G2626), and NAD+(N7004) were obtained from Sigma (St. Louis, MO), whereas fluo-3 AM, BAPTA AM, and 4-bromo (Br) A23187 were bought from Molecular Probes (Eugene, OR).
RESULTS
Gentle mechanical contact between a patch pipette and the surface of an astrocyte leads to a wave of elevated internal calcium that propagates from astrocyte to astrocyte. Figure1 shows an example of a calcium wave that propagates over a radius of 250 μm at an average rate of 16 μm/sec. This image sequence, which was collected using a 20× objective, serves to demonstrate the radial nature of the calcium wave. In subsequent experiments in which we monitor NADH fluorescence that results from glutamate release, we were limited to using a high-numerical aperture (1.3) 40× objective to detect the weak fluorescence signal. Consequently, although calcium waves can propagate for >250 μm (wave diameter, 500 μm), as shown in Figure 1, we were limited to collecting fluorescence information in glutamate assays from a spatially restricted region of only ∼200 μm (Fig. 1, dashed circle). Thus, in subsequent experiments we are only able to monitor glutamate release from a subregion of the complete calcium wave.
Fig. 1.

Mechanical stimulation of a single astrocyte induces a propagating wave of calcium elevation in cultured confluent astrocytes. The drawing in the top left corner illustrates the position of the pipette with respect to the stimulated astrocyte and the entire optical field. The sequence of fluorescence images (2 sec apart, arrow), which runs from the top left to the bottom right, starts with the first image showing an elevation of calcium concentration in the stimulated astrocyte. The dashed circle indicates a restricted area 200 μm in diameter, which corresponds to the average size of the optical field during experiments investigating glutamate release (for example, Fig. 4). The color scale indicates linear pseudocolor representation of fluorescence intensity ranging from 0 to 4095.
Enzyme-linked assay to monitor glutamate release from astrocytes
To detect the release of glutamate from cultured astrocytes, we used an enzyme-linked system that consists of GDH and NAD+. In the presence of glutamate, GDH reduces NAD+ to NADH according to the following reaction:
Because NADH fluoresces when excited with UV light, the enzymatic reaction catalyzed by GDH can be followed as changes in NADH fluorescence and used as an indirect indicator of glutamate level. The ability of the GDH-based assay to measure physiological levels of glutamate in the culture medium of cortical astrocytes was initially tested using a PMT (Fig.2A). Such a detector allowed high temporal resolution and high sensitivity to collect any change in NADH fluorescence originating from stimulated astrocytes.
Fig. 2.

GDH can detect changes in extracellular glutamate levels that result from elevated internal calcium in astrocytes.A, Confluent cultures of purified astrocytes were bathed in a GDH saline. The entire optical field was illuminated by UV light, and the fluorescence emission was detected with a PMT. A glass pipette was used to gently tap the surface of an astrocyte to evoke a wave of elevated calcium and cause the release of glutamate. B, Fluorescence signals resulting from the accumulation of NADH that is generated as a result of the release of glutamate from stimulated astrocytes (continuous line). No changes in fluorescence were detected when GDH, NAD+, or both (dotted line) were omitted from the bathing solution. (Note that the signal shown by the dashed line is offset for display purposes.) The tip of the pipette in B indicates the time when pipette–cell contact occurred. Changes in fluorescence are expressed as dF/Fo(Fo = fluorescence level before cell stimulation; dF = change in fluorescence).
To stimulate glutamate release from astrocytes, cells were gently touched with a glass pipette, a stimulus that initiates an inositol triphosphate (IP3)-dependent Ca2+ wave that propagates throughout the astrocyte network (Fig. 1; Charles et al., 1991; Araque et al., 1999). When GDH and NAD+ were added to the bathing saline, stimulation of astrocytes induced a transient increase in the NADH fluorescence above the cells (Fig. 2B,continuous trace), consistent with the fluorescence detection of glutamate release (n = 42). Because subsequent bath perfusion reduced the fluorescence intensity, it is likely that it results from the accumulation of extracellular NADH. To confirm that the fluorescence signal originates from the activity of the extracellular GDH, we performed identical experiments with the detection system lacking one of its components. When either NAD+ or GDH (Fig. 2B, dotted trace) were omitted from the bathing saline, no changes in fluorescence were detected after stimulation of astrocytes (n = 5).
Having demonstrated the extracellular localization of the NADH signal, we next confirmed the calcium dependence of the increase in extracellular NADH fluorescence that was detected during calcium waves (Charles, 1994; Parpura et al., 1994; Hassinger et al., 1995; Pasti et al., 1997; Araque et al., 1998a; Bezzi et al., 1998). In a first set of experiments, we preincubated the cells with thapsigargin (1 μm), which blocks the activity of the Ca2+-ATPase located on IP3-sensitive intracellular compartments and discharges the calcium content of the intracellular calcium stores with time (Thastrup et al., 1990; Lytton et al., 1991). Consistent with previous observations (Charles et al., 1993; Newman and Zahs, 1997;Araque et al., 1998a), after thapsigargin treatment, astrocytes responded to mechanical stimulation with reduced calcium elevations (n = 22). Because glutamate can be released by astrocytes in a calcium-dependent manner, lower intracellular calcium elevations should induce less glutamate release and hence lead to a reduction in accumulation of extracellular NADH. Figure3A shows that thapsigargin reduced the peak accumulation of NADH fluorescence that is induced by mechanical stimulation of astrocytes by 69% (p< 0.01, Mann–Whitney U test). Each open circlerepresents individual experimental data points; meanwhile, theclosed circle represents the median of the values (control cells median dF/Fo = 44%;n = 21; thapsigargin pretreated cells median dF/Fo = 14%;n = 22).
Fig. 3.

Calcium is both necessary and sufficient for the appearance of NADH fluorescence. The release of glutamate was detected by incubating astrocytes in an NAD+ and GDH containing saline and fluorescently monitoring the accumulation of NADH. Pretreatment for 30 min at room temperature with 1 μm thapsigargin (A) or for 1 hr at 37°C with 10 μm BAPTA AM (B) significantly reduced the amplitude of the NADH fluorescence (p < 0.01, Mann–Whitney Utest), indicating that calcium is necessary for the glutamate-dependent accumulation of NADH. C, Application of the calcium ionophore 4-Br A23187 (10 μm, 9–12 min), which elevated internal calcium levels, caused a significant (p < 0.01, Mann–Whitney Utest) increase in extracellular NADH fluorescence attributable to the induction of calcium-dependent glutamate release. Each open circle refers to a single experiment, and closed circles represent the median value for each group. The amplitude of NADH fluorescent signals after stimulation of astrocytes is expressed as a percent change in dF/Fo.
A comparable reduction in NADH accumulation was obtained in a second set of experiments, in which astrocytes where preincubated with 10 μm BAPTA AM for 1 hr (Fig. 3B). This calcium chelator blocks the calcium elevation induced by mechanical stimulation in astrocytes (data not shown; see also Araque et al., 1998a,b). Consistent with the expected reduced calcium elevation and thus reduced glutamate release, we observed a 74% reduction (p < 0.01, Mann–Whitney U test) in extracellular NADH fluorescence arising from stimulated astrocytes (control median dF/Fo = 51%; n = 21; BAPTA median dF/Fo = 13%;n = 18). These results indicate that the fluorescence detection of NADH is effectively monitoring calcium-dependent glutamate release and act as an important control against potential consequences of damage associated with mechanical stimuli.
To confirm that a calcium elevation is sufficient to increase glutamate release and as a further evaluation of the GDH assay for glutamate, cells were incubated in the Ca2+ ionophore 4-Br A23187. Addition of the calcium ionophore (10 μm, 9–12 min) increased calcium levels in astrocytes (data not shown) and caused an elevation in NADH fluorescence (Fig. 3C; median dF/Fo = 54%;n = 7 compared with median dF/Fo = 17%;n = 6 in sham experiments when no ionophore was added;p < 0.01, Mann–Whitney U test). Taken together, these studies, which have perturbed glutamate release by interfering with intracellular calcium homeostasis, have clearly demonstrated that monitoring the fluorescence of NADH in the bathing solution is an effective assay for the release of glutamate from astrocytes.
Imaging the calcium-dependent release of glutamate from cultured astrocytes
Having demonstrated the utility of the GDH-based assay for monitoring glutamate release, we used a cooled digital camera with high sensitivity to image spatiotemporal dynamics of glutamate release in cell culture. Figure 4 illustrates a typical example of a total of 14 experiments performed. The bright-field image shows a small “carpet” of astrocytes (approximately five or six cells). A patch pipette was used to mechanically stimulate one astrocyte. The fluorescence images show that an increase in fluorescence started where the astrocyte was stimulated and expanded radially to the entire optical field in a few seconds. In <1 min, the fluorescence level returned to initial values. In parallel experiments we demonstrated the absence of fluorescent signal when one of the components of the enzyme-based assay was omitted from the GDH saline or when astrocytes were not stimulated (n = 4). Additionally, treatments that interfered with elevations of [Ca2+]i in astrocytes, such as BAPTA preincubation (n = 3), attenuated the magnitude of the fluorescent NADH signal.
Fig. 4.
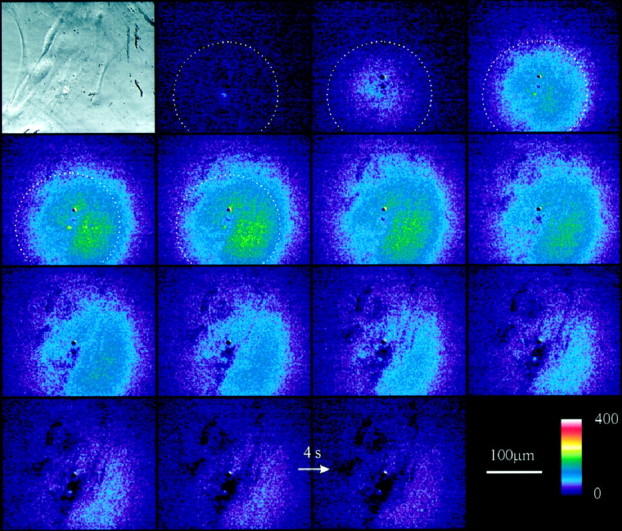
Time-lapse imaging of NADH fluorescence after stimulation of astrocytes. The image in the top left corner is a phase-contrast micrograph of the cultured astrocytes. The sequence of fluorescence images, which runs fromtop left to bottom right, (camera integration time, 2 sec) was collected during stimulation of an astrocyte within the optical field. In the presence of GDH and NAD+ a wave-like appearance of fluorescent NADH can be seen that results from the release of glutamate from the astrocytes. The color scale indicates linear pseudocolor representation of fluorescence intensity ranging from 0 to 400. A 200-μm-diameter circle, centered around the site of stimulation, is superimposed on the first five images. Comparison with the calcium wave shown in Figure 1 shows that the speed of the NADH (glutamate) wave is similar to that of calcium waves. Arrow, 4 sec image interval.
Because endogenous GDH activity in retinal Müller cells, a special subtype of glial cells, has been used to monitor the uptake of glutamate from the extracellular space (Barbour et al., 1993), we asked whether the addition of extracellular glutamate would change astrocyte autofluorescence. Addition of 1 mm glutamate to our external saline had no effect on astrocyte autofluorescence, in the absence of exogenous GDH and NAD+ (data not shown). Because our control experiments demonstrated that cellular autofluorescence is unchanged by either the presence of glutamate or by stimulation of astrocytes, the NADH fluorescence detected in our experiments can be completely ascribed to glutamate released from astrocytes.
We assessed whether the amplitude of the recorded NADH elevations reported glutamate levels expected from a physiological release process. We measured the fluorescent emission originating from a GDH saline when known concentrations of glutamate were added. This GDH-based assay showed a logarithmic relationship between glutamate concentration (1–100 μm) and NADH fluorescence intensity (Fig. 5). Comparison of such “‘in vitro ” recordings with the NADH changes allowed us to estimate that calcium elevations in astrocytes resulted in local glutamate concentrations in the range of 1–100 μm (Fig. 5).
Fig. 5.

Calibration of NADH fluorescence.A, NADH fluorescence signal resulting from mixing known concentrations of glutamate with GDH saline (circlesrepresent the mean of two measurements at each glutamate concentration). Note there is a logarithmic relationship between glutamate concentration and NADH fluorescence. B, Frequency distribution histogram of the NADH fluorescence levels after stimulation of astrocytes. For each experiment (n = 10), we randomly chose 13 regions in the optical field from which to measure the NADH intensity. The peak change of fluorescence in each region was measured. Comparison of A withB allows an estimate of the glutamate levels surrounding astrocytes. The amplitude of NADH fluorescent signals is expressed as a percent change in dF/Fo.
To provide a visual aid of the relative rates of calcium and glutamate waves, we have superimposed 200-μm-diameter circles that are centered around the point of stimulation in Figures 1 and 4. Note that in both examples the fluorescent signal takes about 4–8 sec to reach the edge of the circle, indicating that they travel with similar speeds. Further analysis of the glutamate wave demonstrated that they travel at an average speed of 26 ± 11 μm/sec (n = 10), which compares favorably with the speed of calcium waves (10–30 μm/sec) (Cornell-Bell et al., 1990; Charles et al., 1991; Dani et al., 1992;Nedergaard, 1994).
Because NADH is free to diffuse extracellularly, it is unclear whether the spatial extent of the NADH signal results from diffusion from a point source or from the release of glutamate from multiple cells that participate in the propagating calcium wave. To distinguish between these possibilities, we first studied the spatial characteristics of the NADH fluorescence signal when glutamate was briefly ejected from the tip of a pipette. Ejection of glutamate from a pipette (pressure ejection, 14 msec, 50 psi) into saline-containing NAD+ and GDH caused a relatively localized and spatially dissipating NADH fluorescent signal. The “raw” images shown in Figure 6Ademonstrate that NADH originates as a small point, which was adjacent to the tip of the ejection pipette, and then spreads radially and subsides with distance and time. (Note that the fluorescence in the first image is attributable to fluorescence associated with the pipette tip, not to NADH in the bathing saline.) The full-width half maximum of the initial NADH fluorescent signal acquired in the first image was 21 μm and defines the lower limit on spatial resolution of our glutamate imaging system.
Fig. 6.

Passive diffusion of glutamate and NADH from a point source. To determine the spatial resolution of the glutamate imaging system we ejected glutamate (10 mm) from the tip of a pipette. A, A sequence of fluorescence images is shown during the ejection of glutamate (14 msec pressure pulse) from a pipette tip in a saline containing GDH and NAD+. Note that the fluorescence in the first image is attributable to fluorescence associated with the pipette tip, not to NADH in the bathing saline. B, The same images as shown inA were processed by subtraction of the previous image [n − (n − 1)] to obtain difference images (an image obtained before the first raw image inA was used in the subtraction to calculate the first difference image shown in B). Note these difference images clearly show the timing of appearance of new fluorescent molecules (see Results). Camera integration time, 500 msec.Arrow, 1 sec image interval. The color scale indicates linear pseudocolor representation of fluorescence intensity ranging from 0 to 600 in A and from 0 to 300 in B.
Because of the persistence of NADH in the extracellular saline, this sequence of raw images does not provide a realistic picture of the timing of glutamate addition. To more accurately reflect glutamate ejection, the images are shown as difference images in Figure6B, in which the previous image is subtracted from the current image [image n − (n − 1)]. Such a subtraction protocol demonstrated that glutamate was ejected for a duration corresponding to one image frame interval (1 sec) or less, and that the sustained increased fluorescence is attributable to the slow diffusion of glutamate and/or NADH from the ejection point to the periphery of the optical field.
To evaluate the spatial extent of glutamate release from astrocytes, we made two modifications to our procedures. First, we displayed all NADH fluorescent traces as difference images as described above. Second, we examined areas of cultures in which there were regions devoid of cells. Two examples are shown in Figure 7. Thetop left image in Figure 7A shows a bright-field image of astrocytes, in which the dotted line delineates the area where cells were present. The shadow in the left, bottom corner, arises from the patch pipette used to stimulate the astrocyte underneath. The subsequent sequence of fluorescence images shows the spatial and temporal properties of the stimulated fluorescence increase. Note that presentation of these difference images demonstrates that the majority of the fluorescence signal coincided with the location of the cells. Additionally, these difference images clearly show that NADH is continuing to accumulate for 12–13 sec. Figure 7B shows a separate culture in which an “arm” of astrocytes is extending from a main body of these cells that is located beyond the top right boundary of the images that are shown. Pipette–cell contact, to stimulate a calcium wave and glutamate release, leads to the appearance of NADH fluorescence that initially spreads radially within the arm of astrocytes. However, with further time, newly appearing NADH, which is selectively presented in these difference images, is located in the top right corner of the image. This spatial pattern of NADH fluorescence presumably results because glutamate is released from astrocytes as the calcium wave propagates to the main body of the astrocytes that is beyond the limit of this image window. Because the appearance of NADH fluorescence, which is our assay for glutamate release, follows the path of the astrocytes, these data suggest that each astrocyte involved in the propagating calcium wave releases glutamate, leading to an extracellular wave of this signal.
Fig. 7.

Spatial distribution of NADH fluorescence in a nonconfluent astrocyte culture. A, The bright-field image at the top left corner shows an optical field just partially covered by cells (inside the region defined by thedotted line). The shadow in thebottom left corner represents the position of the glass pipette, which was used to mechanically stimulate an underlying astrocyte. The series of fluorescence images shows the spatial dynamics of NADH fluorescence, and thus extracellular glutamate, after mechanical stimulation. Note that the interval between each frame (integration time = 0.4 sec) is 1 sec (arrow), instead of 4 sec as in Figure 4. Each image had the image that was collected 3 sec early subtracted from it ([n − (n − 3)]). The color scaleindicates linear pseudocolor representation of fluorescence intensity ranging from 0 to 200. B, Second example of the spatial proximity of the NADH fluorescence signal to the underlying astrocytes. A nonconfluent culture of purified astrocytes is shown in the bright-field image that is located at the top left corner. The set of fluorescence images shows the spatiotemporal dynamics of the NADH fluorescence. Note that near the end of the image sequence, increases in NADH fluorescence are located in the top right portion of the field of view as the calcium wave (data not shown) presumably propagates to neighboring astrocytes that are outside of the field of view (see Results for further explanation). The images were processed as [n − (n − 3)] and low-pass-filtered.Arrow, 1 sec image interval. The color scale indicates a linear pseudocolor representation of fluorescence intensity ranging from 0 to 400.
We directly compared the spatiotemporal relationship of the NADH signal arising from glutamate ejected from a pipette (n = 3) with glutamate released during calcium waves (n = 3). Three areas (5 μm radius) were chosen to quantify the spatiotemporal changes in NADH fluorescence as shown in the bright-field images (Fig.8A,C). The graph in Figure 8B shows the fluorescence traces in the three areas after glutamate ejection from a pipette. The peak amplitude of the fluorescence signal decays with distance from the ejection pipette, as expected by a diffusional process. However, when astrocytes were stimulated, we saw little or no attenuation of the amplitude of the NADH fluorescence at sites remote from the stimulation pipette (Fig.8D). However, the intensity of fluorescence did decrease in cell free regions (Fig. 8C,D, position3). Such a result discounts the possibility that the NADH signal, resulting from glutamate release, arises only from a point source but rather supports the notion that each astrocyte releases additional glutamate.
Fig. 8.

The release of glutamate from astrocytes is regenerative. A, C, Phase-contrast micrographs of the location of a glutamate ejection pipette and of a pipette used to deliver stimuli to astrocytes, respectively. In both experiments GDH and NAD+ were present in the bathing saline. Fluorescence intensities were measured in three different areas in each image, as shown by the circles.B, D, Temporal dynamics of NADH fluorescence in these three areas. Ejection of glutamate from a pipette elevates the fluorescent intensity, whose peak amplitude decays with distance from the ejection source. In contrast, the amplitude of the fluorescent signal does not decay farther away from the site of stimulation of the astrocyte as long as the intensity is measured above a cell (D, compare regions 1,2). This sustained elevation of NADH above the astrocytes supports the regenerative release of glutamate. Note that as predicted by the glutamate ejection experiment shown inA and B, the fluorescent intensity does decay with distance from the cellular boundary (C, dashed line) in cell-free areas (C, D, region3). Fluorescence intensities are expressed as intensity units (i.u.). Camera integration time, 0.5 sec in all experiments.
DISCUSSION
The use of glutamate dehydrogenase to assay the presence of glutamate has previously been shown to be a very useful tool to study the release of glutamate from synaptosomes (Nicholls and Sihra, 1986;Nicholls et al., 1987) and to monitor glutamate release in hippocampal and retinal slices (Ayoub and Dorst, 1998; Ayoub et al., 1998; Bezzi et al., 1998; Maguire et al., 1998). We have now extended this study to investigations of the spatiotemporal kinetics of glutamate release from cultured astrocytes. Our results demonstrate that this method can have spatiotemporal resolution of 20 μm using 500 msec camera integration times in imaging experiments. With this resolution we have been able to provide the first documentation of an extracellular wave of glutamate that is released as a result of elevations of internal calcium in astrocytes. Although technical limitations prevented simultaneous imaging of internal calcium levels and extracellular glutamate, the rate of the glutamate wave (26 μm/sec) corresponds very well with the rate of calcium waves (10–30 μm/sec) (Cornell-Bell et al., 1990;Charles et al., 1991; Dani et al., 1992; Nedergaard, 1994).
Although we could reliably detect the release of glutamate from astrocytes, it was not possible to resolve discrete locations of the cell that released glutamate. However, this is not unexpected, because the spatial resolution of our system is only ∼20 μm. Furthermore, with camera integration times of 500 msec, there is sufficient time for lateral diffusion of glutamate and NADH from any discrete release areas that will limit our ability to resolve local zones of transmitter release. One manner in which it might be possible to obtain enhanced spatial resolution in future studies will be to trigger image capture with timed calcium elevations. For example, repeated short-duration camera exposures (∼50 msec) timed to follow photolysis-evoked elevations of internal calcium should enhance spatial resolution. However, this experiment is likely to be complex, because photolysis of calcium cages, as well as fluorescence excitation of NADH, both require UV illumination.
In these studies we used mechanical stimulation to evoke calcium elevations in astrocytes. This stimulus was necessary because it permitted us to image cells without significant stirring of the saline solution that would accompany application of ligands. Although concern must be exerted when using mechanical stimuli, several controls indicate that the release of glutamate is the result of a physiological, calcium-dependent process, rather than the result of transmitter leakage associated with mechanical injury. For example, the addition of thapsigargin and BAPTA, to perturb intracellular calcium signaling, significantly attenuated the NADH fluorescent signal, a result that is only consistent with a physiological calcium-dependent glutamate release pathway. Additionally, to ensure that our stimulus was as innocuous as possible, we monitored the axial resistance of a patch pipette as it approached the cell surface. In calcium imaging studies we confirmed that on detection of a resistance change associated with pipette–cell contact, we observed the onset of a calcium wave. Although it is not possible to quantify the forces that were exerted onto the cell membrane, monitoring pipette resistance allowed us to confirm that minimal forces were applied to cells, and that it is highly unlikely that damage was inflicted on the cell. Finally, because it has been shown that neuroligands can cause the calcium-dependent release of glutamate from astrocytes (Parpura et al., 1994; Bezzi et al., 1998), mechanical stimulation is thought to be tapping into a phospholipase C-dependent pathway in astrocytes (Charles et al., 1991), which ultimately results in the release of glutamate (Araque et al., 1999).
To determine the potential physiological utility of the glutamate wave that we have imaged, we performed a calibration of our assay system. Although such a calibration is complex, not only involving substrate and enzyme concentrations but also the duration of incubation, we estimate that the GDH-based assay can sense ∼1 μmextracellular glutamate. Furthermore, we estimate that the extracellular concentration of glutamate surrounding astrocytes in these experiments was able to reach up to 100 μm in some experiments (Fig. 5). Because even low concentrations of glutamate can desensitize AMPA receptors (Trussell and Fischbach, 1989; Zorumski et al., 1996), it is likely that this range of extracellular concentration of glutamate has the potential to have a significant impact on the physiology of associated neurons. This is certainly in agreement with previous studies that have demonstrated glutamate-dependent astrocyte-induced neuromodulation (Parpura et al., 1994; Hassinger et al., 1995; Pasti et al., 1997; Bezzi et al., 1998; Araque et al., 1998a,b; Kang et al., 1998; Newman and Zahs, 1998).
Now that we have directly demonstrated waves of extracellular glutamate accompanying elevated internal calcium in astrocytes, it will be very interesting to define the various conditions that result in such elevations of this transmitter in the brain. Stimulation of afferents in the hippocampus leads to elevations of astrocyte calcium level (Dani et al., 1992; Porter and McCarthy, 1996), and waves of elevated calcium in astrocytes have been imaged in the hippocampus (Harris-White et al., 1998). Do these calcium elevations lead to corresponding waves of extracellular glutamate similar to those that we have been able to directly image in this study? In addition to physiological conditions there are pathological states that might use waves of extracellular glutamate. For example, spreading depression is accompanied by a wave of elevated calcium in astrocytes (Basarsky et al., 1998; Kunkler and Kraig, 1998). Does this lead to a local release of glutamate from these glia, too? Because we have detected significant concentrations of extracellular glutamate in this cell culture study, it is likely that the activation of this astrocytic glutamate release pathway has significant physiological consequences in the nervous system, as well having the potential to underlie certain pathological conditions.
Footnotes
This work was supported by National Institutes of Health Grants NS24233 and NS37585 to P.G.H., grants from the Iowa State University Biotechnology Council to P.G.H. and V.P., a grant from the Whitehall Foundation to V.P., and a long-term postdoctoral fellowship from the Human Frontier Science Program to B.I. We thank Dr. Michael McCloskey for stimulating discussion and comments on this manuscript.
Correspondence should be addressed to Philip G. Haydon, Laboratory of Cellular Signaling, Department of Zoology and Genetics, Room 339 Science II, Iowa State University, Ames, IA 50011. E-mail:pghaydon@iastate.edu.
REFERENCES
- 1.Araque A, Parpura V, Sanzgiri RP, Haydon PG. Glutamate-dependent astrocyte modulation of synaptic transmission between cultured hippocampal neurons. Eur J Neurosci. 1998a;10:2129–2142. doi: 10.1046/j.1460-9568.1998.00221.x. [DOI] [PubMed] [Google Scholar]
- 2.Araque A, Sanzgiri RP, Parpura V, Haydon PG. Calcium elevation in astrocytes causes an NMDA receptor-dependent increase in the frequency of miniature synaptic currents in cultured hippocampal neurons. J Neurosci. 1998b;18:6822–6829. doi: 10.1523/JNEUROSCI.18-17-06822.1998. [DOI] [PMC free article] [PubMed] [Google Scholar]
- 3.Araque A, Parpura V, Sanzgiri RP, Haydon PG. Tripartite synapses: glia, the unacknowledged partner. Trends Neurosci. 1999;22:208–215. doi: 10.1016/s0166-2236(98)01349-6. [DOI] [PubMed] [Google Scholar]
- 4.Ayoub GS, Grutsis S, Simko H. Imaging of endogenous neurotransmitter release. J Neurosci Methods. 1998;81:113–119. doi: 10.1016/s0165-0270(98)00038-7. [DOI] [PubMed] [Google Scholar]
- 5.Ayoub GS, Dorst K. Imaging of glutamate release from the goldfish retinal slice. Vision Res. 1998;38:2909–2912. doi: 10.1016/s0042-6989(98)00103-5. [DOI] [PubMed] [Google Scholar]
- 6.Barbour B, Magnus C, Szatkowski M, Gray PTA, Attwell D. Changes in NAD(P)H fluorescence and membrane current produced by glutamate uptake into salamander Muller cells. J Physiol (Lond) 1993;466:573–597. [PMC free article] [PubMed] [Google Scholar]
- 7.Basarsky TA, Duffy SN, Ancrew RD, MacVicar BA. Imaging spreading depression and associated intracellular calcium waves in brain slices. J Neurosci. 1998;18:7189–7199. doi: 10.1523/JNEUROSCI.18-18-07189.1998. [DOI] [PMC free article] [PubMed] [Google Scholar]
- 8.Bezzi P, Carmignoto G, Pasti L, Vesce S, Rossi D, Lodi Rizzini B, Pozzan T, Volterra A. Prostaglandins stimulate calcium-dependent glutamate release in astrocytes. Nature. 1998;391:281–285. doi: 10.1038/34651. [DOI] [PubMed] [Google Scholar]
- 9.Charles AC. Glia-neuron intercellular calcium signaling. Dev Neurosci. 1994;16:196–206. doi: 10.1159/000112107. [DOI] [PubMed] [Google Scholar]
- 10.Charles AC, Merrill JE, Dirksen ER, Sanderson MJ. Intercellular signaling in glial cells: calcium waves and oscillations in response to mechanical stimulation and glutamate. Neuron. 1991;6:983–992. doi: 10.1016/0896-6273(91)90238-u. [DOI] [PubMed] [Google Scholar]
- 11.Charles AC, Dirksen ER, Merrill JE, Sanderson MJ. Mechanisms of intercellular calcium signaling in glial cells studied with dantrolene and thapsigargin. Glia. 1993;7:134–145. doi: 10.1002/glia.440070203. [DOI] [PubMed] [Google Scholar]
- 12.Cornell-Bell AH, Finkbeiner SM, Cooper MS, Smith SJ. Glutamate induces calcium waves in cultured astrocytes: long-range glial signalling. Science. 1990;247:470–473. doi: 10.1126/science.1967852. [DOI] [PubMed] [Google Scholar]
- 13.Dani JW, Chernjavsky A, Smith SJ. Neuronal activity triggers calcium waves in hipocampal astrocyte networks. Neuron. 1992;8:429–440. doi: 10.1016/0896-6273(92)90271-e. [DOI] [PubMed] [Google Scholar]
- 14.Harris-White ME, Zanotti SA, Frautschy SA, Charles AC. Spiral intercellular calcium waves in hippocampal slice cultures. J Neurophysiol. 1998;79:1045–1052. doi: 10.1152/jn.1998.79.2.1045. [DOI] [PubMed] [Google Scholar]
- 15.Hassinger TD, Atkinson PB, Strecker GJ, Whalen LR, Dudek FE, Koseel AH, Kater SB. Evidence for glutamate-mediated activation of hippocampal neurons by glial calcium waves. J Neurobiol. 1995;28:159–170. doi: 10.1002/neu.480280204. [DOI] [PubMed] [Google Scholar]
- 16.Hepp R, Perraut M, Chasserot-Golaz S, Galli T, Aunis D, Langley K, Grant NJ. Cultured glial cells express the SNAP-25 analogue SNAP-23. Glia. 1999;27:181–187. doi: 10.1002/(sici)1098-1136(199908)27:2<181::aid-glia8>3.0.co;2-9. [DOI] [PubMed] [Google Scholar]
- 17.Jeftinija SD, Jefinija KV, Stefanovic G. Cultured astrocytes express proteins involved in vesicular glutamate release. Brain Res. 1997;750:41–47. doi: 10.1016/s0006-8993(96)00610-5. [DOI] [PubMed] [Google Scholar]
- 18.Kang J, Jiang L, Goldman SA, Nedergaard M. Astrocyte-mediated potentiation of inhibitory synaptic transmission. Nat Neurosci. 1998;1:683–692. doi: 10.1038/3684. [DOI] [PubMed] [Google Scholar]
- 19.Kunker PE, Kraig RP. Calcium waves precede electrophysiological changes of spreading depression in hippocampal organ cultures. J Neurosci. 1998;18:3416–3425. doi: 10.1523/JNEUROSCI.18-09-03416.1998. [DOI] [PMC free article] [PubMed] [Google Scholar]
- 20.Lytton J, Westlin M, Hanley MR. Thapsigargin inhibits the sarcoplasmic or endoplasmic reticulum Ca-ATPase family of calcium pumps. J Biol Chem. 1991;266:17067–17071. [PubMed] [Google Scholar]
- 21.Maguire G, Simko H, Weinreb RN, Ayoub G. Transport-mediated release of endogenous glutamate in the vertebrate retina. Pflugers Arch. 1998;436:481–484. doi: 10.1007/s004240050660. [DOI] [PubMed] [Google Scholar]
- 22.Maienschein V, Marxen M, Volknandt W, Zimmermann H. A plethora of presynaptic proteins associated with ATP-storing organelles in cultured astrocytes. Glia. 1999;26:233–244. doi: 10.1002/(sici)1098-1136(199905)26:3<233::aid-glia5>3.0.co;2-2. [DOI] [PubMed] [Google Scholar]
- 23.Nedergaard M. Direct signaling from astrocytes to neurons in cultures of mammalian brain cells. Science. 1994;263:1768–1771. doi: 10.1126/science.8134839. [DOI] [PubMed] [Google Scholar]
- 24.Newman EA, Zahs KR. Calcium waves in retinal glial cells. Science. 1997;275:844–857. doi: 10.1126/science.275.5301.844. [DOI] [PMC free article] [PubMed] [Google Scholar]
- 25.Newman EA, Zahs KR. Modulation of neuronal activity by glial cells in the retina. J Neurosci. 1998;18:4022–4028. doi: 10.1523/JNEUROSCI.18-11-04022.1998. [DOI] [PMC free article] [PubMed] [Google Scholar]
- 26.Nicholls DJ, Sihra TS. Synaptosomes possess an exocytotic pool of glutamate. Nature. 1986;321:772–773. doi: 10.1038/321772a0. [DOI] [PubMed] [Google Scholar]
- 27.Nicholls DJ, Sihra TS, Sanchez-Prieto J. Calcium-dependent and -independent release of glutamate from synaptosomes monitored by continuous fluorometry. J Neurochem. 1987;49:50–57. doi: 10.1111/j.1471-4159.1987.tb03393.x. [DOI] [PubMed] [Google Scholar]
- 28.Parpura V, Basarsky TA, Liu F, Jeftinija K, Jeftinija S, Haydon PG. Glutamate-mediated astrocyte-neuron signalling. Nature. 1994;369:744–747. doi: 10.1038/369744a0. [DOI] [PubMed] [Google Scholar]
- 29.Parpura V, Fang Y, Basarsky T, Jahn R, Haydon PG. Expression of synaptobrevin II, cellubrevin and syntaxin but not SNAP-25 in cultured astrocytes. FEBS Lett. 1995;377:489–492. doi: 10.1016/0014-5793(95)01401-2. [DOI] [PubMed] [Google Scholar]
- 30.Pasti L, Volterra A, Pozzan T, Carmignoto G. Intracellular calcium oscillations in astrocytes: a highly plastic, bidirectional form of communication between neurons and astrocytes in situ. J Neurosci. 1997;17:7817–7830. doi: 10.1523/JNEUROSCI.17-20-07817.1997. [DOI] [PMC free article] [PubMed] [Google Scholar]
- 31.Porter JT, McCarthy KD. Hippocampal astrocytes in situ respond to glutamate released from synaptic terminals. J Neurosci. 1996;16:5073–5081. doi: 10.1523/JNEUROSCI.16-16-05073.1996. [DOI] [PMC free article] [PubMed] [Google Scholar]
- 32.Thastrup O, Culler PJ, Drobak BK, Hanley MR, Dawson AP. Thapsigargin, a tumor promoter, discharges intracellular Ca2+ stores by specific inhibition of the endoplasmic reticulum Ca2(+)-ATPase. Proc Natl Acad Sci USA. 1990;87:2466–2470. doi: 10.1073/pnas.87.7.2466. [DOI] [PMC free article] [PubMed] [Google Scholar]
- 33.Trussell LO, Fischbach GD. Glutamate receptor desensitization and its role in synaptic transmission. Neuron. 1989;3:209–218. doi: 10.1016/0896-6273(89)90034-2. [DOI] [PubMed] [Google Scholar]
- 34.Zorumski CF, Mennerick S, Que J. Modulation of excitatory synaptic transmission by low concentrations of glutamate in cultured rat hippocampal neurons. J Physiol (Lond) 1996;494:465–477. doi: 10.1113/jphysiol.1996.sp021506. [DOI] [PMC free article] [PubMed] [Google Scholar]