

Abstract
The purpose of this study is to elucidate the integrative input mechanisms of pyramidal cells receiving horizontally projecting axon collaterals (horizontal projection) and vertical input from layer IV. We performed whole-cell recordings from pyramidal cells in layer II/III and focally activated other single pyramidal cells monosynaptically connected via long-distance horizontal (LH) projections (the distance between presynaptic and postsynaptic cells was 350–1200 μm) in slice preparations of the kitten primary visual cortex. In addition, presynaptic single fibers in layer IV (vertical input) and/or short-distance horizontal (SH) inputs from neighboring single pyramidal cells (distance within 100 μm) in layer II/III were activated. Unitary EPSPs evoked by the activation of LH and SH connections had smaller amplitude and larger coefficient of variation than those evoked by stimulating the vertical input. Paired-pulse stimulation of the LH and SH inputs caused the depression of the second EPSP, whereas that of vertical inputs caused either facilitation or depression of the second EPSP. The EPSPs evoked by simultaneous activation of LH and vertical inputs summated linearly at the resting membrane potential. However, the EPSPs evoked by stimulation of the two inputs were nonlinearly (supralinearly) summated when the postsynaptic membrane was depolarized to a certain level. Similar EPSP interaction was observed in response to simultaneous activation of the LH and SH inputs.
Keywords: horizontal connection, pyramidal cell, visual cortex, synaptic interaction, whole-cell recording, cat
Pyramidal cells in the visual cortex, particularly those located in the superficial layers, are known to send axon collaterals horizontally for up to several millimeters (Fisken et al., 1975; Gilbert and Wiesel, 1979) and to interconnect with functional domains, or columns, which process similar stimulus features (Gilbert, 1983; Ts'o et al., 1986; Hata et al., 1991). There is some evidence indicating that cells in the primary visual cortex exhibit response modulation depending on the context of the stimuli inside and outside the classical receptive field (Van Essen et al., 1989; Kapadia et al., 1995; Sillito et al., 1995; Polat et al., 1998;Akasaki et al., 1998). It has been suggested that long-range horizontal connections could form the structural basis for this context-dependent integration of visual information over a wide area in the visual field (for review, see Gilbert, 1992).
To understand the functional role of horizontal connections, it is particularly important to clarify the precise nature of the synaptic interactions between the horizontal input and other inputs on a postsynaptic cell. Previous in vitro studies have demonstrated that stimulation of the horizontal pathway evoked weak monosynaptic and polysynaptic EPSPs followed by IPSPs in the visual cortex (Hirsch and Gilbert, 1991; Weliky et al., 1995; Katz et al., 1997). However, Hirsch and Gilbert (1991) used massive electrical stimulation with metal wires to activate the horizontal connections. Thus, axons of passage were also inevitably activated in addition to the target axon collaterals. The combined study using optical imaging of the ferret visual cortex in vivo and laser photostimulation with caged glutamate in slices has been performed to clarify the spatial relationships between the orientation domains and the patterns of the aforementioned lateral connections (Weliky et al., 1995; Katz et al., 1997). Although axons of passage were not stimulated in this method, it was impossible to isolate unitary responses derived from the identified presynaptic neurons.
In the present study, we performed whole-cell recordings from a pyramidal cell in layer II/III in a slice preparation of the kitten primary visual cortex and focally activated a single presynaptic pyramidal cell within layer II/III and/or a single fiber in layer IV. Subsequently, we also performed whole-cell recordings from a presynaptic cell to inject a neural tracer. By using these methods, we were able to analyze unitary EPSPs derived from horizontal and vertical inputs and visualize the synaptically connected cell pairs.
Yoshimura et al. (1999) recently reported that the number of open channels at the peak of EPSCs at pyramidal–pyramidal synapses in layer II/III is several times smaller than that reported for synapses between geniculocortical afferents and layer IV spiny stellate cells (Stratford et al., 1996). Therefore, it is assumed that the convergence of a significant amount of input to a pyramidal cell is necessary to cause it to fire. However, to our knowledge, no study has examined the interactions between horizontal inputs and identified single inputs using intracellular recording techniques. Therefore, we systematically investigated the precise properties of the spatial and temporal interactions between horizontal and vertical inputs.
MATERIALS AND METHODS
All experiments were approved by the Animal Research Committee of the Osaka Bioscience Institute and performed in accordance with the National Institute of Health guidelines for the care and use of laboratory animals.
Slice preparations. Kittens [n = 14, postnatal day 29 (P29)–35] were deeply anesthetized by injections of ketamine (20 mg/kg, i.m.) followed by sodium pentobarbital (40 mg/kg, i.v.), and then perfused transcardially with ice-cold oxygenated artificial CSF (ACSF). The composition of the ACSF was as follows (in mm): 124 NaCl, 3.8 KCl, 1.2 KH2PO4, 1.3 MgSO4, 2.4 CaCl2, 10 glucose, and 26 NaHCO3, pH 7.4 when bubbled with 95% O2 and 5% CO2. Slices of the primary visual cortex (300- to 350-μm-thick) were cut using a rotor slicer (DTY7700; Dosaka EM) and then incubated with ACSF in an interface chamber for 1 hr at 32–34°C. For the recording experiments, the slices were transferred into a submerged recording chamber that was continuously perfused with ACSF at 25–27°C. Recordings were obtained from layer II/III pyramidal cells, which were identified by microscopic observation with Nomarski optics. The criteria for the identification of pyramidal cells have been described previously (Yoshimura and Tsumoto, 1994).
Recording procedures. Whole-cell recordings were made from pyramidal cells in the superficial layers. Whole-cell patch pipettes (resistance, 6–10 MΩ) were filled with a solution containing (in mm) 130 K-gluconate, 10 KCl, 10 HEPES, 3 MgATP, and 0.5 Na2GTP, with pH adjusted to 7.2 using KOH. The osmolality of the solution was 280–285 mOsm. Neurobiotin (0.5%) was added to the pipettes for intracellular staining of the recorded cells. Membrane potentials were recorded in the current-clamp mode with a patch-clamp amplifier (Axopatch 2B; Axon Instruments, Foster City, CA). Liquid junction potentials were corrected. The alignment of the recording and stimulating electrodes is shown in Figure1A. For the stimulation of individual horizontal connections, the tip of a second pipette filled with ACSF was placed onto the soma of other pyramidal cells in the superficial layers. The horizontal connections within layer II/III were divided into two groups according to the distance between the presynaptic and postsynaptic cells as long-distance horizontal (LH) connections (cell distance of 350–1200 μm) and short-distance horizontal (SH) connections (cell distance of <100 μm). If no postsynaptic potential was recorded during 50 trials of stimulation, the stimulating electrode was moved to another neuron. To detect whether the evoked EPSPs were unitary or not, the EPSP amplitudes were plotted against the stimulus intensity (Fig. 1B). In the case of unitary responses, we observed a certain threshold of stimulus intensity below which no response was detected and EPSPs appeared only at or above this threshold. The mean EPSP amplitude did not change significantly with further increases in stimulus intensity beyond a certain range above the threshold (Stern et al., 1992;Yoshimura and Tsumoto, 1994). After the detection of a monosynaptic LH connection (Fig. 1Ad,Cd), an additional stimulating electrode was placed on a pyramidal cell located at a distance of <100 μm from the recorded cell in the superficial layers to activate a SH connection with focal stimulation (Fig. 1Aa,Ca). For the activation of a vertical input from layer IV, a stimulating glass electrode was inserted in layer IV just beneath the recorded cell to activate a single fiber by the minimal-stimulation protocol (Fig.1A, Vertical, D) (Allen and Stevens, 1994). Each input pathway was stimulated at 0.33 Hz. To examine the spatiotemporal interactions between the LH inputs and vertical or SH inputs, the responses to concurrent activation at various interstimulus intervals (ISIs) of any two inputs were recorded. The ISIs used were 0, 5, 10, 20, 50, 100, and 200 msec. For evaluating response summation, the summation index (SI) was defined as follows:
Fig. 1.

Schematic arrangement of electrodes (A) and examples of unitary EPSPs evoked by focal stimulation of horizontal (C) and vertical (D) input pathways. When cell a ord in A was stimulated, clear EPSPs were recorded from a pyramidal cell in the superficial layers, as shown inC. No EPSP was evoked by the stimulation of cellb and c in A. The distance between the stimulated and recorded cells was 60, 350, 410, and 440 μm for cells a–d, respectively. B, The stimulus–response curve of EPSPs obtained from the cell shown inC and D. Each dotindicates the mean peak amplitude of EPSPs evoked by the stimulation of the cell d. Error bars indicate SDs. The abrupt increase of the EPSP amplitude at the stimulus intensity of 13 V suggests that the EPSPs were unitary. D, EPSPs evoked by minimal stimulation of the layer IV.
SI = (the peak amplitude of the EPSP evoked by combined stimulation)/(the peak amplitude obtained by the simple mathematical summation of two EPSPs elicited by the individual activation of two input pathways).
To test the effects of paired-pulse stimulation, either one of the three input pathways was successively stimulated at ISIs of 20, 50, 100, 200, 500, and 1000 msec.
Data acquisition and analysis. Data were digitized at the rate of 10 kHz and fed to a computer (Gateway 2000) for off-line analysis. Synaptic potentials were filtered at 1 kHz. Data were analyzed mainly with pClamp software (Axon Instruments). The rise time of the EPSP was measured as the time between the time points corresponding to 10 and 90% of the peak amplitude. For the analysis of spontaneous EPSPs, the threshold was manually set at 3× the SD of the mean baseline noise value.
Visualization of synaptic contacts. After completion of the physiological recording experiments, we replaced the stimulating electrode with a patch-pipette containing 0.5% neurobiotin and obtained recordings from the presynaptic cell for at least 15 min while injecting neurobiotin under microscopic observation. Accordingly, both presynaptic and postsynaptic cells were histologically visualized by intracellular staining with neurobiotin. Slices were fixed in phosphate buffer (0.1 m, pH 7.4) containing 4% paraformaldehyde and 0.1% glutaraldehyde, immersed in 30% sucrose solution, and then resectioned into 60–80 μm section with a microtome. The sections were then processed by the standard method using avidin-biotinylated horseradish peroxidase complex (Horikawa and Armstrong, 1988). The labeled neurons were reconstructed under a light microscope (Optiphot, Nikon) using a camera lucida.
RESULTS
This study is based on data recorded from 44 postsynaptic and 65 presynaptic pyramidal cells in the kitten visual cortex. All the recorded cells were identified as pyramidal cells in the superficial layers by microscopic observation using Nomarski optics during the recording experiments. All the cells showed typical spike accommodation to a depolarizing current injection, a characteristic of pyramidal cells (Mason and Larkman, 1990). Furthermore, in 7 of 44 pairs with LH connections and 3 of 25 pairs with SH connections, the presynaptic and postsynaptic cells were histologically ascertained as being pyramidal cells by intracellular staining (see below). The input resistance and the resting potential of the recorded cells were 330 ± 103 MΩ and −73.1 ± 4.4 mV (mean ± SD).
Electrophysiological characteristics of LH, SH, and vertical connections
Focal stimuli were applied to individual presynaptic pyramidal cells with either LH or SH connections in the superficial layers, to evoke unitary EPSPs in the recorded postsynaptic cells. For activation of the vertical input, a single input source in layer IV was stimulated by the minimal stimulation protocol (see Materials and Methods). Only unitary EPSPs were analyzed. The means of the peak amplitude, rise time, half-width, and coefficient of variation (CV) of all the recorded unitary EPSPs evoked via the three different input pathways are summarized in Table 1. There was a statistically significant difference between the peak amplitudes of the EPSPs evoked by the activation of vertical input and either LH or SH input (p < 0.01, t test). The difference in the EPSP amplitudes between those evoked by the activation of the LH and SH inputs was not significant (p > 0.5, t test). The amplitudes of the recorded EPSPs, particularly of those evoked by vertical input activation (6.0 ± 2.8 mV), were larger than those reported previously (0.5 ± 0.5 mV for layer II/III cells, Reyes and Sakmann, 1999; 1.17 ± 0.23 mV for layer V cells, Markram and Tsodyks, 1996). In these studies in the rat neocortex, unitary EPSPs of small amplitude were recorded using dual intracellular recordings with patch pipettes. There is the possibility that the minimal stimulation we used activated multiple fibers. During the recordings of the evoked EPSPs, we often observed large spontaneous EPSPs presumed to be attributable to activation of single input fibers. If the amplitudes of the large spontaneous EPSPs were comparable to those of the EPSPs evoked by the minimal stimulation of the vertical inputs, the latter could be attributable to the activation of a single input fiber. To check this, we collected the spontaneous EPSPs obtained in the cells identified for recording vertical input-induced EPSPs. We analyzed 10 cells that exhibited frequent spontaneous EPSPs and accumulated >200 events from each cell. The amplitude distribution of the spontaneous EPSPs varied from 0.4 to 9.7 mV, with a mean of 1.7 ± 1.6 mV. We calculated the mean amplitude of the 5% of the EPSPs exhibiting the largest amplitudes in the spontaneous EPSP distribution. The mean amplitude of the largest spontaneous EPSPs (6.1 ± 1.9 mV) was not significantly different from that of the unitary EPSPs evoked by vertical input stimulation (p > 0.5,t test, Table 1), suggesting that the minimal stimulation of a vertical input activated a single input pathway that evoked the largest amplitude EPSPs. In addition, a previous study with dual intracellular recordings using patch pipettes demonstrated that the EPSPs evoked by an action potential of a presynaptic cell in the kitten visual cortex were much larger than those in the rat visual cortex (Yoshimura et al., 1999). Therefore, we concluded that a single axon was activated with the minimal stimulation protocol in the present study.
Table 1.
Properties of all unitary EPSPs
| Input source | Peak amplitude (mV) | Rise time (msec) | Half width (msec) | CV | |
|---|---|---|---|---|---|
| Long-distance | n= 44 | 3.6 ± 2.2 | 3.9 ± 2.5 | 34.5 ± 19.91-b | 0.42 ± 0.25 |
| Short-distance | n = 25 | 3.9 ± 2.2 | 3.8 ± 2.3 | 43.6 ± 21.7 | 0.40 ± 1.80 |
| Vertical | n = 25 | 6.0 ± 2.81-a | 5.0 ± 2.5 | 53.0 ± 28.11-b | 0.25 ± 0.151-c |
Data are presented as mean ± SD. Significant differences among three input groups are indicated with a–c.
Between this group and other two groups,p < 0.01 (t test).
Between these two groups, p < 0.05 (t test).
Between this group and other two groups,p < 0.05 (t test).
Further analysis was performed to examine the correlation between the electrophysiological properties and the distance between two synaptically connected cells by lateral connections. Figure2 illustrates the mean amplitude (A) and rise time (B) of the EPSPs evoked in each cell by activation of the horizontal input pathways as a function of the distance between two cells (graphs at right). In the graphs shown on the left in Figure 2, the mean peak amplitude (A) and rise time (B) of the EPSPs evoked by the activation of the vertical input are plotted. In regard to the horizontal connections, no correlation between the peak amplitude and the distance between the cells was obvious, however, the peak amplitude of the cell group separated by a distance of >600 μm (2.3 ± 0.8 mV, n = 11) was smaller than that of the cell group within 600 μm (4.0 ± 2.2 mV, n = 58, p < 0.01, t test, Fig.2A). There was no correlation between the cell distance and the rise time of the EPSPs (r = 0.02,p > 0.5, Fig. 2B). Although the peak amplitude of the EPSPs evoked by the activation of vertical inputs was larger than that induced by the activation of horizontal inputs on average (p < 0.01, t test, Table 1), there was no difference in the ranges of distribution of the peak amplitude (Fig. 2A).
Fig. 2.
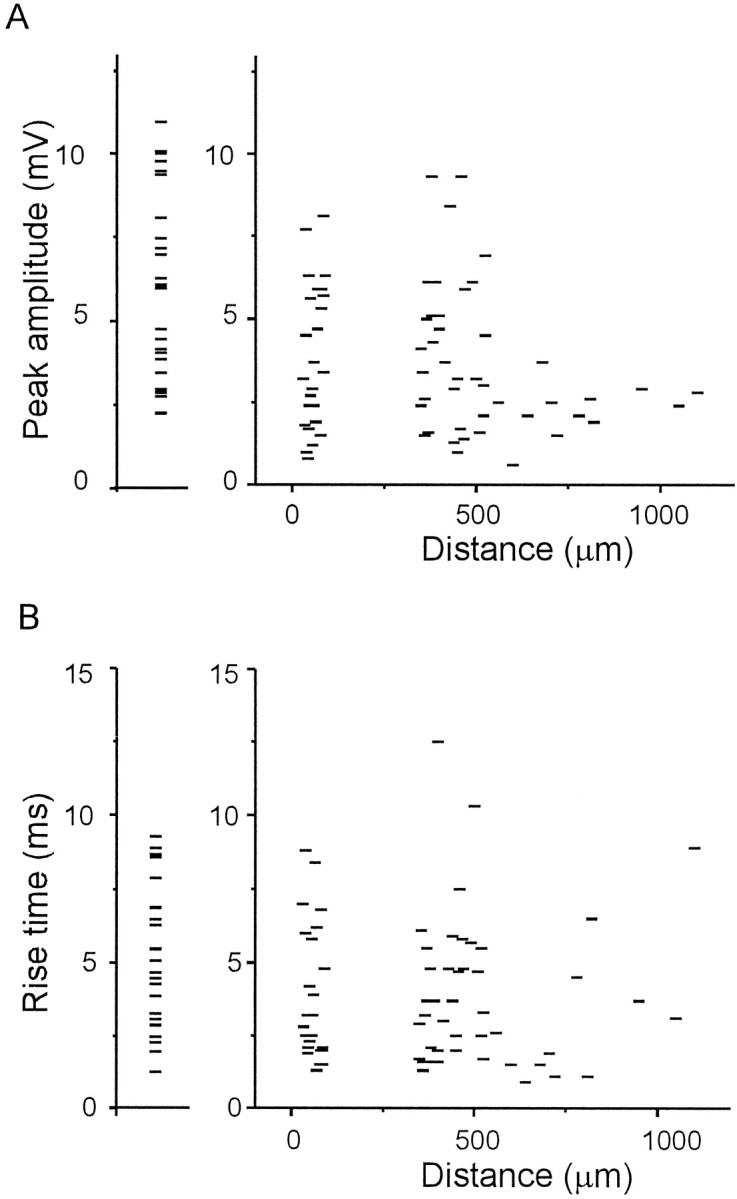
Relationship between the distance separating the presynaptic and postsynaptic cells in layer II/III and the electrophysiological parameters of unitary EPSPs. In the graphs on theright, the peak amplitude (A) and rise time (B) of the unitary EPSPs are plotted as a function of the distance between the recorded and stimulated cells. Each horizontal tick represents data for each pair of horizontally connected cells. The connections between cells separated by distances of <100 μm and 350–1200 μm were defined as SH and LH connections, respectively. Because of sampling bias, cell pairs separated by the distance of 100–350 μm are absent. Note the lack of correlation between the distance and the amplitude or rise time of the EPSPs. The horizontal ticks in the graphs on theleft represent the mean peak amplitude (A) and rise time (B) of the EPSPs evoked by vertical input stimulation.
To visualize the contact sites between pyramidal cells, for which functional connections were identified, presynaptic and postsynaptic cells were stained intracellularly with neurobiotin after the electrophysiological experiments. The morphology of apparent synaptic contacts was retrieved in 10 pairs. Two examples of reconstructed pairs are shown in Figure 3. In these pairs, the axon collaterals from presynaptic cells (Fig. 3, red) ascend to the distal part of the apical dendrite of the postsynaptic cell to give rise to putative synaptic contacts (Fig. 3,arrows). All labeled pairs separated by a distance of >350 μm (n = 7) were assumed to make synaptic contacts on the distal parts of the apical dendrites (Fig. 3, for example). On the other hand, axons derived from more closely situated presynaptic pyramidal cells (n = 3) made contacts either on the apical dendrites (n = 2) or basal dendrites (n = 1) of the postsynaptic cells (data not shown). However, we cannot draw firm conclusions on the relation between the distance separating the cells and contact sites, because these results were solely based on observations under a light microscope.
Fig. 3.
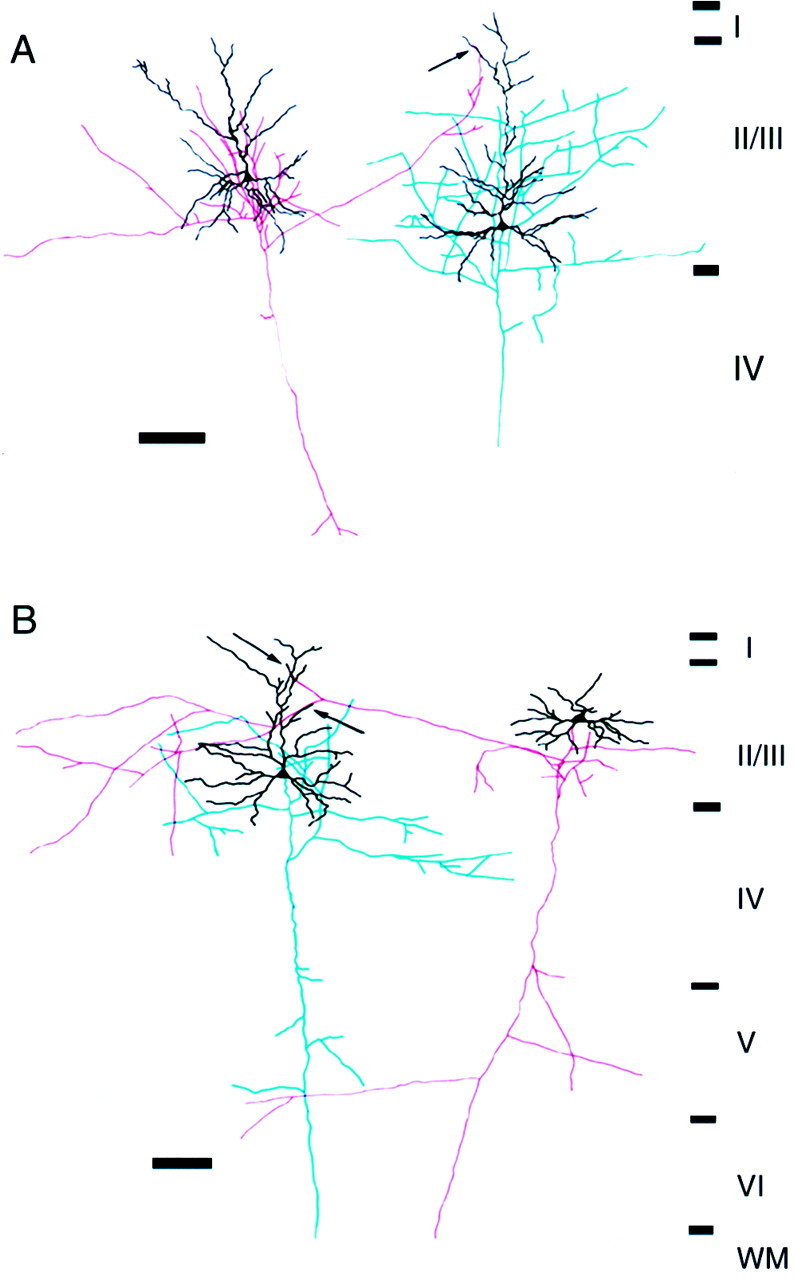
Reconstruction of a pair of connected pyramidal cells in the superficial layers of the kitten visual cortex.A, B, Two examples of pairs connected via long-distance horizontal axon collaterals. The soma and dendrites are shown in black. The axons of the presynaptic and postsynaptic cells are shown in red andblue, respectively. Boutons of axon collaterals of the presynaptic cell are closely apposed to the apical dendrites (arrows) of the postsynaptic cell. Electrophysiological data of the pairs in A and B are shown in Figures 7 and 10A–C, respectively. Scale bars, 100 μm.
Paired-pulse stimulation of a single input pathway
When two successive inputs came from a single cell via an LH pathway within a certain time interval, the second input was incapable of eliciting the full EPSP amplitude in the postsynaptic cell. Typical examples of such paired-pulse depressions observed for LH inputs are shown in Figure 4, A andB. In these cases, the LH input was activated twice at an ISI of 100 msec, and the amplitudes of the second EPSPs were smaller compared to those of the first one. Paired-pulse depression at the synapses for SH input was also observed (Fig. 4C,D) To compare the results of the paired-pulse experiments at ISI of 100 msec among LH, SH, and vertical inputs, the mean amplitudes of the first EPSPs were plotted against those of the second EPSPs for individual cell pairs (Fig. 5). In 9 of 11 cells for the LH connections and all of the 8 cells for the SH connections, the average amplitude of the second EPSPs was significantly smaller than that of the first one (p < 0.05,t test), that is, paired-pulse depression was noted (Fig.5A,B). On the other hand, among the 15 cells tested for the effects of paired-pulse stimulation of the vertical inputs, the second EPSPs were significantly larger than the first ones in six cells (paired-pulse facilitation, p < 0.05, ttest) and smaller in seven cells (paired-pulse depression,p < 0.05, t test, Figs.4E,F, 5C). This analysis revealed that paired-pulse depression was the more common outcome of paired-pulse stimulation of either LH or SH inputs, whereas paired-pulse stimulation of vertical inputs resulted in either facilitation or depression of the second EPSPs (p < 0.05, χ2 test).
Fig. 4.

Effects of paired-pulse stimulation in six experiments. Successive stimulations at an ISI of 100 msec were applied to LH (A, B), SH (C, D), and vertical (E, F) input pathways. Each graph illustrates the data from one pair of cells. Diagonal lines indicate that the amplitudes of the first EPSPs are the same as those of the second. Insets show three individual EPSPs and the average (20–30 trials).
Fig. 5.

A summary of paired-pulse experiments on the three different input pathways. Each dot denotes the average value from one experiment. Horizontal andvertical bars show the SD of the amplitudes of the first and second EPSPs, respectively. Dashed diagonal linesindicate that the amplitudes of the first EPSPs are the same as those of the second. The second EPSPs were significantly depressed compared to the first in 9 of 11 cell pairs for paired-pulse stimulation of LH input and in all eight pairs for that of SH input. Paired-pulse stimulation of vertical input resulted in either significant facilitation (6 of 15) or depression (7 of 15) of the second EPSPs.
The average ratio of the amplitude of the second EPSPs to the first EPSPs tested with various ISIs are summarized in Figure6. Paired-pulse depressions for LH and SH input pathways were observed for ISIs of ≤100 msec.
Fig. 6.

ISI dependence of paired-pulse depression and facilitation. The mean ratios (± SD) of the amplitudes of the second EPSPs to those of the first EPSPs are plotted against the tested ISIs for LH (n = 7), SH (n = 6), and vertical (n = 6) connections. Paired-pulse stimulations with ISIs of <100 msec, on average, induced second EPSP depressions for LH inputs and SH inputs and facilitation for vertical inputs.
Interaction between LH and SH or vertical inputs
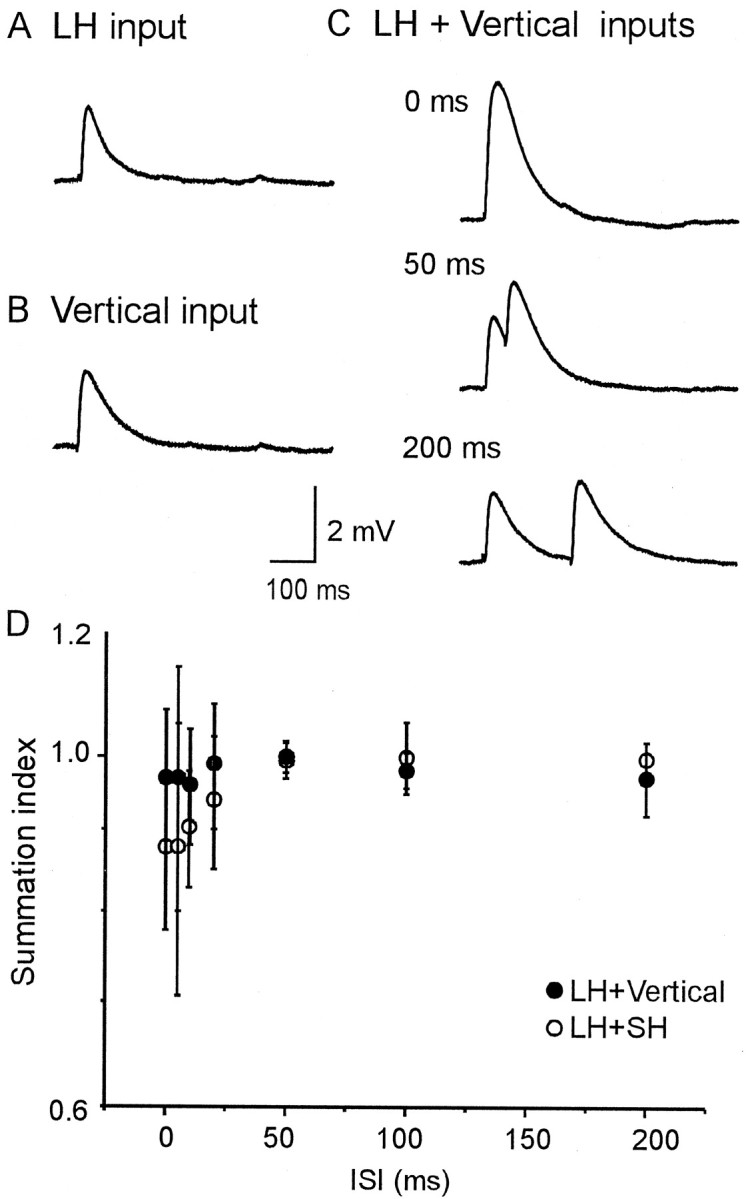
Under physiological conditions in vivo, excitatory input to the pyramidal cells in the superficial layers of the visual cortex would be expected from both horizontal and vertical input pathways. Therefore, we assessed the mechanism for interaction between the LH inputs and the vertical or SH inputs. An example of combined stimulation of an LH input and a vertical input is shown in Figure7. Unitary EPSPs were recorded after minimal stimulation of a LH or vertical input at the resting membrane potential (−71 mV, Fig. 7A, top two traces). The EPSPs evoked by simultaneous activation of the two inputs (A, third trace) showed a similar amplitude and time course to the traces predicted by the mathematical summation of the two individual EPSPs (A, bottom). These results indicate that the EPSP evoked by concurrent activation of the two inputs corresponded to a linear summation of the two individual EPSPs at the resting membrane potential. To mimic the condition of strong excitation, corresponding to the abundant excitatory inputs to the postsynaptic cell, the membrane potential was depolarized to −50 mV by the injection of current (Fig. 7B). Under this depolarized condition, the EPSP evoked by the activation of an individual input pathway was smaller than that evoked without this depolarization, because of the decrease in driving force (Fig. 7B, top two traces). Under this condition, when two inputs were driven simultaneously, the evoked EPSP (B, thick line of third trace) was larger than the mathematical summation (B, bottom trace) of the two individual EPSPs. This indicates the presence of a multiplicative, supralinear summation of EPSPs caused by simultaneous activation of LH and vertical inputs under the depolarized condition.
Fig. 7.

Interaction between EPSPs elicited by activation of LH and vertical inputs. A, Recordings at the resting membrane potential (−71 mV). B, Recordings under the depolarized condition (−50 mV). Single stimulation applied to LH inputs (top traces) or vertical inputs (second traces) induced unitary EPSPs. EPSPs were recorded after simultaneous stimulation of LH and vertical inputs (third traces). Predicted EPSPs (bottom traces) were calculated as a simple mathematical sum of the top two traces. EPSPs evoked by concurrent activation of the two inputs was found to be a linear sum of the two individual EPSPs at the resting membrane potential (A). However, supralinear summation was observed under the condition of a depolarized membrane (B). The EPSP induced by simultaneous stimulation of the two inputs (thick line) and the predicted EPSP (dotted line) were superimposed in the third trace in B. The morphology of this cell pair is shown in Figure 3A.
The supralinear summation of EPSPs was also observed after simultaneous stimulation of LH and SH inputs (Fig. 8). At the resting membrane potential, simultaneous activation of LH and SH inputs evoked an EPSP with an amplitude equal to the linear summation of two individually evoked EPSPs (Fig. 8A). Under the condition in which the cell was depolarized to −55 mV, the interaction between the two inputs switched between two states, that is, between linear and nonlinear summation (Fig. 8Ba,Bb). We calculated the SI (see Materials and Methods) for each of the EPSPs evoked after simultaneous activation of two inputs under the condition in which the cells were depolarized to −55 mV (Fig. 8C). The distribution of SI showed two clear peaks, suggesting a threshold mechanism for the supralinear summation of EPSPs. This switching between the two summation patterns was not observed in the case of simultaneous stimulation at the resting membrane potential, suggesting that it is not an artifact resulting from occasional stimulation of more than two input sources.
Fig. 8.

Interaction between unitary EPSPs evoked by activation of LH (720 μm) and SH (60 μm) inputs. The data shown in A–C were obtained from one cell.A, EPSPs evoked by simultaneous activation of the two inputs were found to be linearly summated at the resting membrane potential (−72 mV). B, Linear (a) and supralinear (b) summations were observed under the condition of a depolarized membrane (−55 mV). InBb, the recorded EPSP (thick line) and the predicted EPSP (dotted line) were superimposed.C, The distribution of the summation index calculated from the EPSPs recorded at −55 mV; data represent those from the experiment shown in B. Note the two clear peaks, the ones on the left and right correspond to linear and nonlinear summation, respectively. Other conventions are the same as in Figure 7.
The SI for the average EPSP amplitude of each recorded cell was calculated and plotted against the membrane potential of the postsynaptic cell (Fig. 9). The simultaneous activation of two inputs often evoked somatic action potentials, although the stimulation of a single input pathway never did. We deleted the data of cells that exhibited these action potentials because we were unable to measure the exact amplitude of the EPSPs in the presence of action potential. In Figure 9, the incidence of the supralinear augmentation of EPSPs evoked by simultaneous activation of LH input and either vertical (filled circles) or SH input (open circles) is clearly shown to be dependent on the extent of depolarization of the membrane. For the cases in which the combined stimulation of the two inputs resulted in supralinear summation of the EPSPs with an SI >1.10, the average membrane potential was −62.5 ± 6.8 mV (average SI = 1.45 ± 0.22, n = 10), whereas for the cases of linear summation where the SI was <1.10, it was −73.7 ± 3.3 mV (average SI = 0.93 ± 0.07, n = 32). The membrane potential between these two groups was significantly different (p < 0.01, t test). Therefore, depolarization of the postsynaptic cell is necessary for reliable supralinear summation after simultaneous activation of two inputs. There was no significant difference in the mean SI of supralinear interaction observed under a depolarized condition between LH and vertical input interaction (SI = 1.47 ± 0.28) and LH and SH input interaction (SI = 1.43 ± 0.19, p > 0.5, t test). The mean SIs of the linear interaction at the resting membrane potential were 0.95 ± 0.05 for LH and vertical input interaction (n = 21) and 0.89 ± 0.08 for LH and SH input interaction (n = 11), and the difference was statistically significant (p < 0.05,t test).
Fig. 9.

Induction of nonlinear interaction by concurrent activation of two inputs depends on the depolarization of membrane potential. Summation indices of cells were plotted against the membrane potential of postsynaptic cells. When two inputs are summated linearly, the SI takes the value of 1. Each point represents data from one cell (n = 26 for LH and vertical input interaction,n = 16 for LH and SH input interaction). For the interaction between LH and SH inputs, linear (or slightly sublinear) summation was observed at the resting membrane potential. Induction of supralinear summation is clearly dependent on the depolarization of the postsynaptic cell for both input interactions.
To assess the temporal nature of the interaction between the two inputs via different pathways, the ISI for two successive stimulations was varied between 0 and 200 msec (Fig.10). The EPSPs evoked by simultaneous or successive activation of LH and vertical inputs were linearly summated for all the tested ISIs at the resting membrane potential (Fig. 10A–C, D, filled circles). The average SIs of the LH and SH input interaction were <1.0 for ISIs of <20 msec (Fig. 10, open circles). Thus, two inputs coming via different pathways interacted linearly at all tested ISIs, whereas those arriving from a single pathway exhibited nonlinear interaction in the case of an ISI of <100 msec (Fig. 6).
Fig. 10.
Temporal interaction between LH and vertical or SH inputs. EPSPs evoked by individual stimulation (A, B) and concurrent stimulation of the two inputs (C).C, EPSPs were linearly summated by concurrent stimulation of both LH and vertical inputs with all tested ISIs.Vm = −77 mV. The morphology of this pair is shown in Figure 3B. D, The mean SIs (± SD) were plotted against the tested ISIs. The graph shows pooled data from six cells for LH and vertical inputs and six cells for LH and SH inputs. The SIs of the interaction between LH and SH inputs are <1 for ISIs of <50 msec.
DISCUSSION
The primary objective of this study is to describe the synaptic interactions between horizontal and vertical connections in the superficial layers of the kitten visual cortex. It is quite important to understand exactly what happens in cells when particular input pathways are activated for the understanding of the cortical strategies for information processing.
Cell separation and amplitude of EPSPs
We used young animals (P29–P35) at the peak of the critical period for cortical plasticity (Hubel and Wiesel, 1970). Morphological studies have demonstrated that the horizontal axons at this age are already fully elongated and adopt a clustered appearance in the cat visual cortex (Callaway and Katz, 1990; Galuske and Singer, 1996). Indeed, we found that the horizontal inputs were functional and interacted with other inputs reasonably well. Analysis of the relationship between the cell distance and the peak amplitude of the EPSPs after horizontal input activation (Fig. 2) revealed that the EPSP amplitudes for cell pairs located within 600 μm showed diverse values of between 0.6 and 9.3 mV (average, 4.0 ± 2.2 mV), whereas those for pairs located >600 μm apart were relatively small (2.3 ± 0.8 mV). This result suggests that lateral excitatory inputs originating from single cells more than 600 μm away are less influential than those from cells within 600 μm. One possible explanation is that the synapses of the horizontal inputs that arose from cells more than 600 μm apart were targeted to remote sites on the dendritic tree of the postsynaptic cells, and passive dendritic filtering reduced the amplitudes of the EPSPs. However, we found no significant difference in the rise time of the EPSPs between cell pairs separated by distances of <600 μm and those separated by distances of >600 μm. Therefore, there seems to be no difference in the dendritic filtering effects between these two groups, because the rise time is one of the electrophysiological parameters reflecting differences in electrotonic filtering. Another possibility is that the number of synaptic connection between remote pyramidal cells is smaller than that between nearby cells and/or that the synaptic conductance of remote inputs is relatively small compared to that from closer cells. Further studies are necessary to assess these possibilities.
Source of vertical inputs
In the present study, we focally stimulated layer IV precisely underneath the recorded postsynaptic cell with a stimulus intensity capable of eliciting a unitary EPSP. We were unable to determine the source of vertical input in the individual cases tested, however, they were considered as mainly reflecting the inputs from layer IV spiny stellate cells to the superficial pyramids, because the axons of layer IV spiny neurons project densely into the superficial layers (Gilbert and Wiesel, 1979; Lund et al., 1979; Martin and Whitteridge, 1984), whereas thalamic afferents rarely project in the superficial layers (Garey and Powell 1971; LeVay and Gilbert, 1976).
Integration of excitation evoked by two different input pathways
When two inputs arrived at a pyramidal cell via different pathways, linear or nonlinear summation of the evoked EPSPs was noted depending on the membrane potential (Figs. 7-9). In the interaction between the two inputs, particularly that between LH and SH inputs, the summation indices of a majority of cases tested at the resting membrane potential were slightly smaller than 1.0 (Fig. 9). Therefore, it might be more appropriately called a slight sublinear summation than a linear summation. Such sublinear summation is also reported for two input interactions at the distal apical dendrites of CA1 pyramidal cells in rat hippocampal slices (Cash and Yuste, 1999). In that study, the shunting caused by activation of transient A-type potassium-ion channels in dendrites was suggested to be the underlying mechanism of the sublinear summation. We observed transient sublinear summation when two inputs arrived at a postsynaptic cell within a short interval (ISI < 50 msec, Fig. 10). Therefore, a similar transient increase in conductance may be responsible for this phenomenon.
Under the depolarized condition, the EPSPs evoked by simultaneous activation of either the LH and SH inputs or the LH and vertical inputs were larger than the simple sum of the two EPSPs evoked by individual activation of either. Although the mechanism responsible for the supralinear summation of membrane responses is not yet clear, our results suggest that a threshold mechanism underlies the switching from the linear to supralinear EPSP summation (Figs. 8, 9). Supralinear interaction may possibly be mediated by the NMDA receptors (Thomson, 1997; Cash and Yuste, 1999) and/or voltage-dependent conductance in dendrites (Cash and Yuste, 1999; Larkum et al., 1999). Hirsch and Gilbert (1991) previously reported that a voltage-dependent enhancement of EPSPs could be evoked by massive stimulation of horizontal pathways in the superficial layers. Such an enhancement was reported to be mediated by voltage-sensitive Na+ channels (Hirsch and Gilbert, 1991), although there is also evidence for NMDA receptor-mediated enhancement of EPSPs (Thomson, 1997). More recently,Larkum et al. (1999) reported that an axonal action potential facilitates the initiation of voltage-dependent Ca2+ action potentials in dendrites when it coincides with dendritic inputs in rat somatosensory cortex.
We found that the voltage-dependent enhancement of EPSPs could be observed in a very simple scheme that included only a pyramidal cell and two single input pathways. It is, therefore, suggested that the observed nonlinear summation is attributable to the intrinsic membrane properties of the pyramidal cells or the synaptic properties of the inputs, rather than the properties of the global neuronal circuitry. This augmentation capacity of horizontal input suggests an important role of horizontal connections in information processing in the visual cortex based on the after argument. In our results, horizontal inputs interacted synergistically with vertical inputs. Because horizontal projections are known to connect neurons which share similar functional properties, such as orientation or chromatic preference for visual stimuli (Ts'o and Gilbert, 1988; Gilbert and Wiesel, 1989), their activation might have a function in the selection of cell assemblies suitable for the analysis of a specific feature of visual stimuli. When abundant excitatory vertical inputs are present in the superficial layers, the augmentation of EPSPs in a particular group of pyramidal cells caused by horizontal inputs will accentuate the output of the cell assembly related to the specific stimulus feature.
Comparison of properties between horizontal and vertical inputs
We observed paired-pulse depression in the transmission between proximal pyramidal cells in the kitten visual cortex (Figs.4C,D, 5B), with results similar to those reported for the rat visual cortex (Thomson et al., 1993; Thomson and West, 1993; Markram and Tsodyks, 1996). Additionally, we found that such depression was also induced in the LH input pathway (Figs.4A,B, 5A). However, Reyes and Sakmann (1999) reported that paired-pulse stimulation of connections between layer II/III pyramidal cells situated close-by in P28 rats induced facilitation of the second EPSP, whereas it induced weak depression or no significant effect in younger (P14) rats. There is a discrepancy between their results and ours, because we found only paired-pulse depression for SH inputs. There might be a species difference in the mechanism of this short-term modification, or, alternatively, the visual cortex of kittens of P29–P35 might be less mature than that of P28 rat in this respect. Unfortunately, we did not test high-frequency stimulation of individual input pathways and could not describe the depression during trains depending on the frequency (Markram and Tsodyks, 1996; Abbott et al., 1997). However, we tested two successive stimulations at several different ISIs (Fig. 6). Paired-pulse depression was more consistently observed for the horizontal connections than for the vertical connection for ISIs of <100 msec (Figs. 4-6).
The aforementioned results suggest that the depression of horizontal input with short ISI could be involved in the suppressive modulation of visual responses by stimuli outside of the receptive field (Blakemore and Tobin, 1972; Nelson and Frost, 1978; Van Essen et al., 1989; Li and Li, 1994; Sengpiel et al., 1997) or the response adaptation to high-contrast visual stimuli (Movshon and Lennie, 1979; Ohzawa et al., 1982, 1985; Carandini and Ferster, 1997). Stimulus specificity of such suppressive phenomena in the visual cortex in vivo could be explained by stimulus-specific horizontal connection.
The EPSPs evoked by stimulation of vertical input exhibited different properties from those evoked by stimulation of horizontal input, that is, the former were relatively larger in amplitude and showed smaller fluctuations from trial to trial (Table 1). Because vertical inputs from layer IV to the superficial layers carry information of the primary stage, the reliability of synaptic transmission might be more secure than in other synapses in the visual cortex. Partly in support of this notion, it has been reported that a much larger number of channels are involved in unitary EPSPs at geniculocortical synapses than at synapses between pyramidal cells in layer II/III (Stratford et al., 1996; Yoshimura et al., 1999), and also in the present study, the paired-pulse stimulation of vertical inputs led to paired-pulse depression less often than did paired-pulse stimulation of horizontal inputs (Figs. 4-6).
On the other hand, a single excitatory connection between pyramidal cells in layer II/III may elicit a relatively small excitation in a postsynaptic cell and, consequently, the pyramidal cell in layer II/III requires the convergence of several excitatory inputs to fire. This, in turn, means that pyramidal cells have a wide dynamic range for the modulation of responses to vertical inputs according to the activity of the surrounding neuronal networks. Thus, the activity of pyramidal cells in layer II/III seems to be controlled by the activity of many horizontally connected cells, which may form the basis for context-dependent modulation of the responses of cortical neurons (Van Essen et al., 1989; Kapadia et al., 1995; Sillito et al., 1995; Akasaki et al., 1998; Polat et al., 1998).
Footnotes
This work was supported in part by the Research for the Future Program (RFTF) Grant JSPS-RFTF 98L00201 from the Japan Society for the Promotion of Science (JSPS), and in part by JSPS fellowships for Japanese Junior Scientists and Kanehara Memorial Foundation (Y.Y.). We thank Dr. K. Fox for critical reading of this manuscript, Dr. Y. Komatsu for helpful discussions, and Mr. T. Shiomitsu for technical assistance.
Correspondence should be addressed to Dr. Yumiko Yoshimura, Department of Visual Neuroscience, Research Institute of Environmental Medicine, Nagoya University, Furo-cho, Chikusa-ku, Nagoya, Aichi, 464-8601, Japan. E-mail: yyumiko@riem.nagoya-u.ac.jp.
REFERENCES
- 1.Abbott LF, Varela JA, Sen K, Nelson SB. Synaptic depression and cortical gain control. Science. 1997;275:220–224. doi: 10.1126/science.275.5297.221. [DOI] [PubMed] [Google Scholar]
- 2.Akasaki T, Yoshimura Y, Sato H. Modulation of visual response properties by stimulus outside of the classical receptive field in cat area 17. Neurosci Res. 1998;22:S180.344. [Google Scholar]
- 3.Allen C, Stevens CF. An evaluation of causes for unreliability of synaptic transmission. Proc Natl Acad Sci USA. 1994;91:10380–10383. doi: 10.1073/pnas.91.22.10380. [DOI] [PMC free article] [PubMed] [Google Scholar]
- 4.Blakemore C, Tobin EA. Lateral inhibition between orientation detectors in the cat's visual cortex. Exp Brain Res. 1972;15:439–440. doi: 10.1007/BF00234129. [DOI] [PubMed] [Google Scholar]
- 5.Callaway EM, Katz LC. Emergence and refinement of clustered horizontal connections in cat striate cortex. J Neurosci. 1990;10:1134–1153. doi: 10.1523/JNEUROSCI.10-04-01134.1990. [DOI] [PMC free article] [PubMed] [Google Scholar]
- 6.Carandini M, Ferster D. A tonic hyperpolarization underlying contrast adaptation in cat visual cortex. Science. 1997;276:949–952. doi: 10.1126/science.276.5314.949. [DOI] [PubMed] [Google Scholar]
- 7.Cash S, Yuste R. Linear summation of excitatory inputs by CA1 Pyramidal neurons. Neuron. 1999;22:383–394. doi: 10.1016/s0896-6273(00)81098-3. [DOI] [PubMed] [Google Scholar]
- 8.Fisken RA, Garey LJ, Powell TP. The intrinsic, association and commissural connections of area 17 on the visual cortex. Proc R Soc Lond B Biol Sci. 1975;272:487–536. doi: 10.1098/rstb.1975.0099. [DOI] [PubMed] [Google Scholar]
- 9.Galuske RA, Singer W. The origin and topography of long-range intrinsic projections in cat visual cortex: a developmental study. Cereb Cortex. 1996;6:417–430. doi: 10.1093/cercor/6.3.417. [DOI] [PubMed] [Google Scholar]
- 10.Garey LJ, Powell TP. An experimental study of the termination of the lateral geniculo-cortical pathway in the cat and monkey. Proc R Soc Lond B Biol Sci. 1971;179:41–63. doi: 10.1098/rspb.1971.0080. [DOI] [PubMed] [Google Scholar]
- 11.Gilbert CD. Microcircuitry of the visual cortex. Annu Rev Neurosci. 1983;6:217–247. doi: 10.1146/annurev.ne.06.030183.001245. [DOI] [PubMed] [Google Scholar]
- 12.Gilbert CD. Horizontal integration and cortical dynamics. Neuron. 1992;9:1–13. doi: 10.1016/0896-6273(92)90215-y. [DOI] [PubMed] [Google Scholar]
- 13.Gilbert CD, Wiesel TN. Morphology and intracortical projections of functionally characterised neurones in the cat visual cortex. Nature. 1979;280:120–125. doi: 10.1038/280120a0. [DOI] [PubMed] [Google Scholar]
- 14.Gilbert CD, Wiesel TN. Columnar specificity of intrinsic horizontal and cortico-cortical connections in cat visual cortex. J Neurosci. 1989;9:2432–2442. doi: 10.1523/JNEUROSCI.09-07-02432.1989. [DOI] [PMC free article] [PubMed] [Google Scholar]
- 15.Hata Y, Tsumoto T, Sato H, Tamura H. Horizontal interactions between visual cortical neurones studied by cross-correlation analysis in the cat. J Physiol (Lond) 1991;441:593–614. doi: 10.1113/jphysiol.1991.sp018769. [DOI] [PMC free article] [PubMed] [Google Scholar]
- 16.Hirsch JA, Gilbert CD. Synaptic physiology of horizontal connections in the cat's visual cortex. J Neurosci. 1991;11:1800–1809. doi: 10.1523/JNEUROSCI.11-06-01800.1991. [DOI] [PMC free article] [PubMed] [Google Scholar]
- 17.Horikawa K, Armstrong WE. A versatile means of intracellular labeling: injection of biocytin and its detection with avidin conjugates. J Neurosci Methods. 1988;25:1–11. doi: 10.1016/0165-0270(88)90114-8. [DOI] [PubMed] [Google Scholar]
- 18.Hubel D H, Wiesel TN. The period of susceptibility to the physiological effects of unilateral eye closure in kittens. J Physiol (Lond) 1970;206:419–436. doi: 10.1113/jphysiol.1970.sp009022. [DOI] [PMC free article] [PubMed] [Google Scholar]
- 19.Kapadia MK, Ito M, Gilbert CD, Westheimer G. Improvement in visual sensitivity by changes in local context: parallel studies in human observers and in V1 of alert monkeys. Neuron. 1995;15:843–856. doi: 10.1016/0896-6273(95)90175-2. [DOI] [PubMed] [Google Scholar]
- 20.Katz L, Weliky M, Dalva M. Relationships between local synaptic connections and orientation domains in primary visual cortex. Neuron. 1997;19:871–880. doi: 10.1016/s0896-6273(00)80968-x. [DOI] [PubMed] [Google Scholar]
- 21.Larkum ME, Zhu JJ, Sakmann B. A new cellular mechanism for coupling inputs arriving at different cortical layers. Nature. 1999;398:338–341. doi: 10.1038/18686. [DOI] [PubMed] [Google Scholar]
- 22.LeVay S, Gilbert CD. Laminar patterns of geniculocortical projection in the cat. Brain Res. 1976;113:1–19. doi: 10.1016/0006-8993(76)90002-0. [DOI] [PubMed] [Google Scholar]
- 23.Li C-Y, Li W. Extensive integration field beyond the classical receptive field of cat's striate cortical neurons: classification and tuning properties. Vision Res. 1994;34:2337–2355. doi: 10.1016/0042-6989(94)90280-1. [DOI] [PubMed] [Google Scholar]
- 24.Lund JS, Henry GH, Macqueen CL, Harvey AR. Anatomical organization of the primary visual cortex (area 17) of the cat. A comparison with area 17 of the macaque monkey. J Comp Neurol. 1979;184:599–618. doi: 10.1002/cne.901840402. [DOI] [PubMed] [Google Scholar]
- 25.Markram H, Tsodyks M. Redistribuion of synaptic efficacy between neocortical pyramidal cells. Nature. 1996;382:807–810. doi: 10.1038/382807a0. [DOI] [PubMed] [Google Scholar]
- 26.Martin KAC, Whitteridge DJ. Form, function and intracortical projections of spiny neurones in the striate visual cortex of the cat. J Physiol (Lond) 1984;353:463–504. doi: 10.1113/jphysiol.1984.sp015347. [DOI] [PMC free article] [PubMed] [Google Scholar]
- 27.Mason A, Larkman A. Correlations between morphology and electrophysiology of pyramidal neurons in slices of rat visual cortex. II. Electrophysiology. J Neurosci. 1990;10:1415–1428. doi: 10.1523/JNEUROSCI.10-05-01415.1990. [DOI] [PMC free article] [PubMed] [Google Scholar]
- 28.Movshon JA, Lennie P. Pattern-selective adaptation in visual cortical neurones. Nature. 1979;278:850–852. doi: 10.1038/278850a0. [DOI] [PubMed] [Google Scholar]
- 29.Nelson JI, Frost BJ. Orientation-selective inhibition from beyond the classic visual receptive field. Brain Res. 1978;139:359–365. doi: 10.1016/0006-8993(78)90937-x. [DOI] [PubMed] [Google Scholar]
- 30.Ohzawa I, Sclar G, Freeman RD. Contrast gain control in the visual cortex. Nature. 1982;298:266–268. doi: 10.1038/298266a0. [DOI] [PubMed] [Google Scholar]
- 31.Ohzawa I, Sclar G, Freeman RD. Contrast gain control in the cat's visual system. J Neurophysiol. 1985;54:651–667. doi: 10.1152/jn.1985.54.3.651. [DOI] [PubMed] [Google Scholar]
- 32.Polat U, Mizobe K, Pettet MW, Kasamatsu T, Norcia AM. Collinear stimuli regulate visual responses depending on cell's contrast threshold. Nature. 1998;391:580–584. doi: 10.1038/35372. [DOI] [PubMed] [Google Scholar]
- 33.Reyes A, Sakmann B. Developmental switch in the short-term modification of unitary EPSPs evoked in layer 2/3 and layer 5 pyramidal neurons of rat neocortex. J Neurosci. 1999;19:3827–3835. doi: 10.1523/JNEUROSCI.19-10-03827.1999. [DOI] [PMC free article] [PubMed] [Google Scholar]
- 34.Sengpiel F, Sen A, Blakemore C. Characteristics of surround inhibition in cat area 17. Exp Brain Res. 1997;116:216–228. doi: 10.1007/pl00005751. [DOI] [PubMed] [Google Scholar]
- 35.Sillito A M, Grieve KL, Jones HE, Cudeiro J, Davis J. Visual cortical mechanisms detecting focal orientation discontinuities. Nature. 1995;378:492–496. doi: 10.1038/378492a0. [DOI] [PubMed] [Google Scholar]
- 36.Stern P, Edwards F, Sakmann B. Fast and slow components of unitary EPSCs on stellate cells elicited by focal stimulation in slices of rat visual cortex. J Physiol (Lond) 1992;449:247–278. doi: 10.1113/jphysiol.1992.sp019085. [DOI] [PMC free article] [PubMed] [Google Scholar]
- 37.Stratford KJ, Tarczy-Hornoch K, Martin KAC, Bannister NJ, Jack JJB. Excitatory synaptic inputs to spiny stellate cells in cat visual cortex. Nature. 1996;382:258–261. doi: 10.1038/382258a0. [DOI] [PubMed] [Google Scholar]
- 38.Thomson AM. Activity-dependent properties of synaptic transmission at two classes of connections made by rat neocortical pyramidal axons in vitro. J Physiol (Lond) 1997;502:131–147. doi: 10.1111/j.1469-7793.1997.131bl.x. [DOI] [PMC free article] [PubMed] [Google Scholar]
- 39.Thomson AM, West DC. Fluctuations in pyramid-pyramid excitatory postsynaptic potentials modified by presynaptic firing pattern and postsynaptic membrane potential using paired intracellular recording in rat neocortex. Neuroscience. 1993;54:329–346. doi: 10.1016/0306-4522(93)90256-f. [DOI] [PubMed] [Google Scholar]
- 40.Thomson AM, Deuchars J, West DC. Large, deep layer pyramid-pyramid single axon EPSPs in slices of rat motor cortex display paired pulse and frequency-dependent depression, mediated presynaptically and self-facilitation, mediated postsynaptically. J Neurophysiol. 1993;70:2354–2369. doi: 10.1152/jn.1993.70.6.2354. [DOI] [PubMed] [Google Scholar]
- 41.Ts'o DY, Gilbert CD. The organization of chromatic and spatial interactions in the primate striate cortex. J Neurosci. 1988;8:1712–1727. doi: 10.1523/JNEUROSCI.08-05-01712.1988. [DOI] [PMC free article] [PubMed] [Google Scholar]
- 42.Ts'o DY, Gilbert CD, Wiesel TN. Relationships between horizontal interactions and functional architecture in cat striate cortex as revealed by cross-correlation analysis. J Neurosci. 1986;6:1160–1170. doi: 10.1523/JNEUROSCI.06-04-01160.1986. [DOI] [PMC free article] [PubMed] [Google Scholar]
- 43.Van Essen DC, De Yoe EA, Olavarria JF, Knierim JJ, Fox JM, Sagi D, Julesz B. Neural responses to static and moving texture patterns in visual cortex of the macaque monkey. In: Lam DM-K, Gilbert CD, editors. Neural mechanisms of visual perception. Portfolio; Woodlands, TX: 1989. pp. 137–154. [Google Scholar]
- 44.Weliky M, Kandler K, Fitzpatrick D, Katz L. Patterns of excitation and inhibition evoked by horizontal connections in visual cortex share a common relationship to orientation columns. Neuron. 1995;15:541–552. doi: 10.1016/0896-6273(95)90143-4. [DOI] [PubMed] [Google Scholar]
- 45.Yoshimura Y, Tsumoto T. Dependence of LTP induction on postsynaptic depolarization: a perforated patch-clamp study in visual cortical slices of young rats. J Neurophysiol. 1994;71:1638–1645. doi: 10.1152/jn.1994.71.5.1638. [DOI] [PubMed] [Google Scholar]
- 46.Yoshimura Y, Kimura F, Tsumoto T. Estimation of single channel conductance underlying synaptic transmission between pyramidal cells in the visual cortex. Neuroscience. 1999;88:347–352. doi: 10.1016/s0306-4522(98)00382-0. [DOI] [PubMed] [Google Scholar]