

Abstract
Dendritic spines receive most excitatory inputs in the CNS and compartmentalize calcium. Although the mechanisms of calcium influx into spines have been explored, it is unknown what determines the calcium decay kinetics in spines. With two-photon microscopy we investigate action potential-induced calcium dynamics in spines from rat CA1 pyramidal neurons in slices. The [Ca2+]i in most spines shows two decay kinetics: an initial fast component, during which [Ca2+]i in spines decays to dendritic levels, followed by a slower decay phase in which the spine follows dendritic kinetics. The correlation between [Ca2+]i in spine and dendrite at the breakpoint of the decay kinetics demonstrates diffusional equilibration between spine and dendrite during the slower component. To explain the faster initial decay, we rule out saturation or kinetic effects of endogenous or exogenous buffers and focus instead on (1) active calcium extrusion and (2) buffered diffusion of calcium from spine to dendrite. The presence of an undershoot in most spines indicates that extrusion mechanisms can be intrinsic to the spine. Supporting the two mechanisms, pharmacological blockade of smooth endoplasmic reticulum calcium (SERCA) pumps and the length of the spine neck affect spine decay kinetics. Using a mathematical model, we find that the contribution of calcium pumps and diffusion varies from spine to spine. We conclude that dendritic spines have calcium pumps and that their density and kinetics, together with the morphology of the spine neck, determine the time during which the spine compartmentalizes calcium.
Keywords: CA1, imaging, two-photon, buffer, LTP, slices, SERCA, CPA
Dendritic spines are small (<1 μm in diameter) structures onto which most excitatory synaptic connections are made (Ramón y Cajal, 1904; DeRobertis and Bennett, 1955;Palay, 1956). They are separated from their parent dendrites by a thin neck and therefore may serve as individual biochemical compartments that allow synapses to be regulated independently. The advent of selective calcium indicators (Grynkiewicz et al., 1985) and two-photon microscopy (Denk et al., 1994) has allowed the functional characterization of spines and has demonstrated that spines are capable of compartmentalizing calcium during synaptic stimulation (Yuste and Denk, 1995; Koester and Sakmann, 1998; Emptage et al., 1999; Yuste et al., 1999). Because long-term plasticity is input-specific (Levy and Desmond, 1985; Gustafsson and Wigstrom, 1986) and dependent on the concentration of intracellular free calcium ([Ca2+]i; Malenka et al., 1988), it has been proposed that the compartmentalization of calcium, and the activation of calcium-dependent enzymes, at the spine underlies synaptic plasticity (Miller and Kennedy, 1986; Wickens, 1988;Lisman, 1989; Koch and Zador, 1993). Some forms of long-term plasticity require the concurrent activation of pre- and postsynaptic neurons and are dependent on NMDA receptor activation. In fact, calcium entry into spines is greatly enhanced when action potentials (APs) are paired with synaptic stimulation, and this supralinear enhancement requires NMDA receptor activation (Yuste and Denk, 1995; Koester and Sakmann, 1998;Yuste et al., 1999). The precise timing of postsynaptic APs and EPSPs is necessary for both the supralinear calcium influx into spines (Yuste et al., 1999) and for synaptic plasticity (Magee and Johnston, 1997;Markram et al., 1997), so there is then a small time window in which these events are interpreted by the cell as coincident. It is therefore likely that the ability of the spine to compartmentalize calcium determines this window of opportunity for synaptic plasticity.
In previous work we studied the mechanisms by which calcium enters hippocampal CA1 spines, concluding that there were at least three different influx pathways, namely voltage-sensitive calcium channels, NMDA receptors, and calcium-permeable AMPA receptors, that could be activated specifically under different functional paradigms (Yuste et al., 1999). In addition, calcium influx into a spine can be coupled to calcium release from internal stores (Korkotian and Segal, 1998;Emptage et al., 1999). Although these studies identify the mechanisms of the calcium accumulations into a spine, little is known about what controls the decays of [Ca2+]i in spines. This question is essential for understanding how spines compartmentalize calcium and identifying the kinetics and regulation of that process. Here we study the mechanisms that control the spine decay kinetics and how the relationship between spine and dendrite produces the spatiotemporal structure of the spine calcium transients. Our results highlight the combined role of calcium pumps and spine neck morphology in determining the window of time during which calcium is compartmentalized and, therefore, during which it could mediate synapse-specific learning rules.
MATERIALS AND METHODS
Slices and electrophysiology. Hippocampal slices were made from P13–P19 Sprague Dawley rats. Slices were cut with aVibratome (TPI, St. Louis, MO) or a Vibroslicer (Campden Instruments, Shelby, UK) and were maintained in a submerged incubation chamber at room temperature until they were transferred after 1–8 hr to a submerged recording chamber. Artificial cerebral spinal fluid (aCSF) contained (in mm): 126 NaCl, 3 KCl, 2 CaCl2, 2 MgSO4, 1.1 NaH3PO4, 26 NaHCO3, and 10 dextrose, with 95% O2/5% CO2. CA1 pyramidal neurons were selected under differential interference contrast (DIC) on the basis of the triangular shape of their cell bodies and their position within the CA1 cell layer. Whole-cell recordings were made with an Axoclamp 2B (Axon Instruments, Foster City, CA) amplifier operating under current clamp conditions. Recordings were made at 37°C or at room temperature (24–28°C). Resting potential (Vm) was held at −70 mV and was not corrected for junction potentials. Electrodes were filled with a solution containing (in mm): 5 NaCl, 10 KCl, 10 HEPES, 135 KMeSO4, 2.5–4 Mg-ATP, 0.3 Na-GTP, and 200 μm calcium green-1 (Molecular Probes, Eugene, OR); resistances were 6–7 MΩ. Some experiments (such as Fig. 1B) were performed with 100 μm calcium green-1 but are not included in the quantification. Additionally, in some bleaching experiments the cells were filled with 500 μm calcium green-1 to enhance the signal-to-noise ratio and allow the use of gentler bleaching pulses. Electrophysiological signals were digitized using an analog-to-digital board and Superscope (InstruNet, GW Instruments, Somerville, MA). Single action potentials were elicited by brief (∼5 msec) injections of depolarizing current through the somatic electrode. In a few cases two action potentials were elicited within a 16 msec period. In experiments addressing the function of the smooth endoplasmic reticulum calcium (SERCA) pump, 15–30 μm cyclopiazonic acid (CPA; Sigma, St. Louis, MO) was included in the aCSF.
Fig. 1.

Kinetics of calcium decays in spines and adjacent dendrites after an action potential. A, Two-photon image of a living CA1 pyramidal cell filled with 200 μm calcium green through a patch pipette (top leftcorner). Image is a collapsed z-stack of images taken 1 μm apart. Inset shows image of a spine in theboxed region of the dendrite of this cell. The spine image was taken at a resolution of 0.1 μm in z. B,[Ca2+]i kinetics in a spine and parent dendrite after a back-propagating action potential. Immediately after an action potential is fired, [Ca2+]iin the spine (solid line) rises to a level ∼1.5 times higher than that of the dendrite (stippled line). All spine traces in the figures are represented by solid lines, whereas dendritic traces are represented bystippled lines. Thin lines represent exponential fits to the data. The dendrite decays down to baseline levels with a single-exponential time scale (τ = 350 msec). Within the first 200 msec after the action potential [Ca2+]i in the spine decays to near-dendritic levels (τ = 110 msec). After a breakpoint (arrow) it then follows the dendritic time scale down to rest, maintaining a slight undershoot. Shown is an average of 10 trials; data were taken at room temperature. C,[Ca2+]i kinetics in a spine and parent dendrite after a back-propagating action potential at 37°C. [Ca2+]i amplitudes in the spine (solid line) reach a level 2.5 times higher than the dendrite (stippled line). The dendrite decays with a single-exponential time scale (τ = 552 msec), while the spine decays with an initial fast decay (τf = 93 msec) to near-dendritic levels and then follows the dendritic time scale to basal levels. During the slow decay the spine maintains [Ca2+]i levels lower than the dendrite (undershoot). Shown is an average of five trials. The traces inB and C are taken at a resolution of 12.5 msec/point and filtered with a seven point smoothing kernel.
Two-photon imaging and photobleaching. CA1 pyramidal neurons were filled with calcium indicators through the somatic pipette. We waited >30 min after break-in before imaging to ensure that dendrites were fully loaded with the indicator. Imaging was done with a custom-made two-photon laser scanning microscope consisting of a modified Fluoview (Olympus, Melville, NY) confocal microscope with a Ti/sapphire laser providing 130 fs pulses at 75 MHz at wavelengths of 740–850 nm (Mira, Coherent, Santa Clara, CA) pumped by a solid-state source (Verdi, Coherent). A 60×, 0.9 numerical aperture water immersion objective (IR1, Olympus) was used. Fluorescence was detected with photo multiplier tubes (PMTs; HC125-02, Hamamatsu, Hamamatsu City, Japan) in external whole-area detection mode, and images were acquired and analyzed with Fluoview (Olympus) software. Images of spines were acquired at the highest digital zoom (10×), resulting in a nominal spatial resolution of 20 pixels/μm and at a time resolution of 12.5 msec per point in line scan mode. Faster scans with resolution of 2.5 msec were taken in several cases. A Pockel cell (model 350-50; Con Optics, Danbury, CT) was used to create brief (3–35 msec) pulses of high-intensity illumination for measurements of diffusional time scales across the spine neck and to block the beam during times in the scan when data were not being collected. Spines were chosen from all areas of the cell in a 200 μm radius from the soma—including spines on basal, apical, and oblique dendrites.
Analysis. Fluorescence signals were analyzed with Igor (Wavemetrics, Lake Oswego, OR). Fluorescence intensity was corrected for background fluorescence measured in an area adjacent to the structures and did not vary significantly during the course of an experiment. To account for the saturation of the dye at higher calcium levels, we converted fluorescence into an estimated [Ca2+]i by assuming that the concentration of indicator dye in the region of interest in the cell was equal to the concentration in the pipette, that the KD of calcium green was 190 nm (Haugland, 1996), that the relative fluorescence excitation of calcium-bound calcium green to calcium-free calcium green was 9:1 (Haugland, 1996), and that the CA1 hippocampal neurons maintained an equilibrium calcium concentration of 75 nm (Helmchen et al., 1996). With these assumptions, fluorescence signals F(t) with time scales of a few milliseconds or more can be converted into free calcium concentrations as follows (see , Eq. 8):
| Equation 9 |
where x(t) is the free calcium concentration divided by the KD of calcium green (190 nm), andF0 is the fluorescence signal at a time before the action potential was fired. By compensating for the saturation of the fluorescent indicator, this transformation allows us to compare directly the measurements of fluorescence transients with the behavior of calcium in our mathematical model. The transformation did not change any of the relative values or conclusions presented in this paper. Specifically, curve fits of the transformed data were similar to those from untransformed data in that both showed double-exponential behavior and the presence of undershoots or overshoots. For the analysis of the effect of CPA on the calcium transients, fits were performed on the untransformed fluorescent traces to avoid errors introduced by differences in basal [Ca2+]i between treated and untreated spines. Data from cells that were suspected of being unhealthy and therefore having high resting [Ca2+]i were not used; neurons that seemed unusually bright or had low resting potentials or unusual morphologies (e.g., beaded dendrites) were assumed to be unhealthy.
The corrected fluorescence intensity decays were fit to single or multiple exponentials by using the Igor curve-fitting function, and amplitudes, τ values, and χ2 values of the fits were registered. To facilitate kinetic comparison between different data sets and the mathematical model, we zeroed the time axis at the first peak spine [Ca2+]i reached after the stimulation. The resting [Ca2+]i was fixed during the fit to the [Ca2+]i maintained before the action potential was fired. For spines, double-exponential fits were obtained both with and without fixing the second exponential to the τ obtained for the parent dendrite. Because the dendritic τ and the spine slow τ were similar when the slow τ was fit alone without the fast decay (see Results and Fig. 4B), values obtained in the latter fits were used for the mathematical model (see , Eq. 2). Spines were considered to have a double-exponential decay when the χ2value for the double-exponential fit was significantly smaller than for the single-exponential fit. In dendrites, τ values for double- and single-exponential fits were comparable. Data were averaged when possible. Because little difference in decay kinetics was seen between trials in which one or two action potentials were fired in quick succession, data from these two paradigms were pooled for analysis. For systematic analysis of [Ca2+]i at the breakpoint, breakpoints were determined as occurring after three τ values of the initial fast decay in the spine. This value was chosen arbitrarily because it reflected quite accurately the breakpoint chosen by visual inspection. Measured values are given as mean ± SE. The mathematical model (see ) was implemented numerically in Matlab (Math Works, Natick, MA) and was based on the single compartment model presented in .
Fig. 4.

Correlation between the breakpoint and slow component of spine decay kinetics and dendritic [Ca2+]i kinetics. A,[Ca2+]i in spines plotted against [Ca2+]i from adjacent dendritic shafts at the breakpoint. Note the strong correlation between the two variables (r = 0.83; regression ttest; p < 0.0001). B, Correlation between the slow τ of spine and the dendritic τ (r = 0.92; regression t test;p < 0.001). These data indicate that the breakpoint in the spine represents the point of diffusional equilibrium between spine and dendrite, and the slow decay in the spine after the breakpoint has occurred is driven by diffusion from the dendrite.
To account for deviations in laser power caused by the Pockel cell, we divided bleaching traces by the square of the normalized laser power (recorded by a photodiode placed after the Pockel cell and digitized by Superscope) after background subtraction. Then multiple trials were averaged in Igor, and single and double exponentials were fit to the recovery part of the curve. To obtain absolute values for the χ2v (defined as χ2 divided by the number of degrees of freedom), we provided a weighting function containing approximate SDs estimated for the data during the fits. The SDs were calculated from the data points obtained at the start of the traces before the bleach occurred and were assumed to be constant during the trace. τ values and χ2 values of the fits were registered.
RESULTS
Different decay kinetics in spines and dendrites after action potential-induced calcium influx
We studied the dynamics of calcium transients in 55 spines and their adjacent dendrites from 39 CA1 pyramidal neurons in hippocampal slices from 23 juvenile (P13–P18) animals. Neurons were filled with a relatively small concentration of a slowly diffusing dye, calcium green-1 (200 μm; Fig.1A) to minimize the effect of the excess external buffer on the measured calcium kinetics. Neurons then were imaged with a custom-built two-photon microscope, using line scans positioned to intersect the head of the spine and its adjacent dendritic shaft. To induce reproducible calcium accumulations that approximate Δ functions, we took advantage of the fact that back-propagating action potentials (APs) produce reliable, brief, calcium accumulations in spines and dendrites (Yuste and Denk, 1995).
We chose to do most of our experiments at room temperature for two reasons. First, at room temperature the decays are slowed down compared with those at 37°C, allowing the use of longer time bins (12.5 msec) and hence improving the signal-to-noise ratio of the observations. Second, APs back-propagate more reliably at room temperature; therefore, more averages can be obtained from each spine, and spines further from the soma can be examined. Even at room temperature the onset kinetics of AP-induced calcium accumulations in spines were too fast to resolve with a time resolution of 2.5 msec/scan. Because the AP-induced calcium influx is attributable to voltage-sensitive calcium channels (VSCCs) located on the spine membrane (Yuste and Denk, 1995;Yuste et al., 1999) whereas most of the fluorescent signal originates from the cytoplasm of the spine, the diffusional equilibration time for calcium in a spine must be faster than 2.5 msec. Therefore, for the purpose of this study we considered the spine a well mixed calcium compartment.
After AP activation the peak [Ca2+]i in spines was generally larger than that observed in the nearby dendrite, with an average ratio of the spine to the dendritic peak [Ca2+]i amplitude of 2.1 (n = 38; Fig. 1B). The decay of [Ca2+]i in the dendrite followed a single exponential with a slow time course (τ dendrite = τd = 1261 ± 191 msec;n = 34). The calcium in the spine, however, followed double-exponential kinetics; after an initial fast decay (τ fast = τf = 141 ± 29 msec; n = 22), the spine [Ca2+]i approached dendritic levels and a “breakpoint” (i.e., a distinct notch in the [Ca2+]i decay or in its derivative) occurred in which the calcium decay assumed a slower time course (arrow in Fig. 1B; τ slow = τsl = 1367 ± 178 msec;n = 22), following the concentration in the dendrite down to resting levels. During the slow decay phase the spine maintained [Ca2+]iamplitudes either lower (“undershoot,” 50% of spines), higher (“overshoot,” 42% of spines), or similar (8% of spines) to those in the parent dendrite. These results showed that spines have heterogeneous decay kinetics, which can be captured by a double-exponential function.
To inquire whether double-exponential kinetics occurred at more physiological temperatures, we measured spine calcium dynamics at 37°C. After AP activation at 37°C the peak [Ca2+]i in spines was again generally larger than that observed in the nearby dendrite, with an average ratio of the spine to the dendritic peak [Ca2+]i amplitude of 3.3 (n = 11; Fig. 1C). The decay of [Ca2+]i in dendrites was also single exponential although faster than that observed at room temperature (τ dendrite = τd = 621 ± 117 msec; n = 8). The [Ca2+]ikinetics in spines also showed the characteristic double-exponential decay with a faster initial decay (τ fast = τf = 81 ± 13 msec; n = 11), followed by a slower decay (τ slow = τsl = 780 ± 150 msec; n = 8). [Ca2+]iamplitudes in the spine relative to the dendrite during the slow decay phase were also variable, with 45% of the spines maintaining an undershoot, 36% maintaining an overshoot, and 18% following dendritic amplitudes. Therefore, the double-exponential decays and heterogeneity in spine kinetics found at room temperature also existed at 37°C.
Mechanisms of the double-exponential [Ca2+]i decays in spines
For the rest of the study we sought to understand the mechanisms underlying the peculiar double-exponential spine [Ca2+]i decay kinetics. We reasoned that a number of possible scenarios could account for the effect: (1) saturation of endogenous or exogenous buffers, (2) binding kinetics of an endogenous buffer, (3) diffusion of endogenous or exogenous buffers, (4) buffered calcium diffusion across the spine neck, and (5) active extrusion mechanisms, i.e., calcium pumps. We considered each scenario individually.
Saturation of exogenous or endogenous buffers
Calcium buffers are efficient at binding calcium within a certain range of [Ca2+]i. If the [Ca2+]i is elevated (compared with the KD), the buffers will saturate and bind calcium less efficiently. This free calcium will dissipate faster (because of relatively unbuffered extrusion or diffusion) until it reaches a concentration at which the buffer is again efficient at binding it. Further calcium dissipation will be slowed by the more efficient binding of the buffer, and this will result in a change in the [Ca2+]i decay kinetics. This effect is proportional to the buffer capacity (κ), which is maximal at zero saturation (Neher and Augustine, 1992; Neher, 1998) (see ). Calcium kinetics explained by buffer saturation have been measured in chromaffin cells (Neher and Augustine, 1992) and crayfish presynaptic terminals (Tank et al., 1995).
We tested whether the observed double-exponential spine kinetics were attributable to buffer saturation by analyzing the dependency of the breakpoint with the spine [Ca2+]i at which it occurs. We ruled out that the breakpoint was attributable to saturation of the exogenous buffer because no breakpoint was observed in dendritic decays even when dendritic [Ca2+]i attains similar levels to those at which the breakpoint occurs in the spine (Fig. 1).
Could endogenous buffer saturation produce the breakpoint? Little is known about the kinetics of the intrinsic buffers in neurons. If the breakpoint is indeed attributable to intrinsic buffer saturation, the buffer in the spine would be significantly different from that in the dendrite where breakpoints do not occur. However, the spine breakpoints occurred over a wide range of calcium concentration (90–200 nm; Fig.2A,B), which made it unlikely that they corresponded to the saturation of an intrinsic buffer present exclusively in the spine unless there were significantly different calcium-buffering properties in different spines. To test this possibility, we studied the change in the amplitude at the breakpoint during loading with calcium green at a single spine. The presence of progressively more exogenous buffer lowered the peak [Ca2+]i reached (because more calcium was bound to the indicator; see Neher and Augustine, 1992; Helmchen et al., 1996) but also lowered the [Ca2+]i at which the breakpoint occurred (Fig. 2C). Therefore, in a single spine we observed shifting of the breakpoint [Ca2+]i by changing its peak [Ca2+]i. These data ruled out the contribution of buffer saturation to the double-exponential spine decay kinetics, because saturation would occur at a constant [Ca2+]i .
Fig. 2.

Dependence of the breakpoint of spine decay kinetics on peak [Ca2+]i.A, [Ca2+]i decay kinetics in spine and dendrite, showing the double- and single-exponential fits to the decay. Note how at ∼150 nm[Ca2+]i the spine switches from a fast to a slow time scale (breakpoint marked with grid lines). The trace was filtered with a three point smoothing kernel; average of six traces. B, Data from a different spine, showing a breakpoint (grid lines) at 90 nm [Ca2+]i. Data were filtered with a three point smoothing kernel; average of eight traces.C, The [Ca2+]i at which the breakpoint occurs can change within a single spine. Shown is [Ca2+]i at breakpoint (taken as [Ca2+]i at three initial fast time constants) plotted against peak [Ca2+]i in a single spine during loading with extrinsic buffer. If intrinsic buffer saturation is responsible for the double-exponential kinetics observed in spines, the [Ca2+]i at the point of the breakpoint should stay constant and correspond to theKD of the intrinsic buffer. Therefore, these data rule out that the double-exponential decay kinetics observed in spines is attributable to buffer saturation.
Slow kinetics of endogenous buffers
An alternative possibility is that the double-exponential spine decay kinetics reflect the kinetics of the endogenous or exogenous calcium buffers with a slow on-rate. The endogenous buffer will have an effective on-time dictated by the [Ca2+]i and the on-rate of the buffer. Over time scales that are short compared with the effective on-time of the putative slow buffer, the [Ca2+]i generated by an AP could dissipate by binding to the buffer as well as via extrusion or diffusion. The [Ca2+]i decay caused by extrusion or diffusion would be relatively faster because of the less effective buffering properties of the spine. Over time scales that are long compared with the effective on-time of the putative slow buffer, the loss pathway that is attributable to uptake by the equilibrating endogenous buffer would be removed (it has reached equilibrium), and the [Ca2+]i could dissipate by extrusion or diffusion. The [Ca2+]i decay caused by extrusion or diffusion then would be relatively slower because of the more effective buffering properties of the spine. This could generate an apparent double exponential in observed [Ca2+]i decay kinetics. For our experiments, given that calcium green-1 was the only exogenous calcium buffer and its on-rate is fast (7.5 × 10⁸m−1/sec; Naraghi, 1997), this effect can be ruled out. Nevertheless, our observed [Ca2+]i kinetics could still be attributable to the slow on-rate of an endogenous calcium buffer. Although we initially entertained this theoretical possibility, we later considered this effect unlikely given the dependency of the breakpoint on dendritic [Ca2+]i (see Buffered Calcium Diffusion across the Spine Neck).
Diffusion of exogenous or endogenous buffers
We also considered the possibility that the decay kinetics in spines were partly or mostly attributable to the diffusion of a calcium buffer. The presence of a sufficiently mobile buffer paradoxically could enhance calcium diffusion, as has been described with fura-2 (Gabso et al., 1997). Because all of our data were taken after extensive (>30 min) whole-cell recording, during which calcium green had equilibrated between pipette and spine, we reasoned that any remaining endogenous calcium buffer was less mobile than calcium green. Therefore, by determining whether calcium green was mobile enough to contribute significantly to the observed spine decay kinetics, we also can evaluate whether the remaining endogenous buffer could contribute to these kinetics. To explore this possibility quantitatively, we used photobleaching experiments to measure the diffusional mobility of calcium green in spines and compared it with that of fura-2 (Fig.3). In these experiments we positioned the line scan to intersect the spine head, but not the dendrite, and used brief (one to three ∼300 μsec bleaching episodes in the spine in line scan mode, using 3–35 msec line scans), 10-fold increases in laser intensity to bleach calcium green effectively in a spine, but not in its parent dendrite. We then used a lower laser intensity to monitor the fluorescence in the bleached spine and measured the time course of the diffusion of the unbleached fluorophore back from the dendrite (Svoboda et al., 1996).
Fig. 3.
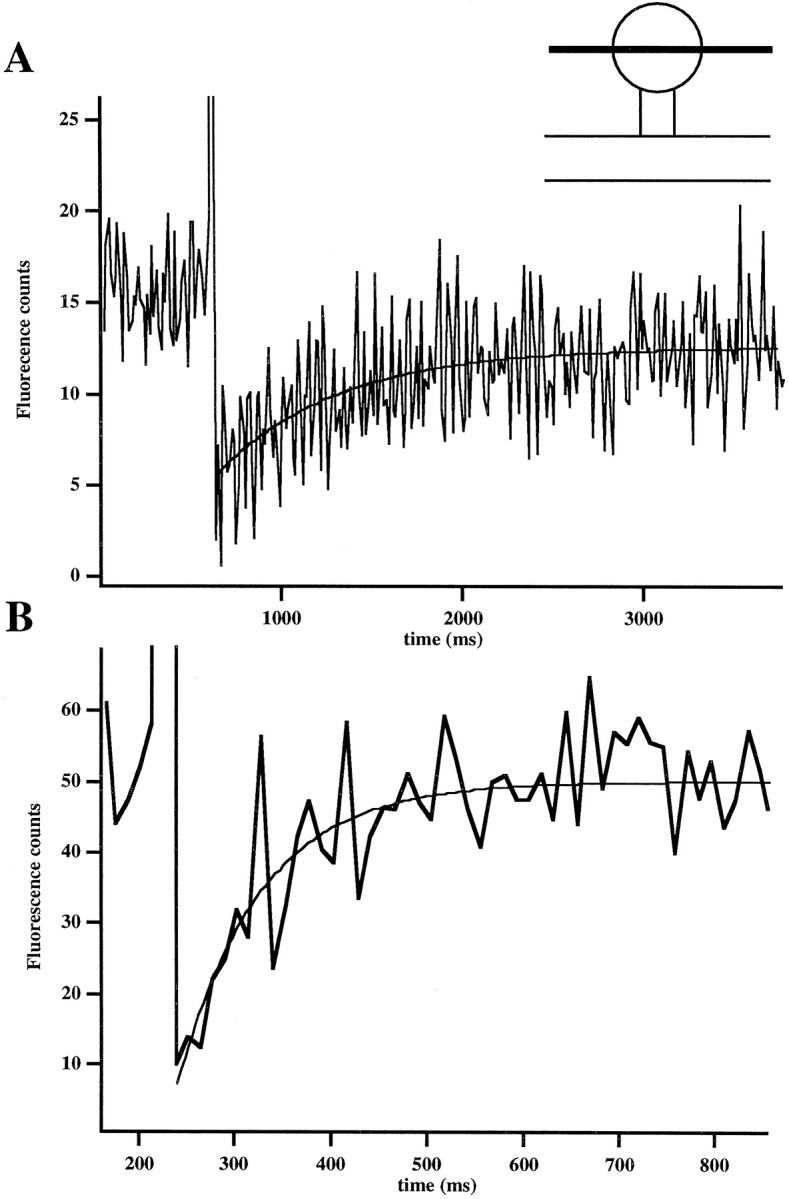
Slow diffusion of calcium green. A,Measurement of calcium green diffusional recovery time in a spine. The graph shows the fluorescence intensity kinetics in a spine. The high-intensity laser pulse (800 μsec exposure produced with 20 msec increase in intensity in line scan mode) produces a sharp decrease in the fluorescence intensity. Immediately afterward, unbleached fluorophore diffuses in from the dendrite, causing a rise in the fluorescence intensity. The recovery curve of the diffusion of unbleached fluorophore was fit to a single exponential (τ = 671 msec; average of five traces, unfiltered). Inset shows the positioning of the line scan used to bleach the dye in the spine, but not the dendrite. B, Measurement of fura-2 diffusional recovery in a spine. The recovery curve of the diffusion of unbleached fluorophore was fit to a single exponential (τ = 87 msec; average of 10 traces, unfiltered).
After photobleaching, we obtained recovery spine kinetics that were well fit with a single exponential, with a τ of ∼800 msec (818 ± 171 msec; n = 23; Fig. 3A). Most of the recovery curves did not return to baseline, suggesting that there is an immobile fraction of calcium green (where immobile is defined as being much slower than our acquisition time of several seconds). To inquire whether the single-exponential fits were significant, we fit traces with both single and double exponentials and χ2 where recorded. Single exponentials were found to be reasonable fits [0.5 < χ2v < 1.5, with 16 traces having a χ2v of ∼1, where χ2v takes into account the number of fitting parameters (Bevington and Robinson, 1992)]. In addition, the ratio of the χ2v of the single-exponential fit to that of the double-exponential fit was 0.99 ± 0.003 (n = 23), suggesting that significant differences do not exist between the two fits and can be accounted for by the increase in the number of fitting parameters. These results suggest that a highly mobile fraction of calcium green does not exist and that the diffusion of calcium green is indeed slow.
It is possible that our bleaching pulses were depleting the indicator in the parent dendrite. To test this possibility, we also monitored the parent dendrite in eight experiments. In all cases the bleaching pulse was shown to be contained in the spine and did not cause any detectable depletion of unbleached dye in the dendrite. In support of this, this changing the duration of the bleaching pulse in the spine did not change significantly the measured recovery time (∼200 μsec: 584 ± 271 msec, n = 2; ∼800 μsec: 850 ± 150 msec, n = 19; ∼1200 μsec: 728 ± 224 msec,n = 2). In addition, experiments with fura-2 under similar conditions yielded recovery curves that were well fit with a single exponential with a time constant of 121 ± 30 msec (n = 16; Fig. 3B). These recovery curves returned to baseline. Taken together, these results showed that our measurements of the slow time scales of recovery and the existence of an immobile fraction are unique to calcium green and do not arise because of an artifact of the technique or because of photo-induced biological changes in spine neck structure.
We conclude from these experiments that over the time scales of the fast initial component of the spine decay kinetics (∼140 msec), calcium green is effectively immobile. Thus we reasoned that the breakpoint in the spine calcium decay kinetics could not be explained by diffusion of an endogenous or exogenous calcium buffer, although there still can be a contribution of calcium green to the decay kinetics, given the ability of the mobile fraction to enhance calcium diffusion and the ability of the immobile fraction to slow these decays (Neher and Augustine, 1992; Helmchen et al., 1996).
Buffered calcium diffusion across the spine neck
After ruling out the contribution of exogenous or endogenous calcium buffers to the breakpoint in the spine kinetics, we examined the possibility that the double-exponential behavior was attributable to diffusional equilibration of calcium between the spine and dendrite, across the spine neck. To test this, we examined the relationship between the spine and dendrite decay times and the relationship between their respective [Ca2+]i. If diffusion were indeed responsible for the existence of two distinct time scales in the spine kinetics and the switch between them, the [Ca2+]i at which the spine switches from the fast to the slow time scale (the [Ca2+]i at the breakpoint) should correspond to the point at which the spine and dendrite are in diffusional equilibrium. This predicts that the breakpoint in the spine should happen at a [Ca2+]i very close to that of the dendrite and that the time scale of the subsequent decay be similar in the two compartments. The variability in peak [Ca2+]i from spine to spine and dendrite to dendrite allowed us to study the correlation between the dendrite and spine concentrations at the time of the breakpoint. Indeed, we found that a clear relationship exists between the two [Ca2+]i(Fig. 4A), with a linear regression slope of 0.83 (p < 0.001; regression t test). We reasoned that the value of the slope is <1 because most spines maintain slightly lower [Ca2+]i than the dendrite during the slow decay phase (see below). In addition, the decay time of the dendrite and the slow decay time of the spine showed an almost exact correspondence (Fig. 4B; linear regression 0.92; p < 0.001). This indicates that, during the slow decay, the spine adopts the dendritic time scales attributable to diffusion between the two structures. In other words, the fact that the spine is “aware” of the dendritic [Ca2+]i and time scales strongly argues that calcium diffusion between both compartments shapes spine kinetics. More specifically, these correlations explain both the breakpoint and the second, slower component of the spine kinetics and also rule out a major effect of buffer saturation, slow onset buffer kinetics, or nonlinear extrusion (see below) on the double-exponential decays.
What then determines the fast initial [Ca2+]i decay in spines? This initial component is likely to be physiologically important because of the major role that spine [Ca2+]i plays in synaptic plasticity (Wickens, 1988; Lisman, 1989; Malenka et al., 1989) and to the possible computational role of the “supralinear” [Ca2+]i in spines (Yuste and Denk, 1995; Yuste et al., 1999). Obviously, the diffusional equilibration at the breakpoint indicates that calcium diffusion from the spine to the dendrite could contribute to this initial decay. Because of the presence of both endogenous and exogenous buffers, this diffusion would be buffered. To explore whether buffered calcium diffusion could account for the initial fast decay, we examined decay kinetics in spines that had different morphologies, with variable lengths in their spine necks.
Indeed, we detected a relation between spine calcium kinetics and the length of the spine neck (Fig. 5) (Wilcoxon; p < 0.0623; n = 22). Nevertheless, across all spines we found a large variability in the fast initial kinetics that could not be explained solely by the length of the spine neck or by any other discernible morphological feature of the spine. This suggested that, besides buffered diffusion of calcium, other mechanisms were at play in determining the initial fast decay kinetics in spines.
Fig. 5.
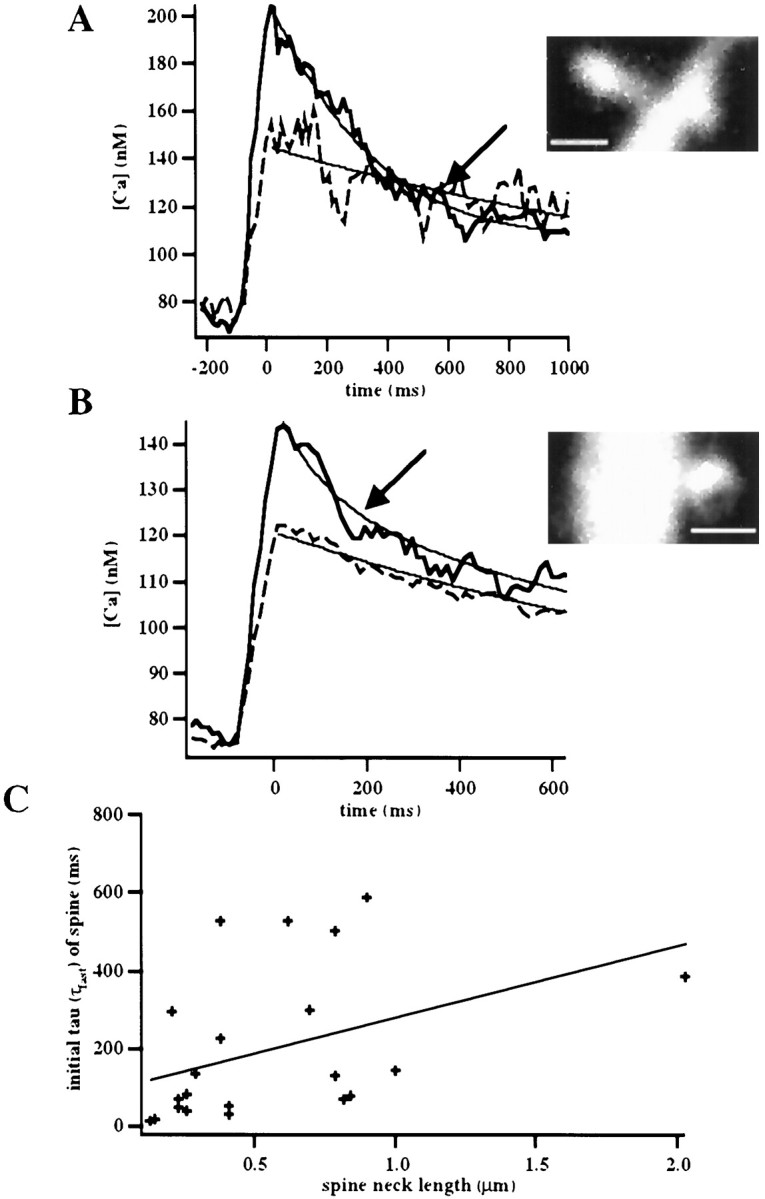
Correlation between spine neck length and initial spine decay kinetics. A,B, Illustrated are how short-necked spines tend to have faster initial decays than longer-necked spines. A shows a spine with a neck length of ∼0.7 μm and τ of 298 msec (average of six trials), whereasB shows a shorter spine with a neck length of 0.25 μm and τ of 37 msec (average of eight trials). Scale bars, 1 μm. Traces were filtered with a seven point smoothing kernel.C, Correlation between initial τ in spines and spine neck length (n = 22; regression ttest; p < 0.06).
Linear and nonlinear calcium extrusion
Because of the encountered variability in spine decays, we considered the hypothesis that extrusion mechanisms, intrinsic to the spine, contribute to the spine decay kinetics. As explained, we noticed that most spines had shown a clear “undershoot” in the slow decay phase, where the spine [Ca2+]i maintained levels of ∼90% of dendritic levels (see Fig.1B,C). The simplest interpretation of this undershoot is that spine extrusion mechanisms are lowering the [Ca2+]i below the dendritic [Ca2+]i. and, after the crossover point, calcium would flow from the dendrite into the spine. This implies that spines have intrinsic calcium extrusion mechanisms.
Extrusion mechanisms could be linear or nonlinear, and there could be a combination of them in the spines. In fact, the double-exponential kinetics could be explained independently of the dendrite by introducing a fast extrusion that inactivated to account for the first fast decay phase, whereas the slow decay would occur after the fast extrusion had switched off and a slower extrusion would bring [Ca2+]i levels down to baseline. An alternate scenario could include extrusion that was nonlinear in [Ca2+]i so that extrusion was faster at higher [Ca2+]i and slower at lower [Ca2+]i. Both these scenarios are unlikely, however, because we observe double-exponential behavior even when the initial [Ca2+]i is low (see Fig. 2), and any extrusion pathways activated at high [Ca]i should not be operational. In addition, nonlinear extrusion mechanisms also are ruled out effectively by the correlations presented in Figure 4.
We therefore studied whether a linear extrusion mechanism contributed to the initial fast decay. Calcium extrusion could be implemented by the Na/Ca exchanger (Philipson, 1999), plasma-membrane calcium pumps, SERCA, and mitochondria calcium uniporters (for review, see Guerini and Carafoli, 1999). Although all of these pathways are thought to exist in neurons, in a previous study of calcium clearance in dendrites from pyramidal neurons the major pathway for extrusion was found to be the SERCA pump (Markram et al., 1995). Because of this, we focused on testing the involvement of SERCA pumps by using the specific blocker CPA (15–30 μm) and measuring the spine and dendrite calcium kinetics in the presence and the absence of the blocker. We observed an increase of basal fluorescence in spines of ∼35% after CPA treatment. The rise in basal calcium levels is consistent with the hypothesis that we have disturbed an important pathway of calcium removal from the cytoplasm. Because CPA altered the resting [Ca2+]i of the neuron, we fit the fluorescent transients rather than the transformed [Ca2+]i traces in which the [Ca2+]iat rest is assumed to stay constant.
In agreement with Markram and colleagues (1995), CPA significantly and reversibly slowed the dendritic calcium decays (Fig.6A; 715 ± 200 msec vs 1670 ± 319 msec; n = 18; Wilcoxon;p < 0.001), suggesting that it plays a predominant role in the clearance of calcium from the dendritic shaft. Also, in 11 of 13 spines CPA significantly lengthened the initial fast spine decay (Fig. 6B; 118 ± 43 msec vs 611 ± 184 msec; n = 13; Wilcoxon; p < 0.01), whereas the slower decay phase followed the slower dendritic kinetics. This suggests that the effect of CPA on the initial fast calcium decay kinetics in spines is mediated by SERCA pumps endogenous to the spine. Nonetheless, the extent to which the fast decay was lengthened varied across the spines that were studied. More experiments (including pharmacological treatment with different extrusion blockers and careful correlation with more detailed morphological aspects by using electron microscopy or numerical deconvolution of the two-photon images) will be required to determine whether spines that are affected less by CPA treatment have alternate extrusion mechanisms or instead have high diffusional coupling to the dendrite that dominates the fast decay.
Fig. 6.
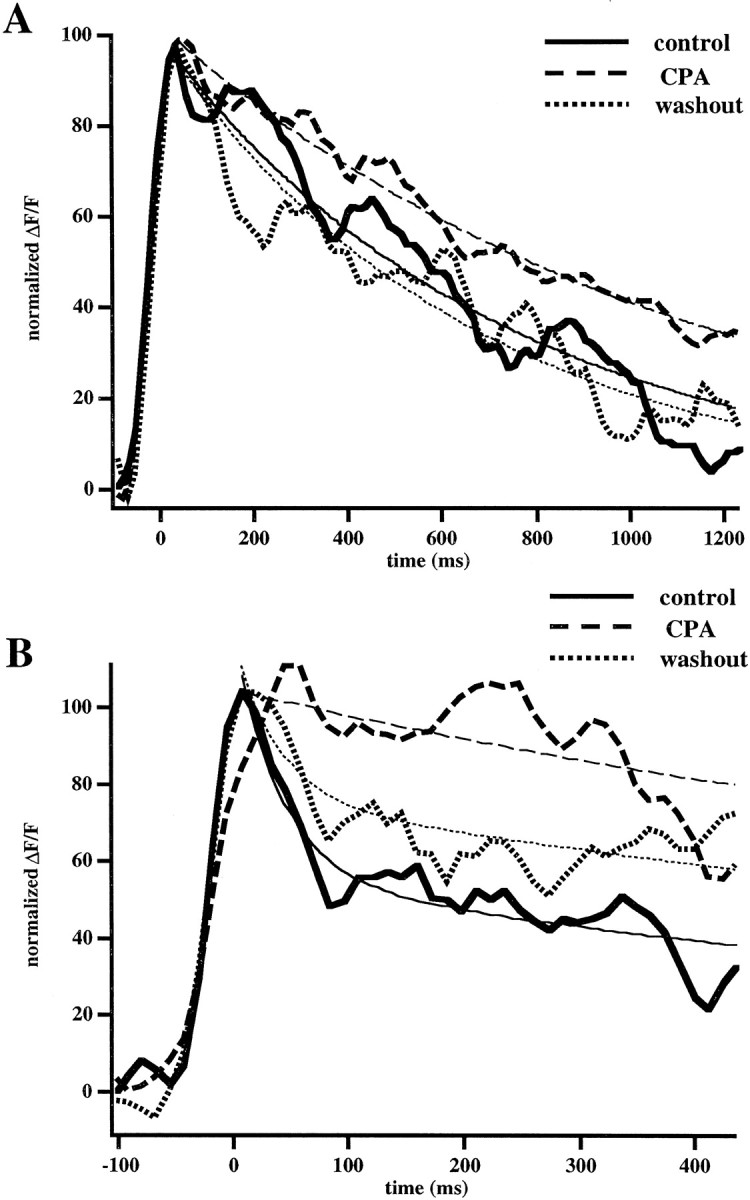
SERCA blockers affect the dendritic decay and the initial spine decay phase. A, CPA lengthens the decay kinetics of dendrites. The graph shows the [Ca2+]i decay kinetics in a dendrite before and after the application of CPA (30 μm). Thethin lines represent single-exponential fits to the decay kinetics. The dendritic τ (τd) was 700 msec in control conditions and 1100 msec once CPA was applied. After a washing with aCSF, the dendritic decay recovered to 680 msec.B, CPA also lengthens the initial fast decay (τf) in spines. Shown is [Ca2+]i decay kinetics in a spine before and after the application of CPA (30 μm). Thethin solid lines represent a double-exponential fit to the initial decay kinetics. This effect was reversible with long (>30 min) washes with normal aCSF. Traces were filtered with a three point smoothing kernel and normalized to account for differences in the amplitudes observed between trials.
We conclude from these data that SERCA pumps exist in spines and, along with diffusion across the spine neck and possibly other extrusion mechanisms, contribute to the initial decay kinetics. Our data agree with previous evidence indicating that internal release pathways, presumably refilled by SERCA pumps, are operative in hippocampal spines (Korkotian and Segal, 1998; Emptage et al., 1999).
Estimation of the relative contributions of the buffered diffusion versus calcium extrusion by using the undershoot and a mathematical model
Having established that both buffered calcium diffusion and spine calcium pumps play a role to the initial calcium decay in spines, we sought to examine the contribution of each of these two pathways to the process in different spines. To do so, we analyzed the undershoot (see Fig. 1B), because, if diffusional equilibration were fast and dominant, no undershoot should be observed. Therefore, the presence of an undershoot implies that calcium pumps dominate the decay kinetics.
To estimate quantitatively the magnitude of the contribution of calcium extrusion and buffered calcium diffusion to the initial component, we used the relative [Ca2+]i levels maintained by the spine and dendrite during the slow decay phase, along with measurements of initial fast decays and dendritic decays, and fit the numbers to an analytical model of the spine calcium kinetics (Fig.7). The mathematical basis of this model is presented in . In this model the fast time scale that is observed is a combination of two calcium removal systems working in parallel—one is the calcium pumps in the spine that clear calcium from the spine cytoplasm (γs), and the other is buffered diffusion of calcium across the spine neck into the dendrite (γn). Around the breakpoint in the spine, diffusional equilibrium between the spine and dendrite has occurred. At this time the larger volume of the dendrite forces the spine to maintain [Ca2+]iclose to dendritic levels. The time scale of this slow decay in the dendrite and spine is determined solely by the rate of calcium pumping out of the dendritic cytoplasm (γd) (Fig.7A).
Fig. 7.
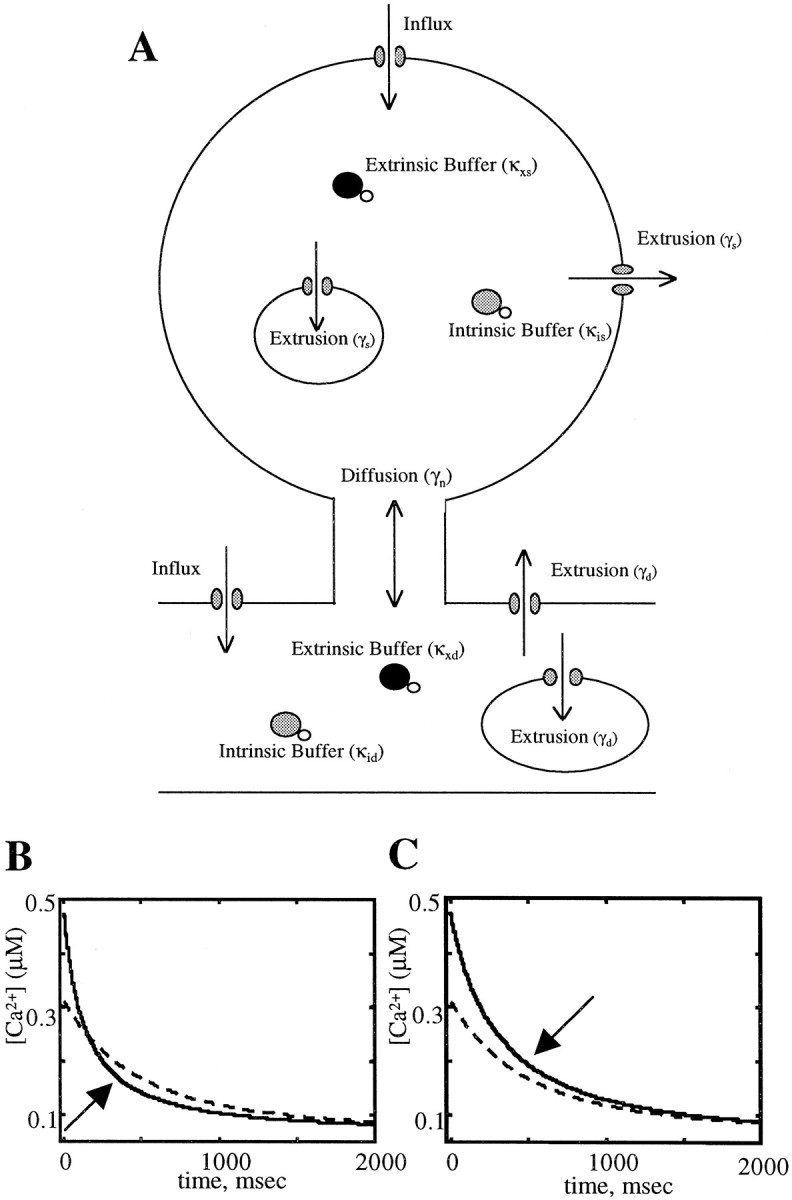
Model of calcium dynamics in spine and dendrite.A, Drawing of the components of our mathematical model of the spine and adjacent dendrite. Influx occurs in both spine and dendrite through voltage-sensitive calcium channels located on the plasma membrane. Efflux in both spine (γs) and dendrite (γD) is mediated by plasma membrane pumps and exchangers that remove calcium into extracellular space and pumps that sequester calcium to cytoplasmic organelles. With the assumption that the buffering capacities are independent of calcium concentration, the resultant differential equation yields the exact solution given by Equation 6. Equation 5 was solved numerically, allowing the buffering capacities to vary with calcium concentration, keeping the diffusion across the spine neck constant, and changing the relative rates of extrusion between the spine and dendrite. B, Example of a numerical simulation when the rate of pumping in the spine is greater than in the dendrite. Note how the spine undershoots the dendrite during the slow decay phase. Breakpoints are marked witharrows. C, Simulation when the rate of pumping is greater in the dendrite than in the spine under conditions of equal diffusion as in B. Note how the spine overshoots the dendrite. Parameters used in the model: Dendrite radius, 0.2 μm; dendrite length, 10 μm; spine radius, 0.3 μm;KD of calcium green, 189 nm;KD of intrinsic buffer, 140 nm; calcium green concentration, 200 μm; intrinsic buffer concentration, 72.66 μm; clearance rate of dendrite, 0.88 μm/μm−2 per msec; clearance rate of spine in B, 0.18 μm/μm−2 per msec; clearance rate of spine in C, 0.06 μm/μm−2 per msec.
The model easily explained the observed undershoot. If the effective rate of pumping in the spine (1/τs) is faster than the effective rate of pumping in the dendrite (1/τd), then the spine will maintain levels lower than the dendrite during the equilibrium phase (slow decay; Fig.7B). Conversely, if 1/τs is slower than 1/τd, the spine will maintain levels higher than the dendrite (Fig. 7C). Intuitively, faster pumping in the spine will mean that dynamic equilibrium will be established with calcium flowing from the dendrite to the spine, whereas slower spine extrusion will mean that dynamic equilibrium will be established with calcium flowing from spine to dendrite. We can see this mathematically by using Equation 6 from and taking the limit of time much greater than τs or τn (time constant of diffusion across the spine neck) to ensure that we are looking after the breakpoint has occurred. This leads to the following analytical expression for the amplitude of the calcium change in the spine:
| Equation 10 |
We then can compare the amplitudes of the spine and dendrite:
| Equation 11 |
Indeed, the relative values of τdand τs determine whether the spine will overshoot or undershoot the dendrite, whereas the value of τn influences the magnitude of the difference between the two compartments during the slow decay phase.
Heterogeneity of [Ca2+]i decay mechanism in spines: “pumpers” and “diffusers”
After this quantitative understanding of the contributions of calcium pumps and diffusion to the decay kinetics for the average spine, we examined the responses of individual spines and thus explored whether there were different populations of spines with respect to their decay mechanisms. This rationale was motivated by our previous finding that the influx pathways of calcium into CA1 spines were heterogeneous, indicating the existence of different functional types of spines (Yuste et al., 1999).
Indeed, we found that spine-to-spine variation in decay kinetics was large both at room temperature and at 37°C. We recorded initial decay times as fast as ∼10 msec (Fig.8A) and as slow as ∼300 msec (Fig. 8B). Also, although many spines showed an undershoot during the slow decay phase (see Fig.1B, n = 13, and 1C, n = 5), some spines maintained calcium levels higher than the nearby dendrites (an overshoot; Fig. 8C;n = 11) or had no discernible difference from the dendrite (Fig. 8D; n = 2). According to the mathematical model presented above, these behaviors can be explained by inferring different extrusion rates in different spines. Some spines seem to have high extrusion rates as compared with the dendrite (“pumpers”; see Fig. 1B,C), whereas others have relatively low extrusion rates or may not have calcium pumps (Fig. 8C). Still others have high diffusional coupling minimizing the differences in amplitude between spine and dendrite during the slow decay phase despite differences in pumping rate (“diffusers”; Fig. 8D).
Fig. 8.

Heterogeneity of decay phase calcium kinetics.Top panels show examples of [Ca2+]i decay kinetics in spines with different initial fast τ values. A,[Ca2+]i decay kinetics in a spine with initial τ is fast (20 msec; average of five trials).B, Example of a spine for which the initial τ is 280 msec (average of six trials). The middle panels show that spines also differ in their behaviors during the slow decay phase.C, Shown is a spine that overshoots the dendrite during the slow decay phase, suggesting that pumping rates are faster in the dendrite than in the spine (average of 10 trials). D, The spine maintains levels similar to its parent dendrite, suggesting that diffusion is fast and brings the two compartments into equilibrium (diffuser; average of eight trials). Traces were filtered with a seven point smoothing kernel. The bottom panels show that spines that exhibit anomalous behaviors also have slow decays, which depend on dendritic kinetics. E,[Ca2+]i decay kinetics in a spine for which the adjacent dendrite did not undergo a significant [Ca2+]i increase after an action potential. Note that the spine has a single-exponential decay that equilibrates with dendritic resting [Ca2+]i levels, with a τ of ∼150 msec—similar to the fast τ in double-exponential spines (average of six trials, filtered with a five point smoothing kernel).F, [Ca2+]i decay kinetics in a spine in which the dendritic [Ca2+]i rose after the action potential but did not decay significantly. The spine still undergoes the initial fast decay but then follows dendritic kinetics by maintaining a new resting [Ca2+]i(average of 10 trials, filtered with a five point smoothing kernel).
We also found cases in which [Ca2+]i in the dendrite did not decay with a single exponential, although even in these cases the spine follows the kinetics of the dendrite. Figure8E shows a spine for which the adjacent dendrite did not undergo a significant [Ca2+]i increase after the action potential. The [Ca2+]i in the spine no longer follows a double-exponential time scale but decays down to resting (and dendritic) levels with a time scale similar to the first fast decays we observed above. We speculate that the slower time scale is no longer present because dendritic calcium levels are close to rest. Figure 8F shows the opposite scenario in which the [Ca2+]iin the dendrite plateaus rather than decaying after the action potential. Notice that the spine maintains its first fast exponential decay before coming to rest at the new basal level of the dendrite. Again, the close correlation between spine and dendritic amplitudes and time scales despite very different behaviors in the dendrite and different starting [Ca2+]i amplitudes in both spines and dendrites strongly suggests that there is significant communication between the two compartments. It is hard to imagine how buffers and pumps in the spine could be tuned so exquisitely to the behavior of the dendrite to follow its behavior this closely. This further supports the role of buffered calcium diffusion in shaping decay kinetics and argues against hypotheses such as buffer saturation, slow kinetics of an intrinsic buffer, or nonlinear extrusion.
Taken together, our data indicate that the mechanisms underlying the decay kinetics differ from spine to spine. Whereas in some spines the calcium pumps dominate, in other spines the diffusion of calcium plays a major role. The extrusion and diffusion rates also determine the [Ca2+]i maintained during the slow decay phase and therefore play an important role in the integrated [Ca2+]iseen by the spine.
Extrapolation of the kinetic parameters to physiological conditions
We finally wondered what would be the relative contributions of buffered extrusion and diffusion under physiological temperatures with no exogenous buffer. Therefore, we used the model to estimate the time scales τd (dendritic extrusion), τs (spine extrusion), and τn (diffusion across spine neck) in those conditions. At room temperature our experimental observations with 200 μm calcium green (n = 25) suggest that τd ∼1260 msec, τs∼282 msec, and τn ∼400 msec [τf ∼((1/τn) + (1/τs))−1 ∼171 msec]. At 37°C (n = 11) we measure τd ∼620 msec, τs∼175 msec, and τn ∼95 msec.
Assuming that dendrites and spines have a similar buffering capacity, we can use a buffer capacity of ∼150 measured for the proximal apical dendrite (Helmchen et al., 1996) and tertiary branches of the CA1 dendritic tree (R. Yuste, W. Denk, and D. W. Tank, unpublished observation) to estimate τs, τn, and τd in the absence of calcium green. Taking the buffering capacity of 200 μm calcium green to be 420 (see ), we extrapolate that, in the absence of the dye, τd∼160 msec, τs∼46 msec, and τn∼25 msec at 37°C. Because calcium green is somewhat mobile, τn will be slower in the absence of the mobile buffer. To account for the contribution of the dye to the effective diffusion constant, we approximated τn in the absence of calcium green to be ∼30 msec, assuming all of the buffer is mobile and taking the value of τCaGreen to be 800 msec (see , Eq. 7). Therefore, we expect τn to be between 25 and 30 msec, the lower bound being values obtained if calcium green is immobile whereas the upper bound is calculated assuming that all of the calcium green present diffuses with the time scale of the exponential decay obtained in our bleaching experiments. With the joint effect of both pathways, the fast time constant of the initial decay in the average spine would be ∼20 msec.
DISCUSSION
Dual mechanisms of calcium decay kinetics in spines
In this study we find that in the majority of spines the peak [Ca2+]i after a single action potential is significantly larger than that of the neighboring dendrite and that after a breakpoint the spine assumes dendritic time scales for a slower decay phase down to basal levels. Our main conclusion is that there are two main mechanisms that control the double-exponential decay kinetics of calcium in CA1 spines: (1) active extrusion in the form of calcium pumps that must be present in spines and dendrites and (2) diffusion of calcium across the spine neck. The switch between the two time scales corresponds to the time of calcium equilibration between spine and dendrite, whereas the relative calcium amplitudes during the slow decay phase are determined by the relative extrusion rates of the spine and dendrite. We limited our study to AP-induced calcium accumulations to use them as a tool for introducing a physiologically relevant pulse of calcium into the spine and nearby dendrite. Nevertheless, because of the fast diffusional equilibration of the spine head (<2 msec), we think that our conclusion about the mechanisms of the calcium decays should apply to all forms of calcium accumulations into spines, either via VSCC, NMDA receptors, other calcium-permeable synaptic receptors, or release from internal stores. Our measurements were taken with calcium green, which acts as an exogenous calcium buffer. However, we think that our main conclusions still hold for the situation with no added exogenous buffer, because calcium green and the endogenous calcium buffer diffuse slowly and the diffusion of calcium green contributes to a small extent to the time scale of the fast spine kinetics. As we argue above, extrapolating to an endogenous buffer capacity of 150, the decay kinetics would be significantly faster, and undershoots and overshoots would be more pronounced. Nevertheless, our measurements were done after extensive whole-cell recordings, which could have a major effect in removing or inactivating endogenous calcium buffers. Although calcium buffers are generally thought to have low mobility (Helmchen et al., 1996; Gabso et al., 1997), it remains possible that a mobile calcium buffer removed during the recording could introduce another degree of complexity to the spine calcium kinetics.
Variability in calcium decay kinetics among spines
Our second major finding is that there are significant differences in calcium decay kinetics between different spines. On the basis of our mathematical model we propose that these different kinetics are a reflection of differences in the balance of decay mechanisms. The initial fast exponential time scale differed by an order of magnitude in our sample. The fast time scale in some spines was driven mostly by fast extrusion (pumpers); in others it was governed mostly by buffered diffusion of calcium through the spine neck into the dendrite (diffusers), and in some both mechanisms contributed equally. The extrusion time scale in the spine relative to that of the parent dendrite also varied significantly across different spines. This relative time scale determines the calcium amplitude relative to the dendritic amplitude maintained during the slow decay phase, resulting in overshoots or undershoots, and may determine the integrated [Ca2+]i seen at the synapse, which may prove important for the stimulation of calcium-dependent processes. It is conceivable that the differences we observe in [Ca2+]idecays correlate with differences in glutamate receptor distribution (Nusser et al., 1998; Yuste et al., 1999), in the distribution of endoplasmic reticulum or spine apparatus (Harris and Stevens, 1989), or differences in calcium release from internal stores (Korkotian and Segal, 1998; Emptage et al., 1999).
Functional regulation of calcium pumps and spine neck length
Our data predict that spines have a dual ability to regulate the time during which they can maintain high [Ca2+]i. The first is the regulation of the number of pumps via either increased lifetime (transcription vs degradation) or anchoring in the spine internal or plasma membranes. The second is the regulation of diffusional time scales via changes in the morphology of the spine neck. It would be interesting to determine whether these two pathways are modulated in concert to achieve faster or slower rates of decay or whether they are antagonistic pathways that act to maintain an equilibrium decay rate.
Although much work has concentrated on the role of calcium influx in synaptic function, the role of calcium extrusion mechanisms is unexplored. Certain forms of LTP are thought to be mediated in part by an increased number of postsynaptic receptors at the synapse, achieved by increased insertion into the membrane or decreased degradation of receptors already present (for review, see Malenka and Nicoll, 1997). It is possible that calcium pumps are regulated in a similar manner also. Indeed, it recently has been shown that the expression of particular isoforms of plasma membrane calcium pumps (PMCAs) is modulated by the influx of calcium during depolarization (Guerini et al., 1999). It is also possible that these pumps are regulated by activity-dependent processes such as phosphorylation to increase or decrease their pumping rates (Wang et al., 1991). The presence or absence of a spine apparatus or its regulation also may influence the extrusion rates in the spines because calcium could be sequestered into the smooth endoplasmic reticulum (Korkotian and Segal, 1998; Emptage et al., 1999). The history of activity at a synapse could determine the loading of the intracellular organelle and therefore affect the function of the SERCA pumps. Indeed, increased expression levels of the SERCA-2 pump downregulate expression of PMCAs and vice versa (Kuo et al., 1997). This suggests that the level of extrusion of calcium from the spine could be controlled actively and that there may be cross-talk between the different extrusion systems.
We show that the rate of diffusion between the spine and dendrite is dependent on the length of the spine neck. In support of this, long-necked spines on cultured hippocampal neurons are less likely than short-necked spines to refill their internal stores with calcium flowing in from the dendrite (Korkotian and Segal, 1998). Spine neck length, but not diameter, has been reported to change between young and adult animals (Harris et al., 1992) and during chemical manipulations that affect synaptic strength (Hosokawa et al., 1995). Consistent with this, persistent decreases in spine neck length and increases in spine neck diameter can occur after tetanic stimulation (Fifkova and Anderson, 1981). Recent reports on the movement or “twitching” of spines (Crick, 1982; Fischer et al., 1998; Dunaevsky et al., 1999) on a minutes time scale provide an alternative mechanism whereby spines constantly can alter the diffusion across their spine necks. Finally, the presence of organelles in or near the spine neck also may alter diffusion rates severely.
Integrated view of calcium compartmentalization in spines
Following theoretical studies (Wickens, 1988; Koch and Zador, 1993), over the last decade imaging experiments have demonstrated that spines constitute chemical compartments, which allow localized changes in [Ca2+]i at an active synapse without spreading to nearby inactive synapses (Guthrie et al., 1991; Müller and Connor, 1991; Yuste and Denk, 1995). Mechanistic studies of the calcium accumulations and decay pathways now permit a more complete understanding of how calcium becomes compartmentalized in spines and of the time scale of that compartmentalization. The compartmentalization can be dissected into a spatial and a temporal component. Thus, the spatial restriction of the compartmentalization is attributable in part to the restriction of the calcium influx through NMDA receptors located on the spine head (Koester and Sakmann, 1998; Yuste et al., 1999) and partly attributable to the morphological features of the spine that hinder calcium diffusion (Korkotian and Segal, 1998; this study). As we show here, the temporal regulation of the compartmentalization is attributable to the kinetics of the spine calcium pumps as well as to the diffusion of calcium through the spine neck. These mechanisms create two different temporal windows of [Ca2+]i at the spine: a fast one with very high [Ca2+]i, dominated by processes intrinsic to the spine, and a slow one of lower [Ca2+]i, dominated by the parent dendrite and thus shared among all spines. With the caveats that we find major differences from spine to spine, our extrapolation to the conditions with no exogenous buffer suggests that the first window lasts ∼20 msec. We therefore would hypothesize that calcium-dependent learning rules specific to individual spines have this temporal constraint, whereas learning rules driven by dendritic [Ca2+]i could operate within a longer temporal window. Because of the differences in [Ca2+]iamplitudes, it is possible that different biochemical process could be activated specifically during each of these two regimes. Our data therefore paint a complicated, yet fascinating, picture of the spine and suggest that the enzymatic mechanisms that read out these different spatiotemporal calcium signals (Miller and Kennedy, 1986) must be sophisticated and probably equally complex .
Buffering capacity
The differential buffering capacity κb of a calcium buffer b is defined as the number of calcium ions bound to that buffer divided by the number of free calcium ions, after a given concentration change (Neher and Augustine, 1992):
| Equation 1 |
where KD is the equilibrium constant of buffer b, [B]T is the total concentration of buffer b (calcium-bound and calcium-free), [Ca]f is the final free calcium concentration, and [Ca]i is the equilibrium free calcium concentration.
Single compartment model of dendrite
If the calcium influx because of an AP is described as a Δ function that elevates the total calcium concentration in the dendrite (free and bound to buffer) by Δ[Ca]Td and the extrusion rate of calcium out of the cytoplasm (γd) scales linearly with calcium concentration, the following equation describes the behavior of free calcium concentration in the dendrite ([Ca]d) after an AP at t = 0 (Helmchen et al., 1996):
| Equation 2 |
where κxd is the extrinsic buffering capacity attributable to the presence of calcium green, κid is the intrinsic buffering capacity of the buffer native to the dendrite, and [Ca]0 is the equilibrium free calcium concentration. This equation has the solution:
| Equation 3 |
where τd = (1 + κxd + κid)/γd andAd = Δ[Ca]Td/(1 + κxd + κid). This behavior has been verified for the proximal apical dendrite of hippocampal and neocortical pyramidal cells (Helmchen et al., 1996).
Single compartment model of the spine
We model the spine as a well mixed compartment with intrinsic buffer capacity κis, extrinsic buffer capacity κxs, and extrusion rate γs connected to the dendrite described above. By assuming that the dendrite is a much larger volume than the spine, we can assume that the free calcium concentration of the dendrite is not affected by flow in or out of the spine. The effective diffusion rate of calcium through the spine neck will be given a characteristic rate constant γn, which we will assume does not vary with calcium concentration over the range of concentrations generated by an AP. The differential equation that governs [Ca]s, the free calcium concentration in the spine, is:
| Equation 4 |
Using Equation 3 to substitute for [Ca]d, we get:
| Equation 5 |
where τd = (1 + κxd + κid)/γd andAd = Δ[Ca]Td/(1 + κxd + κid) are the amplitude and duration of the calcium transient in the dendrite, [Ca]0 is the equilibrium free calcium concentration, and Δ[Ca]d is the initial change in calcium concentration in the dendrite. Assuming that buffering capacities do not vary significantly with calcium concentration, the solution to the differential equation simplifies to:
| Equation 6 |
where τn = (1 + κxs + κis)/γn is the characteristic buffered diffusion time of calcium through the spine neck, As = Δ[Ca]s/(1 + κxs + κis) is the initial amplitude of the free calcium transient in the spine, τs = (1 + κxs + κis)/γs is the characteristic extrusion time of calcium from the spine cytoplasm via calcium pumps, and Δ[Ca]s is the initial change in total calcium concentration in the spine.
Estimating the contribution of mobile calcium indicator
To gain a physical understanding of the effect of mobile calcium green on the decay kinetics of spines without attempting to solve the relevant differential equation numerically, we limit ourselves to the following approximation:
| Equation 7 |
where τn is the observed time scale of diffusion, κi and κxare the buffer capacities of the endogenous and exogenous buffers, respectively, DCa is the diffusion coefficient for calcium in the absence of buffering,Dx is diffusion coefficient of the mobile exogenous buffer, and ε is a term accounting for the geometry of the spine neck (εD = γ). Notice that the first term εDCa/(1 + κI + κx) in the curly brackets represents the fraction of calcium that is not bound to buffer and is therefore free to diffuse with a diffusion coefficient of free calcium (DCa). The second term ε(1 + κx)Dx/(1 + κI + κx) represents the fraction of calcium that is bound to the mobile buffer and therefore diffuses with the diffusion coefficient of the mobile buffer (Dx), and the time scale of diffusion of buffer down the spine neck is equivalent to τx = 1/εDx. As Dx approaches 0, τn approaches the solution derived in the previous section in which immobility of buffers was assumed [(1 + κx + κi)/γn where γn is εDca].
Estimating calcium concentrations from fluorescence transients
The fluorescence of a calcium indicator is made up of two components: F =F0[B] +FCa[BCa]. The first is the fluorescence of calcium-free indicator (Fmin =F0[B], where [B] is the concentration of calcium-free indicator), and the second is the fluorescence of calcium-bound indicator (Fmax =FCa[BCa] where [BCa] is the concentration of calcium-bound indicator). IfKD = [B][Ca]/[BCa] then:
| Equation 8 |
Footnotes
This work was funded by the March of Dimes Foundation, the EJLB Foundation, the Human Frontier Science Program, the Arnold and Mabel Beckman Foundation, and the National Eye Institute (EY 111787). We thank W. W. Webb, F. Helmchen, K. Holthoff, J. Kozloski, E. Neher, D. Tank, and J. Thomas for comments and D. Tsay for help.
Correspondence should be addressed to Ania Majewska, Department of Biological Sciences, Columbia University, 1212 Amsterdam Avenue, Box 2435, New York, NY 10027. E-mail: akm21@columbia.edu.
REFERENCES
- 1.Bevington PR, Robinson DK. Data reduction and error analysis for the physical sciences. WCB/McGraw-Hill; Boston: 1992. [Google Scholar]
- 2.Crick F. Do spines twitch? Trends Neurosci. 1982;5:44–46. [Google Scholar]
- 3.Denk W, Delaney KR, Gelperin A, Kleinfeld D, Strowbridge BW, Tank DW, Yuste R. Anatomical and functional imaging of neurons using two-photon laser scanning microscopy. J Neurosci Methods. 1994;54:151–162. doi: 10.1016/0165-0270(94)90189-9. [DOI] [PubMed] [Google Scholar]
- 4.DeRobertis EDP, Bennett HS. Some features of the submicroscopic morphology of synapses in frog and earthworm. J Biophys Biochem Cytol. 1955;1:47–58. doi: 10.1083/jcb.1.1.47. [DOI] [PMC free article] [PubMed] [Google Scholar]
- 5.Dunaevsky A, Tashiro A, Majewska A, Mason C, Yuste R. Developmental regulation of spine motility in the mammalian central nervous system. Proc Natl Acad Sci USA. 1999;96:13438–13443. doi: 10.1073/pnas.96.23.13438. [DOI] [PMC free article] [PubMed] [Google Scholar]
- 6.Emptage N, Bliss TV, Fine A. Single synaptic events evoke NMDA receptor-mediated release of calcium from internal stores in hippocampal dendritic spines. Neuron. 1999;22:115–124. doi: 10.1016/s0896-6273(00)80683-2. [DOI] [PubMed] [Google Scholar]
- 7.Fifkova E, Anderson CL. Stimulation-induced changes in dimensions of stalks of dendritic spines in the dentate molecular layer. Exp Neurol. 1981;74:621–627. doi: 10.1016/0014-4886(81)90197-7. [DOI] [PubMed] [Google Scholar]
- 8.Fischer M, Kaech S, Knutti D, Matus A. Rapid actin-based plasticity in dendritic spine. Neuron. 1998;20:847–854. doi: 10.1016/s0896-6273(00)80467-5. [DOI] [PubMed] [Google Scholar]
- 9.Gabso M, Neher E, Spira ME. Low mobility of the Ca2+ buffers in axons of cultured Aplysia neurons. Neuron. 1997;18:473–481. doi: 10.1016/s0896-6273(00)81247-7. [DOI] [PubMed] [Google Scholar]
- 10.Grynkiewicz G, Poenie M, Tsien RY. A new generation of Ca2+ indicators with greatly improved fluorescence properties. J Biol Chem. 1985;260:3440–3450. [PubMed] [Google Scholar]
- 11.Guerini D, Carafoli E. The calcium pumps. In: Carafoli E, Klee C, editors. Calcium as a cellular regulator. Oxford UP; New York: 1999. pp. 249–278. [Google Scholar]
- 12.Guerini D, Garcia-Martin E, Gerber A, Volbracht C, Leist M, Merino C, Carafoli E. The expression of plasma membrane Ca2+ pump isoforms in cerebellar granule neurons is modulated by Ca2+. J Biol Chem. 1999;274:1667–1676. doi: 10.1074/jbc.274.3.1667. [DOI] [PubMed] [Google Scholar]
- 13.Gustafsson B, Wigstrom H. Hippocampal long-lasting potentiation produced by pairing single volleys and brief conditioning tetani evoked in separate afferents. J Neurosci. 1986;6:1575–1582. doi: 10.1523/JNEUROSCI.06-06-01575.1986. [DOI] [PMC free article] [PubMed] [Google Scholar]
- 14.Guthrie PB, Segal M, Kater SB. Independent regulation of calcium revealed by imaging dendritic spines. Nature. 1991;354:76–80. doi: 10.1038/354076a0. [DOI] [PubMed] [Google Scholar]
- 15.Harris KM, Stevens JK. Dendritic spines of CA1 pyramidal cells in the rat hippocampus: serial electron microscopy with reference to their biophysical characteristics. J Neurosci. 1989;9:2982–2997. doi: 10.1523/JNEUROSCI.09-08-02982.1989. [DOI] [PMC free article] [PubMed] [Google Scholar]
- 16.Harris KM, Jensen FE, Tsao B. Three-dimensional structure of dendritic spines and synapses in rat hippocampus (CA1) at postnatal day 15 and adult ages: implications for the maturation of synaptic physiology and long-term potentiation. J Neurosci. 1992;12:2685–2705. doi: 10.1523/JNEUROSCI.12-07-02685.1992. [DOI] [PMC free article] [PubMed] [Google Scholar]
- 17.Haugland R. Handbook of fluorescent probes and research chemicals. Molecular Probes; Eugene, OR: 1996. [Google Scholar]
- 18.Helmchen F, Imoto K, Sakmann B. Ca2+ buffering and action potential-evoked Ca2+ signaling in dendrites of pyramidal neurons. Biophys J. 1996;70:1069–1081. doi: 10.1016/S0006-3495(96)79653-4. [DOI] [PMC free article] [PubMed] [Google Scholar]
- 19.Hille B. Ionic channels of excitable membranes, 2nd Ed. Sinauer; Sunderland, MA: 1992. [Google Scholar]
- 20.Hosokawa T, Rusakov DA, Bliss TVP, Fine A. Repeated confocal imaging of individual dendritic spines in the living hippocampal slice: evidence for changes in length and orientation associated with chemically induced LTP. J Neurosci. 1995;15:5560–5573. doi: 10.1523/JNEUROSCI.15-08-05560.1995. [DOI] [PMC free article] [PubMed] [Google Scholar]
- 21.Koch C, Zador A. The function of dendritic spines—devices subserving biochemical rather than electrical compartmentalization. J Neurosci. 1993;13:413–422. doi: 10.1523/JNEUROSCI.13-02-00413.1993. [DOI] [PMC free article] [PubMed] [Google Scholar]
- 22.Koester HJ, Sakmann B. Calcium dynamics in single spines during coincident pre- and postsynaptic activity depend on relative timing of back-propagating action potentials and subthreshold excitatory postsynaptic potentials. Proc Natl Acad Sci USA. 1998;95:9596–9601. doi: 10.1073/pnas.95.16.9596. [DOI] [PMC free article] [PubMed] [Google Scholar]
- 23.Korkotian E, Segal M. Fast confocal imaging of calcium released from stores in dendritic spines. Eur J Neurosci. 1998;10:2076–2084. doi: 10.1046/j.1460-9568.1998.00219.x. [DOI] [PubMed] [Google Scholar]
- 24.Kuo TH, Liu BF, Wuytack F, Raeymaekers L, Tsang W. Co-ordinated regulation of the plasma membrane calcium pump and the sarco(endo)plasmic reticular calcium pump gene expression by Ca2+. Cell Calcium. 1997;21:399–408. doi: 10.1016/s0143-4160(97)90051-8. [DOI] [PubMed] [Google Scholar]
- 25.Levy WB, Desmond NL. Associative potentiation/depression in the hippocampal dentate gyrus. In: Buzsáki G, Vanderwolf CH, editors. Electrical activity of the archicortex. Akademiai Kiado; Budapest: 1985. pp. 359–373. [Google Scholar]
- 26.Lisman J. A mechanism for the Hebb and anti-Hebb processes underlying learning and memory. Proc Natl Acad Sci USA. 1989;86:9574–9578. doi: 10.1073/pnas.86.23.9574. [DOI] [PMC free article] [PubMed] [Google Scholar]
- 27.Magee JC, Johnston D. A synaptically controlled, associative signal for Hebbian plasticity in hippocampal neurons. Science. 1997;275:209–212. doi: 10.1126/science.275.5297.209. [DOI] [PubMed] [Google Scholar]
- 28.Malenka RC, Nicoll RA. Silent synapses speak up. Neuron. 1997;19:473–476. doi: 10.1016/s0896-6273(00)80362-1. [DOI] [PubMed] [Google Scholar]
- 29.Malenka RC, Kauer JA, Zucker RS, Nicoll RA. Postsynaptic calcium is sufficient for potentiation of hippocampal slice transmission. Science. 1988;242:81–84. doi: 10.1126/science.2845577. [DOI] [PubMed] [Google Scholar]
- 30.Malenka RC, Kauer JA, Perkel DJ, Nicoll RA. The impact of postsynaptic calcium on synaptic transmission—its role in long-term potentiation. Trends Neurosci. 1989;12:444–450. doi: 10.1016/0166-2236(89)90094-5. [DOI] [PubMed] [Google Scholar]
- 31.Markram H, Helm PJ, Sakmann B. Dendritic calcium transients evoked by single back-propagating action potentials in rat neocortical pyramidal neurons. J Physiol (Lond) 1995;485:1–20. doi: 10.1113/jphysiol.1995.sp020708. [DOI] [PMC free article] [PubMed] [Google Scholar]
- 32.Markram H, Luebke J, Frotscher M, Sakmann B. Regulation of synaptic efficacy by coincidence of postsynaptic APs and EPSPs. Science. 1997;275:213–215. doi: 10.1126/science.275.5297.213. [DOI] [PubMed] [Google Scholar]
- 33.Miller SG, Kennedy MB. Regulation of brain type II Ca2+/calmodulin-dependent protein kinase by autophosphorylation: a Ca2+-triggered molecular switch. Cell. 1986;44:861–870. doi: 10.1016/0092-8674(86)90008-5. [DOI] [PubMed] [Google Scholar]
- 34.Müller W, Connor JA. Dendritic spines as individual neuronal compartments for synaptic Ca2+ responses. Nature. 1991;354:73–76. doi: 10.1038/354073a0. [DOI] [PubMed] [Google Scholar]
- 35.Naraghi M. T-jump study of calcium binding kinetics of calcium chelators. Cell Calcium. 1997;22:255–268. doi: 10.1016/s0143-4160(97)90064-6. [DOI] [PubMed] [Google Scholar]
- 36.Neher E. Usefulness and limitations of linear approximations to the understanding of the Ca2+ signals. Cell Calcium. 1998;24:345–357. doi: 10.1016/s0143-4160(98)90058-6. [DOI] [PubMed] [Google Scholar]
- 37.Neher E, Augustine G. Calcium gradients and buffers in bovine chromaffin cells. J Physiol (Lond) 1992;450:273–301. doi: 10.1113/jphysiol.1992.sp019127. [DOI] [PMC free article] [PubMed] [Google Scholar]
- 38.Nusser Z, Lujan R, Laube G, Roberts J, Molnar E, Somogyi P. Cell type and pathway dependence of synaptic AMPA receptor number and variability in the hippocampus. Neuron. 1998;21:545–559. doi: 10.1016/s0896-6273(00)80565-6. [DOI] [PubMed] [Google Scholar]
- 39.Palay SL. Synapses in the central nervous system. J Biophys Biochem Cytol. 1956;2:193–201. doi: 10.1083/jcb.2.4.193. [DOI] [PMC free article] [PubMed] [Google Scholar]
- 40.Philipson KD. Sodium–calcium exchange. In: Carafoli E, Klee C, editors. Calcium as a cellular regulator. Oxford UP; New York: 1999. pp. 279–294. [Google Scholar]
- 41.Ramón y Cajal S. La textura del sistema nerviosa del hombre y los vertebrados. Moya; Madrid: 1904. [Google Scholar]
- 42.Svoboda K, Tank DW, Denk W. Direct measurement of coupling between dendritic spines and shafts. Science. 1996;272:716–719. doi: 10.1126/science.272.5262.716. [DOI] [PubMed] [Google Scholar]
- 43.Tank DW, Delaney KD, Regehr WG. The quantitative analysis of presynaptic calcium dynamics that contribute to short-term synaptic enhancement. J Neurosci. 1995;15:7940–7952. doi: 10.1523/JNEUROSCI.15-12-07940.1995. [DOI] [PMC free article] [PubMed] [Google Scholar]
- 44.Wang KK, Du YS, Diglio C, Tsang W, Kuo TH. Hormone-induced phosphorylation of the plasma membrane calcium pump in cultured aortic endothelial cells. Arch Biochem Biophys. 1991;15:103–108. doi: 10.1016/0003-9861(91)90448-r. [DOI] [PubMed] [Google Scholar]
- 45.Wickens J. Electrically coupled but chemically isolated synapses: dendritic spines and calcium in a rule for synaptic modification. Prog Neurobiol. 1988;31:507–528. doi: 10.1016/0301-0082(88)90013-5. [DOI] [PubMed] [Google Scholar]
- 46.Yuste R, Denk W. Dendritic spines as basic units of synaptic integration. Nature. 1995;375:682–684. doi: 10.1038/375682a0. [DOI] [PubMed] [Google Scholar]
- 47.Yuste R, Majewska A, Cash S, Denk W. Mechanisms of calcium influx into spines: heterogeneity among spines, coincidence detection by NMDA receptors, and optical quantal analysis. J Neurosci. 1999;19:1976–1987. doi: 10.1523/JNEUROSCI.19-06-01976.1999. [DOI] [PMC free article] [PubMed] [Google Scholar]