

Abstract
Sympathetic preganglionic neurons receive direct, monosynaptic input from a series of well defined nuclei in the brainstem and the hypothalamus. These premotor cell groups coordinate sympathetic control with ongoing endocrine and behavioral response. However, it is not known precisely which populations of sympathetic premotor neurons are activated during specific responses, such as fever after intravenous lipopolysaccharide (LPS). We used the activation of c-fos protein expression in spinally projecting neurons during intravenous LPS fever as a model for examining the functional organization of this system. Intravenous LPS (5 μg/kg) induced Fos-like immunoreactivity in sympathetic preganglionic neurons in the spinal cord as well as several sympathetic premotor nuclei, including the paraventricular nucleus of the hypothalamus, rostral and caudal levels of the ventrolateral medulla, and the nucleus of the solitary tract. After injecting Fluorogold into the intermediolateral column at the T1–L1 spinal levels, neurons that were both Fos immunoreactive and retrogradely labeled were found only in the dorsal parvicellular division of the paraventricular nucleus in the hypothalamus, the rostral ventrolateral medulla (C1 adrenergic cell group), and the A5 noradrenergic cell group in the brainstem. The same pattern of double-labeling was seen from injections at each spinal cord level. These findings suggest that only a limited pool of hypothalamo-sympathetic neurons contribute to the fever response and that they may do so by contacting specific populations of preganglionic neurons that are distributed across a wide range of spinal levels. The anatomical specificity of the paraventriculo-spinal projection is thus functional rather than topographic.
Keywords: intermediolateral cell column, fever, paraventricular nucleus of the hypothalamus, rostral ventrolateral medulla, lipopolysaccharide, A5 cell group
Fever is an adaptive response to inflammatory stimulation, mediated by the hypothalamus, that includes coordinated autonomic, endocrine, and behavioral mechanisms that result in an increase in body temperature (for review, see Elmquist et al., 1997). Intravenous injection of lipopolysaccharide (LPS) or endotoxin is an immune stimulus that produces fever and induces Fos-like immunoreactivity (Fos-ir) in many cell groups in the rat brain, including the ventromedial preoptic nucleus (VMPO), paraventricular nucleus of hypothalamus (PVH), rostral and caudal levels of the ventrolateral medulla (RVLM and CVLM, respectively), and the nucleus of the solitary tract (NTS) (Sagar et al., 1995; Elmquist et al., 1996). In addition, sympathetic preganglionic neurons in the intermediolateral cell column (IML), extending from the first thoracic through the upper lumbar segments of the spinal cord, show Fos expression in response to LPS (Tkacs and Strack, 1995). Different levels of the IML mediate different sympathetic responses that play a role in thermoregulation. For example, the T1–T4 levels contribute to regulation of brown fat thermogenesis (Bamshad et al., 1999; Elias et al., 1998), the T2–T5 levels control the heart (Strack et al., 1989a; Jansen et al., 1995), the T4–T12 levels regulate adrenal secretion (Strack et al., 1988,1989b; Jansen et al., 1995), and the T11–L1 levels control blood flow through the tail artery (Smith et al., 1998), thus regulating heat loss through the large surface area of the tail.
The projections to the sympathetic preganglionic cell column from the brain have received extensive study (for review, see Saper, 1995). Other than a few neurons in the infralimbic cortex (Hurley et al., 1991), the main forebrain site with direct input to sympathetic preganglionic neurons is the hypothalamus. Separate populations of neurons have been identified that project to the IML from the PVH, including its dorsal, ventral, and lateroposterior parvocellular subnuclei, the dorsal and lateral hypothalamic areas, and the lateral part of the arcuate nucleus and retrochiasmatic area (for review, seeCechetto and Saper, 1988). Direct projections to the IML also arise from several brainstem cell groups, including the Kölliker-Fuse nucleus in the parabrachial complex, the A5 noradrenergic cell group in the ventral pons, the caudal part of the nucleus of the solitary tract, the ventromedial medulla including the medullary raphe nuclei, and the rostral ventrolateral medulla, arising mainly from the C1 adrenergic cell group (for review, see Saper, 1995).
The CNS neurons that are responsible for the activation of the sympathetic preganglionic cell column during LPS-induced fever are not known. We have therefore combined retrograde transport of Fluorogold from different levels of the IML with Fos-like immunoreactivity to identify possible candidates in the rat brain for mediating the sympathetic activation during LPS-induced fever. Furthermore, by injecting different spinal levels with retrograde tracers, we have examined whether there is a distinct pattern of activation of sympathetic preganglionic neurons that control specific tissues.
MATERIALS AND METHODS
Animals. In this study we used a total of 24 adult pathogen-free Sprague Dawley male rats (Taconic, Germantown, NY) weighing 250–350 gm. Rats were housed individually in a pathogen-free barrier facility with unrestricted access to food and water in a light (12 hr on, from 7 A.M./12 hr off, from 7 P.M.)- and temperature-controlled (21.5–22.5°C) environment. The animals and procedures used were in accordance with the guidelines and approval of the Harvard Medical School and Beth Israel Deaconess Medical Center Institutional Animal Care and Use Committees. The rats were monitored daily after surgery to assess general appearance and behavior.
Venous catheterization and spinal Fluorogold injection. One week before LPS administration, rats were anesthetized with chloral hydrate (7%, 350 mg/kg, i.p.). A SILASTIC catheter containing heparinized saline (10 U/ml of pyrogen-free saline, Sigma, St. Louis, MO) was inserted into the femoral vein and sutured in place, as described previously (Elmquist and Saper, 1996; Elmquist et al., 1996). The free end of the catheter was passed under the skin of the back, exteriorized between the scapulae, and plugged with a sterile wire stylet.
During the same surgical session, the rats were mounted in a stereotaxic frame (Kopf Instruments), and the spine was stablized. After the spine was exposed, a small laminectomy was performed to expose the spinal cord, and 45–50 nl Fluorogold (5% in saline; Chemicon, Temecula, CA) was injected stereotaxically at a depth of 0.9–0.95 mm to the dorsal root entry zone from a glass micropipette (Fig.1B,C). Two unilateral injections into adjacent spinal levels, ∼2.0 mm apart, were placed in each animal. We performed these injections using an air-pressure system as described previously (Herbert et al., 1990;Moga et al., 1990; Hurley et al., 1991; Moga and Saper, 1994). After the injections, the micropipette was left in place for an additional 2 min to minimize leakage and nonspecific labeling. After injections, wounds were closed and rats were allowed to recover.
Fig. 1.

Locations of spinal injections of Fluorogold.A, The locations of the injection sites are illustrated schematically along the length of the thoracic level of the spinal cord. Injection sites used in animals that received LPS as well as control animals that received saline are shown as black squares, sites used only in animals that received LPS are shown as black circles, and sites used only in animals that received saline are illustrated by white circles.B, Coronal drawing of a spinal cord at the thoracic level to show the plane of section of C, a photomicrograph of a horizontal section through the upper thoracic spinal cord demonstrating a pair of Fluorogold injection sites (arrows) into the intermediolateral cell column (IML) at the T1 and T2 levels. The plane of the section varies slightly from the central canal (CC) to the ventral tip of the dorsal columns (DC). Note that the injections mainly fill the ipsilateral gray matter, with minimal involvement of the white matter in the lateral funiculus (LF). Scale bar, 0.5 mm.
LPS administration. After surgical recovery, rats were handled daily between 9:30 and 10:30 A.M. to minimize the stress response to handling. Seven days later, rats were injected with LPS dissolved in saline or pyrogen-free saline alone (as a control) through the venous catheter. We gave only one dose of LPS (5 μg/kg body weight) followed by a flush of saline via intravenous injection (0.25 ml total volume per rat; catheter dead space, ∼0.05 ml). All injections were given at approximately 10:00 AM to avoid differences in circadian baseline Fos expression (Kononen et al., 1990).
We used low-dose LPS (5 μg/kg body weight, i.v.) as an immune stimulus to produce a typical fever. Our previous work showed that 2 hr after intravenous injection of this low-dose LPS, there is consistently a 1.5°C increase in body temperature (Elmquist et al., 1996). Hence, animals were killed at 2 hr, although body temperature was not monitored in this series.
Animal perfusion and histology. Two hours after intravenous administration of LPS or saline, rats were deeply anesthetized with an intraperitoneal injection of chloral hydrate (7%; 350 mg/kg) and perfused transcardially with 0.9% saline for 5 min, followed by 500 ml of phosphate-buffered 10% formalin, pH 6.9–7.1 at 25°C, and the brains and spinal cords were removed. Spinal cords were separated by transverse cuts into three segments. The brains and spinal cords were stored in the same fixative for 4 hr, then submerged in 20% sucrose (containing 0.02% sodium azide in PBS) for at least 24 hr. Subsequently, the brains were cut into four series of coronal frozen sections at 40 μm; the spinal cords were cut into two series of horizontal sections at 40 μm. All of the sections were stored at 4°C in tissue culture dishes containing 0.02% sodium azide in PBS until immunohistochemical staining was performed.
Immunohistochemistry. Double immunohistochemistry for Fos and Fluorogold was performed as described previously (Elmquist and Saper, 1996; Elias et al., 1998). Briefly, after rinsing with 0.1m PBS, sections were incubated in 3% H2O2 in PBS for 30 min at room temperature, and then in 3% normal donkey serum with 0.25% Triton X-100 in PBS (PDT) for 1–1.5 hr, followed by 48 hr at room temperature with a rabbit primary antiserum [Oncogene Ab5; 1:150,000 dilution in PDT; for the N-terminal domain of Fos with no known cross-reactivity with any identified Fos-related antigens; see Elmquist et al. (1998) for characterization of this antiserum]. After they were rinsed with 0.1 m PBS, sections were incubated for 2 hr with a biotinylated goat anti-rabbit IgG (Vector Laboratories, Burlingame, CA; 1:1000 in PDT) at room temperature and then reacted with avidin–biotin complex (ABC; Vector Elite Kit, 1:500 in PBS). A combination of 0.04% diaminobenzidine tetrahydrochloride (DAB) (Sigma), 0.01% nickel ammonium sulfate (Fisher Scientific, Pittsburgh, PA), 0.01% cobalt chloride (Fisher Scientific), and 0.01% H2O2 dissolved in PBS was used for the chromogen reaction for 6–8 min; then the reaction was terminated with two rinses in PBS.
Tissue sections were then re-exposed to 0.3% hydrogen peroxide for 30 min, rinsed in PBS, and subsequently incubated in PDT for 2 hr and then in Fluorogold primary antiserum raised in rabbit (1:50,000 in PDT; Chemicon) for 24 hr at room temperature. Sections were then incubated in biotinylated donkey anti-rabbit antiserum (1:1000; Jackson Laboratories) for 2 hr at room temperature, followed by ABC and DAB steps as above, except that nickel ammonium sulfate and cobalt chloride were omitted from the DAB solution. Fluorogold therefore was visualized as a brown cytoplasmic reaction product, whereas Fos appeared as a black reaction product in cell nuclei. Because the two labels are always expressed in separate compartments within the cell, there was no issue of cross-reactivity causing spurious double-labeling, and therefore it was not necessary to perform controls omitting one or the other antiserum.
Finally, the brain and spinal cord tissue sections were mounted onto gelatin-coated glass slides, air-dried, dehydrated in alcohol, cleared in xylene, and coverslipped with Permaslip.
Data analysis and production of photomicrographs. To compare the different levels of the spinal cord that mediate sympathetic activation during LPS fever, we divided the rats into three groups that received injections of Fluorogold at different levels of the spinal cord (T1–T4, n = 8; T5–T10, n = 8; T11–L1, n = 8) (Fig. 1A). Each rat received two injections at adjacent spinal levels. Within each group, four rats were later treated with LPS and four received saline, therefore serving as controls.
We examined the brain and spinal cord for Fos-like immunoreactivity, Fluorogold-like immunoreactivity, and double-labeled (Fos, Fluorogold) neurons, and mapped the patterns of labeling in different regions of the brain. We also quantified the numbers of Fluorogold-immunoreactive (Fluorogold-ir) neurons and double-labeled neurons in the parvicellular divisions of the PVH, the lateral hypothalamic area, the retrochiasmatic area and adjacent arcuate nucleus, the Kölliker-Fuse nucleus, the A5 cell group, the caudal nucleus of the solitary tract, and the rostral ventrolateral medulla for each rat (see Table 1). Photographic images were acquired with a Kodak Digital camera (Professional DCS 460c) that was mounted on the microscope and connected to a Power Macintosh 8100 computer. Images were edited with Adobe Photoshop, and labeling was added with Canvas (version: 5.0.3). Only the sharpness, contrast, brightness, and color balance were adjusted. All prints were produced on a dye sublimation printer (Kodak 8600).
Table 1.
Distribution of retrogradely labeled and double-labeled cells in the brain after injections of Fluorogold at different spinal levels
| Lipopolysaccharide | Saline | ||||||||
|---|---|---|---|---|---|---|---|---|---|
| Ipsilateral | Contralateral | Ipsilateral | Contralateral | ||||||
| Retrograde | Double | Retrograde | Double | Retrograde | Double | Retrograde | Double | ||
| T1–T4 level | PVH dp | 122 ± 11.9 | 14 ± 3.6* | 43 ± 3.9 | 11 ± 2.9* | 128 ± 12.1 | 1.0 ± 0.7 | 48 ± 6.1 | 0.8 ± 0.3 |
| PVH vp | 65 ± 8.4 | 3.0 ± 1.0 | 25 ± 2.8 | 1.0 ± 0.4 | 65 ± 11.0 | 0.8 ± 0.3 | 30 ± 5.9 | 0.5 ± 0.5 | |
| PVH lp | 205 ± 29.5 | 3 ± 0.9 | 113 ± 15.8 | 1.0 ± 0.7 | 207 ± 20.7 | 0.8 ± 0.3 | 120 ± 25.2 | 0.5 ± 0.3 | |
| LHA | 984 ± 38.4 | 5 ± 1.6 | 516 ± 30.0 | 5.0 ± 1.1 | 1056 ± 104 | 3.0 ± 1.0 | 533 ± 80.1 | 3 ± 1.1 | |
| RCA/Arc | 94 ± 9.3 | 0.7 ± 0.3 | 65 ± 4.6 | 1.5 ± 0.87 | 122 ± 13.2 | 6.0 ± 3.8 | 58 ± 10.4 | 3.0 ± 1.5 | |
| KF nucleus | 120 ± 32.1 | 1.3 ± 0.6 | 117 ± 17.8 | 1.0 ± 0.4 | 145 ± 8.0 | 0.3 ± 0.3 | 151 ± 13.9 | 0 ± 0 | |
| A5 cell group | 110 ± 8.0 | 6.0 ± 2.2* | 95 ± 7.7 | 6.0 ± 1.5* | 114 ± 8.0 | 0.3 ± 0.3 | 111 ± 8.4 | 0.3 ± 0.3 | |
| Caudal NTS | 52 ± 8.8 | 2.0 ± 1.7 | 29 ± 7.4 | 0.8 ± 0.48 | 76 ± 10.5 | 1.3 ± 1.3 | 42 ± 6.1 | 0.5 ± 0.5 | |
| RVLM | 122 ± 8.6 | 13 ± 3.2* | 93 ± 8.0 | 16 ± 2.91-160 | 104 ± 12.6 | 1.7 ± 0.88 | 60 ± 8.8 | 0.3 ± 0.3 | |
| T5–T10 level | PVH dp | 88 ± 12.2 | 26 ± 1.11-160 | 24 ± 2.4 | 17 ± 3.11-160 | 132 ± 29.7 | 0.8 ± 0.3 | 36 ± 8.9 | 0.7 ± 0.3 |
| PVH vp | 34 ± 3.2 | 3 ± 0.5 | 15 ± 3.5 | 0.3 ± 0.3 | 49 ± 7.1 | 0.8 ± 0.5 | 13 ± 4.7 | 0 ± 0 | |
| PVH lp | 174 ± 24.0 | 8.0 ± 1.9 | 55 ± 11.3 | 3.8 ± 1.9 | 183 ± 28.0 | 0.8 ± 0.5 | 50 ± 9.1 | 0 ± 0 | |
| LHA | 660 ± 19.7 | 4 ± 1.1 | 350 ± 27.2 | 2.0 ± 0.6 | 585 ± 118 | 1.8 ± 1.0 | 221 ± 50.7 | 0.7 ± 0.7 | |
| RCA/Arc | 65 ± 6.3 | 1.3 ± 0.3 | 24 ± 2.9 | 0.8 ± 0.5 | 63 ± 16.3 | 2.0 ± 2.0 | 21 ± 7.7 | 2.0 ± 1.5 | |
| KF nucleus | 26 ± 6.8 | 1.7 ± 0.33 | 41 ± 1.3 | 1.7 ± 1.2 | 40 ± 11.3 | 0.3 ± 0.3 | 42 ± 10.7 | 0 ± 0 | |
| A5 cell group | 95 ± 5.0 | 6.0 ± 2.0* | 93 ± 2.0 | 5.0 ± 1.5* | 88 ± 12.2 | 0 ± 0 | 74 ± 2.6 | 0.3 ± 0.3 | |
| Caudal NTS | 46 ± 5.5 | 1.3 ± 0.5 | 36 ± 4.1 | 0.5 ± 0.5 | 39 ± 3.0 | 1.3 ± 1.3 | 28 ± 4.1 | 0.7 ± 0.7 | |
| RVLM | 81 ± 4.5 | 22 ± 5.51-160 | 70 ± 4.4 | 21 ± 5.3* | 71 ± 5.3 | 0.3 ± 0.3 | 79 ± 9.3 | 1.3 ± 0.3 | |
| T11–L1 level | PVH dp | 103 ± 16.1 | 10 ± 2.5* | 42 ± 9.0 | 7.0 ± 1.31-160 | 83 ± 24.3 | 0.8 ± 0.5 | 34 ± 11 | 0 ± 0 |
| PVH vp | 73 ± 5.8 | 2.0 ± 0.4 | 42 ± 9.9 | 1.5 ± 0.87 | 71 ± 17.9 | 0.3 ± 0.3 | 27 ± 8.4 | 0 ± 0 | |
| PVH lp | 193 ± 11.5 | 2.0 ± 0.8 | 80 ± 2.4 | 3.0 ± 0.6 | 135 ± 22.3 | 1.8 ± 0.8 | 66 ± 10.7 | 1.0 ± 0.7 | |
| LHA | 642 ± 78.5 | 3.0 ± 0.95 | 327 ± 39.5 | 3.0 ± 0.9 | 384 ± 81.4 | 0.3 ± 0.3 | 204 ± 40.7 | 1.8 ± 0.3 | |
| RCA/Arc | 46 ± 8.8 | 1.0 ± 0.7 | 14 ± 3.2 | 0.8 ± 0.5 | (21.5) | (0.5) | (6.5) | (0.5) | |
| KF nucleus | 22 ± 2.4 | 0.8 ± 0.5 | 44 ± 3.1 | 1.3 ± 0.6 | 22 ± 3.5 | 0.5 ± 0.3 | 36 ± 6.6 | 0.3 ± 0.3 | |
| A5 cell group | 72 ± 7.2 | 2.0 ± 0.95 | 65 ± 9.7 | 0 ± 0 | 63 ± 13.9 | 0.3 ± 0.3 | 58 ± 5.9 | 0.8 ± 0.3 | |
| Caudal NTS | 31 ± 5.3 | 0.3 ± 0.3 | 35 ± 4.9 | 0.3 ± 0.3 | 38 ± 1.9 | 0.3 ± 0.3 | 33 ± 2.9 | 0.3 ± 0.3 | |
| RVLM | 45 ± 4.1 | 5 ± 1.1* | 38 ± 2.9 | 6.0 ± 1.4* | 51 ± 19.7 | 0.3 ± 0.3 | 44 ± 14.0 | 0 ± 0 | |
Injection sites are grouped into three thoracic levels (T1–T4; T5–T10; and T11–L1). Fluorogold retrogradely labeled neurons as well as double-labeled neurons are shown for both sides of the brain in the paraventricular nucleus of the hypothalamus (PVH; dp, dorsal parvicellular division; vp, ventral parvicellular division; lp, lateral parvicellular division); the lateral hypothalamic area (LHA); the retrochiasmatic area (RCA) and lateral arcuate nucleus (Arc); the Kölliker-Fuse nucleus (KF); the A5 cell group; the caudal nucleus of the solitary tract (NTS); and the rostral ventrolateral medulla (RVLM). Values represent estimates of mean counts of cells ± SEM for n = 3 or 4. In the T11–L1 saline group, sections at the Arc level were damaged in two brains so that only two saline controls were available for quantification; these data are included in parentheses. Data were analyzed by ANOVA with post hocStudent's t test.
p < 0.05,
F1-160: p < 0.01 compared with intravenous injection of saline. Groups in which LPS produced a statistically significant increase in the number of double-labeled neurons compared with controls are indicated by bold text.
RESULTS
Distribution of Fos-like immunoreactivity
The pattern of the distribution of Fos-ir neurons induced by intravenous administration of LPS or saline was similar to our earlier studies (Elmquist and Saper, 1996; Elmquist et al., 1996). However, the labeled neurons were found more extensively in central autonomic control structures, presumably because we used a more sensitive anti-Fos antiserum (Oncogene Ab5) in this study than in our earlier ones (which used Oncogene Ab2).
Briefly, after intravenous administration of LPS, there were increased numbers of Fos-ir neurons in the infralimblic and prelimbic cortex, the insular cortex, the lateral septum, the bed nucleus of the stria terminals, the central nucleus of the amygdala, the organum vasculosum of the lamina terminalis, the VMPO, the median preoptic nucleus, the supraoptic nucleus, the lateral hypothalamic area, the PVH, the retrochiasmatic area and adjacent arcuate nucleus, the periaqueductal gray matter, the lateral parabrachial complex, the NTS, the area postrema, RVLM, and CVLM. Within the PVH, many Fos-ir neurons were induced in the dorsal, medial, ventral, and lateroposterior parvicellular division, with fewer Fos-ir neurons scattered in the lateral parvicellular division and posterior magnocellular division.
Distribution of Fluorogold-ir (retrogradely labeled) neurons
The distribution of Fluorogold-ir neurons in the brain after spinal injections was similar to that reported previously (Kuypers and Maisky, 1975). In the present study, we mainly concentrated on examining Fluorogold-ir neurons in nuclei in the hypothalamus and the brainstem that project directly to the IML, as shown in earlier studies (Saper et al., 1976; Loewy and Burton, 1978; Saper and Loewy, 1980;McKellar and Helke et al., 1982; Loewy, 1981, 1982; Sawchenko and Swanson, 1982; Ross et al., 1984; Tucker and Saper, 1985; Tucker et al., 1987; Cechetto and Saper, 1988; Strack et al., 1989a,b; Jansen et al., 1997).
Briefly, in the forebrain, many Fluorogold-ir neurons were concentrated in the PVH, including its dorsal, ventral, and lateroposterior parvicellular subnuclei. Only a few Fluorogold-ir neurons were found in the medial parvicellular division, and very few were found in the posterior magnocellular division (Figs.2, 3; Table1). Numerous neurons containing Fluorogold-like immunoreactivity were scattered widely in the lateral hypothalamic area, including the perifornical region, and some additional Fluorogold-ir neurons were also observed in the retrochiasmatic area and the adjacent arcuate nucleus (Fig.3; Table 1). Approximately twice as many Fluorogold-ir neurons were seen on the ipsilateral (right) side of the hypothalamus as on the contralateral (left) side (Fig. 2; Table 1). Only a small number of retrogradely labeled cells was seen in the infralimbic cortex, bilaterally.
Fig. 2.
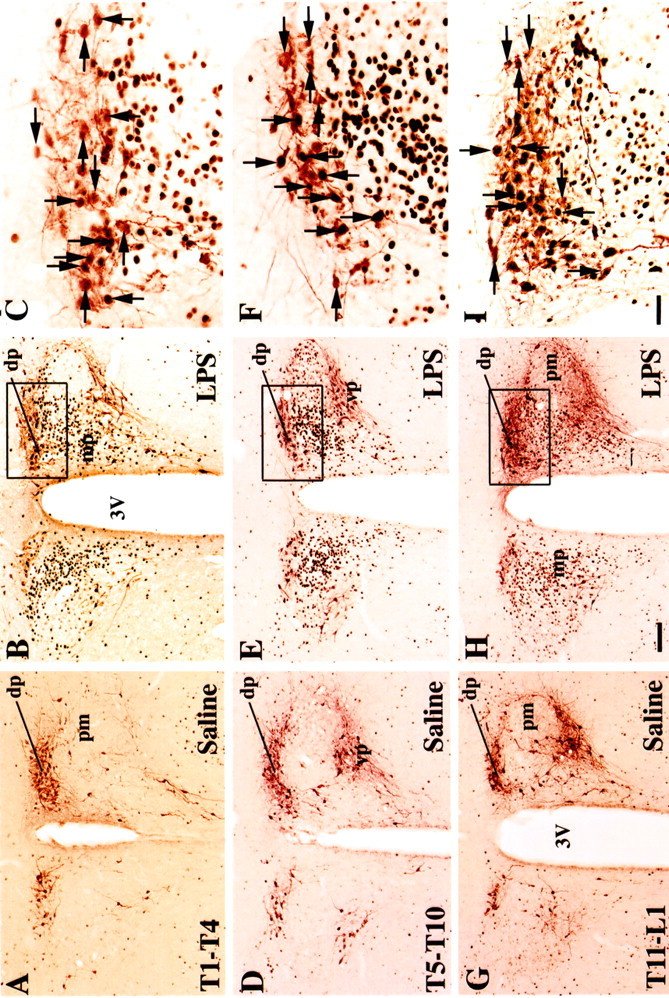
A series of photomicrographs demonstrating the distribution of Fos-ir (black nuclei), Fluorogold-ir (brown cytoplasm, horizontal arrows), and double-labeled (black nuclei with brown cytoplasm, vertical arrows) neurons in the PVH, after intravenous injection of saline (A,D, G) or lipopolysaccharide (LPS) (B, C,E, F, H,I), in animals with Fluorogold injections in the T1–T4 (A–C), T5–T10 (D–F), or T11–L1(G–I) of the spinal cord. Divisions of the PVH: dp, dorsal parvocellular division;mp, medial parvocellular division; pm, posterior magnocellular division; vp, ventral parvocellular division; 3V, third ventricle. Scale bars:A, B, D, E,G, H, 100 μm; C,F, I, 30 μm.
Fig. 3.
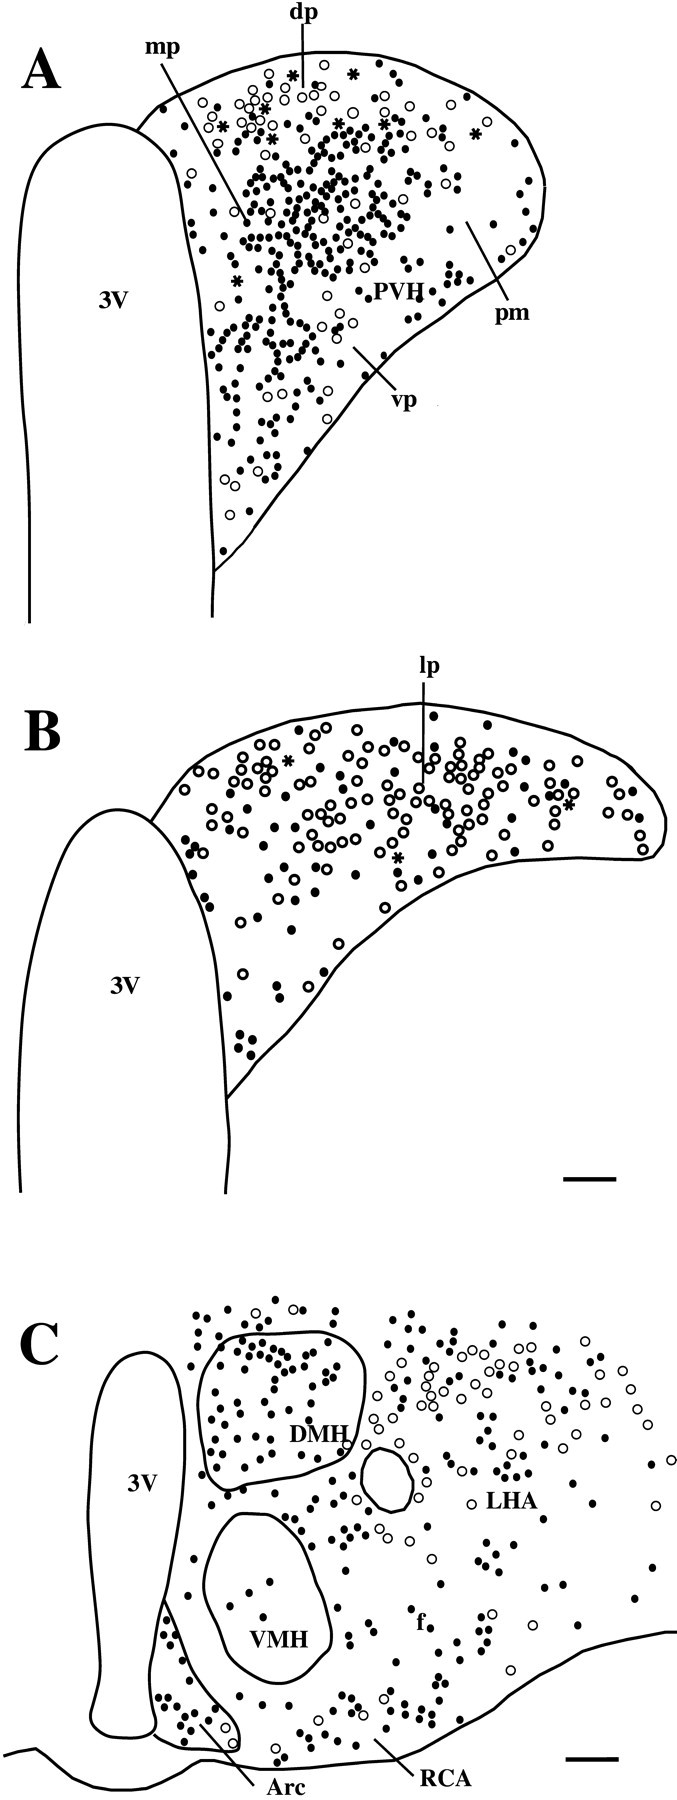
A series of line drawings demonstrating the distribution of Fos-ir (black circles), Fluorogold-ir (white circles), and double-labeled (black stars) neurons in the middle level of the PVH (A), the caudal PVH (B), and the lateral hypothalamic area and arcuate nucleus (Arc) (C), after intravenous injection of LPS, in animals with Fluorogold injected into the T5–T10 levels of the spinal cord. Notice that although retrogradely labeled neurons (whitecircles) are widely distributed in the hypothalamus, most double-labeled neurons were seen in the dorsal parvicellular PVH (dp; A), although a few were seen in the lateroposterior parvicellular PVH (lp;B). DMH, Dorsomedial hypothalamic nucleus; RCA, retrochiasmatic area; VMH, ventromedial hypothalamic nucleus. Other abbreviations are defined in Figure 2 legend. Scale bars: A, B, 75 μm; C, 250 μm.
In the brainstem, there were scattered Fluorogold-ir neurons in the Kölliker-Fuse nucleus (Fig.4A), the A5 region (Fig. 4B), the RVLM (Fig. 4C), and the caudolateral portion of the NTS (Fig. 4D). In the A5 region, the number of Fluorogold-ir neurons in the ipsilateral side were similar to that in the contralateral side (Table 1). For both the caudal NTS and the RVLM, more retrogradely labeled neurons were found on the ipsilateral side after T1–T4 injections, but the retrogradely labeled neurons were more evenly distributed between the two sides with caudal spinal injections. The Kölliker-Fuse nucleus demonstrated far more Fluorogold-ir neurons projecting to the T1–T4 spinal level compared with lower (T5–T10 and T11–L1) levels. There were similar numbers of Fluorogold-ir neurons observed on both sides of the brain in the Kölliker-Fuse nucleus after T1–T4 spinal injections, whereas more Fluorogold-ir neurons were observed on the contralateral side than on the ipsilateral side after T5–T10 or T11–L1 injections (Table 1). Many Fluorogold-ir neurons were scattered in the ipsilateral side of the caudal raphe region, including the raphe magnus, raphe obscurus, and raphe pallidus nuclei, whereas many fewer were labeled on the contralateral side.
Fig. 4.

A series of line drawings demonstrating the distribution of Fos-ir (black circles), Fluorogold-ir (white circles), and double-labeled (black stars) neurons (A) at the middle level of the parabrachial and Kölliker-Fuse (KF) nuclei, (B) in the region of the A5 noradrenergic cell group in the ventrolateral pons, (C) in the region containing the C1 adrenergic cell group in the rostral ventrolateral medulla (RVLM), and (D) in the commissural part of the nucleus of the solitary tract, after intravenous injection of LPS in animals with Fluorogold injections into the T5–T10 levels of the spinal cord. In the brainstem, most double-labeled neurons were found in the RVLM, with smaller numbers being found in the A5 region. 4v, 4th ventricle; 7, facial nerve; Amb, nucleus ambiguus; cc, central canal; CG, central gray matter; cl, central lateral parabrachial subnucleus; Cu, cuneate nucleus; C1, C1 adrenergic cell group; el, external lateral parabrachial subnucleus; Gr, gracile nucleus; IO, inferior olivary nucleus; KF, Kölliker-Fuse nucleus; m, medial parabrachial subnucleus;mcp, middle cerebellar peduncle; me5, mesencephalic trigeminal nucleus and tract; Mo5, motor trigeminal nucleus; Pr5, principal sensory trigeminal nucleus; py, pyramidal tract; scp, superior cerebellar peduncle; SO, superior olivary nucleus; Sp5, spinal trigeminal nucleus;ST5, spinal trigeminal tract; t, solitary tract; Tz, trapezoid body nucleus; vl, ventral lateral parabrachial subnucleus; vsc, ventral spinocerebellar tract; X, dorsal motor vagal nucleus;XII, hypoglossal nucleus. Scale bar, 175 μm.
Additionally, many retrogradely labeled neurons were seen in the hindlimb and forelimb parts of the primary motor and sensory cortex, the Fr1 premotor cortex, and the red nucleus, predominantly on the contralateral side. This pattern was consistent with the injection spreading into the ventral horn of the spinal cord.
Distribution of Fos and Fluorogold double-labeled neurons
Because Fos-positive neurons were found in almost every cell group that projects to the IML, it was important to determine which of these populations of neurons that were activated by LPS might transmit that signal to the sympathetic preganglionic neurons. We therefore mapped and quantified the numbers of double-labeled neurons in each of the cell groups that project to the spinal cord and in which Fos-ir neurons were found after intravenous LPS (Table 1). Double-labeled neurons demonstrated a remarkably restricted distribution, as indicated in Table 1.
The largest numbers of double-labeled neurons were found in the dorsal parvicellular PVH (Figs. 2, 3A); the number of double-labeled neurons on the two sides of the brain was similar. The highest percentage of double-labeled neurons in the dorsal parvicellular PVH (ipsilateral side, 30% of retrogradely labeled neurons; contralateral side, 71%) (Table 1) was seen after T5–T10 spinal injections (Fig. 2). For all three groups of spinal injections, although there were nearly three times as many Fluorogold-ir neurons in the dorsal parvicellular PVH on the ipsilateral side, numbers of double-labeled neurons were only ∼50% higher on that side. As a consequence, the percentage of double-labeled neurons on the contralateral side was consistently about twice that on the ipsilateral side.
The only other site with substantial numbers of double-labeled neurons was the RVLM. Again, the largest numbers of double-labeled neurons were seen after T5–T10 injections (27% of retrogradely labeled neurons on the ipsilateral side and 30% on the contralateral side). Despite the fact that there were more retrogradely labeled neurons in the ipsilateral RVLM after T1–T4 injections, the numbers of double-labeled cells in the RVLM on the two sides of the brain were comparable after injections at all spinal levels. T11–L1 injections produced especially small numbers of double-labeled neurons in the ventrolateral medulla.
The A5 region had smaller numbers of double-labeled neurons (5–6%), and again these mostly projected to the rostral and middle thoracic levels and were roughly evenly distributed on the two sides of the brain. Other spinally projecting nuclei had only a few scattered double-labeled neurons. Only an occasional double-labeled neuron was seen in other hypothalamic cell groups, including the ventral and lateroposterior parvicellular PVH, the lateral hypothalamic area, and the retrochiasmatic area and lateral arcuate nucleus. Only an infrequent double-labeled cell was seen in the Kölliker-Fuse nucleus or the NTS. No double-labeled cells were seen in the infralimbic cortex, ventromedial medulla, or periaqueductal gray matter.
DISCUSSION
Fever after intravenous LPS involves widespread activation of neurons in the forebrain and the brainstem, as well as sympathetic preganglionic neurons in the spinal cord. Yet the forebrain and brainstem neurons that appear to contribute directly to the sympathetic response in our model are remarkably restricted. Most of the spinally projecting neurons that show Fos activation are found in two cell groups, the dorsal parvicellular PVH and the RVLM, with a much smaller contribution from the A5 region (Fig. 5). Surprisingly, the numbers of double-labeled neurons on the two sides of the brain were very similar, despite a heavy ipsilateral predominance in most of these spinally projecting cell groups. Equally surprising is that the same pattern of restricted double-labeling was encountered after injections at each level of the spinal cord, and that by far the highest percentage of double-labeled neurons was seen after mid-thoracic injections. The relative sparseness of double-labeled neurons in the other hypothalamic cell groups that project to the spinal cord indicates that the organizational pattern of the hypothalamic projection to the IML may be functional rather than topographic. This insight suggests a far different pattern of hypothalamic organization and function than had previously been recognized.
Fig. 5.

A summary diagram illustrating the mechanisms that produce fever responses to intravenous injection of LPS. LPS acts on vascular-associated cells, which produce both cytokines and prostaglandins. However, the effect of cytokines on fever is prostaglandin dependent, so that prostaglandins, particularly prostaglandin E2 (PGE2), are thought to mediate the tissue response. PGE2 acts on neurons in the anteroventral part of the preoptic area that in turn activate neurons in the dorsal parvicellular PVH. PVH activation is necessary to produce fever, although PGE2 may also act directly on areas in the brainstem, such as the A5 cell group and rostral ventrolateral medulla, which receive PVH output as well. The outflow from a restricted group of neurons, in the PVH, RVLM, and to a lesser extent the A5 noradrenergic group, is thought to contact sympathetic preganglionic neurons at all levels of the thoracic spinal cord, producing patterns of activity in brown adipose tissue (BAT), the heart, the adrenal gland, and vasculature (redirection of blood flow, e.g., vasconstriction of the tail artery), which elevate body temperature.
Technical considerations
To label hypothalamic neurons projecting to the spinal cord, we aimed our injections at the IML. However, our injections were relatively large, covering much of the intermediate gray matter in most cases. Although there was limited diffusion into the white matter of the lateral funiculus (the propriospinal fibers provide a diffusion barrier), some Fluorogold might have been taken up by fibers of passage (Tucker and Saper, 1985). However, similar numbers of PVH neurons were retrogradely labeled from injections at the T11–L1 and the T1–T4 levels. In addition, T5–T10 injections produced fewer retrogradely labeled neurons but more double-labeled neurons than did the T1–T4 injections. These observations would not be consistent with the double-labeled neurons being caused by uptake of tracer by fibers of passage.
Uptake of tracer might also have occurred from spinal gray areas other than the IML. However, the cell groups that contained double-labeled neurons have been shown by anterograde tracer studies to project specifically to the sympathetic preganglionic neurons in the spinal cord. Their other major spinal target is the superficial layer of the dorsal horn, which was not included in any of the injection sites. Hence, the retrograde labeling in the PVH and RVLM in this study almost certainly represents uptake from the sympathetic preganglionic nuclei.
The similar numbers of double-labeled cells on the two sides of the brain may indicate that neurons that participate in the fever response project in equal numbers to the ipsilateral or contralateral spinal cord. However, an alternative explanation may be that the individual LPS-activated neurons project to both sides of the spinal cord. This possibility could be tested experimentally with double retrograde tracers.
Although expression of Fos-like immunoreactivity provides a powerful method to identify neurons that are biochemically (and therefore presumably synaptically) activated during the fever response, this method does not exclude the participation of other cell groups; for example, inhibitory responses that may be of equal importance would not be expected to elicit Fos expression (Chan et al., 1993; Kovacs and Sawchenko, 1993). Nevertheless, the presence of Fos expression in a restricted population of neurons during a physiological response such as fever gives the opportunity to assess the connectivity of subsets of neurons that do participate in that response.
The role of the sympathetic nervous system during fever
Our observations confirmed those of Tkacs and Strack (1995)that neurons at all levels of the sympathetic preganglionic column in the IML show Fos expression during a fever response. The sympathetic preganglionic neurons are topographically organized with respect to their tissue targets (Fig. 5). For example, preganglionic neurons in the upper thoracic (T1–T4) levels mediate thermogenesis by brown adipose tissue (Rothwell and Stock, 1984; Bamshad et al., 1999), which is a key mechanism used by rats to control heat production and body temperature (Lowell and Flier, 1997). Sympathetic preganglionic neurons in the T2–T5 levels are important for control of the heart (Strack et al., 1989a; Jansen et al., 1995), and increased cardiac output is necessary to support the hypermetabolic demands of the febrile state. Preganglionic neurons in the T4–T12 levels of the spinal cord innervate the adrenal gland and induce the secretion of catecholamines, which ready the cardiovascular system and intermediary metabolism for increased energy expenditure (Strack et al., 1988, 1989b; Jansen et al., 1995). Lower thoracic and upper lumbar (T11–L1) sympathetic preganglionic neurons are important for thermal regulation by vasoconstriction of the tail artery, thus reducing heat loss (Smith et al., 1998). Each of these responses contributes to the production of fever.
The paraventricular nucleus and fever
In our earlier studies, we found that many forebrain components of the central autonomic control system showed Fos expression after high dosages of LPS (Elmquist et al., 1996). However, the parvicellular PVH was the only component of this system to show Fos expression at every dosage and time point at which intravenous injection of LPS produced fever. Others have found similar results for intraperitoneal injections of LPS (Wan et al., 1993; Sagar et al., 1995; Konsman et al., 1999) and intravenous or intraperitoneal injection of interleukin-1β (Rivest et al., 1992; Ericsson et al., 1994; Day and Akil, 1996). When we injected threshold doses (1 ng) of prostaglandin E2 into the ventromedial preoptic area, fever was consistently and selectively associated with Fos activation in the dorsal and lateroposterior parvicellular PVH (Scammell et al., 1996). These observations suggested that PVH neurons may transmit the signal to sympathetic preganglionic neurons causing their activation during fever. This possibility is supported by experiments in which lesions of the PVH have prevented fever responses (Horn et al., 1994).
It is striking that after intravenous LPS, the dorsal parvicellular PVH was the only forebrain cell group in which substantial numbers of double-labeled neurons were found. More than 10 times as many neurons with direct spinal projections were found in other hypothalamic cell groups (Table 1), but few double-labeled neurons were found in these locations. These results suggest that the dorsal parvicellular PVH specifically innervates the sympathetic preganglionic neurons in the spinal cord that regulate LPS-induced fever. The remarkable specificity of the double-labeling in the PVH suggests that the hypothalamo-autonomic neurons may be organized in functional anatomical units rather than along anatomically topographic lines, as in sensory and motor systems, e.g., the corticospinal and dorsal column sensory systems. Several different neuropeptides have been identified in the dorsal parvicellular PVH (Cechetto and Saper, 1988), and it would be interesting to determine whether functionally specific subpopulations also use a common neurotransmitter.
Previous attempts to demonstrate anatomically topographic ordering to the hypothalamo-spinal or RVLM-spinal projections have failed to find evidence for an anatomical topographic pattern of projection (Tucker and Saper, 1985; Jansen et al., 1995; Lynn et al., 1996). These results led Jansen and colleagues (1995) to propose the concept of hypothalamic “command neurons,” which can activate a wide variety of target tissues in the service of a particular physiological function. However, the organization of neurons controlling a specific autonomic response pattern was not identified.
Our findings provide a simple and powerful model of functional organization within the hypothalamus. We find that fever activates a single population of hypothalamo-spinal neurons in the dorsal parvicellular PVH. We infer that the projections of individual neurons are probably widespread because a large and similar percentage of the dorsal parvicellular group is retrogradely labeled from each spinal level. We found a maximum of approximately 30 such neurons on each side of the brain in our 1:4 series of section. Our methods do not allow an accurate estimate of the total number of such cells, but it appears that a relatively small number of PVH neurons, perhaps as few as 100 on each side of the brain, may constitute a master population for producing a pattern of sympathetic responses that leads to an elevation of body temperature during a fever.
This radical suggestion is supported by recent findings from our laboratory in studying the Fos response to a very different physiological stimulus, the administration of intravenous leptin, which also activates the sympathetic nervous system and increases energy expenditure. In those studies, we also found a highly restricted population of hypothalamic neurons that project to the spinal cord and are Fos-activated (Elias et al., 1998). Remarkably, very few of the many PVH and lateral hypothalamic neurons that project to the spinal cord were double-labeled. However, a high percentage of lateral arcuate and retrochiasmatic neurons that project to the spinal cord (and are known to innervate the IML) showed double-labeling. This specificity supports the hypothesis that the anatomical unit of organization of the hypothalamus may be a functional rather than a topographic target.
Footnotes
This work was supported in part by United States Public Health Service Grants NS33987, MH56537, and DK53301. We thank Quan Ha and Minh Ha for expert technical assistance, and Thomas E. Scammell for helpful discussion and comments on this manuscript.
Correspondence should be addressed to Dr. C. B. Saper, Department of Neurology, Beth Israel Deaconess Medical Center, 330 Brookline Avenue, Boston, MA 02215. E-mail:csaper@caregroup.harvard.edu.
REFERENCES
- 1.Bamshad M, Song CK, Bartness TJ. CNS origins of the sympathetic nervous system outflow to brown adipose tissue. Am J Physiol. 1999;276:R1569–R1578. doi: 10.1152/ajpregu.1999.276.6.R1569. [DOI] [PubMed] [Google Scholar]
- 2.Cechetto DF, Saper CB. Neurochemical organization of the hypothalamic projection to the spinal cord in the rat. J Comp Neurol. 1988;272:579–604. doi: 10.1002/cne.902720410. [DOI] [PubMed] [Google Scholar]
- 3.Chan RKW, Brown ER, Ericsson A, Kovacs KJ, Sawchenko PE. A comparison of two immediate early genes, c-fos and NGFI-B, as markers for functional activation in stress-related neuroendocrine circuitry. J Neurosci. 1993;13:5126–5138. doi: 10.1523/JNEUROSCI.13-12-05126.1993. [DOI] [PMC free article] [PubMed] [Google Scholar]
- 4.Day HE, Akil H. Differential pattern of c-fos mRNA in rat brain after central and systemic administration of interleukin-1-beta: implications for mechanism of action. Neuroendocrinology. 1996;63:207–218. doi: 10.1159/000126959. [DOI] [PubMed] [Google Scholar]
- 5.Elias CF, Lee C, Kelly J, Aschkenasi C, Ahima RS, Couceyro PR, Kuhar MJ, Saper CB, Elmquist JK. Leptin activates hypothalamic CART neurons projecting to the spinal cord. Neuron. 1998;21:1375–1385. doi: 10.1016/s0896-6273(00)80656-x. [DOI] [PubMed] [Google Scholar]
- 6.Elmquist JK, Saper CB. Activation of neurons projecting to the paraventricular hypothalamic nucleus by intravenous lipopolysaccharide. J Comp Neurol. 1996;374:315–331. doi: 10.1002/(SICI)1096-9861(19961021)374:3<315::AID-CNE1>3.0.CO;2-4. [DOI] [PubMed] [Google Scholar]
- 7.Elmquist JK, Scammell TE, Jacobson CD, Saper CB. Distribution of Fos-like immunoreactivity in the rat brain following intravenous lipopolysaccharide administration. J Comp Neurol. 1996;371:85–103. doi: 10.1002/(SICI)1096-9861(19960715)371:1<85::AID-CNE5>3.0.CO;2-H. [DOI] [PubMed] [Google Scholar]
- 8.Elmquist JK, Scammell TE, Saper CB. Mechanisms of CNS response to systemic immune challenge: the febrile response. Trends Neurosci. 1997;20:565–570. doi: 10.1016/s0166-2236(97)01138-7. [DOI] [PubMed] [Google Scholar]
- 9.Elmquist JK, Ahima RS, Elias CF, Flier JS, Saper CB. Leptin activates distinct projections from the dorsomedial and ventromedial hypothalamic nuclei. Proc Natl Acad Sci USA. 1998;95:741–746. doi: 10.1073/pnas.95.2.741. [DOI] [PMC free article] [PubMed] [Google Scholar]
- 10.Ericsson A, Kovacs KJ, Sawchenko PE. A functional anatomical analysis of central pathways subserving the effects of interleukin-1 on stress-related neuroendocrine neurons. J Neurosci. 1994;14:897–913. doi: 10.1523/JNEUROSCI.14-02-00897.1994. [DOI] [PMC free article] [PubMed] [Google Scholar]
- 11.Helke CJ, Neil JJ, Massari VJ, Loewy AD. Substance P neurons project from the ventral medulla to the intermediolateral cell column and ventral horn in the rat. Brain Res. 1982;243:147–152. doi: 10.1016/0006-8993(82)91128-3. [DOI] [PubMed] [Google Scholar]
- 12.Herbert H, Moga MM, Saper CB. Connections of the parabrachial nucleus with the nucleus of the solitary tract and the medullary reticular formation in the rat. J Comp Neurol. 1990;293:540–580. doi: 10.1002/cne.902930404. [DOI] [PubMed] [Google Scholar]
- 13.Horn T, Wilkinson MF, Landgraf R, Pittman QJ. Reduced febrile responses to pyrogens after lesions of the hypothalamic paraventricular nucleus. Am J Physiol. 1994;267:R323–R328. doi: 10.1152/ajpregu.1994.267.1.R323. [DOI] [PubMed] [Google Scholar]
- 14.Hurley KM, Herbert H, Moga MM, Saper CB. Efferent projections of the infralimbic cortex of the rat. J Comp Neurol. 1991;308:249–276. doi: 10.1002/cne.903080210. [DOI] [PubMed] [Google Scholar]
- 15.Jansen ASP, Nguyen XV, Karpitskiy V, Mettenleiter TC, Loewy AD. Central command neurons of the sympathetic nervous system: basis of the fight-or-flight response. Science. 1995;270:644–646. doi: 10.1126/science.270.5236.644. [DOI] [PubMed] [Google Scholar]
- 16.Jansen ASP, Hoffman JL, Loewy AD. CNS sites involved in sympathetic and parasympathetic control of the pancreas: a viral tracing study. Brain Res. 1997;766:29–38. doi: 10.1016/s0006-8993(97)00532-5. [DOI] [PubMed] [Google Scholar]
- 17.Kononen J, Koistinaho J, Alho H. Circadian rhythm in c-fos-like immunoreactivity in the rat brain. Neurosci Lett. 1990;120:105–108. doi: 10.1016/0304-3940(90)90179-d. [DOI] [PubMed] [Google Scholar]
- 18.Konsman JP, Kelley K, Dantzer R. Temporal and spatial relationships between lipopolysaccharide-induced expression of Fos, interleukin-1beta and inducible nitric oxide synthase in rat brain. Neuroscience. 1999;89:535–548. doi: 10.1016/s0306-4522(98)00368-6. [DOI] [PubMed] [Google Scholar]
- 19.Kovacs KJ, Sawchenko PE. Mediation of osmoregulatory influences on neuroendocrine corticotropin-releasing factor expression by the ventral lamina terminalis. Proc Natl Acad Sci USA. 1993;90:7681–7685. doi: 10.1073/pnas.90.16.7681. [DOI] [PMC free article] [PubMed] [Google Scholar]
- 20.Kuypers HGJM, Maisky VA. Retrograde axonal transport of horseradish peroxidase from spinal cord to brain stem cell groups in the cat. Neurosci Lett. 1975;1:9–14. doi: 10.1016/0304-3940(75)90004-x. [DOI] [PubMed] [Google Scholar]
- 21.Loewy AD. Descending pathway to sympathetic and parasympathetic preganglionic neurons. J Auton Nerv Syst. 1981;3:265–275. doi: 10.1016/0165-1838(81)90068-0. [DOI] [PubMed] [Google Scholar]
- 22.Loewy AD, Burton H. Nuclei of the solitary tract: efferent projections to the lower brain stem and spinal cord of the cat. J Comp Neurol. 1978;181:421–450. doi: 10.1002/cne.901810211. [DOI] [PubMed] [Google Scholar]
- 23.Lowell BB, Flier JS. Brown adipose tissue, beta 3-adrenergic receptors, and obesity. Annu Rev Med. 1997;48:307–316. doi: 10.1146/annurev.med.48.1.307. [DOI] [PubMed] [Google Scholar]
- 24.Lynn RB, Cao G-Y, Yang M, Miselis RR. Pseudorabies virus labeling of bombesin-1 neurons in the paraventricular nucleus of the hypothalamus controlling gastric function. Soc Neurosci Abstr. 1996;26:81. [Google Scholar]
- 25.McKellar S, Loewy AD. Efferent projections of the A1 catecholamine cell group in the rat: an autoradiographic study. Brain Res. 1982;241:11–29. doi: 10.1016/0006-8993(82)91224-0. [DOI] [PubMed] [Google Scholar]
- 26.Moga MM, Saper CB. Neuropeptide-immunoreactive neurons projecting to the paraventricular hypothalamic nucleus in the rat. J Comp Neurol. 1994;346:137–150. doi: 10.1002/cne.903460110. [DOI] [PubMed] [Google Scholar]
- 27.Moga MM, Herbert H, Hurley KM, Yasui Y, Gray TS, Saper CB. Organization of the cortical, basal forebrain, and hypothalamic afferents to parabrachial nucleus in the rat. J Comp Neurol. 1990;295:624–661. doi: 10.1002/cne.902950408. [DOI] [PubMed] [Google Scholar]
- 28.Rivest S, Torres G, Rivier C. Differential effects of central and peripheral injection of interleukin-1β on brain c-fos expression and neuroendocrine functions. Brain Res. 1992;587:13–23. doi: 10.1016/0006-8993(92)91424-d. [DOI] [PubMed] [Google Scholar]
- 29.Ross CA, Ruggiero DA, Joh TH, Park DH, Reis DJ. Rostral ventrolateral medulla: selective projections to the thoracic autonomic cell column from the region containing C1 adrenaline neurons. J Comp Neurol. 1984;228:168–185. doi: 10.1002/cne.902280204. [DOI] [PubMed] [Google Scholar]
- 30.Rothwell NJ, Stock MJ. Effects of denervating brown adipose tissue on the responses to cold, hyperphagia and noradrenaline treatment in the rat. J Physiol (Lond) 1984;355:457–463. doi: 10.1113/jphysiol.1984.sp015431. [DOI] [PMC free article] [PubMed] [Google Scholar]
- 31.Sagar SM, Price KJ, Kasting NW, Sharp FR. Anatomic patterns of FOS immunostaining in rat brain following systemic endotoxin administration. Brain Res Bull. 1995;36:381–392. doi: 10.1016/0361-9230(94)00217-o. [DOI] [PubMed] [Google Scholar]
- 32.Saper CB. Central autonomic system. In: Paxinos G, editor. The rat nervous system. Academic; San Diego: 1995. pp. 122–123. [Google Scholar]
- 33.Saper CB, Loewy AD. Efferent connections of the parabrachial nucleus in the rat. Brain Res. 1980;197:291–317. doi: 10.1016/0006-8993(80)91117-8. [DOI] [PubMed] [Google Scholar]
- 34.Saper CB, Loewy AD, Swanson LW, Cowan WM. Direct hypothalamo-autonomic connections. Brain Res. 1976;117:305–312. doi: 10.1016/0006-8993(76)90738-1. [DOI] [PubMed] [Google Scholar]
- 35.Sawchenko PE, Swanson LW. Immunohistochemical identification of neurons in the paraventricular nucleus of the hypothalamus that project to the medulla or to the spinal cord in the rat. J Comp Neurol. 1982;205:260–272. doi: 10.1002/cne.902050306. [DOI] [PubMed] [Google Scholar]
- 36.Scammell TE, Elmquist JK, Griffin JD, Saper CB. Ventromedial preoptic prostaglandin E2 activates fever-producing autonomic pathways. J Neurosci. 1996;16:6246–6254. doi: 10.1523/JNEUROSCI.16-19-06246.1996. [DOI] [PMC free article] [PubMed] [Google Scholar]
- 37.Smith JE, Jansen ASP, Gilbey MP, Loewy AD. CNS cell groups projecting to sympathetic outflow of tail artery: neural circuits involved in heat loss in the rat. Brain Res. 1998;786:153–164. doi: 10.1016/s0006-8993(97)01437-6. [DOI] [PubMed] [Google Scholar]
- 38.Strack AM, Sawyer WB, Marubio LM, Loewy AD. Spinal origin of sympathetic preganglionic neurons in the rat. Brain Res. 1988;455:187–191. doi: 10.1016/0006-8993(88)90132-1. [DOI] [PubMed] [Google Scholar]
- 39.Strack AM, Sawyer WB, Hughes JH, Platt KB, Loewy AD. A general pattern of CNS innervation of the sympathetic outflow demonstrated by transneuronal pseudorabies viral infections. Brain Res. 1989a;491:156–162. doi: 10.1016/0006-8993(89)90098-x. [DOI] [PubMed] [Google Scholar]
- 40.Strack AM, Sawyer WB, Platt KB, Loewy AD. CNS cell groups regulating the sympathetic outflow to adrenal gland as revealed by transneuronal cell body labeling with pseudorabies virus. Brain Res. 1989b;491:274–296. doi: 10.1016/0006-8993(89)90063-2. [DOI] [PubMed] [Google Scholar]
- 41.Tkacs NC, Strack AM. Systemic endotoxin induces Fos-like immunoreactivity in rat spinal sympathetic regions. J Auton Nerv Syst. 1995;51:1–7. doi: 10.1016/0165-1838(95)80001-q. [DOI] [PubMed] [Google Scholar]
- 42.Tucker DC, Saper CB. Specificity of spinal projections from hypothalamic and brainstem areas which innervate sympathetic preganglionic neurons. Brain Res. 1985;360:159–164. doi: 10.1016/0006-8993(85)91231-4. [DOI] [PubMed] [Google Scholar]
- 43.Tucker DC, Saper CB, Ruggiero DA, Reis DJ. Organization of central adrenergic pathways: I. Relationships of ventrolateral medullary projections to the hypothalamus and spinal cord. J Comp Neurol. 1987;259:591–603. doi: 10.1002/cne.902590408. [DOI] [PubMed] [Google Scholar]
- 44.Wan W, Janz L, Vriend CY, Sorensen CM, Greenberg AH, Nance DM. Differential induction of c-Fos immunoreactivity in hypothalamus and brain stem nuclei following central and peripheral administration of endotoxin. Brain Res Bull. 1993;32:581–587. doi: 10.1016/0361-9230(93)90158-8. [DOI] [PubMed] [Google Scholar]