

Abstract
Cortical processing of change in direction of a perceived sound source was investigated in 12 human subjects using whole-head magnetoencephalography. The German word “da” was presented either with or without 0.7 msec interaural time delays to create the impression of right- or left-lateralized or midline sources, respectively. Midline stimuli served as standards, and lateralized stimuli served as deviants in a mismatch paradigm. Two symmetrically linked dipoles fitted to the mismatch fields showed stronger moments in the hemisphere contralateral to the side of the deviant. The right dipole displayed equal latencies to both left and right deviants, whereas left dipole latencies were longer for ipsilateral than contralateral deviants. Frequency analysis between 20–70 Hz and statistical probability mapping revealed increased induced gamma-band activity at 53 ± 2.5 Hz to both types of deviants. Right deviants elicited spectral amplitude enhancements in this frequency range, peaking at latencies of 160 and 240 msec. These effects were localized bilaterally over the angular gyri and posterior temporal regions. Coherence analysis suggested the existence of two separate interhemispheric networks. For left-lateralized deviants, both spectral amplitude enhancements at 110 and 220 msec and coherence increases were restricted to the right hemisphere. In conclusion, both mismatch dipole latencies at the supratemporal plane and gamma-band activity in posterior parietotemporal areas suggested a right hemisphere engagement in the processing of bidirectional sound-source shifts. In contrast, left-hemisphere regions responded predominantly to contralateral events. These findings may help to elucidate phenomena such as unilateral auditory neglect.
Keywords: sound-source lateralization, magnetoencephalogram (MEG), mismatch response, dipole latency, gamma-band activity (GBA), coherence, posterior parietal cortex, auditory dorsal stream, human subjects
The ability to detect the location of sounds in space represents a remarkable property of the auditory system. Within the tactile or visual domains, the encoding of spatial information relies on the topographic organization of the receptor sheet and the projection targets. In contrast, the brain must compute the direction of a sound source on the basis of cues arising at both ears, such as interaural intensity and time differences (Middlebrooks and Green, 1991; King and Carlile, 1995), as well as spectral differences attributable to localization-dependent filtering properties of head and outer ear (Kulkarni and Colburn, 1998). Structures at different levels of the auditory pathway, e.g., the superior colliculus, respond to auditory space cues (King and Hutchings, 1987). The ability to localize sounds nevertheless depends on the integrity of the auditory cortex, especially in higher mammalian species (Heffner and Heffner, 1990; cf. Furukawa et al., 2000), because unilateral temporal dysfunctions impair sound localization within the contralesional hemifield (Jenkins and Masterton, 1982; Heffner, 1997). Similarly, electroencephalographic (EEG) and magnetoencephalographic (MEG) evoked responses to both monaural (Reite et al., 1981; Mäkelä et al., 1993) and lateralized binaural stimuli revealed increased auditory cortex activations to contralateral stimuli (McEvoy et al., 1993; Sams et al., 1993; Loveless et al., 1994; but see Woldorff et al., 1999).
However, deficits in the localization of sounds, particularly in the left hemifield, may also arise as sequelae of right parietal lesions in patients with unilateral neglect (Bisiach et al., 1984; De Renzi et al., 1989; Pinek et al., 1989; Petersen et al., 1994; Griffiths et al., 1996; Soroker et al., 1997). Accordingly, both positron emission and functional magnetic resonance tomographic studies in humans demonstrated conscious perception of sound lateralization and movement to involve cortical areas outside the primary auditory cortex, such as the right insula (Griffiths et al., 1994), the right posterior planum temporale (Baumgart et al., 1999), and the right posterior parietal cortex (Griffiths et al., 1998; Bushara et al., 1999; Weeks et al., 1999). These latter findings suggest predominant activation of right parietal association cortex during auditory spatial processing.
The present study investigated the time course and topography of magnetoencephalographic responses to changes in sound-source direction. First, moments and latencies of mismatch dipoles at the bilateral auditory cortices on the superior temporal gyrus were assessed in response to left and right lateralized deviant sounds (Paavilainen et al., 1989; Näätänen, 1990, 1992;Näätänen and Alho, 1995). Stronger dipole moments were expected contralaterally to the side of the deviant. Second, because mental representations may be related to oscillatory neuronal cell assembly responses that are not phase-locked to stimulus onset (Jokeit and Makeig, 1994; Singer, 1995; Tallon-Baudry and Bertrand, 1999), we investigated induced gamma-band activity (GBA) to lateralized deviants compared with midline standards using spatiotemporal statistical probability mapping and coherence analysis. Because the coding of lateralized auditory events may depend on networks in right posterior parietal cortex, we expected GBA enhancements in this region in response to changes in sound-source direction.
MATERIALS AND METHODS
Subjects
Twelve paid healthy adult volunteers (four females, eight males; mean ± SD age, 29 ± 2 years) participated in the present investigation. Audiometry before the experiment showed normal hearing in all subjects with thresholds below 30 dB (sound pressure level) at 1000 Hz for each ear. All participants were right-handed as measured with the Edinburgh Handedness Inventory (Oldfield, 1971). The study had been approved by the ethics committee of the University of Tübingen Medical Faculty.
Stimulus material
The German monosyllabic word “da” (English, “there”), synthesized by means of commercially available software (Computerized Speech Lab CSL 4300; Kay Elemetrics, Lincoln Park, NJ) with a frame length of 10 msec, a sampling rate of 12,500 Hz, and pulse excitation for voiced portions, served as auditory stimulus. The duration of this consonant–vowel syllable was 190 msec (voice onset time, 10 msec). The stimulus comprised the following linear transitions extending across 30 msec: onset, 548, 1834, and 3441 Hz; steady states, 816, 1182, and 2631 Hz. To obtain natural-sounding stimuli, two additional stationary formants at 4300 and 4900 Hz were added, and formant bandwidths were manually adjusted. The monotonous fundamental frequency of the vocalic portion of the syllable amounted to 128 Hz. For technical reasons, i.e., adaptation to the personal computer used for syllable presentation, the stimulus had to be resampled at 11,127 Hz (Ackermann et al., 1999). Sound intensity amounted to 75 dB (sound pressure level).
The stimulus was presented binaurally with either no time delay between ears, giving the impression of a source in the midsagittal plane or interaural time delays of 0.7 msec, yielding the perception of events lateralized at ∼70°. There were two versions of lateralized presentations, with the leading stimulus on either the left or the right side, giving the impression of left- and right-lateralized sounds, respectively. Note that midline and lateralized stimuli only differed in interaural onset time delay and phase shift, lacking any differences in the power of the signals.
Procedure
Subjects were seated upright in a magnetically shielded room (Vakuum-Schmelze, Hanau, Germany). They were instructed to sit still and keep their eyes open, looking at a fixation cross in the center of their visual field ∼2 m in front of them. Stimuli were presented via binaural air-conducting tubes with ear inserts. A total of 900 midline and lateralized stimuli were presented in an oddball manner with 80% of presentations without interaural time delay and 10% each of right- and left-leading lateralized sounds. The sequence of deviants and standards was randomized with the constraint that there were no more than two consecutive deviants. The onset-to-onset interstimulus interval was 805 msec.
MEG Recordings
MEG was recorded with a whole-head system (CTF Inc., Vancouver, Canada) comprising 143 hardware first-order magnetic gradiometers distributed with an average distance between sensors of 2.5 cm. The subject's head position was determined with localization coils fixed at the nasion and the preauricular points at both the beginning and end of each recording. Recordings with head movements exceeding 0.5 cm were repeated. The signals were sampled at a rate of 250 Hz with an anti-aliasing filter at 80 Hz. To minimize artifacts, trials with signals exceeding 1.3 pT in frontal channels were rejected. Epoch length was 600 msec, including a 48 msec prestimulus baseline.
Data analysis
The following trials were entered in both evoked magnetic field and induced GBA analyses described below. Only responses to a single deviant in a train of standards or to the first of two consecutive deviants were included. Moreover, trials contaminated with artifacts were rejected, leaving an average of 72 deviants of each type per subject. Trials for standards were selected as follows. First, 130 standard trials were chosen at random from the middle 500 trials of the complete stimulus sequence. Then, of these 130 trials, the first 72 artifact-free trials of standards not directly following a deviant were selected for analysis. The number of selected standard trials was matched to the number of deviants to ensure that equal numbers of trials entered the averages for each type of stimulus. The same set of standards was used for comparisons with both left and right deviants.
Mismatch magnetic fields
After baseline correction and artifact rejection, MEG data were digitally filtered between 1 and 40 Hz. The averaged evoked magnetic fields for the difference between standard and deviant sounds were assessed for both types of lateralized deviants. To evaluate strength, latency, and origin of these magnetic equivalents to the electrocortical mismatch negativity (Paavilainen et al., 1989), a dipole localization technique was used. Two symmetrically linked dipoles (one in each hemisphere) were fitted to the grand average across subjects of the difference fields between standards and both deviants in a time window comprising the mismatch peaks. Symmetrically linked, fixed dipoles were used to allow for direct comparison of latencies and moments. The time course of source strength of each of these dipoles was computed for both deviants during an interval of 50 msec prestimulus to 220 msec poststimulus onset. Latencies were determined by means of an interactive graphical computer program. Statistical analysis relied on separate ANOVAs for dipole moments and peak latencies, with hemisphere (right vs left) and side of deviant (right vs left) as within-subject factors.
Induced GBA
Frequency analysis of broad-band signals (20–70 Hz).Frequency analysis of MEG was performed in the range of 20–70 Hz over each complete epoch of 48 msec prestimulus to 552 msec poststimulus onset for each of the deviants and standards. Selecting a 600 msec time window resulted in records of 150 points, which were zero-padded to obtain 256 points. To reduce the frequency leakage for the different frequency bins, the records were multiplied by Welch windows, as recommended by Press et al. (1992). Subsequent Fast Fourier Transform yielded 50 spectral power values in the frequency range of 20–70 Hz. The frequency resolution corresponded to 0.98 Hz (maximum frequency, 125 Hz divided by 128 power values). Then, square roots of power values were computed to obtain more normally distributed spectral amplitude values. These values were averaged across epochs to obtain measures of nonphase-locked spectral activity for each of the two deviants and for standards. Nonphase-locked or “induced” oscillatory activity is distinguished from phase-locked or “evoked” activity in that the former is obtained by conducting spectral analysis of each recording epoch and subsequent averaging of the resulting frequency power values, whereas the latter is computed by subjecting the average across the raw signals in each epoch to a subsequent frequency analysis. Gamma-band oscillations of distributed cells found in the visual cortex of both anesthetized and awake animals were not phase-locked to the onset of a stimulus (Eckhorn et al., 1988; Gray and Singer, 1989; Gray and Viana di Prisco, 1997). Similarly, induced, but not evoked, GBA recorded from humans with EEG or MEG has been related to feature binding and object representation (Lutzenberger et al., 1995, 1997;Tallon et al., 1995; Müller et al., 1996, 1997; Keil et al., 1999). Therefore, we restricted our frequency analysis to nonphase-locked, induced oscillatory activity.
Statistical probability mapping of broad-band signals (20–70 Hz). Differences in spectral amplitude between standards and each deviant were assessed with paired, two-sided t tests for each frequency bin and MEG sensor across the whole subject sample, resulting in 50 (frequency bins) × 143 (sensors) = 7150 tests for each of the two comparisons. t values were converted to p values. p values from two adjacent frequency bins had to meet the criterion of p = 0.005 to be considered significant. This was done as an approximation to the problem of obtaining false positives. The number of two consecutivep values was chosen as a tradeoff between the aims to (1) reduce the risk of chance findings and (2) keep the frequency resolution as high as possible. In addition, a confirmatory statistical analysis was conducted based on randomization tests suggested by Blair and Karniski (1993), which were extended to multichannel data. First, the maximum t value was determined for the observed data across all sensors and across the frequency bins in which the frequency analysis had yielded significant effects. Then, the sign of the task-related spectral amplitude difference was changed for selected frequency bins and for all recording channels per subject. This was done for all 212 possible permutations across subjects. For each permutation, the maximum t value was identified. Finally, the significance of the observed maximumt value was tested relative to the distribution of maximumt values across all 212tests.
Time course of narrow-band signals (53 ± 2.5 Hz). The broad-band frequency analysis described above was based on the full recording interval of 600 msec and thus gave no indication of the time course of the observed gamma spectral amplitude increases. To explore the time course of GBA increases, the data records were again padded to obtain 256 points, multiplied with cosine windows, and filtered in the frequency range in which the broad-band frequency analysis had yielded significant gamma-band spectral amplitude increases to deviant compared with standard stimuli. A noncausal, gaussian curve-shaped Gabor filter in the frequency domain was applied to the signals for each epoch in each of the three conditions. Based on the spectral analysis results across the whole epoch, a filter was used with a center frequency of 53 Hz. The width of this filter was chosen at ±2.5 Hz to reduce potential contamination with 50 Hz background noise. The filtered data were then amplitude-demodulated by means of a Hilbert transformation (Clochon et al., 1996). The filtered and amplitude demodulated spectral amplitude data were then averaged across epochs for each of the three stimulus types, i.e., midline standards and both left and right deviants. Figure1 illustrates the present methodological approach; the raw data records, the signals after Gabor filtering and complex demodulation, and the results of single-trial frequency analysis are shown for representative single trials in one subject and MEG sensor to both a standard and a left deviant.
Fig. 1.

Illustration of the initial steps of single trial analysis shown for one sample trial each of a midline standard (left column) and a left deviant (right column) in one subject and one MEG sensor over the region of the right posterior parietal cortex. The deviant trial was selected because of its particularly large amplitude of the 53 ± 2.5 Hz filtered signal. The top row shows the raw MEG record, and the middle row shows the signal after Gabor filtering in the 53 ± 2.5 Hz range (oscillatory signal) and subsequent complex demodulation via Hilbert transformation (envelope curve). The bottom row gives the result of Fast Fourier Transform of the single trials (amplitude spectrum). Magnetic field amplitudes (in femtoTesla) are plotted on the ordinates of thetop two rows, and spectral amplitudes (in femtoTesla) are plotted in the bottom row. The abscissas show time (in seconds) in the top two rows and frequency (in Hertz) in the bottom row. Note the different scaling in each row.
Differences in the narrow-band amplitudes to midline standards versus left and right deviants were assessed by a statistical mapping procedure similar to the evaluation of spectral amplitude differences in the different frequency bands described above. Note that we were primarily interested in the time course of GBA increases in those MEG sensors in which the broad-band frequency analysis had yielded significant differences. However, for exploratory purposes, it was decided to conduct the narrow-band analysis for all sensors. Thus, paired, two-sided t tests were calculated for amplitudes at every sampling point and sensor for (1) standards compared with left deviants and (2) standards compared with right deviants for the whole subject sample. p values from three adjacent time points (corresponding to a time window of 12 msec) had to meet the criterion of p = 0.05 to be considered significant.
Topographic mapping of induced GBA. To assess the topographic localization of significant amplitude values for the whole group, the sensor positions for each subject were assigned to common spatial coordinates (“common coil system”). To estimate the error that is introduced by this procedure, we used a single dipole localization of the first auditory-evoked component generated by the midline standards. The spatial coordinates of this dipole were determined twice for each subject: (1) for the individual sensor locations and (2) for the representative head model. The comparison of both sets of coordinates enabled the estimation of the error introduced by using the common coil system while disregarding the natural variation across subjects. The differences between individual localization of the dipole source and common coil system ranged between 0.1 and 2.0 cm in the anteroposterior direction (mean ± SD absolute deviation, 0.6 ± 0.2 cm), between 0.0 and 1.2 cm in the left-right direction (mean ± SD, 0.3 ± 0.1 cm) and between 0.0 and 2.3 cm in the superior-inferior direction (mean ± SD, 0.8 ± 0.2 cm). Because no interpolation between sensors was performed, the spatial resolution was determined by the sensor spacing (2.5 cm). The results above thus justified the application of a common coil system. The sensor locations were then projected onto a map with the major anatomical landmarks based on the magnetic resonance image from one representative subject of a previous study.
To elucidate the relationship between the results of the present statistical probability mapping method and possible source structures, this method was applied to the magnetic fields elicited by a single dipole source. Data from right median nerve electric stimulation were used as an example for magnetic fields with a single dipole source structure. Here, spatiotemporal mapping of 40–60 Hz activity in the time range of the early somatosensory-evoked fields (latency, 20 msec) yielded two areas of increased spectral amplitude, corresponding to the regions with highest magnetic field power (Fig.2). However, as will be described below, in the present paradigm, we observed only singular areas of gamma-band activity. This suggested the existence of a different source structure. Whereas a single dipole source elicits a magnetic field with equally strong maxima and minima (ratio of 1), simulating a quadrupolar structure by adding a second dipole with the opposite polarity at 1 cm distance yields a strong maximum between both dipoles but considerably weaker outer field minima (ratio of 7.5) (Fig.3). In further approximation to a circular current, an octopole increases this ratio to 30 (Fig. 3). This means that only the inner maximum circumscribed by the four dipoles remains detectable, whereas the outer minima no longer reach statistical significance. Thus, octopoles or even circular currents may be a parsimonious model to describe the source structure of the present findings. This would imply that the sources are located close to the area below the sensor with the highest GBA.
Fig. 2.
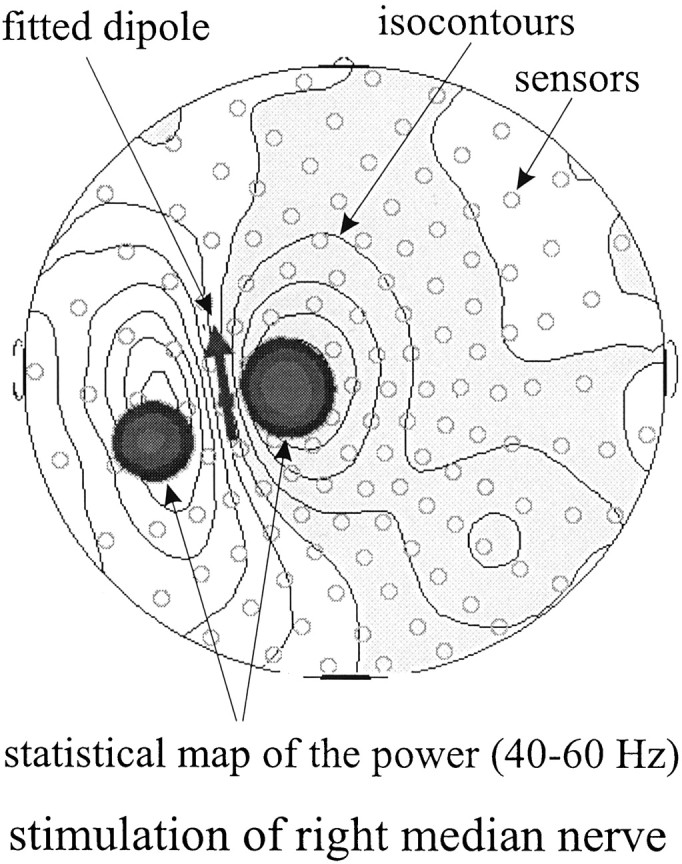
Example of the present statistical probability mapping approach applied to the magnetic fields evoked by right median nerve stimulation. Isocontour lines are plotted onto a head model seen from above (nose up). The dark arrow represents the fitted single dipole. Superimposed dark areas show two regions of significant spectral amplitude increases in the 40–60 Hz range as yielded by the statistical probability mapping procedure used in the present study.
Fig. 3.

Models of magnetic fields elicited by different source structures. Head models (top) illustrate fields of single dipoles (moments, 10 nA) with opposite orientations (top left and center). Combination of those two dipoles arranged parallel at a distance of 1 cm creates a quadrupole, with the field distribution depicted on the top right. Whereas single dipoles elicit equal field maxima and minima with 160 and −160 fT, respectively (ratio of 1), the quadrupole shows a strong inner field maximum (150 fT) and weaker outer minima (−20 fT; ratio of 7.5); see bottom of the figure. In further approximation to a circular source structure, an octopole consisting of four dipoles (bottom) enhances the imbalance between a strong inner maximum (300 fT) and a weak outer field (−10 fT; ratio of 30) even more.
Coherence analysis. As feature binding and mental representations are thought to be related to the activity of coherently oscillating cortical networks (Singer, 1995; Miltner et al., 1999), gamma-band coherence was investigated to elucidate the relationships between the areas with significant GBA increase to deviant compared with midline stimuli. Coherence between two waveforms x andy is defined as γxy2(f) = (Gxy(f))2/(Gxx(f)Gyy(f)), where Gxy(f) is the mean cross-power spectral density, andGxx(f) andGyy(f) are the respective mean autopower spectral densities (Glaser and Ruchkin, 1976). Coherence was computed in frequency bins between 50 and 55 Hz for all pairwise combinations of those MEG sensors with a significant GBA increase to lateralized deviants compared with standards and all other sensors. The computational procedure to obtain coherence involved first computing the mean power spectra for x andy and then the mean normalized cross-spectra. Because complex analyses are involved, this produced the cospectrum (r for real) and the quadspectrum (q for imaginary). Then, coherence was computed as γxy2 = (rxy2 +qxy2)/(GxxGyy). Differences in coherence between standards and deviants were evaluated statistically in the whole sample, following again the principles described above; ttests were calculated for each sensor pair, and t values were converted to p values. p values from three adjacent frequency bins had to meet the criterion of p= 0.05 to be considered significant.
RESULTS
Mismatch magnetic fields
Figure 4a shows the mismatch evoked magnetic fields in isocontour plots at time points 110 and 150 msec poststimulus, and Figure 4b shows superimposed field amplitudes for left and right deviants. The symmetrically linked dipoles fitted to the mismatch fields were localized at the supratemporal plane (Fig. 4c). These two dipoles explained >95% of the variance. The time course and magnitude of both left and right dipoles to left and right deviants are depicted in Figure5. A hemisphere × side of deviant interaction emerged for dipole moment (F(1,11) = 16.7, p = 0.002), in the absence of any main effects. As expected, the left dipole was stronger for deviants lateralized to the right than to the left (right deviant, 27.2 ± 5.2 nA; left deviant, 19.7 ± 3.8 nA; t(11) = 2.60;p = 0.025). Conversely, the right dipole was stronger for left than for right deviants (left deviant, 28.8 ± 4.3 nA; right deviant, 21.9 ± 3.9 nA;t(11) = 3.18; p = 0.009).
Fig. 4.
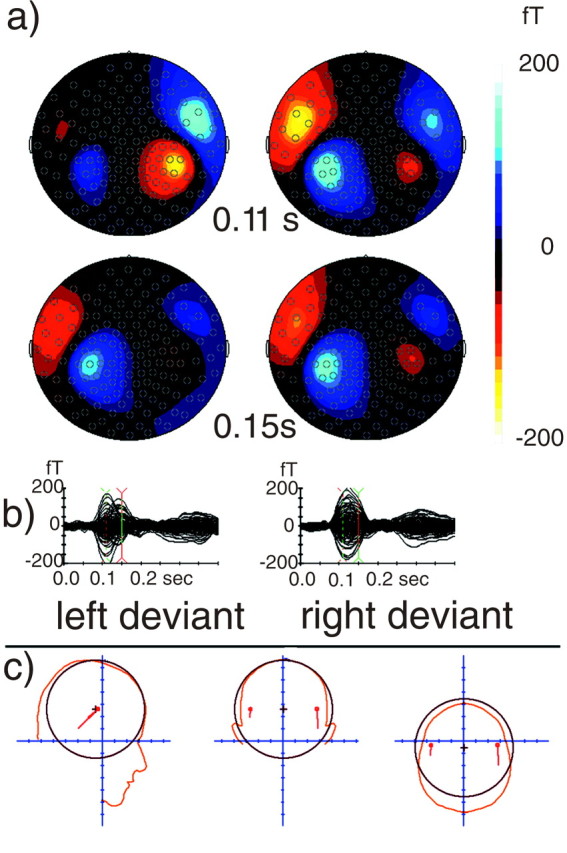
a, Magnetic difference fields evoked by left and right deviants compared with standards (left and right columns, respectively) are depicted as isocontour plots at 110 and 150 msec poststimulus onset (top and bottom rows, respectively). Note that, for right deviants, the ipsilateral mismatch field was already present at 110 msec (top right isocontour plot), whereas for left deviants, it emerged only at ∼150 msec (bottom left isocontour plot). Also, similar isocontour plots were found at both time points for right, but not left, deviants. b, Magnetic field amplitudes for the difference activity between left deviants and standards and between right deviants and standards (left and right graphs, respectively) superimposed for all 143 MEG sensors during the recording interval. Magnetic field curves to left deviants showed a second activity peak for a few, left hemispheric sensors (depicted in the bottom panel of a), whereas the pattern for right deviants was stable across the time interval of 110–150 msec.c, Dipole source localization for linked dipoles fitted to the evoked magnetic field. All the data shown are based on averages across the subject sample.
Fig. 5.

Time course of moments of symmetrically linked, fixed dipoles fitted to the mismatch fields evoked by left and right deviants compared with midline standards in the left (solid lines) and right (dotted lines) hemisphere from 50 msec prestimulus to 210 msec poststimulus. Left deviants were processed later in the left than in the right hemisphere, whereas there was no latency difference for right deviants. The curvesare based on averages across the subject sample.
For dipole latency, there were main effects of both hemisphere (F(1,11) = 20.5; p = 0.001) and side of deviant (F(1,11) = 8.7; p = 0.013), as well as a hemisphere × side of deviant interaction (F(1,11) = 20.1; p = 0.001) (Fig.6). Left deviants gave rise to mismatch dipoles that peaked 25 msec faster on the right than on the left (right, 114 ± 3 msec; left, 139 ± 3 msec;t(11) = 4.92; p < 0.001), whereas right deviants elicited peak latencies that were only 5 msec shorter on the right than on the left (right, 118 ± 2 msec; left, 123 ± 2 msec; t(11) = 2.15; NS). Comparing the responses to deviants within each hemisphere, the left dipole peaked significantly later to left than right deviants (t(11) = 4.60;p = 0.001), whereas the right dipole latencies were only slightly shorter for left than right deviants (t(11) = 1.69; NS).
Fig. 6.

Peak latencies for left and right mismatch dipoles (means and SDs) for left and right deviants.
Induced GBA
Frequency analysis of broad-band signals
Figure 7 shows the results of spectral amplitude analysis across the whole recording epoch for all MEG channels. Applying the significance criterion of p= 0.005 for two consecutive p values disclosed that both right and left deviants were distinguished from midline standards by enhanced spectral amplitudes in the frequency range of 50–55 Hz. Mapping onto the common coil system showed that the spectral amplitude increases to right deviants were located in one posterior left-hemispheric and one posterior right-hemispheric sensor. In contrast, spectral amplitude enhancements to left deviants were restricted to two sensors over right posterior regions. Randomization tests were conducted across all sensors in the frequency range between 48 and 55 Hz. These tests confirmed the effects for both right and left deviants (p = 0.042 and 0.030, respectively). Whereas there were no significant spectral amplitude increases in any other frequency band between 20 and 70 Hz, decreases in spectral amplitude were observed both for right and left deviants at 26–27 Hz. In addition, left deviants were accompanied by a spectral amplitude suppression at 36–40 Hz. Reductions in both of these frequency ranges were localized over right primary sensorimotor cortex at the level of the trunk/shoulder representation areas. The spectral amplitude decreases were also confirmed by randomization tests (p < 0.05 and 0.01 for right and left deviants, respectively). Because we had no hypothesis for GBA reductions, the subsequent analyses were restricted to the frequency range at which enhancements of spectral amplitude were found (50–55 Hz).
Fig. 7.
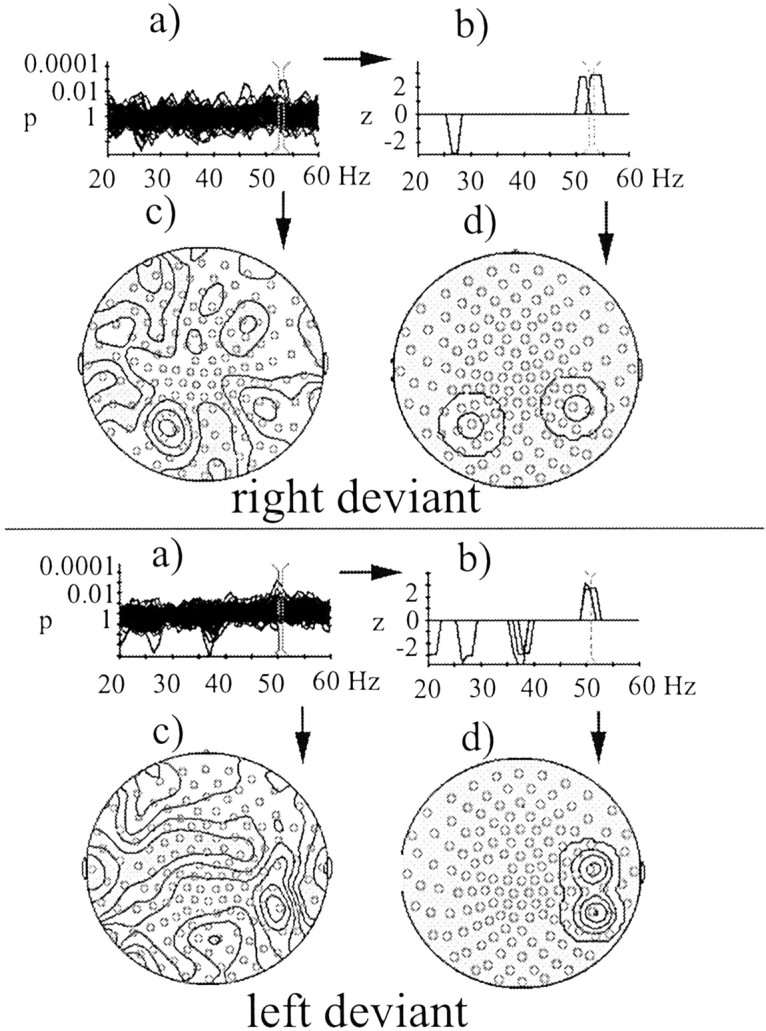
Statistical probability mapping of spectral amplitude differences between right deviants and standards (top) and between left deviants and standards (bottom). a, Distribution of logarithmically transformed p values for each frequency bin superimposed for each MEG sensor (shown between 20 and 60 Hz; resolution of 1 Hz). The p value curves were smoothed with a sliding average across three log-transformed pvalues. The pairs of vertical markers indicate which frequency ranges were selected for depiction in parts cof the figure. b, Here only those effects are depicted that met the significance criterion of p values for two consecutive frequency bins of 0.005 (p values were transformed to z values). Each peak stands for a significant difference between deviants and standards in one MEG sensor at a particular frequency. The only significant spectral amplitude increases were in the range of 50–55 Hz. The pairs of vertical markers indicate which frequency ranges were selected for depiction in partsd of the figure. c, Isocontour plots of the complete p value distributions between 52 and 53 Hz projected onto maps of MEG sensors (seen from above, nose up).d, Isocontour plots of the significant spectral amplitude increases at 52–53 Hz projected onto maps of MEG sensors (seen from above, nose up).
Time course of narrow-band signals
Based on the results of the broad-band frequency analysis, signals were subjected to Gabor filtering (central frequency, 53 Hz; width, ±2.5 Hz) and complex demodulation via Hilbert transform to investigate the time course of energy increases in this frequency range to deviant compared with standard stimuli. Absolute mean amplitudes amounted to ∼13 ± 1 fT for standard stimuli averaged across the latency window of 100–300 msec poststimulus onset. Results of statistical probability mapping of amplitude differences between midline standards and lateralized deviants are depicted in Figure8. Responses to both types of deviants could be separated into an earlier and a later component (in the following sections, termed components 1 and 2, respectively). For right deviants, component 1 peaked at ∼160 msec and component 2 peaked at ∼240 msec poststimulus. Both components exhibited a bilateral topography. The right-hemispheric center of activation of component 2 was located superior to the corresponding area of component 1, whereas the left-hemispheric center of component 2 was posterior to the corresponding area of component 1. Mean amplitude increases for right deviants minus midline standards averaged in the time window of 100–300 msec poststimulus were 0.9 ± 0.2 fT for the sensors over the left hemisphere (t(11) = 4.01;p = 0.002). The mean amplitude enhancement averaged across both right-hemisphere sensors was 0.8 ± 0.1 fT (t(11) = 5.96; p < 0.001).
Fig. 8.

Statistical probability mapping of the time course of differences in amplitude of the Gabor-filtered and demodulated signals in the 53 ± 2.5 Hz range between right deviants and standards (top) and between left deviants and standards (bottom). a, Here those effects are depicted that met the significance criterion of p values for three consecutive time points of 0.05 (pvalues were transformed to z values). Each peak stands for a significant difference between deviants and standards in one MEG sensor at a particular latency. Significant amplitude increases were found between 140 and 260 msec for right deviants and between 100 and 130, and 200 and 240 msec for left deviants. The pairs ofvertical markers indicate which latency ranges were selected for depiction in parts b of the figure.b, Isocontour plots of the significant 53 ± 2.5 Hz amplitude increases at latencies of 140–180 and 230–260 msec for right deviants (top) and at latencies of 100–130 and 200–240 msec for left deviants (bottom) projected onto maps of MEG sensors (seen from above, nose up).
For left deviants, the earlier component 1 of the 53 ± 2.5 Hz amplitude increase peaked at ∼110 msec, whereas component 2 reached its maximum at ∼220 msec. Left deviants elicited amplitude enhancements in sensors over the right hemisphere only. Similar to right deviants, the earlier component showed a more inferior topography than the later component. The mean amplitude increase to left deviants averaged across both right-hemisphere sensors in the latency window of 100–300 msec was 0.8 ± 0.2 fT (t(11) = 4.04; p = 0.002). Amplitudes and log-transformed p value curves for components 1 and 2 in right-hemisphere sensors are depicted in Figure9 for both types of deviants in the time window of 48 msec prestimulus to 400 msec poststimulus onset.
Fig. 9.

Components of significant amplitude differences in the narrow-band signals (53 ± 2.5 Hz) in right-hemisphere sensors. Top left, Amplitude difference waves for right deviants compared with standards in the latency window of −48 to 400 msec poststimulus for components 1 and 2; see Results for a description of the components. Bottom left, Amplitude difference waves for left deviants compared with standards. Top right, Corresponding log-transformed p value curves for the amplitude difference between right deviants and standards. Bottom right, Log-transformedp value curves for the amplitude difference between left deviants and standards.
Topographic mapping of induced GBA
The topographic localization of the components identified in the analysis of the filtered narrow-band signals was investigated using the superimposition of the MEG sensor map onto a brain surface model derived from a magnetic resonance image (Fig.10a,b). The mapping of the earlier component 1 and the later component 2 onto the brain model is shown for right and left deviants in Figure 10,c and d, respectively. For right deviants, the right-hemisphere part of component 1 was localized in the posterior temporal cortex, whereas the right-hemisphere part of component 2 was localized over the angular gyrus (see “Coherence analysis” below for a description of area 2a). The left-hemisphere equivalents were both localized at the junction of posterior parietal and middle temporal gyrus. For left deviants, component 1 was localized slightly more inferior than for right deviants, whereas the topography of component 2 did not differ between deviants. To demonstrate the validity of the present topographic mapping approach, a double-dipole model was applied to the evoked magnetic field response elicited by midline sound onsets at a latency of ∼100 msec. The locations of the first auditory-evoked responses are depicted as green arrowson the head model, showing sources in bilateral supratemporal cortex (Fig. 10).
Fig. 10.
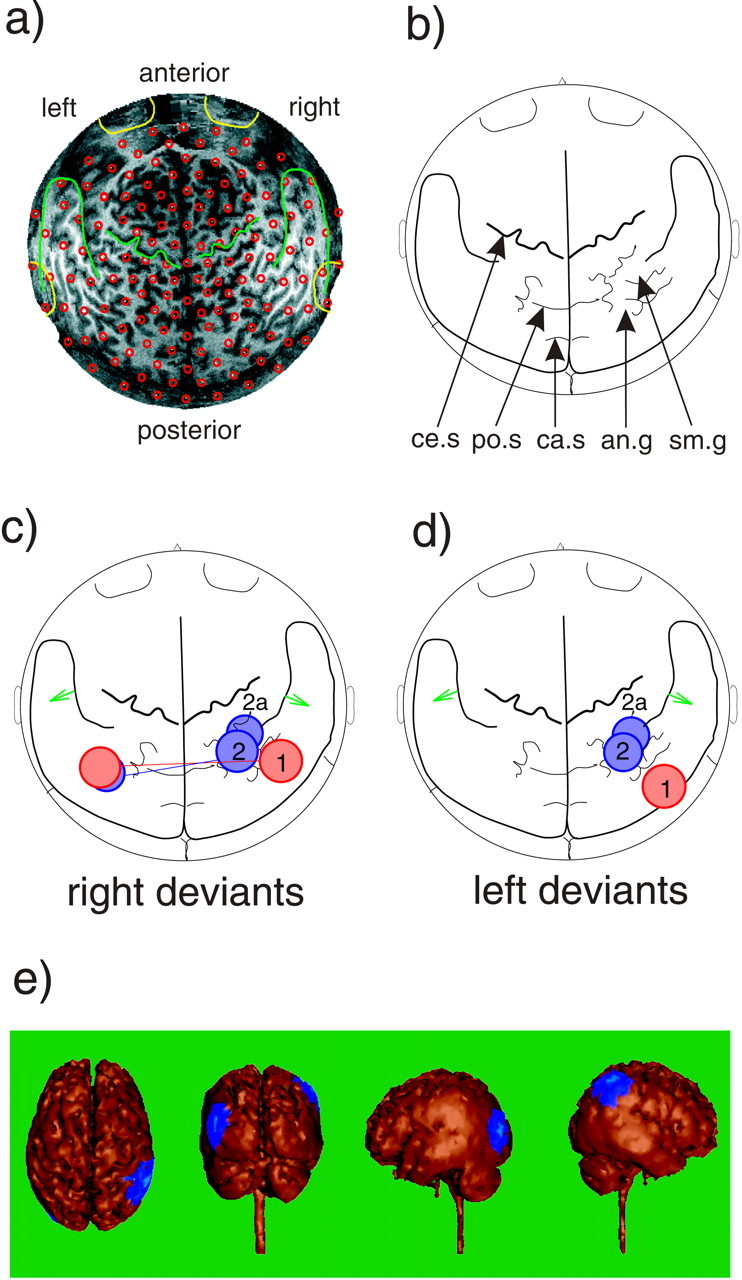
a, The projection of the MEG sensor positions (small red circles) onto the two-dimensional magnetic resonance surface image (seen from above, nose up). b, Map with anatomical landmarks derived from the magnetic resonance image. The locations of the MEG sensor positions averaged across subjects (common coil system) were projected onto this map to investigate the topography of GBA increases.ce.s, Central sulcus; po.s, parieto-occipital sulcus; ca.s, calcarine sulcus;sm.g, supramarginal gyrus; a.g, angular gyrus. c, Topographic mapping of the two components of 53 ± 2.5 Hz amplitude enhancements onto maps with anatomical landmarks for right deviants. The right-hemisphere part of component 1 was localized over the posterior temporal cortex, and the right-hemisphere part of component 2 was localized over the angular gyrus. The left-hemispheric counterparts were both localized over the junction of parietal and posterior temporal cortex. Connecting lines indicate coherence increases between right- and left-hemispheric parts of both components. In addition, coherence was increased between the right-hemisphere part of component 2 and a neighboring area (2a); see Results, Coherence analysis.Green arrows indicate the source locations of dipoles fitted to the magnetic response elicited by midline sound onsets at a latency of ∼100 msec over the supratemporal cortex, demonstrating the validity of the present mapping approach. d, Areas of amplitude increase to left deviants compared with standards. Here the only coherence increase was found between component 2 and area 2a.e, The blue areas show the topography of component 2 on the right-hemisphere and left-hemisphere area to which coherence was increased to right deviants. Here a projection onto a realistic brain model derived from the same magnetic resonance scan is used. From left to right, the brain model is shown from above (nose up), from behind, from the left, and from the right.
Coherence analysis
Coherence analysis was conducted to investigate further the observation of two components in the 53 ± 2.5 Hz response to changes in sound-source lateralization. Because the exploratory character of the narrow-band signal analysis did not allow the conclusion that components 1 and 2 were parts of separate processes, coherence analysis was used to investigate possible increases or decreases in coupling between those right-hemisphere sensors in which significant amplitude increases were found and the remaining sensors. The results of coherence analysis for frequency bins between 50 and 55 Hz are shown in Figure 11. Absolute coherence values for standard stimuli were ∼0.45 ± 0.02 for proximal sensor pairs within the right hemisphere, and ∼0.20 ± 0.02 for distant, interhemispheric sensor pairs. Values of significant coherence changes between midline standards and lateralized deviants and corresponding p values are given in Figure 11. For right deviants, coherence was increased between the right-hemisphere part of component 1 and a left parietotemporal area. For the right-hemisphere part of component 2, coherence was increased to both a closely neighboring area (2a) (Fig. 10) in the right supramarginal gyrus and to a left posterior temporal area. For left deviants, both components 1 and 2 showed increased coherence with the same right-hemispheric area (2a) (Fig. 10). Interestingly, there was no significant coherence change between components 1 and 2 for either type of deviant. This supported the involvement of two separate processes with distinct topographies and response latencies in the cortical representation of changes in sound-source lateralization.
Fig. 11.

Statistical probability mapping of coherence increases for lateralized deviants compared with standards for the frequency range of 50–55 Hz (MEG sensor maps seen from above, nose up). Top, Coherence changes for right deviants compared with standards. Top left, Coherence for all pairwise connections involving the sensor at the center of component 1 of spectral amplitude increase in the 53 ± 2.5 Hz range (depicted as a bold black circle). Top right, Coherence increases for all pairwise connections involving the sensor at the center of component 2 of spectral amplitude increase in the 53 ± 2.5 Hz range (depicted as a bold black circle). The values of coherence increases are given (in parentheses, p values) for those sensor pairs with significant changes (p values for three consecutive frequencies, 0.05). Bottom, Coherence changes for left deviants compared with standards. Bottom left, Coherence increases for all pairwise connections involving the sensor at the center of component 1 of spectral amplitude increase in the 53 ± 2.5 Hz range (depicted as a bold black circle). Bottom right, Coherence for all pairwise connections involving the sensor at the center of component 2 of spectral amplitude increase in the 53 ± 2.5 Hz range (depicted as a bold black circle). Note that there were no significant coherence decreases.
DISCUSSION
This study was designed to investigate both evoked magnetic fields and nonphase-locked oscillatory MEG responses to changes in sound-source direction in a passive mismatch paradigm. As expected, evoked mismatch fields showed larger amplitudes contralaterally to the side of the deviant. The dipole at the left supratemporal plane responded slower to ipsilateral than to contralateral deviants, whereas its right-hemisphere counterpart peaked equally fast to both deviants. Induced GBA was enhanced over right posterior parietal and posterior temporal regions to both deviants, whereas a GBA increase in homologous left-hemisphere areas was observed to rightward sound-source shifts only.
Mismatch magnetic fields
Computing the difference in evoked MEG fields between lateralized deviants and midline standards yielded a mismatch response (cf.Paavilainen et al., 1989; Schröger, 1995, 1996; Winkler et al., 1998), with the respective sources localized at the supratemporal plane (Fig. 4). As hypothesized, the dipoles fitted to the mismatch fields were stronger contralaterally than ipsilaterally to the side of the deviant (Figs. 5, 6). Although previous studies using dichotic stimuli have shown bihemispheric mismatch responses that appeared to be more pronounced in the hemisphere contralateral to the ear in which the deviant sound occurred (Praamstra and Stegemann, 1992; Deouell et al., 1998), our findings suggest the existence of preattentive change detectors with stronger responses to apparent location shifts of binaural sounds into the contralateral hemifield. This is consistent with the fact that most neurons in auditory cortex that are sensitive to spatial information respond to locations in the contralateral hemifield (Jenkins and Masterton, 1982; Phillips and Irvine, 1983;Heffner, 1997). The present analysis focused on the supratemporal generators of the mismatch response, which have been suggested to signal predominantly changes in the contralateral hemifield (Giard et al., 1990). Unlike some previous studies (Paavilainen et al., 1991;Levänen et al., 1996), we found no additional mismatch generator in the right hemisphere. Interestingly, the detection of contralaterally larger responses may depend on the presentation of lateralized sounds in a mismatch paradigm, because lateralized binaural tone bursts alone did not seem to elicit larger contralateral MEG field amplitudes (Woldorff et al., 1999).
Looking at latencies, sound lateralization to the left elicited longer dipole latencies in the left than in the right auditory cortex, with the delay between both dipole peak latencies (25 msec) exceeding the transcallosal transmission time of maximally 20 msec (Banich, 1997). In contrast, a rightward sound displacement elicited only a slight interhemispheric latency difference (5 msec). The comparison of responses to deviants within each hemisphere showed that the left dipole exhibited a slower response to ipsilateral than contralateral deviants, whereas this difference was not significant for the right dipole. These findings suggest a dominance of the right auditory cortex in the detection of change in sound-source lateralization. Shorter mismatch response latencies over the right compared with the left hemisphere have been reported for different kinds of monaurally presented nonlanguage deviants by Levänen et al. (1996), who concluded that the right hemisphere may be involved more strongly in acoustic change detection than the left. However, although this may hold true for simple tones, infrequent binaural linguistic stimuli identical to the one used in the present study have been found to be processed earlier at the level of the left than the right auditory cortex (Ackermann et al., 1999). The fact that there was no such left-hemisphere advantage when deviants were distinguished from standards by their perceived lateralization can be interpreted in terms of a right auditory cortex predominance in the processing of changes in sound-source lateralization also for language material.
Induced GBA
Changes in sound-source direction elicited 50–55 Hz spectral amplitude enhancements in the latency range of the mismatch response. These nonphase-locked GBA activity increases were localized in right posterior temporal and posterior parietal regions for both types of deviants, thus supporting the hypothesized involvement of right parietal cortex in the processing of auditory spatial information. In addition, right deviants were accompanied by 50–55 Hz spectral amplitude increases in homologous left-hemisphere regions. Induced GBA enhancements in human EEG are thought to reflect cortical networks involved in the representation of meaningful or gestalt-like stimuli (Lutzenberger et al., 1994, 1995; Tallon et al., 1995; Tallon-Baudry et al., 1996, 1997; Müller et al., 1997; Pulvermüller et al., 1997; Basar et al., 1999; Tallon-Baudry and Bertrand, 1999; Keil et al., 1999). The present findings thus suggest the participation of posterior parietal networks in the coding of auditory space. Interestingly, induced GBA increases in the EEG studies cited above often showed a wide distribution across recording sites. In contrast, the present statistical probability mapping approach yielded circumscribed areas with GBA enhancements (Sokolov et al., 1999; Kaiser et al., 2000) that may have been generated by a multipolar source structure in the cortical region below the center of increased GBA (see Materials and Methods; Figs. 2, 3).
When investigating effects in a large number of frequency bands and MEG sensors, multiple comparisons represent a major problem. Here we used a statistical probability mapping approach based on a combination of a high α criterion for two consecutive frequency bins and randomization tests. Although setting the criteria was somewhat arbitrary, it ensured that only the most robust effects were subjected to further investigation. The subsequent assessment of narrow-band signal time course and coherence yielded effects in the same regions as the broad-band frequency analysis, thus confirming the involvement of these areas in the representation of sound-source lateralization. Because group studies are necessary to identify effects with a low signal-to-noise ratio like the gamma-band response, individual topographic mapping was not possible. Nevertheless, the use of a common coil system enabled the localization of GBA enhancements over areas found to exhibit increased hemodynamic activity to perceived sound movement or lateralization in functional imaging studies (Griffiths et al., 1998; Weeks et al., 1999).
Both the assessment of the time course of the induced GBA response and coherence analysis suggested the existence of two separate components: an earlier component with a posterior temporal topography, and a later, posterior parietal component. The involvement of parietal areas was expected on the basis of functional imaging and lesion studies (Griffiths et al., 1994, 1998; Soroker et al., 1997; Bushara et al., 1999) and because of their relevance for the representation of space. The posterior parietal cortex receives input from somatosensory, visual, and auditory modalities, is closely connected with the prefrontal cortex (Kolb and Whishaw, 1996; Romanski et al., 1999), and participates in the control of spatially guided behavior and attention, as well as in the abstract representation of space (Andersen, 1995). The increase in posterior temporal GBA is in line with studies in the monkey showing an involvement of caudal areas of the superior temporal gyrus in auditory spatial processing (Rauschecker et al., 1997, 1999;Recanzone et al., 2000). The present findings provide further evidence supporting a role of this area as a part of the auditory dorsal or “where” stream (Rauschecker, 1998; Romanski et al., 1999).
An unexpected finding was the GBA suppression over right and central primary sensorimotor areas found at ∼26 Hz for both types of deviants and additionally at ∼38 Hz for left deviants. It can be speculated that, depending on their content, lateralized auditory stimuli may elicit a tendency to orient toward the perceived sound source. The activity reduction of motor circuits could thus have reflected the subjects' suppression of an urge to move. GBA reductions, previously reported during the perception of pseudowords (Lutzenberger et al., 1994; Pulvermüller et al., 1996), may indicate suppression of network activity that is irrelevant for or detrimental to the performance on explicit or, as in this case, implicit tasks.
Conclusions
In summary, the present study showed that a change in sound-source direction from midline toward the right side elicits both simultaneously peaking evoked magnetic fields at the level of the bilateral supratemporal planes and increased nonphase-locked spectral amplitudes in the gamma-band range within bilateral posterior temporal and posterior parietal areas. In contrast, a leftward sound-source shift is detected earlier at the level of the right than left supratemporal plane and leads to GBA enhancements exclusively over right-hemispheric parietotemporal regions. These findings suggest that (1) bilateral processing and representation of rightward, but contralateral processing and representation of leftward, changes in sound-source direction, and (2) an involvement of right-hemisphere auditory association areas in the representation of bidirectional sound-source direction changes. The fact that this was found for linguistic stimuli underscores the robustness of the processing pattern. Both dipole latency and GBA findings were in keeping with the hypothesized right-hemisphere dominance for the processing of sound-source lateralization. Our findings might help to explain why unilateral auditory neglect is found much more frequently for stimuli in the left hemifield after right parietal lesions than vice versa (Pinek et al., 1989; Griffiths et al., 1994, 1996; Soroker et al., 1997; Driver and Mattingley, 1998).
Footnotes
This research was supported by Deutsche Forschungsgemeinschaft Grant SFB 550/C1.
Correspondence should be addressed to Dr. Jochen Kaiser, Institute of Medical Psychology and Behavioral Neurobiology, University of Tübingen, Gartenstrasse 29, 72074 Tübingen, Germany. E-mail: jochen.kaiser@uni-tuebingen.de.
REFERENCES
- 1.Ackermann H, Lutzenberger W, Hertrich I. Hemispheric lateralization of the neural coding of temporal speech features: a whole-head magnetencephalography study. Cogn Brain Res. 1999;7:511–518. doi: 10.1016/s0926-6410(98)00054-8. [DOI] [PubMed] [Google Scholar]
- 2.Andersen RA. Encoding of intention and spatial location in the posterior parietal cortex. Cereb Cortex. 1995;5:457–469. doi: 10.1093/cercor/5.5.457. [DOI] [PubMed] [Google Scholar]
- 3.Banich MT. Neuropsychology, p 112. Houghton Mifflin; Boston: 1997. [Google Scholar]
- 4.Basar E, Basar-Eroglu C, Karakas S, Schürmann M. Are cognitive processes manifested in event-related gamma, alpha, theta and delta oscillations in the EEG? Neurosci Lett. 1999;259:165–168. doi: 10.1016/s0304-3940(98)00934-3. [DOI] [PubMed] [Google Scholar]
- 5.Baumgart F, Gaschler-Markefski B, Woldorff MG, Heinze H-J, Scheich H. A movement-sensitive area in auditory cortex. Nature. 1999;400:724–726. doi: 10.1038/23390. [DOI] [PubMed] [Google Scholar]
- 6.Bisiach E, Cornacchia L, Sterzi R, Vallar G. Disorders of perceived auditory lateralisation after lesions of the right hemisphere. Brain. 1984;107:37–52. doi: 10.1093/brain/107.1.37. [DOI] [PubMed] [Google Scholar]
- 7.Blair BC, Karniski W. An alternative method for significance testing of waveform difference potentials. Psychophysiology. 1993;30:518–524. doi: 10.1111/j.1469-8986.1993.tb02075.x. [DOI] [PubMed] [Google Scholar]
- 8.Bushara KO, Weeks RA, Ishii K, Catalan MJ, Tian B, Rauschecker JP, Hallett M. Modality-specific frontal and parietal areas for auditory and visual spatial localization in humans. Nat Neurosci. 1999;2:759–766. doi: 10.1038/11239. [DOI] [PubMed] [Google Scholar]
- 9.Clochon P, Fontbonne J, Lebrun N, Etevenon P. A new method for quantifying EEG event-related desynchronization: amplitude envelope analysis. Electroencephalogr Clin Neurophysiol. 1996;98:126–129. doi: 10.1016/0013-4694(95)00192-1. [DOI] [PubMed] [Google Scholar]
- 10.Deouell LY, Bentin S, Giard MH. Mismatch negativity in dichotic listening: evidence for interhemispheric differences and multiple generators. Psychophysiology. 1998;35:355–365. [PubMed] [Google Scholar]
- 11.De Renzi E, Gentilini M, Barbieri C. Auditory neglect. J Neurol Neurosurg Psychiatry. 1989;52:613–617. doi: 10.1136/jnnp.52.5.613. [DOI] [PMC free article] [PubMed] [Google Scholar]
- 12.Driver J, Mattingley JB. Parietal neglect and visual awareness. Nat Neurosci. 1998;1:17–22. doi: 10.1038/217. [DOI] [PubMed] [Google Scholar]
- 13.Eckhorn R, Bauer R, Jordan W, Brosch M, Kruse W, Munk M, Reitboeck HJ. Coherent oscillations: a mechanism of feature linking in the visual cortex? Multiple electrode and coherence analyses in the cat. Biol Cybern. 1988;60:121–130. doi: 10.1007/BF00202899. [DOI] [PubMed] [Google Scholar]
- 14.Furukawa S, Xu L, Middlebrooks JC. Coding of sound-source location by ensembles of cortical neurons. J Neurosci. 2000;20:1216–1228. doi: 10.1523/JNEUROSCI.20-03-01216.2000. [DOI] [PMC free article] [PubMed] [Google Scholar]
- 15.Giard MH, Perrin F, Pernier J, Bouchet P. Brain generators implicated in processing of auditory stimulus deviance: a topographic event-related potential study. Psychophysiology. 1990;27:627–640. doi: 10.1111/j.1469-8986.1990.tb03184.x. [DOI] [PubMed] [Google Scholar]
- 16.Glaser EM, Ruchkin DS. Principles of neurobiological signal analysis, p 168. Academic; New York: 1976. [Google Scholar]
- 17.Gray CM, Singer W. Stimulus-specific neuronal oscillations in orientation columns of cat visual cortex. Proc Natl Acad Sci USA. 1989;86:1698–1702. doi: 10.1073/pnas.86.5.1698. [DOI] [PMC free article] [PubMed] [Google Scholar]
- 18.Gray CM, Viana di Prisco G. Stimulus-dependent neuronal oscillations and local synchronization in striate cortex of the alert cat. J Neurosci. 1997;17:3239–3253. doi: 10.1523/JNEUROSCI.17-09-03239.1997. [DOI] [PMC free article] [PubMed] [Google Scholar]
- 19.Griffiths TD, Bench CJ, Frackowiak RSJ. Human cortical areas selectively activated by apparent sound movement. Curr Biol. 1994;4:892–895. doi: 10.1016/s0960-9822(00)00198-6. [DOI] [PubMed] [Google Scholar]
- 20.Griffiths TD, Rees A, Witton C, Shakir RA, Henning GB, Green GGR. Evidence for a sound movement area in the human cerebral cortex. Nature. 1996;383:425–427. doi: 10.1038/383425a0. [DOI] [PubMed] [Google Scholar]
- 21.Griffiths TD, Rees G, Rees A, Green GGR, Witton C, Rowe D, Büchel C, Turner R, Frackowiak RSJ. Right parietal cortex is involved in the perception of sound movement in humans. Nat Neurosci. 1998;1:74–79. doi: 10.1038/276. [DOI] [PubMed] [Google Scholar]
- 22.Heffner HE. The role of macaque auditory cortex in sound localization. Acta Otolaryngol Suppl. 1997;532:22–27. doi: 10.3109/00016489709126140. [DOI] [PubMed] [Google Scholar]
- 23.Heffner HE, Heffner RS. Effect of bilateral auditory cortex lesions on absolute thresholds in Japanese monkeys. J Neurophysiol. 1990;64:191–205. doi: 10.1152/jn.1990.64.1.191. [DOI] [PubMed] [Google Scholar]
- 24.Jenkins WM, Masterton RB. Sound localization: effects of unilateral lesions in central auditory system. J Neurophysiol. 1982;47:987–1016. doi: 10.1152/jn.1982.47.6.987. [DOI] [PubMed] [Google Scholar]
- 25.Jokeit H, Makeig S. Different event-related patterns of γ-band power in brain waves of fast- and slow-reacting subjects. Proc Natl Acad Sci USA. 1994;91:6339–6343. doi: 10.1073/pnas.91.14.6339. [DOI] [PMC free article] [PubMed] [Google Scholar]
- 26.Kaiser J, Lutzenberger W, Preissl H, Mosshammer D, Birbaumer N. Statistical probability mapping reveals high-frequency magnetoencephalographic activity in supplementary motor area during self-paced finger movements. Neurosci Lett. 2000;283:81–84. doi: 10.1016/s0304-3940(00)00921-6. [DOI] [PubMed] [Google Scholar]
- 27.Keil A, Müller MM, Ray WJ, Gruber T, Elbert T. Human gamma band activity and perception of a gestalt. J Neurosci. 1999;19:7152–7161. doi: 10.1523/JNEUROSCI.19-16-07152.1999. [DOI] [PMC free article] [PubMed] [Google Scholar]
- 28.King AJ, Carlile S. Neural coding for auditory space. In: Gazzanigga MS, editor. The cognitive neurosciences. MIT; Cambridge, MA: 1995. pp. 279–293. [Google Scholar]
- 29.King AJ, Hutchings ME. Spatial response properties of acoustically responsive neurons in the superior colliculus of the ferret: a map of auditory space. J Neurophysiol. 1987;57:596–624. doi: 10.1152/jn.1987.57.2.596. [DOI] [PubMed] [Google Scholar]
- 30.Kolb B, Whishaw IQ. Fundamentals of human neuropsychology, Ed 4, pp 266–268. Freeman; New York: 1996. [Google Scholar]
- 31.Kulkarni A, Colburn HS. Role of spectral detail in sound-source localization. Nature. 1998;396:747–749. doi: 10.1038/25526. [DOI] [PubMed] [Google Scholar]
- 32.Levänen S, Ahonen A, Hari R, McEvoy R, Sams M. Deviant auditory stimuli activate human left and right auditory cortex differently. Cereb Cortex. 1996;6:288–296. doi: 10.1093/cercor/6.2.288. [DOI] [PubMed] [Google Scholar]
- 33.Loveless N, Vasama J-P, Mäkelä J, Hari R. Human auditory cortical mechanisms of sound lateralisation. III. Monaural and binaural shift responses. Hear Res. 1994;81:91–99. doi: 10.1016/0378-5955(94)90156-2. [DOI] [PubMed] [Google Scholar]
- 34.Lutzenberger W, Pulvermüller F, Birbaumer N. Words and pseudowords elicit distinct patterns of 30-Hz EEG responses in humans. Neurosci Lett. 1994;176:115–118. doi: 10.1016/0304-3940(94)90884-2. [DOI] [PubMed] [Google Scholar]
- 35.Lutzenberger W, Pulvermüller F, Elbert T, Birbaumer N. Visual stimulation alters local 40-Hz responses in humans: an EEG study. Neurosci Lett. 1995;183:39–42. doi: 10.1016/0304-3940(94)11109-v. [DOI] [PubMed] [Google Scholar]
- 36.Lutzenberger W, Preissl H, Birbaumer N, Pulvermüller F. High-frequency cortical responses: do they not exist if they are small? Electroencephalogr Clin Neurophysiol. 1997;102:64–66. doi: 10.1016/s0013-4694(96)96561-x. [DOI] [PubMed] [Google Scholar]
- 37.Mäkelä JP, Ahonen A, Hämäläinen M, Hari R, Ilmoniemi R, Kajola M, Knuutila J, Lounasmaa OV, McEvoy LK, Salmelin R, Salonen O, Sams M, Simola J, Tesche C, Vasama JP. Functional differences between auditory cortices of the two hemispheres revealed by whole-head neuromagnetic recordings. Hum Brain Mapp. 1993;1:48–56. [Google Scholar]
- 38.McEvoy L, Hari R, Imada T, Sams M. Human auditory cortical mechanisms of sound lateralisation. II. Interaural time differences at sound onset. Hear Res. 1993;67:98–109. doi: 10.1016/0378-5955(93)90237-u. [DOI] [PubMed] [Google Scholar]
- 39.Middlebrooks JC, Green DM. Sound localization by human listeners. Annu Rev Psychol. 1991;42:135–159. doi: 10.1146/annurev.ps.42.020191.001031. [DOI] [PubMed] [Google Scholar]
- 40.Miltner WHR, Braun C, Arnold M, Witte H, Taub E. Coherence of gamma-band EEG activity as a basis for associative learning. Nature. 1999;397:434–436. doi: 10.1038/17126. [DOI] [PubMed] [Google Scholar]
- 41.Müller MM, Bosch J, Elbert T, Kreiter A, Sosa MV, Sosa PV, Rockstroh B. Visually induced gamma-band responses in human electroencephalographic activity—a link to animal studies. Exp Brain Res. 1996;112:96–102. doi: 10.1007/BF00227182. [DOI] [PubMed] [Google Scholar]
- 42.Müller MM, Junghöfer M, Elbert T, Rockstroh B. Visually induced gamma-band responses to coherent and incoherent motion: a replication study. NeuroReport. 1997;8:2575–2579. doi: 10.1097/00001756-199707280-00031. [DOI] [PubMed] [Google Scholar]
- 43.Näätänen R. The role of attention in auditory information processing as revealed by event-related potentials and other brain measures of cognitive function. Behav Brain Sci. 1990;13:201–288. [Google Scholar]
- 44.Näätänen R. Attention and brain function. Erlbaum; Hillsdale, NJ: 1992. [Google Scholar]
- 45.Näätänen R, Alho K. Mismatch negativity—a unique measure of sensory processing in audition. Int J Neurosci. 1995;80:317–337. doi: 10.3109/00207459508986107. [DOI] [PubMed] [Google Scholar]
- 46.Oldfield R. The assessment and analysis of handedness. Neuropsychologia. 1971;9:97–113. doi: 10.1016/0028-3932(71)90067-4. [DOI] [PubMed] [Google Scholar]
- 47.Paavilainen P, Karlsson ML, Reinikainen K, Näätänen R. Mismatch negativity to changes in the spatial location of an auditory stimulus. Electroencephalogr Clin Neurophysiol. 1989;73:129–141. doi: 10.1016/0013-4694(89)90192-2. [DOI] [PubMed] [Google Scholar]
- 48.Paavilainen P, Alho K, Reinikainen K, Sams M, Näätänen R. Right hemisphere dominance of different mismatch negativities. Electroencephalogr Clin Neurophysiol. 1991;78:466–479. doi: 10.1016/0013-4694(91)90064-b. [DOI] [PubMed] [Google Scholar]
- 49.Petersen SE, Corbetta M, Miezin FM, Shulman GL. PET studies of parietal involvement in spatial attention: comparison of different task types. Can J Exp Psychol. 1994;48:319–338. doi: 10.1037/1196-1961.48.2.319. [DOI] [PubMed] [Google Scholar]
- 50.Phillips DP, Irvine DRF. Some features of binaural input to single neurons in physiologically defined area AI of cat cerebral cortex. J Neurophysiol. 1983;49:383–395. doi: 10.1152/jn.1983.49.2.383. [DOI] [PubMed] [Google Scholar]
- 51.Pinek B, Duhamel JR, Cave C, Brouchon M. Audio-spatial deficits in humans: differential effects associated with left versus right hemisphere parietal damage. Cortex. 1989;25:175–186. doi: 10.1016/s0010-9452(89)80035-8. [DOI] [PubMed] [Google Scholar]
- 52.Praamstra P, Stegemann DF. On the possibility of independent activation of bilateral mismatch negativity (MMN) generators. Electroencephalogr Clin Neurophysiol. 1992;82:67–80. doi: 10.1016/0013-4694(92)90184-j. [DOI] [PubMed] [Google Scholar]
- 53.Press WH, Teukolsky SA, Vetterling WT, Flannery BP. Numerical recipes, p 547. Cambridge UP; Cambridge: 1992. [Google Scholar]
- 54.Pulvermüller F, Eulitz C, Pantev C, Mohr B, Feige B, Lutzenberger W, Elbert T, Birbaumer N. High-frequency cortical responses reflect lexical processing: an MEG study. Electroencephalogr Clin Neurophysiol. 1996;98:76–85. doi: 10.1016/0013-4694(95)00191-3. [DOI] [PubMed] [Google Scholar]
- 55.Pulvermüller F, Birbaumer N, Lutzenberger W, Mohr B. High-frequency brain activity: its possible role in attention, perception and language processing. Prog Neurobiol. 1997;52:427–445. doi: 10.1016/s0301-0082(97)00023-3. [DOI] [PubMed] [Google Scholar]
- 56.Rauschecker JP. Cortical processing of complex sounds. Curr Opin Neurobiol. 1998;8:516–521. doi: 10.1016/s0959-4388(98)80040-8. [DOI] [PubMed] [Google Scholar]
- 57.Rauschecker JP, Tian B, Pons T, Mishkin M. Serial and parallel processing in rhesus monkey auditory cortex. J Comp Neurol. 1997;382:89–103. [PubMed] [Google Scholar]
- 58.Rauschecker JP, Durham A, Kustov A, Lord A, Tian B. Parallel processing in rhesus monkey auditory cortex. Soc Neurosci Abstr. 1999;25:394. [Google Scholar]
- 59.Recanzone GH, Guard DC, Phan ML. Frequency and intensity response properties of single neurons in the auditory cortex of the behaving macaque monkey. J Neurophysiol. 2000;83:2315–2331. doi: 10.1152/jn.2000.83.4.2315. [DOI] [PubMed] [Google Scholar]
- 60.Reite M, Zimmermann JT, Zimmermann JE. Magnetic auditory evoked fields: interhemispheric asymmetry. Electroencephalogr Clin Neurophysiol. 1981;51:388–392. doi: 10.1016/0013-4694(81)90102-4. [DOI] [PubMed] [Google Scholar]
- 61.Romanski LM, Tian B, Fritz J, Mishkin M, Goldman-Rakic PS, Rauschecker JP. Dual streams of auditory afferents target multiple domains in the primate prefrontal cortex. Nat Neurosci. 1999;2:1131–1136. doi: 10.1038/16056. [DOI] [PMC free article] [PubMed] [Google Scholar]
- 62.Sams M, Hämäläinen M, Hari R, McEvoy L. Human auditory cortical mechanisms of sound lateralisation. I. Interaural time differences within sound. Hear Res. 1993;67:89–97. doi: 10.1016/0378-5955(93)90236-t. [DOI] [PubMed] [Google Scholar]
- 63.Schröger E. Processing of auditory deviants with changes in one vs. two stimulus dimensions. Psychophysiology. 1995;32:55–65. doi: 10.1111/j.1469-8986.1995.tb03406.x. [DOI] [PubMed] [Google Scholar]
- 64.Schröger E. Interaural time and level differences: integrated or separated processing? Hear Res. 1996;96:191–198. doi: 10.1016/0378-5955(96)00066-4. [DOI] [PubMed] [Google Scholar]
- 65.Singer W. Time as coding space in neocortical processing: a hypothesis. In: Gazzanigga MS, editor. The cognitive neurosciences. MIT; Cambridge, MA: 1995. pp. 91–104. [Google Scholar]
- 66.Sokolov A, Lutzenberger W, Pavlova M, Preissl H, Braun C, Birbaumer N. Gamma-band MEG activity to coherent motion depends on task-driven attention. NeuroReport. 1999;10:1997–2000. doi: 10.1097/00001756-199907130-00001. [DOI] [PubMed] [Google Scholar]
- 67.Soroker N, Calamaro N, Glicksohn J, Myslobodsky MS. Auditory inattention in right-hemisphere-damaged patients with and without visual neglect. Neuropsychologia. 1997;35:249–256. doi: 10.1016/s0028-3932(96)00038-3. [DOI] [PubMed] [Google Scholar]
- 68.Tallon-Baudry C, Bertrand O. Oscillatory gamma activity in humans and its role in object representation. Trends Cogn Sci. 1999;3:151–162. doi: 10.1016/s1364-6613(99)01299-1. [DOI] [PubMed] [Google Scholar]
- 69.Tallon C, Bertrand O, Bouchet P, Pernier J. Gamma-range activity evoked by coherent visual stimuli in humans. Eur J Neurosci. 1995;7:1285–1291. doi: 10.1111/j.1460-9568.1995.tb01118.x. [DOI] [PubMed] [Google Scholar]
- 70.Tallon-Baudry C, Bertrand O, Delpuech C, Pernier J. Stimulus specificity of phase-locked and non-phase-locked 40 Hz visual responses in humans. J Neurosci. 1996;16:4240–4249. doi: 10.1523/JNEUROSCI.16-13-04240.1996. [DOI] [PMC free article] [PubMed] [Google Scholar]
- 71.Tallon-Baudry C, Bertrand O, Wienbruch C, Ross B, Pantev C. Combined EEG and MEG recordings of visual 40 Hz responses to illusory triangles in human. NeuroReport. 1997;8:1103–1107. doi: 10.1097/00001756-199703240-00008. [DOI] [PubMed] [Google Scholar]
- 72.Weeks RA, Aziz-Sultan A, Bushara KO, Tian B, Wessinger CM, Dang N, Rauschecker JP, Hallett M. A PET study of human auditory spatial processing. Neurosci Lett. 1999;262:155–158. doi: 10.1016/s0304-3940(99)00062-2. [DOI] [PubMed] [Google Scholar]
- 73.Winkler I, Tervaniemi M, Schröger E, Wolff C, Näätänen R. Preattentive processing of auditory spatial information in humans. Neurosci Lett. 1998;242:49–52. doi: 10.1016/s0304-3940(98)00022-6. [DOI] [PubMed] [Google Scholar]
- 74.Woldorff MG, Tempelmann C, Fell J, Tegeler C, Gaschler-Markefski B, Hinrichs H, Heinze HJ, Scheich H. Lateralized auditory spatial perception and the contralaterality of cortical processing as studied with functional magnetic resonance imaging and magnetoencephalography. Hum Brain Mapp. 1999;7:49–66. doi: 10.1002/(SICI)1097-0193(1999)7:1<49::AID-HBM5>3.0.CO;2-J. [DOI] [PMC free article] [PubMed] [Google Scholar]