

Abstract
Spontaneous waves of excitation in the developing mammalian retina are mediated, to a large extent, by neurotransmission. However, it is unclear how the underlying neurotransmitter systems interact with each other to play specific roles in the formation of retinal waves at various developmental stages. In particular, it is puzzling why the waves maintain a similar propagation pattern even after underlying neurotransmitter systems have undergone drastic developmental changes. Using Ca2+ imaging and patch clamp in a whole-mount preparation of the developing rabbit retina, we discovered two dramatic and coordinated transitions in the excitatory drive for retinal waves: one from a nicotinic to a muscarinic system, and the other from a fast cholinergic to a fast glutamatergic input. Retinal waves before the age of postnatal day 1 (P1) were blocked by nicotinic antagonists, but not by muscarinic or glutamatergic antagonists. After P3, however, the spontaneous wave, whose basic spatiotemporal pattern remained similar, was completely inhibited by muscarinic or glutamate antagonists, but not by nicotinic antagonists. We also found that the muscarinic drive, mediated primarily by M1 and M3 receptors, was particularly important for wave propagation, whereas the glutamatergic drive seemed more important for local excitation. Our results suggest (1) a novel mechanism by which a neurotransmitter system changes its functional role via a switch between two completely different classes of receptors for the same transmitter, (2) the cholinergic system plays a critical role in not only early but also late spontaneous waves, and (3) the continued participation of the cholinergic system may provide a network basis for the consistency in the overall propagation pattern of spontaneous retinal waves.
Keywords: visual development, spontaneous retinal waves, cholinergic amacrine cells, nicotinic and muscarinic receptors, glutamate receptors, calcium imaging, patch-clamp, rabbit retina
In the developing vertebrate retina, rhythmic excitation occurs spontaneously among ganglion and amacrine cells and propagates laterally in local domains in the form of waves (for review, see Catsicas and Mobbs, 1995; Katz and Shatz, 1996;Copenhagen, 1996; Feller, 1999; O'Donovan, 1999; Wong, 1999). These waves are present before vision develops and are believed to encode important cues for a variety of activity-dependent developmental processes in both the retina (Sernagor and Grzywacz, 1996) and the central visual system (Constantine-Paton et al., 1990; Cline, 1991;Goodman and Shatz, 1993; Penn et al., 1998). Recent studies have shown increasing evidence for a critical role of neurotransmitter systems in spontaneous retinal activity (Feller et al., 1996; Catsicas et al., 1998; Fischer et al., 1998; Wong et al., 1998; Zhou, 1998; Sernagor and Grzywacz, 1999; Stellwagen et al., 1999; Sernagor et al., 2000). There is also emerging evidence that different neurotransmitters may underlie retinal waves in different species and during different developmental periods (Wong et al., 2000). However, it remains unclear how the underlying neurotransmitter systems interact with each other to play specific roles in the formation of waves.
We investigated the role of two major excitatory neurotransmitters, ACh and glutamate, in spontaneous waves in the developing rabbit retina. ACh is believed to be a critical neurotransmitter for early retinal waves in ferret (Feller et al., 1996), turtle (Sernagor and Grzywacz, 1999), and chick (Catsicas et al., 1998). Glutamate, on the other hand, has been recently implicated as an important transmitter for retinal waves in a number of species during certain developmental periods (Wong et al., 1998, 2000; Sernagor and Grzywacz, 1999; Sernagor et al., 2000). In the mature vertebrate retina, the only glutamatergic input to the inner plexiform layer (IPL) is from bipolar cells that form ribbon synapses (Dowling, 1987). Because bipolar cells differentiate much later than do ganglion and amacrine cells (Greiner and Weidman, 1982;Stone et al., 1985), synaptic interaction in the IPL during early retinal waves is thought to be mediated only by conventional synapses among amacrine and ganglion cells.
As bipolar cell synapses begin to develop in the IPL, the balance of excitatory inputs to ganglion and amacrine cells is expected to shift from the cholinergic to the glutamatergic system (Wong et al., 2000). However, it is not known how the cholinergic system interacts with the newly recruited glutamatergic system and whether ACh still plays a role in late retinal waves. Moreover, because the overall wave pattern remains quite similar after the emergence of the glutamatergic input in the IPL (Zhao et al., 1999), it has yet to be explained on the network basis how these two completely different neurotransmitter circuits could each mediate waves of such similar propagation patterns, since the glutamatergic circuit is organized primarily vertically, whereas the cholinergic processes extend horizontally (Wässle and Boycott, 1991).
We report here two concomitant transitions in the role of ACh and glutamate in spontaneous retinal waves in rabbits: one from a fast cholinergic to a fast glutamatergic drive, the other from a nicotinic to a muscarinic network. Our data also indicate that the glutamatergic and muscarinic drives play different functional roles in retinal waves.
Preliminary results of this study have been published previously in abstracts (Zhao et al., 1999; Zhou and Zhao, 1999).
MATERIALS AND METHODS
Calcium imaging and patch clamp in the flat-mount rabbit retina. Retinal flat mounts were prepared from pigmented (New Zealand Red) and, occasionally, albino (New Zealand White) rabbits as described previously (Zhou, 1998). No significant differences in wave properties were noticed between the two strands of rabbits. Retinas were obtained from rabbits aged embryonic day 26 (E26) and E29–E30 (gestation period, 31 d) and postnatal day 0 (P0)–P6. Preterm rabbit pups were delivered by Cesarean section. All procedures involving the use of animals were according to the National Institutes of Health guidelines as implemented by the institutional animal care and use committee.
To load the calcium indicator dye fura-2 AM (Molecular Probes, Eugene, OR) in ganglion and amacrine cells, pieces of the retina were mounted scleral side up on black filter paper (Type HABP; Millipore, Bedford, MA) and incubated in HEPES-based Ames medium (in which NaHCO3 was replaced with 20 mm HEPES) containing 10 μm fura-2 AM and 0.001% pluronic acid for 1 hr at 30°C. The retinas were then transferred into an incubation chamber containing dye-free, HEPES-based Ames at room temperature until the time of recording. During Ca2+imaging, the recording chamber was continuously superfused (3–4 ml/min) with Ames medium (Ames and Nesbett, 1981) preheated to 35–37°C. Cells in the ganglion cell layer were imaged with an intensified, cooled CCD camera (intensified Pantamax; Princeton Instruments, Princeton, NJ) mounted on a fixed-stage, upright microscope (BX50WI; Olympus, New York, NY). Images were collected at 0.333 Hz with an integration time of 600 msec, unless stated otherwise in the figure legend. All pharmacological agents used in this study were purchased from Sigma (St. Louis, MO) and were applied to the retina via bath perfusion (dead volume, ∼2 ml). Ames and HEPES-based Ames media were always saturated with carbogen (95% O2 and 5% CO2) and oxygen, respectively.
Whole-cell patch-clamp recordings were made from cells in the ganglion cell layer of the whole-mount rabbit retina as previously described (Zhou, 1998). For simultaneous patch-clamp and Ca2+ imaging, pieces of the retina were first loaded with fura-2 AM as described above, except the retina was not mounted on the filter paper. Patch-clamp recordings were made either simultaneously with or immediately after Ca2+ imaging under a 40× water immersion objective lens. The pipette resistance was 3–5 MΩ measured in Ames medium and a pipette solution containing (in mm): 95 K-gluconate, 15 KCl, 5 NaOH, 0.5 CaCl2, 2 MgCl2, 5 EGTA, 2 ATP, 0.5 GTP, 2 ascorbic acid, and 10 HEPES. Series resistance was compensated by 50–80% with the series resistance compensation circuitry in the patch-clamp amplifier (Axopatch 200B; Axon Instruments, Foster City, CA).
Data acquisition and analysis. Fluorescence images were collected with Axon Imaging Workbench (AIW) software (Axon Instruments) and analyzed with AIW and Scion Image (Scion Corporation, Frederick, MD). To monitor the excitability of individual cells in the retina, oval zones were drawn around dye-loaded cells using AIW software. The average fluorescence intensity in each zone was plotted as a function of time F(t) with AIW. The relative change in the emission fluorescence intensity (ΔF/F) was defined as [F(t) −Fo(t)]/Fo(t), where Fo(t) was the baseline intensity, which varied slowly with time as a result of dye bleaching and slow drift of samples out of focus during long periods of recording. Because the duration of spontaneous waves was very brief (∼2–3 sec) compared to the interburst interval (∼20–300 sec), the baseline fluorescence intensity,Fo(t), could be approximated by fitting F(t) to a polynomial function (or, sometimes, by smoothing with adjacent averaging) using the Origin software (Microcal, Northampton, MA). The result of the fit,Ffit(t), appeared similar to that obtained with a low-pass filter and closely resembled the slowly varying baseline fluorescence intensity (Fo) without rhythmic bursts. Thus, ΔF/F was approximated as [F(t) −Ffit(t)]/Ffit(t) using the Origin software. For simplicity, only a small number (4–16) of representative zones, usually selected randomly from the entire field of view, was shown in most figures, but similar results were also found from most of the remaining cells in the field.
The propagation of waves was imaged with a low magnification (10 or 4×) objective lens. The wavefront speed (v) was defined as the rate at which the wavefront passed from one point to another along the direction of wave propagation (see Fig. 3). The radial dimension (d) of the wavefront was defined as the radial distance within which ‖ΔF/Fo‖ was >50% of the maximal value. It was calculated as the product of v and the half-amplitude width in the ΔF(t)/Fo plot (see Fig. 3C). Differential images (ΔF) of the wave were obtained by subtracting a control image (averaged from four to eight frames recorded immediately before a wave) from images recorded during the wave with Scion Image software. The image contrast was enhanced with Adobe Photoshop (Adobe Systems).
Fig. 3.
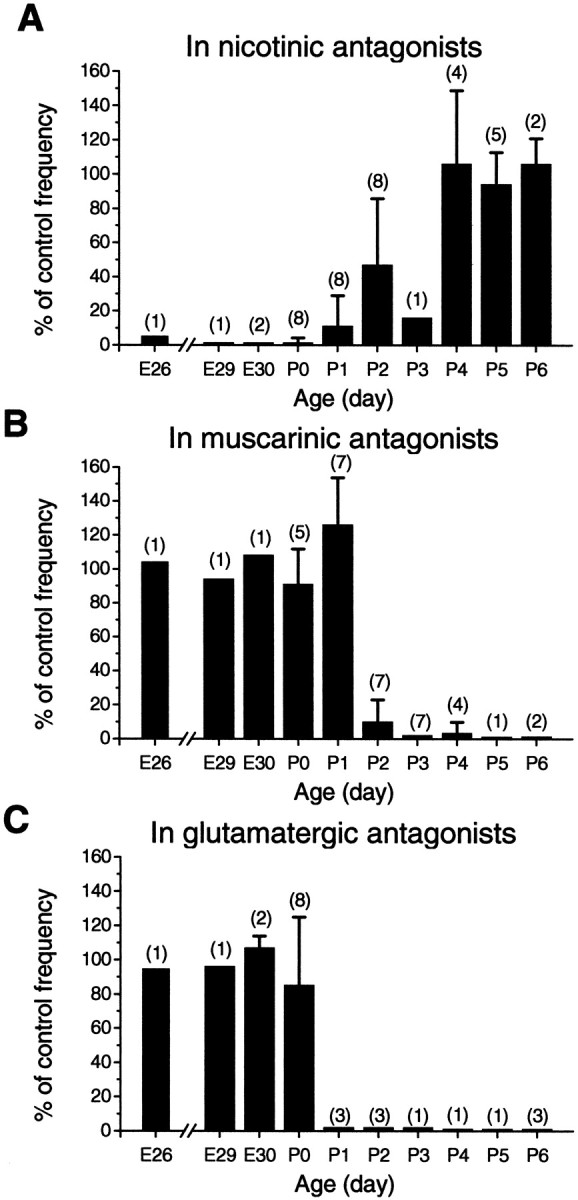
Summary of the effect (expressed in percentage of control wave frequency) of nicotinic (A), muscarinic (B), and glutamate (C) receptor antagonists between ages E26 and P6. Data were pooled from experiments with various nicotinic, muscarinic, and glutamatergic antagonists. The nicotinic antagonists includedd-tubocurare (25–400 μm), HEX (25–100 μm), and mecamylamine (300 μm). The muscarinic antagonists used were atropine (0.5–2 μm) and pirenzepine (0.6–10 μm). Glutamate receptor antagonists included CNQX (2–20 μm) and DNQX (2–10 μm), which were applied either singly or in combination with d-AP-7 (100–200 μm). Data from P6 retinas were obtained in the presence of picrotoxin (30–100 μm) or gabazine (SR95531, 25–50 μm) in both the control and test solutions. Error bars indicate SE.Numbers in parentheses indicate the total number of experiments pooled at each age.
Patch-clamp data were acquired with pClamp8 software (Axon Instruments) and analyzed with Origin (Microcal). Synchronous acquisition of patch-clamp and imaging data were accomplished by running pClamp8 and AIW programs simultaneously on a Pentium 600 MHz computer through an analog-to-digital converter (Digidata 1320; Axon Instruments).
RESULTS
Spontaneous waves in the developing rabbit retina
Isolated retinas from E26 to P6 (E31 = day of birth = P0) rabbits were loaded with fura-2 AM and imaged with 380 nm illumination. Most of the dye-loaded cells in the ganglion cell layer (GCL) (Fig. 1A) showed rhythmic increases in the intracellular free Ca2+ concentration, indicated by transient decreases in the emission fluorescence intensity of the dye at 500 nm (Grynkiewicz et al., 1985). These Ca2+transients occurred at a frequency of once every 0.4–8 min, with a duration of 2–6 sec, consistent with the rhythmic bursts of spontaneous depolarization previously recorded with patch clamp from individual starburst and ganglion cells in the same preparation (Zhou, 1998). Figure 1B shows relative changes in the emission fluorescence intensity (ΔF/F) of fura-2 in 16 cells randomly selected from the field shown in Figure1A. The rhythmically bursting cells included both ganglion and displaced starburst amacrine cells, which were identified morphologically (data not shown) after whole-cell recording with a Lucifer yellow-filled pipette at the end of Ca2+ imaging.
Fig. 1.
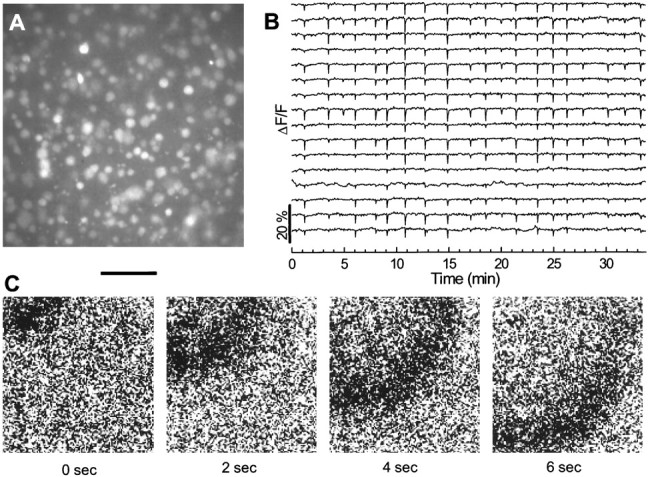
Spontaneous waves of rhythmic activity in a P0 retina. A, Fluorescence image of fura-2 AM-loaded cells in the ganglion cell layer taken with a 40× objective lens.B, Relative (%) changes in fluorescence intensity from 16 cells randomly selected from the field of view shown inA. Downward deflections in each trace indicate transient increases in intracellular free Ca2+ concentration.C, Sequential difference images (ΔF) of a spontaneous wave recorded with a 10× objective lens. The dark region indicates the wavefront where the Ca2+ concentration is elevated. Scale bar:A, 75 μm; C, 400 μm.
The spontaneous activity in the GCL propagated in the form of waves, which could be detected with a low magnification (10 or 4×) objective lens (Fig. 1D). These waves usually passed across the field of view in random directions. The wavefront was 300–600 μm in radial dimension (d) (see definition in Materials and Methods) and propagated at a speed of ∼150–300 μm/sec, thus moving past a point in the retina in ∼2–4 sec. We also observed waves that originated in the field of view. Some of these waves propagated as two-dimensional plane waves with a nearly circular wavefront and some propagated in a circular or spiral direction. Other waves propagated in irregular shapes at a similar speed. Spontaneous retinal waves with similar overall propagation patterns were detected throughout the developmental period (E26–P6) examined in the study.
Dramatic transitions in the cholinergic and glutamatergic systems during postnatal development
To understand how excitatory drives for retinal waves changed during development, we investigated the effect of antagonists to nicotinic, muscarinic, and glutamate receptors at different stages of development. Application of d-tubocurare (curare; 25–100 μm), a nicotinic receptor antagonist, effectively and reversibly blocked the wave in the newborn (P0) rabbit retina (Fig.2A). In contrast, the broad-spectrum muscarinic antagonist atropine (1–3 μm) had no significant effect on spontaneous waves at this age (Fig. 2A); neither did ionotropic glutamate receptor antagonists CNQX and d-AP-7 (applied singly or in combination) abolish the wave (Fig.2A). These results suggest a critical role of the nicotinic, but not the muscarinic or glutamatergic system in early spontaneous waves in the developing rabbit retina.
Fig. 2.

Transitions in neurotransmitter systems.A, Early spontaneous waves in P0 retinas were reversibly blocked by d-tubocurare (curare, 25 μm), but not by atropine (2 μm), CNQX (4 μm), or CNQX (4 μm) + d-AP-7 (200 μm).B, The late spontaneous activity in P4 retinas was no longer sensitive to curare (100 μm) but could be blocked by atropine (0.5 μm) and CNQX (4 μm). Scale bars, 20%.
As development proceeded, however, the pharmacology of spontaneous waves changed drastically. The inhibitory effect of nicotinic antagonists started to diminish quickly after P2, such that at P3–P4 even saturating concentrations of the antagonists (e.g., 400 μm curare) usually only reduced, but did not completely block the wave. By P5, the nicotinic antagonists hexamethonium (HEX) (100 μm; Fig. 2A) and curare (400 μm, data not shown) no longer had a significant effect on the wave. On the other hand, waves in rabbits >P2 became surprisingly sensitive to muscarinic antagonists. Atropine (0.5–1 μm), which had no significant effect on retinal waves in rabbits <P2 (Fig. 2A), completely abolished the late (>P2) retinal wave (Fig. 2B). Thus, starting at P2, there was a dramatic transition from a nicotinic to a muscarinic drive for the wave.
Interestingly, we also discovered that the above transition within the cholinergic system was correlated with another profound transition in the fast excitatory drive for the wave—a transition from a nicotinic receptor-mediated to an ionotropic glutamate receptor-mediated drive. Spontaneous retinal waves in rabbits older, but not younger, than P0–P1 could be blocked by specific non-NMDA receptor antagonists CNQX and DNQX (4–20 μm; Fig. 2B), indicating an emergence of an AMPA/KA receptor-mediated input that eventually replaced the nicotinic system as the primary fast excitatory drive for the wave. The NMDA receptor antagonistd-AP-7 (100–200 μm) also had an inhibitory, but much weaker effect, often reducing the wave frequency without completely abolishing the wave (data not shown).
Figure 3 summarizes the effect of nicotinic, muscarinic, and glutamatergic antagonists on the frequency of spontaneous waves between E26 and P6. As shown in the figure, the emergence of muscarinic and glutamatergic inputs occurred during a similar developmental period (P1–P3), with the glutamatergic drive appearing first at ∼P0–P1, followed by a muscarinic drive starting at ∼P1–P2. The decline of the nicotinic drive also began at ∼P2 but had a slightly slower time course, so that the complete withdraw of the nicotinic drive occurred at ∼P4–P5, after the muscarinic and glutamatergic inputs were securely established (Fig. 3). Thus, the transitions in the cholinergic and glutamatergic systems were well coordinated, strongly suggesting a dramatic and interrelated change in the role of these neurotransmitter systems in spontaneous retinal waves.
The cholinergic and glutamatergic drives had different functional roles in wave production
To understand the functional role of muscarinic and glutamatergic inputs, we examined the spatiotemporal properties of spontaneous waves after they were partially blocked by submaximal concentrations of pirenzepine (PZ) (a relatively selective antagonist for M1 receptors, see below) and CNQX, which blocks non-NMDA receptors. Because the boundary of the waves often lay outside the field of view and were difficult to quantify, we examined the effect of the above two reversible antagonists on the speed (v) and the radial dimension (d) of the wavefront. Both v andd could be definitively measured under a 10× objective lens (see Materials and Methods). In some experiments, we also included 25–100 μm picrotoxin in the control and the test solution to enhance waves in P3–P6 retinas, so that the waves were more robust and less likely to “run down” during long recording periods (>2 hr) and partial blockade of waves by pirenzepine and CNQX was more easily attainable. Picrotoxin significantly increased the speed, size, and frequency of the wave at this age (Zhao et al., 1999). However, the relative effect (percentage of control) of pirenzepine and CNQX on v and d remained similar regardless of the presence of picrotoxin.
As shown in Figure 4, low concentrations of pirenzepine consistently reduced v and d by 30 ± 5% (mean ± SE; n = 21;p < 0.0001; t test) and 36 ± 5% (mean ± SE; n = 21; p < 0.0001;t test), respectively. On the other hand, low concentrations of CNQX significantly reduced the frequency and the amplitude (peak ΔF/F) of the wave (data not shown), but did not reduce v or d (Fig.4A). The average size (d) of the wave in the presence of low concentrations of CNQX was 108 ± 8% (mean ± SE; n = 40; p = 0.34;t test), not significantly different from the control value (Fig. 4A). The wave speed in low concentrations of CNQX was increased somewhat (117 ± 8%; mean ± SE;n = 40; p = 0.04; t test; Fig. 4A). This result was probably because some weak waves were completely blocked by the antagonist, resulting in fewer but predominantly fast and strong waves remaining in the samples. It is also possible that, as the wave frequency was reduced by CNQX, cells would have more time to recover from the refractory process following each wave, resulting in faster and larger waves (Feller et al., 1997). Taken together, these data suggest that the muscarinic drive plays a particularly important role in wave propagation, whereas the glutamatergic drive may be more important for local excitation and wave initiation (see Discussion).
Fig. 4.
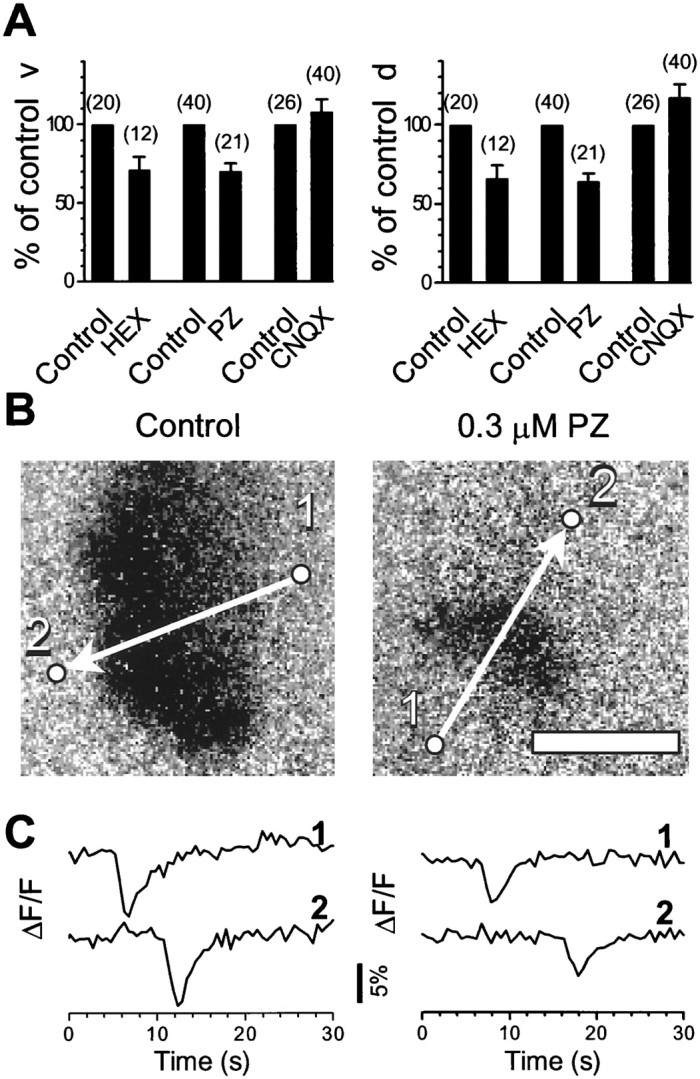
Effects of nicotinic, muscarinic, and glutamate receptor antagonists on the speed v and the radial dimension d of the wavefront. A, Relative (percentage of control) v and d of the wavefront under partial blockade by subsaturating concentrations of HEX (0.1–2 μm), PZ (0.1–0.3 μm, or 1–2 μm in 100 μm picrotoxin), and CNQX (0.2 μm). Numbers in parenthesesindicate the number of waves included in the analysis. Error bars indicate SE. B, Representative waves recorded from a P3 control retina and with 0.3 μm PZ. Images were collected at 2 Hz with an integration time of 300 msec under a 10× objective lens. Arrows indicate the direction of wave propagation. Scale bar, 500 μm. C, Relative changes in the average fluorescence intensity from the circles in B marked with1 and 2, respectively. The distance between each pair of circles is 932 μm. The speedv, calculated from the time delay between the two peaks in traces 1 and 2, is 167 μm/sec in control and 93 μm/sec in PZ. The radial dimension d, calculated from the product ofv and the mean half-amplitude width of the peaks, is 474 μm under control and 233 μm with PZ.
We also tested low concentrations of HEX in the P1 rabbit retina. HEX reduced v and d by 29 ± 8% (mean ± SE; n = 12; p = 0.006; ttest) and 34 ± 8% (mean ± SE; n = 12;p = 0.002; t test), respectively (Fig.4A).
Pharmacological and physiological properties of the cholinergic system
The action of ACh in both the early (<P1) and late (>P2) spontaneous wave was further investigated by perturbing the level of ACh in the retina. Application of ACh (30 μm) reversibly blocked both the early and late wave after a transient increase in Ca2+ concentration in ganglion and displaced amacrine cells (data not shown), suggesting that constant activation and, most likely, desensitization of cholinergic receptors interfered with wave formation. The blocking effect of ACh on the early wave could be mimicked by the nicotinic agonist 1,1-dimethyl-4-phenylpiperazinium (DMPP) (30–50 μm; Fig.5A; n = 3) but not by muscarine (2.5 μm;n = 3; Fig. 5B), suggesting that activation of muscarinic receptors had little influence on the early wave. Because most cells in the ventricular zone of the rabbit retina are strongly excited by muscarinic activation at this age (Wong, 1995), our results also suggest that the activity in the ventricular zone does not contribute significantly to early spontaneous waves in the inner retina.
Fig. 5.

Effects of nicotinic and muscarinic agonists. Application of 50 μm DMPP reversibly blocked the wave after a brief excitation in both P0 (A) and P2 (C) retinas. Muscarine (2.5 μm) reversibly blocked waves in P2 (D) but not in P0 (B) retinas.
In contrast, bath application of muscarine (2 μm,n = 4) after P2 reversibly blocked the wave (Fig.5D) consistent with the age dependence of the atropine effect (Fig. 2B). However, unlike curare, DMPP (30 μm) continued to block the wave after P3 (Fig.5C; n = 2), suggesting that nicotinic receptors remained functional in these cells after the transitions, perhaps to play a role other than directly mediating spontaneous retinal waves. This is also consistent with the fact that ganglion cells in the adult rabbit retina respond to nicotinic agonists with increases in the intracellular free Ca2+concentration (Baldridge, 1996).
Altering the temporal pattern and concentration of endogenously released ACh with the cholinesterase inhibitor neostigmine also had age-dependent effects on spontaneous waves. Waves at E30–P2 (n = 6) were only minimally affected by neostigmaine (4–8 μm), showing a slight and transient reduction in wave frequency (data not shown). However, in three of the five retinas tested at P4–P6, neostigmine (2–4 μm) significantly inhibited the wave (data not shown), suggesting that the rate at which ACh was degraded after the release had a more pronounced effect on the late wave than on the early wave. This is consistent with our conclusion that ACh plays different roles before and after P2–P3.
The identities of nicotinic and muscarinic receptors involved in the wave were further investigated by using more specific antagonists. The action of curare in early waves could be mimicked by hexamethonium (Fig. 6A) and mecamylamine (data not shown), but not by α-bungarotoxin (Fig.6B; n = 3), an antagonist specific for neuronal nicotinic receptors containing α7 subunits (Role and Berg, 1996; Colquboun and Patrick, 1997). The effect of atropine in late waves was mimicked by pirenzepine (0.6–2 μm; Fig. 6C), an antagonist considerably selective for M1 receptors at the concentration used. The atropine effect was also mimicked by 4-diphenylacetoxy-N-(2-chloroethyl)-piperidine hydrochloride (4-DAMP mustard) (100 nm; Fig.6D), an irreversible M3 receptor blocker and, to a much lesser degree, by tropicamide (TROP) (100 nm; Fig. 6E), a relatively selective blocker of M4 receptors. However, the M2 receptor antagonist gallamine (GA) (200 nm; Fig.6D,E; n = 5) did not affect the late wave. Thus, the muscarinic drive in late retinal waves was likely mediated by a combination of M1 and M3 receptors. Preferential inhibition of one of these two receptor subtypes alone was sufficient to block the spontaneous wave. M4 receptor activation may also be involved in the formation of the late wave, but its action was less robust and requires further investigation. Because of the lack of a specific antagonist, it is not yet clear if M5 receptors also contributed to the late wave.
Fig. 6.

Pharmacology of the nicotinic and muscarinic drive for the spontaneous wave. The spontaneous activity in a P0 retina was reversibly blocked by 50 μm HEX (A), but was not blocked by α-bungarotoxin (α-BgTX; 200 nm, B). C, PZ (2.5 μm), but not GA (20 μm) or HEX (100 μm), completely and reversibly blocked the wave in a P4 retina. D, In another P4 retina, 4-DAMP mustard (100 nm) irreversibly blocked the spontaneous waves, whereas GA (200 μm) again did not have any significant effect on the wave. E, TROP (100 nm) also reversibly inhibited the wave, but it took a much longer time to become effective.
To understand whether muscarinic antagonists blocked synaptic inputs to ganglion cells during late retinal waves, patch-clamp recordings were made from ganglion cells in conjunction with Ca2+ imaging in the whole-mount retina. Figure 7 shows an example of simultaneous patch-clamp recording and fluorescence imaging from a P4 retina. The retina was first loaded with fura-2 AM and imaged under a 40× objective lens (Fig. 7B) to determine the presence of spontaneous waves and the location of cells participated in the waves (Fig. 7C). A rhythmically bursting ganglion cell (Fig.7A–C, arrow) was then selected for voltage-clamp recording, while the vicinity of the cell (Fig. 7B, oval area enclosed by the dashed line) was simultaneously imaged for changes in free Ca2+ concentration (Fig.7D). In general, the bursts of synaptic currents in the ganglion cell closely correlated with the rhythmic appearance of spontaneous waves in the local region of the retina. Application of 2 μm of atropine readily blocked both rhythmic synaptic currents in the ganglion cell and Ca2+ waves (Fig. 7D). The blocking effect of atropine was partially reversible after washing out the drug for >10 min (data not shown). These results suggest that synaptic transmission to ganglion cells during the late wave was critically dependent on muscarinic interactions. The site and nature of the muscarinic action are still under investigation.
Fig. 7.
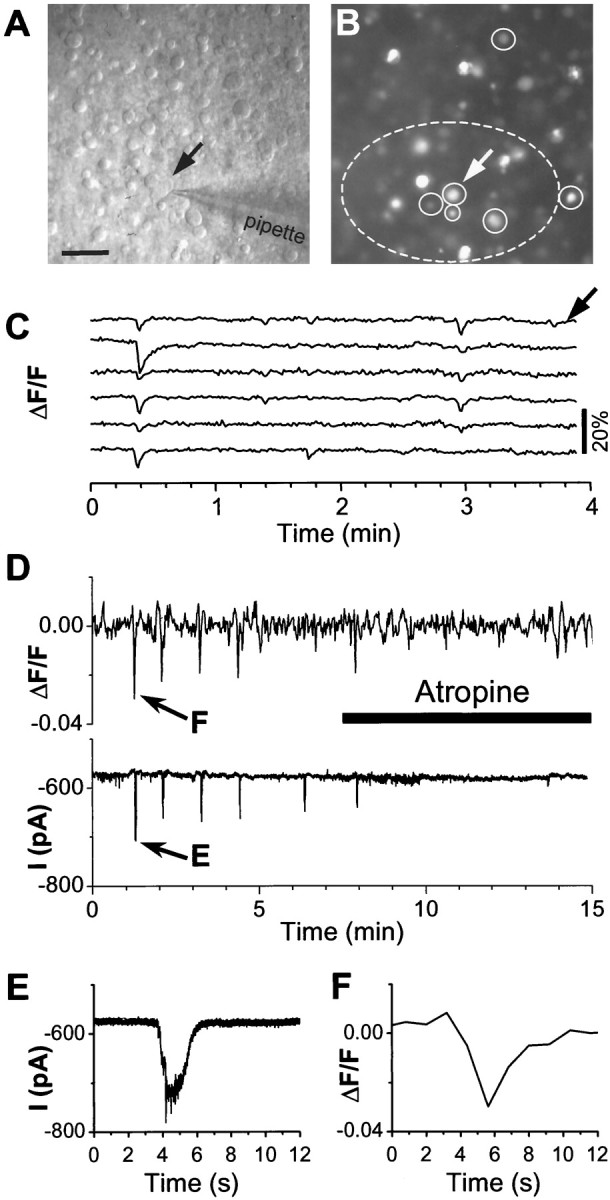
Simultaneous patch-clamp and optical measurement of the atropine effect on late retinal waves and synaptic inputs to ganglion cells. A, A Nomarski image of a P5 rabbit retina showing a ganglion cell (indicated by thearrow, also in B) under whole-cell patch-clamp recording. B, A fluorescence image of the same field as in A, showing fura-2-AM-loaded cells in the ganglion cell layer. Images in A andB were collected with an intensified cooled digital camera under a 40× objective lens. C, Correlated changes in the average fluorescence intensity measured from six randomly selected cells (enclosed by circles inB) immediately before patch-clamp recording.Arrow indicates the trace corresponding to the ganglion cell identified by the arrow in A andB. D, Simultaneous fluorescence measurement (top trace) from the oval area enclosed by thedash line and whole-cell voltage-clamp (bottom trace, Vh = −75 mV) from the same ganglion cell indicated by the arrow inA and B. Bursts of synaptic-like currents in the ganglion cell (also shown on an expanded scale inE) correlated closely with changes in the fluorescence intensity averaged from the oval area (also shown on an expanded scale in F). Atropine (2 μm) blocked both synaptic currents and rhythmic fluorescence changes. The current trace in D was filtered (eight-pole Bessel) at 10 Hz (fc) and digitized at 20 Hz, whereas that in E was filtered at 50 Hz (fc) and digitized at 200 Hz. Optical images were acquired at a rate of one per 900 msec. Scale bar, 50 μm.
DISCUSSION
Coordinated transitions in neurotransmitter systems
This study demonstrates that the excitatory drive for spontaneous waves in the rabbit retina undergoes two coordinated transitions during early postnatal development: one from a fast cholinergic to a fast glutamatergic and the other from a nicotinic to a muscarinic system. The finding that the cholinergic system selectively uses two entirely different classes of receptors for the same transmitter to mediate waves at different developmental stages is both surprising and intriguing. It suggests a novel mechanism by which a neurotransmitter system changes its functional role during development. This mechanism is uniquely economical and conservative because it apparently uses the same basic starburst network as a neuronal substrate.
The emergence of the glutamatergic drive began in rabbits at ∼P0–P1, a developmental stage (∼77% caecal period; Dreher and Robinson, 1988) equivalent to that of ∼P14 ferrets in which a similar appearance of a glutamatergic drive has recently been reported (Wong et al., 2000). It seems that these transitions are correlated with the onset of bipolar cell synaptogenesis in the IPL (McArdle et al., 1977;Greiner and Weidman, 1982; Stone et al., 1985).
Whereas the exact developmental role of the above pharmacological transitions in retinal waves is yet to be understood, these transitions almost certainly reflect changes in the retinal circuitry that supports the spontaneous wave and also indicate different functional roles played by the early and late spontaneous waves. A variety of important developmental events, such as ON/OFF segregation in the IPL and the central visual pathway (Bodnarenko and Chalupa, 1993;Wong and Oakley, 1996; Wong, 1999), is known to occur at the critical stage immediately following the transitions reported here. Many of these events are believed to be activity-dependent and are likely influenced by specific features of the spontaneous retinal wave (Wong and Oakley, 1996). Detailed knowledge of the muscarinic and glutamatergic network in the inner retina is crucial in understanding these specific features of the wave.
A possible network basis for the consistency in the overall pattern of wave propagation
Despite drastic pharmacological changes in spontaneous retinal waves at P1–P3, we found the overall characteristics of the wave remained similar (Zhao et al., 1999), although more detailed properties (e.g., burst frequency in ON and OFF ganglion cells; Fischer et al., 1998) might be altered significantly. Similar findings have also been reported in the retina of other species and in other regions of the developing nervous system, including the hippocampus and spinal cord (for review, see Feller, 1999). These observations have led to the hypothesis (for review, see O'Donovan et al., 1998; Feller, 1999) that the overall spontaneous, rhythmic activity in these developing regions may be dictated mainly by homeostatic mechanisms. According to this theory, the threshold and the refractoriness of the spontaneous excitation are determined by the overall excitatory input from a number of mutually compensating transmitter systems and the efficacy of each system, but not by the detailed identity or circuitry of the excitatory drive. Thus, one may speculate that the transition from the fast cholinergic to the fast glutamatergic drive in spontaneous retinal waves may not drastically change the overall excitability of the network so that the threshold and the refractory process of the spontaneous excitation remain quite similar.
On the other hand, it is well known that the cholinergic and glutamatergic circuits in the vertebrate retina differ completely (Dowling, 1987). In particular, the glutamatergic system is believed to mediate information flow mainly in the vertical direction from the outer to the inner retina (Wässle and Boycott, 1991), whereas the cholinergic system is formed by a unique class of amacrine cell, the starburst cell, whose processes extend laterally and widely in the IPL (Masland and Tauchi, 1986; Vaney, 1990). Thus, it has remained an interesting puzzle as to what enables the glutamatergic system to replace the cholinergic system as the primary fast excitatory drive without drastically changing the macroscopic property of the wave, particularly the characteristics of wave propagation.
We believe our finding of the transition from the nicotinic to the muscarinic system may provide an intriguing clue to this puzzle. Because the late retinal wave is critically dependent on muscarinic transmission, it is almost certain that the starburst network remains essential for the late spontaneous wave. Thus, even after the glutamatergic input replaces the nicotinic system as the major fast excitatory drive for the wave, the cholinergic system, through the activation of muscarinic receptors, continues to play a critical role in the propagation of retinal waves, perhaps by working in conjunction with the glutamatergic system and providing a lateral cholinergic network that could ensure a consistent pattern of wave propagation. Indeed, our results showed that a partial blockade of muscarinic receptors led to smaller and slower waves, whereas a partial block of AMPA/KA receptors reduced the wave frequency and amplitude, but not the size or the speed of the wave. This would suggest that glutamate released from bipolar cells might be more suited for strong but more localized excitation in ganglion and amacrine cells, whereas the cholinergic system might be particularly important for lateral propagation of this excitation. Recent results from turtle and chick retinas, in which the spontaneous waves are driven by both glutamatergic and nicotinic inputs at the ages studied, also showed that a partial nicotinic blockade led to spatial shrinkage of waves, whereas a partial blockade of glutamatergic input reduced the overall excitability but not the spatial extent of the propagation pattern (Sernagor and Grzywacz, 1999; Sernagor et al., 2000).
Thus, in the early developing mammalian retina, the cholinergic system, through the activation of nicotinic receptors, may provide a major excitatory drive for both the initiation and propagation of spontaneous waves [the wave is also likely to be mediated by an excitatory glycinergic drive (Paul and Zhou, 2000) and it may be modulated by a GABAergic input as well (Fischer et al., 1998; Zhao et al., 1999)]. However, after the emergence of the glutamatergic drive, the cholinergic network switches to a muscarinic receptor-mediated system, which may take over the role of the early nicotinic system in mediating wave propagation. Because the muscarinic system also uses the starburst network, this would provide an efficient mechanism for preserving the pattern of wave propagation.
Involvement of second messenger-mediated interactions in the formation of retina waves
For spontaneous retinal waves to play a role in the refinement of retinal circuitry as previously suggested (Sernagor and Grzyacz, 1996), it is likely that the signal transduction mechanism in retinal neurons would include second messenger-mediated interactions as a consequence of the correlated rhythmic activity. However, it was unclear if second messenger-mediated interactions themselves were required for the generation and propagation of spontaneous retinal waves at various stages. Our study provides evidence that metabotropic receptor-mediated synaptic transmission is obligatory for the propagation and/or initiation of the late retinal wave. A recent report by Stellwagen et al. (1999) also showed a second messenger-mediated role of adenosine in modulating early spontaneous waves in the ferret retina. The adenosine receptor agonist, 5′-N-ethylcarboxamidoadenosine (NECA) also enhanced the spontaneous wave in the rabbit retina, but unlike muscarine, NECA increased both the early and the late spontaneous wave (our unpublished observations).
Potential muscarinic actions in the late wave may include modulation of glutamate release from bipolar cells as well as regulation of cellular excitability and synaptic communication among bipolar, amacrine (including the starburst), and ganglion cells. Activation of M1 and M3 receptors typically leads to protein kinase C activation and the production of IP3, which affects intracellular Ca2+ and may pass through gap junctions. Furthermore, it remains a possibility that muscarinic inhibition of M currents may also provide a form of excitation in the network. The existence of muscarinic receptors in the IPL of the developing ferret retina has been demonstrated immunohistochemically (Hutchins, 1994). The exact nature of the muscarinic interaction during retinal waves is still under investigation.
Implications on mechanistic models of spontaneous retinal waves
Our finding of a critical dependence of the late spontaneous wave on the cholinergic network does not support implications from previous studies that as development proceeds the cholinergic contribution to the wave is completely replaced by the glutamatergic drive in the mammalian retina. Our data that the glutamatergic and muscarinic systems played different functional roles in wave formation (Fig. 4) are also incompatible with the hypothesis that the synaptic organization of excitatory inputs is not important for the gross pattern of retinal waves. Thus, a homeostatic model, such as that proposed for the developing spinal cord (for review, see O'Donovan et al., 1998), which provides a good explanation for the initiation and refractoriness of spontaneous excitation in the retina (Feller, 1999), may not be sufficient to account for both the initiation and the propagation of retinal waves. Our results suggest that neuronal network and neurotransmitter circuitry must also be taken into account when modeling spontaneous retinal waves. It will be interesting to find out if a similar muscarinic contribution also exists in the developing retina of other species and in other regions of the nervous system, in which an early nicotinic drive is replaced by another fast excitatory input during development (Chub and O'Donovan, 1998; Milner and Landmesser, 1999).
Footnotes
This study was supported by grants to Z.J.Z. from the National Institutes of Health (RO1 EY01894) and Research to Prevent Blindness, Inc. We thank Dr. Sunil Paul and Ms. Suzanne Bakewell for scientific discussions and Dr. Gordon Fain for helpful comments on this manuscript.
Correspondence should be addressed to Dr. Z. Jimmy Zhou, Department of Physiology and Biophysics, University of Arkansas for Medical Sciences, 4301 West Markham Street, Mail Slot 505, Little Rock, AR 72205-7199. E-mail: zhoujimmy@exchange.uams.edu.
REFERENCES
- 1.Ames A, Nesbett FB. In vitro retina as an experimental model of the central nervous system. J Neurochem. 1981;37:867–877. doi: 10.1111/j.1471-4159.1981.tb04473.x. [DOI] [PubMed] [Google Scholar]
- 2.Baldridge WH. Optical recordings of the effects of cholinergic ligands on neurons in the ganglion cell layer of mammalian retina. J Neurosci. 1996;16:5060–5072. doi: 10.1523/JNEUROSCI.16-16-05060.1996. [DOI] [PMC free article] [PubMed] [Google Scholar]
- 3.Bodnarenko SR, Chalupa LM. Stratification of ON and OFF ganglion cells depends on glutamate-mediated afferent activity in the developing retina. Nature. 1993;364:144–146. doi: 10.1038/364144a0. [DOI] [PubMed] [Google Scholar]
- 4.Catsicas M, Mobbs P. Waves are swell. Curr Biol. 1995;5:977–979. doi: 10.1016/s0960-9822(95)00192-8. [DOI] [PubMed] [Google Scholar]
- 5.Catsicas M, Bonness V, Becker D, Mobbs P. Spontaneous Ca2+ transients and their transmission in the developing chick retina. Curr Biol. 1998;8:283–286. doi: 10.1016/s0960-9822(98)70110-1. [DOI] [PubMed] [Google Scholar]
- 6.Chub N, O'Donovan MJ. Blockade and recovery of spontaneous rhythmic activity after application of neurotransmitter antagonists to spinal networks of the chick embryo. J Neurosci. 1998;18:294–306. doi: 10.1523/JNEUROSCI.18-01-00294.1998. [DOI] [PMC free article] [PubMed] [Google Scholar]
- 7.Cline HT. Activity-dependent plasticity in the visual systems of frogs and fish. Trends Neurosci. 1991;14:104–111. doi: 10.1016/0166-2236(91)90071-2. [DOI] [PubMed] [Google Scholar]
- 8.Colquboun LM, Patrick JW. Alpha3, beta2, and beta4 form heterotrimeric neuronal nicotinic acetylcholine receptors in Xenopus oocytes. J Neurochem. 1997;69:2355. [PubMed] [Google Scholar]
- 9.Copenhagen DR. Retinal development: on the crest of an exciting wave. Curr Biol. 1996;6:1368–1370. doi: 10.1016/s0960-9822(96)00732-4. [DOI] [PubMed] [Google Scholar]
- 10.Constantine-Paton M, Cline HT, Debski E. Patterned activity, synaptic convergence, and the NMDA receptor in developing visual pathways. Annu Rev Neurosci. 1990;13:129–154. doi: 10.1146/annurev.ne.13.030190.001021. [DOI] [PubMed] [Google Scholar]
- 11.Dowling JE. Retina: an approachable part of the brain. Belknap; Cambridge, MA: 1987. [Google Scholar]
- 12.Dreher B, Robinson SR. Development of the retinofugal pathway in birds and mammals: evidence for a common “time-table”. Bran Behav Evol. 1988;31:369–390. doi: 10.1159/000116602. [DOI] [PubMed] [Google Scholar]
- 13.Feller MB. Spontaneous correlated activity in developing neural circuits. Neuron. 1999;22:653–656. doi: 10.1016/s0896-6273(00)80724-2. [DOI] [PubMed] [Google Scholar]
- 14.Feller MB, Wellis DP, Stellwagen D, Werblin FS, Shatz CJ. Requirement for cholinergic synaptic transmission in the propagation of spontaneous retinal waves. Science. 1996;272:1182–1187. doi: 10.1126/science.272.5265.1182. [DOI] [PubMed] [Google Scholar]
- 15.Feller MB, Butts DA, Aaron HL, Rokhsar DS, Shatz CJ. Dynamic processes shape spatiotemporal properties of retinal waves. Neuron. 1997;19:293–306. doi: 10.1016/s0896-6273(00)80940-x. [DOI] [PubMed] [Google Scholar]
- 16.Fischer KF, Lukasiewicz PD, Wong ROL. Age-dependent and cell class-specific modulation of retinal ganglion cell bursting activity by GABA. J Neurosci. 1998;18:3767–3778. doi: 10.1523/JNEUROSCI.18-10-03767.1998. [DOI] [PMC free article] [PubMed] [Google Scholar]
- 17.Goodman CS, Shatz CJ. Developmental mechanisms that generate precise patterns of neuronal connectivity. Cell. 1993;72 [Suppl]:77–98. doi: 10.1016/s0092-8674(05)80030-3. [DOI] [PubMed] [Google Scholar]
- 18.Greiner JV, Weidman TA. Embryogenesis of the rabbit retina. Exp Eye Res. 1982;34:749–765. doi: 10.1016/s0014-4835(82)80035-3. [DOI] [PubMed] [Google Scholar]
- 19.Grynkiewicz G, Poenie M, Tsien RY. A new generation of Ca2+ indicators with greatly improved fluorescence properties. J Biol Chem. 1985;260:3440–3450. [PubMed] [Google Scholar]
- 20.Hutchins JB. Development of muscarinie acetylcholine receptors in the ferret retina. Brain Res Dev Brain Res. 1994;82:45–61. doi: 10.1016/0165-3806(94)90147-3. [DOI] [PubMed] [Google Scholar]
- 21.Katz LC, Shatz CJ. Synaptic activity and the construction of cortical circuits. Science. 1996;274:1133–1138. doi: 10.1126/science.274.5290.1133. [DOI] [PubMed] [Google Scholar]
- 22.Masland RH, Tauchi M. The cholinergic amacrine cells. Trans Neurosci. 1986;9:218–223. [Google Scholar]
- 23.McArdle CB, Dowling JE, Masland RH. Development of outer segments and synapses in the rabbit retina. J Comp Neurol. 1977;175:253–274. doi: 10.1002/cne.901750302. [DOI] [PubMed] [Google Scholar]
- 24.Milner LD, Landmesser LT. Cholinergic and GABAergic inputs drive patterned spontaneous motoneuron activity before target contact. J Neurosci. 1999;19:3007–22. doi: 10.1523/JNEUROSCI.19-08-03007.1999. [DOI] [PMC free article] [PubMed] [Google Scholar]
- 25.O'Donovan MJ. The origin of spontaneous activity in developing networks of the vertebrate nervous system. Curr Opin Neurobiol. 1999;9:94–104. doi: 10.1016/s0959-4388(99)80012-9. [DOI] [PubMed] [Google Scholar]
- 26.O'Donovan MJ, Chub N, Wenner P. Mechanisms of spontaneous activity in developing spinal networks. J Neurobiol. 1998;37:131–145. doi: 10.1002/(sici)1097-4695(199810)37:1<131::aid-neu10>3.0.co;2-h. [DOI] [PubMed] [Google Scholar]
- 27.Paul SS, Zhou ZJ (2000) The essential role of cholinergic and glycinergic inputs in spontaneous waves in the early developing rabbit retina. Soc Neurosci Abstr, in press.
- 28.Penn AA, Riquelme PA, Feller MB, Shatz CJ. Competition in retinogeniculate patterning driven by spontaneous activity. Science. 1998;279:2108–2112. doi: 10.1126/science.279.5359.2108. [DOI] [PubMed] [Google Scholar]
- 29.Role LW, Berg DK. Nicotinic receptors in the development and modulation of CNS synapses. Neuron. 1996;16:1077–85. doi: 10.1016/s0896-6273(00)80134-8. [DOI] [PubMed] [Google Scholar]
- 30.Sernagor E, Grzywacz NM. Influence of spontaneous activity and visual experience on developing retinal receptive fields. Curr Biol. 1996;6:1503–1508. doi: 10.1016/s0960-9822(96)00755-5. [DOI] [PubMed] [Google Scholar]
- 31.Sernagor E, Grzywacz NM. Spontaneous activity in developing turtle retinal ganglion cells: pharmacological studies. J Neurosci. 1999;19:3874–87. doi: 10.1523/JNEUROSCI.19-10-03874.1999. [DOI] [PMC free article] [PubMed] [Google Scholar]
- 32.Sernagor E, Eglen S, O'Donovan MJ. Differential effects of acetylcholine and glutamate blockade on the spatiotemporal dynamics of retinal waves. J Neurosci. 2000;20:RC56. doi: 10.1523/JNEUROSCI.20-02-j0004.2000. [DOI] [PMC free article] [PubMed] [Google Scholar]
- 33.Stellwagen D, Shatz CJ, Feller MB. Dynamics of retinal waves are controlled by cyclic AMP. Neuron. 1999;24:673–685. doi: 10.1016/s0896-6273(00)81121-6. [DOI] [PubMed] [Google Scholar]
- 34.Stone J, Egan M, Rapaport DH. The site of commencement of retinal maturation in the rabbit. Vision Res. 1985;25:309–317. doi: 10.1016/0042-6989(85)90055-0. [DOI] [PubMed] [Google Scholar]
- 35.Vaney DI. The mosaic of amacrine cells in the mammalian retina. In: Osborne NN, Chader G, editors. Progress in retinal research. Pergamon; Oxford: 1990. pp. 49–100. [Google Scholar]
- 36.Wässle H, Boycott BB. Functional architecture of the mammalian retina. Physiol Rev. 1991;71:447–480. doi: 10.1152/physrev.1991.71.2.447. [DOI] [PubMed] [Google Scholar]
- 37.Wong ROL. Cholinergic regulation of [Ca2+]i during cell division and differentiation in the mammalian retina. J Neurosci. 1995;15:696–706. doi: 10.1523/JNEUROSCI.15-04-02696.1995. [DOI] [PMC free article] [PubMed] [Google Scholar]
- 38.Wong ROL. Retinal waves and visual system development. Annu Rev Neurosci. 1999;22:29–47. doi: 10.1146/annurev.neuro.22.1.29. [DOI] [PubMed] [Google Scholar]
- 39.Wong ROL, Oakley DM. Changing patterns of spontaneous bursting activity of on and off retinal ganglion cells during development. Neuron. 1996;16:1087–1095. doi: 10.1016/s0896-6273(00)80135-x. [DOI] [PubMed] [Google Scholar]
- 40.Wong WT, Sanes JR, Wong ROL. Developmentally regulated spontaneous activity in the embryonic chick retina. J Neurosci. 1998;18:8839–8852. doi: 10.1523/JNEUROSCI.18-21-08839.1998. [DOI] [PMC free article] [PubMed] [Google Scholar]
- 41.Wong WT, Myhr KL, Miller ED, Wong ROL. Developmental changes in the neurotransmitter regulation of correlated spontaneous retinal activity. J Neurosci. 2000;20:351–360. doi: 10.1523/JNEUROSCI.20-01-00351.2000. [DOI] [PMC free article] [PubMed] [Google Scholar]
- 42.Zhao D, Cornett L, Zhou ZJ. Consistency and modulation of spontaneous waves of excitation in the developing rabbit retina. Soc Neurosci Abstr. 1999;25:1806. [Google Scholar]
- 43.Zhou ZJ. Direct participation of starburst amacrine cells in spontaneous rhythmic activities in the developing mammalian retina. J Neurosci. 1998;18:4155–4165. doi: 10.1523/JNEUROSCI.18-11-04155.1998. [DOI] [PMC free article] [PubMed] [Google Scholar]
- 44.Zhou ZJ, Zhao D. Age-dependent and receptor type-specific role of acetylcholine in spontaneous waves of retinal excitation. Soc Neurosci Abstr. 1999;25:1042. [Google Scholar]