

Abstract
Remyelination of the CNS is necessary to restore neural function in a number of demyelinating conditions. Schwann cells, the myelinating cells of the periphery, are candidates for this purpose because they have more robust regenerative properties than their central homologs, the oligodendrocytes. Although the ability of Schwann cells to remyelinate the CNS has been demonstrated, their capacity to enter the adult spinal cord in large numbers and effect functional recovery remains uncertain. We used cholera toxin B-subunit conjugated to saporin to demyelinate the rat lumbar spinal cord, remove macroglia, and produce paraplegia. After the removal of oligodendrocyte and astrocyte debris by invading macrophages, there was a spontaneous entry of Schwann cells into the spinal cord, along with axonal remyelination and concomitant functional recovery from paraplegia occurring within 75 d. The Schwann cells appeared to enter the dorsal funiculi via the dorsal root entry zone and the lateral funiculi via rootlets that had become adherent to the lateral spinal cord after the inflammation. In the following weeks, Schwann cell myelin surrounding central axons was progressively replaced by oligodendrocyte myelin without lapse in motor function. Our results show that endogenous Schwann cells can reverse a severe neurological deficit caused by CNS demyelination and enable later oligodendrocyte remyelination.
Keywords: demyelination, remyelination, oligodendrocyte, saporin, cholera toxin, reactive astrocytes
The observation that Schwann cells can myelinate central axons (for review, see Duncan and Hoffman, 1997;Franklin and Barnett, 1997) has led to proposals that Schwann cells could be used therapeutically to repair demyelinated spinal cord in conditions in which oligodendrocyte myelination is failing or inadequate. To this end, a number of studies have examined the conditions under which endogenous or transplanted Schwann cells can successfully myelinate central axons, and evidence is now available showing that Schwann cells can restore conduction in central axons (Franklin, 1999). The advantage of using Schwann cells to remyelinate the cord lies in their remarkable regenerative capacity. In the peripheral nervous system, Schwann cells actively proliferate after nerve damage and are integral in the subsequent repair process (Johnson et al., 1988; Weinstein, 1999). For Schwann cells to be considered as a viable therapy for central demyelinating conditions, in addition to being capable of remyelinating large areas of the cord (Scolding et al., 1998), they would have to restore debilitating motor functional deficits of the type resulting from large-scale demyelination. Finally, after remyelinating CNS axons, Schwann cells have to be capable of long-term survival in the CNS to ensure permanent recovery of function, an issue that remains unresolved (Baron-Van Evercooren et al., 1992; Dusart et al., 1992).
To examine the long-term remyelination and recovery of function by Schwann cells, we intrathecally injected the cholera toxin B-subunit conjugated to saporin (CTB-Sap). Saporin is a cytotoxic protein extracted from soapwort (Saponaria officinalis) and belongs to the group of ribosome-inactivating proteins that includes ricin. When conjugated to a ligand that binds to specific cell membrane receptors, saporin is internalized with the ligand and destroys the cell by interfering with protein synthesis (Bergamaschi et al., 1996). In recent years, various saporin conjugates have been used in vivo to remove specific cell populations in the CNS (Mantyh et al., 1997; Wiley and Lappi, 1997; Rohde and Basbaum, 1998;Llewellyn-Smith et al., 1999). The carrier used in this study, CTB, binds to the cell surface monosialoganglioside GM1 (Cuatrecasas, 1973;Svennerholm, 1976; Czerkinsky et al., 1996), which is present in high concentrations in oligodendrocyte myelin (Yu and Iqbal, 1979; Cochran et al., 1982) and astrocytes (Byrne et al., 1988). Intrathecal injection of CTB-Sap resulted in large-scale removal of oligodendrocytes and astrocytes, creating optimal conditions for Schwann cells to migrate in and myelinate the spinal cord. Notably, oligodendrocyte removal was accomplished without damage to neurons, ventral or dorsal rootlets, or Schwann cells.
MATERIALS AND METHODS
Sixty-one adult male and female Sprague Dawley rats (260–300 gm) (Harlan Sprague Dawley, Indianapolis, IN) were used in this study. All animals were on a 12 hr light/dark cycle, and food and water were available ad libitum at all stages of the disease. Procedures for the maintenance and use of the experimental animals were approved by the Animal Care and Use Advisory Committees at Georgetown University and the University of California, San Francisco, and were performed in accordance with National Institutes of Health regulations on animal use.
Drug delivery. Intrathecal injections were made in the lumbosacral subarachnoid space, either by lumbar puncture at the L5–6 level, or through a 32 ga polyethylene catheter (Micor, Allison Park, PA) inserted through the atlanto-occipital membrane and directed 8.5 cm caudally. The following drugs were diluted in 10 μl of sterile 0.9% saline and injected over a 1 min period: CTB-Sap (3 μg; n = 43), saporin (Advanced Targeting Systems, San Diego, CA) (5 μg; n = 3), substance-P conjugated to saporin (SP-Sap; Advanced Targeting Systems) (1 μg; n= 3), CTB conjugated to horseradish peroxidase (CTB-HRP; List Biologic, Campbell, CA) (5 μg; n = 4), or sterile saline (n = 5). The latter four groups served as control for the specificity of the effects of CTB-Sap. CTB-Sap (lot 5-145, Advanced Targeting Systems) was synthesized according to a previously described protocol (Picklo et al., 1994). When a catheter was used, an additional 5 μl of saline was injected to ensure that the entire volume of drug was delivered. Subcutaneous injections of 12.5 μg/10 μl of CTB-Sap were made in three additional rats.
Neurological status. Motor and sensory functions were tested daily and videotaped every 3 d during the first 30 d after injection and every 15 d thereafter. Rats were videotaped in a walkway composed of a mirror on one side (to visualize the side of the rat away from the observer) and a Plexiglas panel on the other. Animals walked spontaneously or were encouraged by gentle petting; no water restriction or other reinforcement means were used. The rats were habituated to this environment and to handling by the experimenter before any treatment.
Videotaped recordings of the moving rats were captured on a computer, and the animals were scored by a frame-by-frame analysis of the videos using video-processing software (Avid Cinema for Macintosh; Avid Technology, Tewksbury, MA). Each animal was examined for proximal and distal tail tonus, maximum hindlimb and forelimb extension, toe spread, and overall gait. The degree of motor impairment was quantified according to the parameters shown in Table 1, adapted from a standard experimental autoimmune encephalomyelitis scale (Reynolds et al., 1996). It should be noted that for each score (see Table 1), the animal had the impairment listed for that score plus all the impairments of the lower scores, i.e., the impairment was additive and progressive. Because the most evident and reliable deficit was reduced hindlimb extension, we evaluated the capacity to extend the hindlimb and keep the hindquarters elevated when walking by measuring the end-of-stance angle, i.e., the angle between the dorsal aspect of the foot and the leg at the end of the stance, the point when the hindlimb reached its maximal extension (see Fig. 1, Score 0). End-of-stance angles (six frames per animal per session) were measured with the “measure angles” tool using the NIH Image software (National Institutes of Health, http://rsb.info.nih.gov/nih-image/). The animal was considered to show minor weakness when the end-of-stance angle was between 50 and 80° and the knee did not touch the floor (see Fig. 1,Score 1.5). Moderate weakness was defined as the state when the end-of-stance angle was <50° and the knee touched the floor (see Fig. 1, Score 2). We also evaluated the reflex to extend the legs, dorsiflex the paws, and spread the toes when held up vertically in the air (see Fig. 2). The toe spread was recorded as complete, incomplete, or absent, and the direction of the toes and paws (upward, downward, outward to the front or to the side) was also noted, as described in Table 1. Except for paraplegic animals (score ≥ 3), the six end-of-stance angles at each session were averaged to give the mean angle, and this value was used in determining the motor impairment score for the animals at each session. For each time point after injection of CTB-Sap, an average score for all animals was calculated from the scores of the individual animals.
Table 1.
Scale used to quantify the degree of motor function
| Motor impairment | Neurological score |
|---|---|
| None | 0 |
| Loss of distal tail tonus | 0.5 |
| Complete loss of tail tonus | 1 |
| Incomplete toe spread, minor weakness in hindlimb extension1-a | 1.5 |
| Toes do not spread apart, moderate weakness in hindlimb extension1-b | 2 |
| Marked proximal hindlimb paresis,1-c distal paralysis | 2.5 |
| Complete hindlimb paralysis | 3 |
| Slight paresis of the distal forelimbs | 3.5 |
| Moderate proximal forelimb paresis | 4 |
End-of-stance angle between 80 and 50°; the knee never touches the floor; when the rat is held vertically in the air, the paws are elevated, and the toes are directed upward.
End-of-stance angle ≥50°; the knee touches or rests on the floor; when the rat is held vertically in the air, the paws are splayed outward to the front or sideways. The rat can stand on the hindlimbs only if leaning against a vertical support.
On the walking surface, the hindlimbs are splayed outward, and paws are everted. The rat uses the forelimbs for forward movement; there is movement of the hips but no purposeful movement of distal hindlimbs. The rat is unable to raise the hindquarters against gravity (paws and toes remain downward when held vertically) and cannot stand up on the hindlimbs.
Fig. 1.
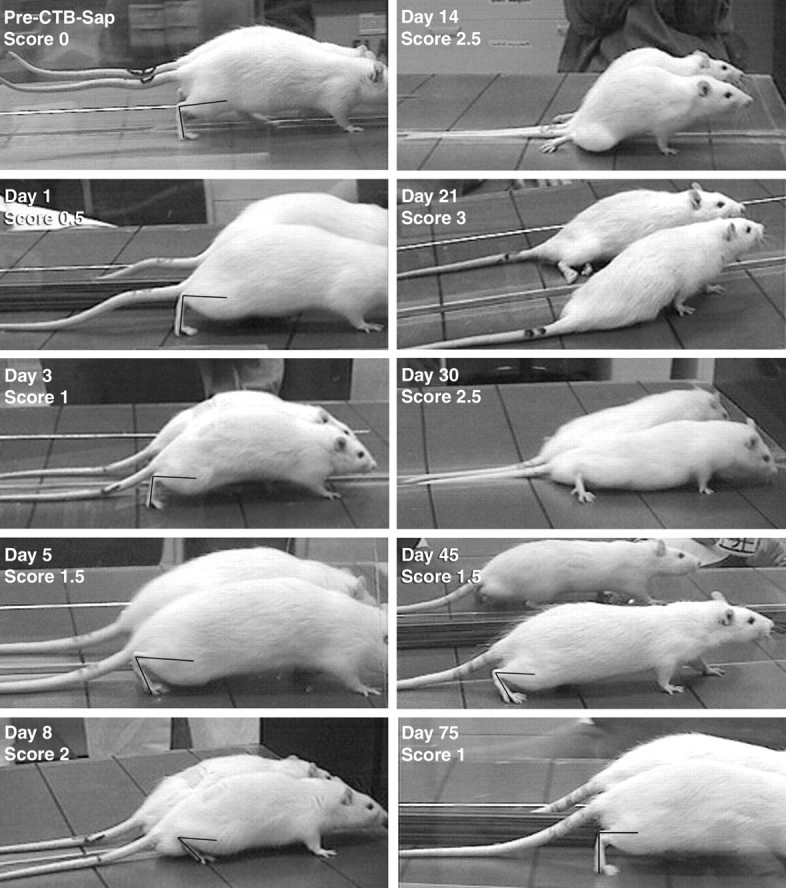
Frames taken from videotaped recordings of rats walking across a flat surface at different stages of the ascending paraplegia after intrathecal CTB-Sap injection. When applicable, frames were chosen at the end of the stance during the step cycle, and the angle between the hindpaw and leg was drawn and measured to quantify hindlimb weakness and attribute neurological scores (see Materials and Methods). Before treatment (pre-CTB-Sap), rats can fully extend their hindpaws, and the end-of-stance angle is >80° (here 88.8°). The tail is also fully extended and does not touch the ground. One day after treatment, the tail tonus is decreased, especially at its distal half (Score 0.5). On Day 3, the tail is entirely limp (Score 1), although the end-of-stance angle remains >80° (here 92.3°). At Day 5, some early weakness of the hindlimbs is visible because rats do not extend the limb to complete a full step, as shown here by the decrease in end-of-stance angle to 62.1° (Score 1.5). The next frames of the video show the rat lifting and swinging the limb forward without completing the step. At Day 8, this angle is further reduced to <50° (here 40.7°), and the knees touch the ground during the middle and end-of-the-step cycle (Score 2). At Day 14, rats can no longer use their hindlimbs to perform a full step cycle. The limbs are splayed outward, and rats show some flexion-extension movement of the hindlimbs (Score 2.5). Complete hindlimb paralysis is reached atDay 21; the distal hindquarters are spastic, and rats show no movement of the hindlimbs (Score 3). Early signs of recuperation are visible at Day 30, when animals are able to flex and extend their hindlimbs again, although the knees remain in contact with the ground the majority of the time. AtDay 45, rats can again bear their weight on the hindlimbs, and the end-of-stance angle returns to between 50 and 80° (here 57.0°). At Day 75, neurological deficits are almost completely reversed. Rats can now fully extend their hindlimbs at the end-of-stance (here 90.4°). Tail tonus has not yet returned.
Fig. 2.

Frames taken from videotaped recordings of rats at different stages of the disease, illustrating the capacity to spread the toes, dorsiflex the paws, and extend the legs when held up vertically. Evaluation of these movements, together with the end-of-stance angle when walking, was used to assign neurological scores (see Materials and Methods). Before CTB-Sap treatment, animals fully and vigorously extended the legs and paws and spread the toes apart. Five days after CTB-Sap administration, rats only partially spread the toes apart; the paws were still dorsiflexed (Score 1.5). At 8 d, rats could no longer spread the toes or fully dorsiflex the paws (Score 2). By 14 d, rats were unable to spread or extend the toes or dorsiflex the paws, but there was still movement of the proximal hindlimbs when resting on the ground (Score 2.5). When rats reached full paralysis of the hindlimbs at 21 d, there was no movement of the hindquarters, and the hindlimbs were spastic (Score 3), with the paws and toes curled inward. At 75 d, toes spread, paws dorsiflexed, and leg extension reflex was reestablished (Score 1).
Sensory function was tested daily during the first month after injection and every week thereafter. To assess nociceptive responses, a paper clip was applied to the middle third of the hindpaw in a nontraumatic fashion, and the withdrawal or vocalization response was recorded as present or absent. To test innocuous tactile sensation, the rat was held vertically, and the dorsal aspect of the hindpaw was brushed against the underside of a table, after which the reflex to lift and place the paw on the table (paw-placing reflex) was recorded as present or absent.
At 75 and 150 d after injection, rats were tested on an accelerating rotarod apparatus and compared with age-matched control rats injected with saline (n = 5). Rats were tested every other day for 6 d, the first two sessions serving to habituate the animals and the third one to test motor performance. The rats were placed on the rotarod running at a constant low speed (60 cm/min). Once the test animal was walking, the rotarod was changed to accelerating mode with a cutoff speed of 108 cm/min at 5 min. The time each animal was able to remain on the rotarod was recorded for each trial by a treatment-blind observer. All measurements were analyzed using Fisher's exact test and Mann–Whitney test.p < 0.05 was considered significant.
Histology. Rats were deeply anesthetized and perfused transcardially with aldehyde fixatives in 0.1 mphosphate buffer at pH 7.4.
Light microscopy. Paraformaldehyde (4%) was used for perfusion. Fifty-micrometer-thick sections were cut on a freezing microtome and stained with either (1) luxol fast blue, (2) cresyl violet, (3) luxol fast blue with cresyl violet counterstaining (Klüver and Barrera stain), or (4) hematoxylin and eosin. Immunocytochemistry was performed according to standard protocols at antibody dilutions recommended by the manufacturer using primary antisera directed against the following: Schwann cells (Schwann/2E) (Dr. Y. Nakazato, Gunma University, Gunma, Japan) (Arai et al., 1998); protein P zero (P0) (Dr. J. Archelos, Karl-Franzens-University, Graz, Austria); p75 neurotrophin receptor (p75) (Dr. L. Reichardt, University of California, San Francisco, CA); glial fibrillary acidic protein (GFAP; Roche-Boehringer, Indianapolis, IN; Clone G-A-5); oligodendrocytes (MAB1580) (Chemicon, Temecula, CA,); OX-8, OX-33, OX-35, OX-39, OX-42, and HIS-48 (PharMingen, San Diego, CA); ED1 (Serotec, Raleigh, NC); CTB (List Biologic, Campbell, CA); or saporin (Advanced Targeting Systems). We found that the Schwann/2E and P0 antibodies produced equivalent staining, and therefore both antibodies were used to identify myelinating Schwann cells.
Electron microscopy. A mixture of 2% paraformaldehyde and 2% glutaraldehyde was used for perfusion. Vibratome sections (50 μm) were osmicated and stained en bloc with 2% uranyl acetate before being dehydrated and embedded in Epon. Semi-thin (1.0 μm) sections were stained with toluidine blue for light microscopy, and thin sections (10 nm) were stained with lead citrate for electron microscopy.
Quantification. Measurements were done using a computer-controlled microscope (StereoInvestigator; Microbrightfield, Colchester, VT). The total area of spinal white matter and the area of demyelination were measured from luxol fast blue-stained sections to derive the percentage of demyelinated white matter. To measure change in central myelination over time, the area of spinal white matter consisting of mature oligodendrocyte myelin, new oligodendrocyte myelin, and Schwann cell myelin was measured from toluidine blue-stained 1.0 μm Epon sections. The results from animals of the same postinjection time were pooled. The diameter of demyelinated axons was calculated from the measured area. All measurements were analyzed using Fisher's exact test and Mann–Whitney test.p < 0.05 was considered significant.
RESULTS
Intrathecal administration of CTB-Sap (3 μg; n = 43) consistently resulted in extensive spinal cord demyelination accompanied by distinct neurological deficits, primarily an ascending paraplegia, that reversed over several weeks (Figs.1–3, Table1). Control groups receiving intrathecal injections of saporin alone (5 μg; n = 3), CTB-HRP (5 μg; n = 4), SP-Sap (1 μg; n = 3), saline (n = 5), or subcutaneous injection of CTB-Sap (12.5 μg/10 μl; n = 3) in the footpad showed no motor deficits or signs of spinal demyelination. We therefore conclude that the spinal pathology reported here is specific to the CTB-Sap conjugate. This agrees with previous studies showing that, at the present doses, CTB or unconjugated saporin is nontoxic when administered in the intrathecal space (Schwerer et al., 1986; Mantyh et al., 1997). Two animals were perfused at 24 hr and two animals at 48 hr after CTB-Sap administration, and the spinal cord was immunostained for CTB and saporin. CTB and saporin immunoreactivity were seen in the subarachnoid space at both time points, but no labeling could be detected in the spinal cord or spinal rootlets (n = 4; data not shown). This suggests that the concentration of CTB-Sap entering the spinal cord was below the level of detection by immunocytochemistry.
Paralytic phase
The ascending paralysis induced by intrathecal CTB-Sap reached a maximum severity at 15–21 d (n = 23) after injection (Fig. 3). The first noticeable signs appeared 1 d after administration as weight loss (7.9 ± 0.53% in CTB-Sap vs 1.2 ± 1.0% in control groups), constant whole body tremor, and partial loss of tail tonus (motor impairment score 0.5; see Materials and Methods), which progressed to full loss of tail tonus (score 1) in the following 24–48 hr. Between days 4 and 7, rats showed signs of distal hindlimb weakness, increasing from difficulty in spreading the toes and minor weakness in leg extension when walking (end-of-stance angle 67.4 ± 7.1°) (Figs. 1, 2), to inability to spread the toes, decreased hindlimb extension (end-of-stance angle 42.7 ± 4.2°; score 2), and a waddling gait. Between days 8 and 12, the distal hindlimbs became limp and were splayed outward, and the animal lost the ability to use them (score 2.5). By days 15–18, rats displayed a flaccid paralysis followed by spastic paralysis that developed at ∼21 d (Fig. 2, Score 3) and urinary retention in males. The flaccid stage of the paralysis is interpreted as resulting from a state of spinal shock. Although animals had no withdrawal to innocuous stimulation of the hindpaws, they did vocalize, indicating that nociception was preserved.
Fig. 3.

Evolution of the clinical status over time after intrathecal CTB-Sap. a, Graph of the mean neurological scores, showing that motor impairment increased progressively during the first 2 weeks after treatment and peaked between 15 and 21 d. Recuperation of motor function was steady but slower over the following weeks. b, Mean percentage weight change from weights on the day of treatment (before injection) in rats treated with intrathecal CTB-Sap (n = 23) and controls (n = 15) (combined data from saporin-, SP-Sap-, CTB-HRP-, and saline-injected rats). After a significant weight loss in the first 3 to 5 d after CTB-Sap injection, weights stabilized over the next 2 weeks. Weight recovery began at 18 d, and rats reached their pretreatment weights by 23 d. Weight increase continued until the end of the observation period. Controls showed only a minor drop in weight in the first 2 d after injection, after which weights briefly stabilized and began to steadily increase until the end of the observation period. Error bars denote the SEM.
Histology at 21 d (n = 8) revealed extensive demyelination (Fig. 4) of the lumbosacral spinal white matter that extended from the periphery of the spinal cord toward the gray matter. An area of unaffected oligodendrocyte myelin remained around the gray matter and was clearly demarcated from the demyelinated area (Fig. 4a, asterisk). Measurements from luxol fast blue-stained sections showed that approximately half (51.6 ± 9.7%; n = 3) of the white matter was demyelinated. An inflammatory infiltrate, easily recognizable by the darkly stained nuclei, was present in the subarachnoid space and in the demyelinated regions of the spinal cord (Fig. 4b). Immunocytochemistry for OX-42 (Fig.4c) and ED1 (data not shown) identified many of these cells as macrophages. Also present, but not illustrated here, were granulocytes (HIS-48 immunopositive) and a small number of lymphoblasts (OX-39 immunopositive), but markers for lymphocytes (OX-8, CD8 T cells; OX-35, CD4 T cells; and OX-33, B lymphocytes) were not detected, indicating that there was no immune-specific response.
Fig. 4.
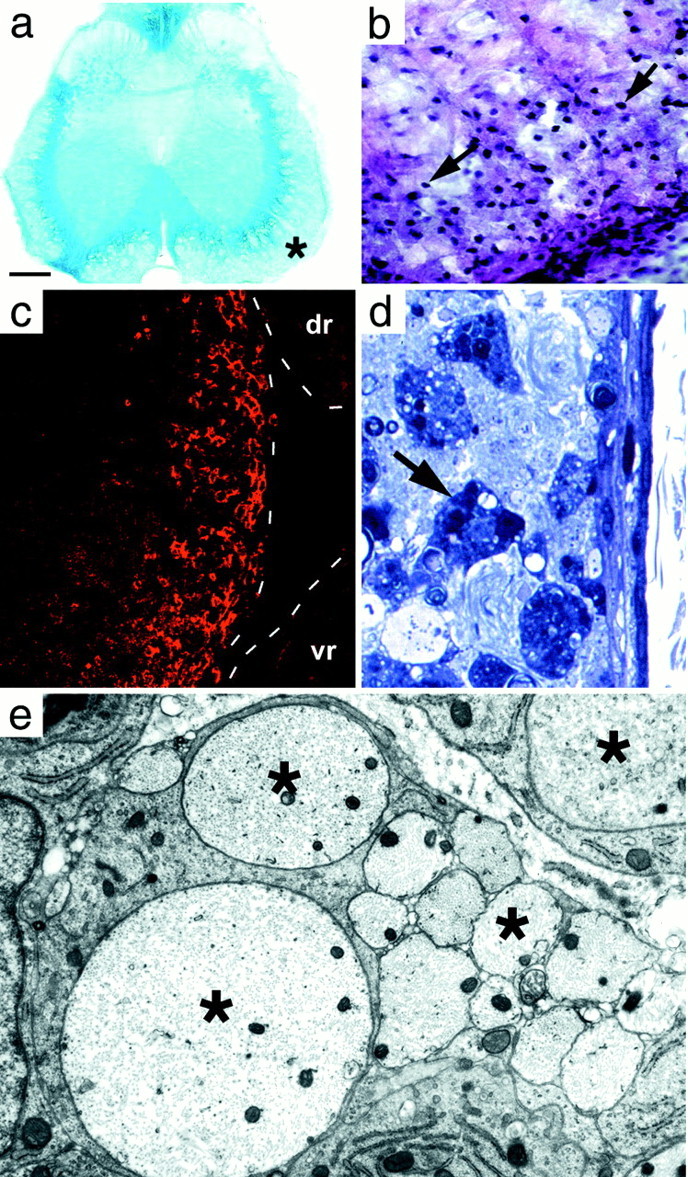
Transverse L5–6 lumbar spinal cord sections at day 21. a, Luxol fast blue stain. The demyelinated peripheral part of the cord is pale blue, whereas the unaffected myelin adjacent to the gray matter is darker blue. b, Klüver and Barrera-stained portion of ventral funiculus (asterisk in a). The surface of the cord is at the bottom right. The nuclei of infiltrating cells (arrows) are most numerous in the subpial area (bottom right corner), decreasing toward the inner edge of the demyelinated area. c, OX-42 immunostaining confirms that these cells were macrophages. Dashed linesindicate the edges of the spinal cord and the dorsal (dr) and ventral (vr) rootlets. There are no inflammatory cells in the rootlets because there is no demyelination occurring there. d, Semi-thin section showing the demyelinated subpial region. Myelin is absent; many darkly stained macrophages (arrow) are visible. e, Electron micrograph of demyelinated axons (asterisk) in the subpial region. Scale bar (shown in a):a, 270 μm; b, 25 μm;c, 85 μm; d, 10 μm; e, 0.8 μm.
Semi-thin Epon sections of the demyelinated area showed darkly stained phagocytic cells (Fig. 4d) containing numerous inclusions that were found by electron microscopy to be principally myelin debris. Axons within the demyelinated region appeared morphologically normal (Fig. 4e), and many were of a diameter (mean 3.02 μm, range 1.12–5.87 μm; n = 56) that was characteristic of myelinated axons (Samorajski and Friede, 1968). The astrocytic processes forming the glia limitans, considered to be the barrier to entry of the Schwann cells (Fraher, 1992), were disrupted at many sites around the periphery of the cord (Fig.5, compare a withb, reformed glia limitans at 75 d), but a continuous basement membrane was present. Motoneurons in the ventral horn appeared normal in number and appearance, and there was no evidence of neuronal degeneration. Examination of the dorsal and ventral rootlets showed a small number of fibers undergoing Wallerian degeneration that were scattered among normal fibers (1.8 ± 0.65%; n = 23). There appeared to be no primary toxicity to Schwann cell myelin, and no demyelinated fibers or macrophages were seen anywhere in the rootlets (Fig. 4c). Finally, unbiased quantitative sampling of toluidine blue-stained Epon sections of the entire white matter at the rostral cervical level showed 0.5% (±0.15; n = 6 rats) degenerating fibers. This histological evidence points to central demyelination as the principal cause of the neurological deficits.
Fig. 5.
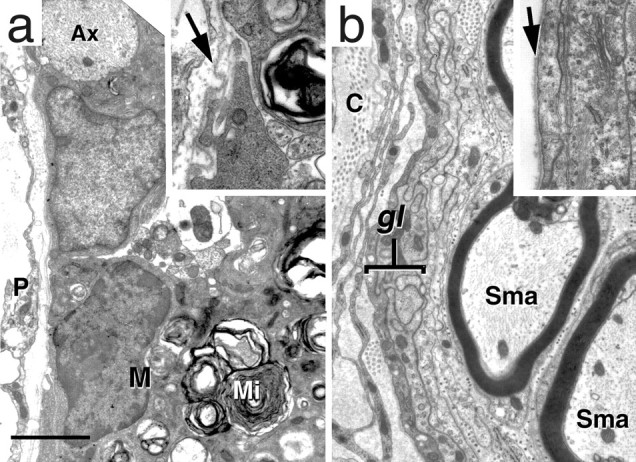
Electron micrographs showing the margin of the cord at 21 d (a) and 75 d (b). a, The margin of the cord has no glia limitans (compare with b). Note that a demyelinated axon (Ax) lies at the very edge of the cord. A macrophage (M) with myelin inclusions (Mi) is also present. A higher magnification (inset) shows that the basement membrane is still present (arrow). b, Theglia limitans (gl) has reformed by day 75, and Schwann cell myelinated axons (Sma) are present immediately adjacent to theglia limitans. Inset, High magnification showing the glia limitans and basement membrane (arrow). C, Collagen; P, pia. Scale bar (shown in a): a, 2.3 μm;inset, 0.7 μm; b, 1.4 μm;inset, 1.25 μm.
Early recovery phase
Despite the severity of demyelination and motor deficits at 21 d, the rats steadily and consistently began to recuperate function and, by d 30 (n = 15), showed some ability to move the hindpaws but not enough to support their own weight (Fig. 1,Day 30, Score 2.5). The return of function coincided with the remyelination of the spinal cord by Schwann cells that first appeared as a thin rim around the periphery of the spinal cord (Fig. 6a) (n = 3). The majority of axons in the Schwann cell-infiltrated region was surrounded by Schwann cell myelin sheaths (Fig. 6b–d), but some axons were embedded in Schwann cell cytoplasm, as found in peripheral nervous system unmyelinated axons. Schwann cells were surrounded by a basement membrane, and collagen was present in the extracellular space (Fig. 6d) as in the peripheral nervous system. Reactive astrocytes were also present at this time as a band of intensely GFAP-immunopositive cells at the inner border of the demyelinated area (Fig. 6a) and were separated from the region containing Schwann cells by a demyelinated area that contained neither oligodendrocytes nor Schwann cells (Fig.6a–b). Unbiased quantitative sampling of toluidine blue-stained Epon sections of the entire white matter at the rostral cervical level showed only 0.13% (± 0.07; n = 6 rats) degenerating fibers.
Fig. 6.
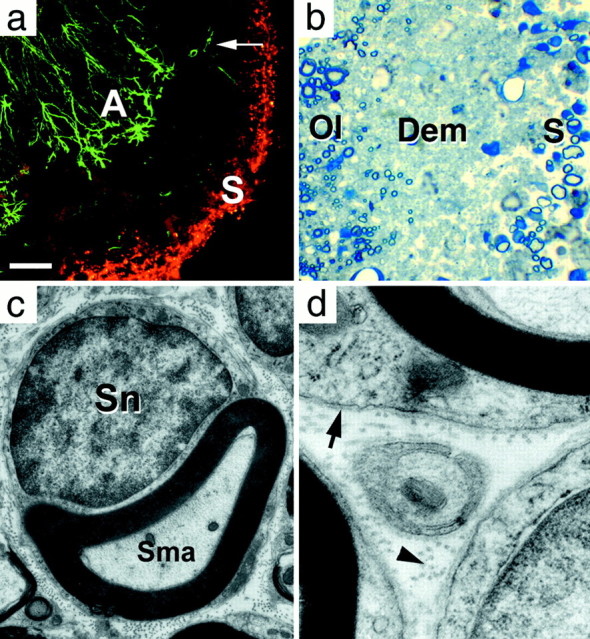
Transverse L5–6 lumbar spinal cord sections at day 30. a, Ventral funiculus double-immunolabeled for astrocytes (GFAP, green) and Schwann cells (Schwann/2E,red) (Arai et al., 1998). Immuolabeled Schwann cells (S) form a band along the periphery of the spinal cord, separated from labeled reactive astrocytes (A) by the demyelinated area where a few residual nonreactive astrocytes (arrow) remain. b, Semi-thin section showing scattered Schwann cell myelinated axons (S) at the periphery of the cord, separated from the oligodendrocyte myelinated region (Ol) by a demyelinated region (Dem) containing only axons.c, d, Electron micrographs from the Schwann cell myelinated region in b, showing a Schwann cell myelinated axon (Sma), basement membrane (arrow), and collagen (arrowhead).Sn, Schwann cell nucleus. Scale bar (shown ina): a, 100 μm; b, 10 μm; c, 0.9 μm; d, 0.2 μm.
Late recovery phase
From day 30, the motor performance steadily progressed until, by day 75, the animals (n = 12) had largely recovered from their motor deficits (Figs. 1, 2, Day 75, Score 1) and could walk normally, stand on their hindpaws without leaning, spread their toes, and dorsiflex their paws. The only overt sign of residual deficit was a limp tail, except for one animal with minor residual paraparesis. The improvement in motor performance correlated with a large increase in Schwann cell myelination (Fig.7a,b), such that an area equivalent to the demyelinated area seen in early animals (48.36 ± 4.14%; n = 3) (Table2) was now remyelinated principally by Schwann cells. No Wallerian degeneration was seen in the rootlets at this or later time points.
Fig. 7.
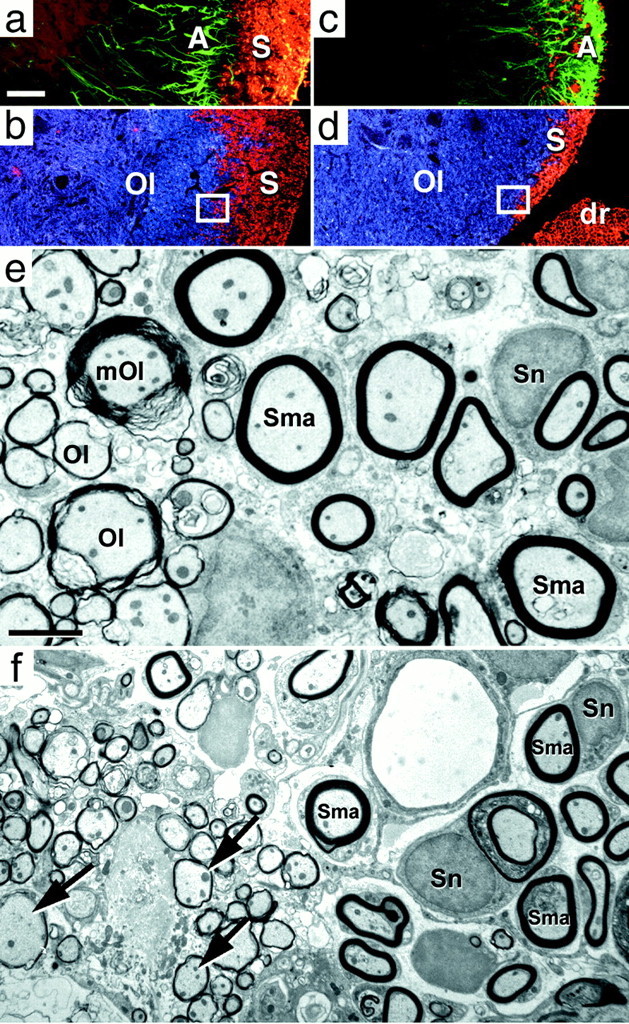
Transverse L5–6 lumbar spinal cord sections at days 75 (a, b, e) and 150 (c, d, f), immunolabeled for astrocytes (GFAP, green), Schwann cells (Schwann/2E, red), and oligodendrocytes (MAB 1580,blue). a, b, Day 75: the previously demyelinated area is now entirely occupied by Schwann cell immunolabeling (S). Schwann cells are now in direct contact with reactive astrocytes (A).c, d, Day 150: oligodendrocytes (Ol) progressed centrifugally and now occupy the medial part of the area formerly populated by Schwann cells. The astrocytes have also advanced to the periphery where they coexist with residual Schwann cells. dr, Dorsal rootlet.e, Day 75: EM section taken from the interface between the oligodendrocyte and Schwann cell myelin (similar to boxed region in b) shows the juxtaposition of newly oligodendrocyte myelinated axons (Ol) and Schwann cell myelinated axons (Sma). The majority of oligodendrocyte myelination is characterized by thin myelin sheaths (new myelin) and lack of associated cytoplasm or nucleus. One axon myelinated by residual mature oligodendrocyte myelin (mOl) is present. f, Day 150: EM section taken from the interface between the oligodendrocyte and Schwann cell myelin (similar to boxed region ind). Numerous thinly oligodendrocyte-myelinated axons (arrows) of the oligodendrocyte remyelinating region are adjacent to Schwann cell myelinated axons (Sma). Thepale circular structure at the top rightof the image is a blood vessel. Sn, Schwann cell nucleus. Scale bars: (shown in a)a–d, 100 μm; (shown ine) e, 2.4 μm; f, 3.7 μm.
Table 2.
Comparison of spinal cord white matter myelination
| Days after CTB-Sap | Total area of white matter | Mature oligodendrocyte area | New (thinly myelinated) oligodendrocyte area | Schwann cell myelinated area |
|---|---|---|---|---|
| 75 (n = 3) | 2.86 × 106 μm2 ± 1.18 ×10⁴ | 49.07 ± 4.42% | 2.56 ± 0.29% | 48.36 ± 4.14% |
| 150 (n = 3) | 3.25 × 106 μm2 ± 4.77 × 10⁴ | 58.40 ± 4.68% | 14.27 ± 2.21% | 27.33 ± 2.86% |
The limit of Schwann cell expansion was coincident with the location of a band of reactive astrocytes (Fig. 7a) that gave the appearance of a wall inhibiting further expansion of the Schwann cells. The inhibitory effect of astrocytes on Schwann cells has been documented (Baron-Van Evercooren et al., 1992; Franklin and Blakemore, 1993) and is considered to be a cause of the limited Schwann cell remyelination described in some experimental models. It should be noted that the Schwann cell myelination was not exclusive in that small fingers or islands of new oligodendrocyte myelin (area of interspersed new oligodendrocyte myelin at 75 d) (2.56 ± 0.29%;n = 3) (Table 2) infiltrated the Schwann cell region at 75 d after injection. The glia limitans appeared normal at this time (Fig. 5b).
Post-recovery phase
Between 75 and 150 d after injection, there was a slight additional improvement in the neurological score, including return of the proximal tail tonus. Similarly, testing on a rotarod apparatus showed a slight improvement over the performance seen at 75 d. In contrast to the small functional improvement, histological analysis and measurements of the types of myelination (Table 2) showed a dramatic change in the cellular composition of the spinal cord white matter. Schwann cell myelination was considerably reduced and confined to a narrow band at the periphery of the spinal cord, whereas the remainder of the white matter was myelinated by mature and newly formed oligodendrocyte myelin (Fig. 7c–e, Table 2). Immunocytochemistry showed that reactive astrocytes and oligodendrocytes were present at the edge of the Schwann cell myelinated area and also formed fingers or islands that were insinuated within the area of Schwann cells (Fig. 7c,d).
Origin of central Schwann cells
The origin of Schwann cells that enter the CNS after demyelination has not been firmly established and may well vary according to the type of initial demyelination. Routes of entry such as dorsal rootlets, blood vessels, and associated autonomic nerves have been found (Sims et al., 1998). To examine this question, we injected 20 additional animals with CTB-Sap. Between days 8 and 28 after injection, two rats were perfused every other day, and the tissue was immunostained for p75 receptor and P0 protein to determine the location of nonmyelinating and myelinating Schwann cells, respectively. Nonmyelinating (p75 positive) Schwann cells were first seen in the dorsal funiculi and as a thin rim around the lateral white matter in two of four animals between 12 and 14 d after injection (Fig.8a). At this time, there was no P0 labeling in the cord, although dorsal and ventral rootlets were heavily labeled (data not shown). Between days 16 and 28, all animals had some p75 labeling in both the dorsal and lateral funiculi. The label in the dorsal funiculi appeared continuous with the dorsal rootlets, but there appeared to be no continuity between the dorsal rootlet labeling and the labeling in the lateral funiculus. It was noted at the time of dissection that many dorsal rootlets were attached to the lateral aspect of the spinal cord as a result of the CTB-Sap-induced arachnoiditis. When observed in transverse sections (Fig. 8a,b), the lateral funiculus Schwann cell labeling was coincident with regions of adherent rootlets, and, in some sections, p75-immunostained processes appeared to extend between the rootlet and the surface of the cord (Fig.8c). The p75 immunolabeling in the lateral funiculus was quite extensive and, in terms of area (mean 114 × 103 μm2; SD 50.7 × 10³; n = 5), was larger than the dorsal funiculus label (mean 92 × 103 μm2; SD 36 × 103, n = 5), making the lateral funiculus the major site of Schwann cell entry.
Fig. 8.
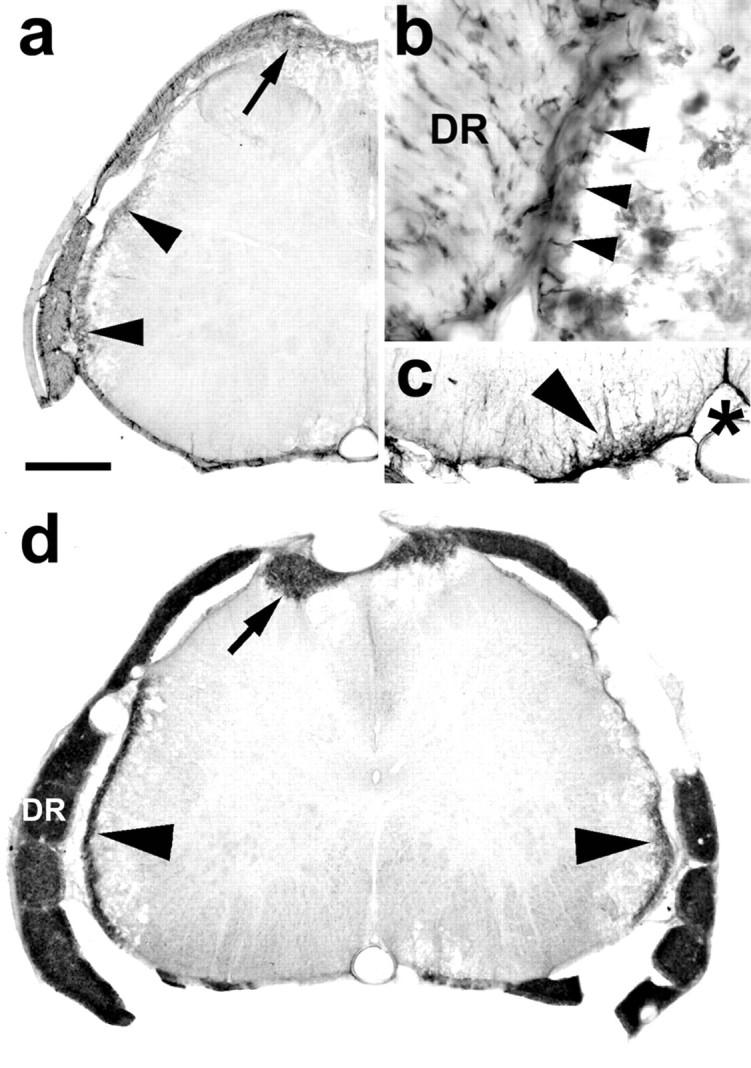
Transverse sections of the lumbar spinal cord showing p75 and P0 immunolabeling. a, At 16 d after injection, the migration into the cord of nonmyelinating, p75-immunolabeled cells is seen in the dorsal part of the dorsal funiculi (arrow) and as a thin band at the periphery of the lateral funiculus (arrowheads).b, High magnification of a close apposition between a dorsal rootlet (DR) and the lateral spinal cord with continuity (arrowheads) of the p75 immunolabeling between the two structures. c, Example of p75 in the ventral funiculus (arrowhead), medial to the ventral root entry zone. *, Ventral fissure and ventral spinal artery.d, At 26 d after injection, P0 labeling (indicating the transition of Schwann cells from the nonmyelinating to myelinating stage) is present in the dorsal rootlets (DR) and dorsal funiuculi (arrow) and as a thin rim around the lateral margin (arrowheads) of the cord. The small areas of P0 staining at the ventral root exit zone were all peripheral in this animal. P0 in the ventral cord was not seen until 28 d and later, after injection. Scale bar (shown in a): a,d, 480 μm; b, 130 μm;c, 240 μm.
P75 receptor staining was seen less frequently in the spinal cord white matter adjacent to the ventral root exit zone (Fig. 8c), occurring in only 8 of the 12 cases in which there was also dorsal and lateral p75 staining. In cases in which there was a measurable ventral p75 label, its extent was far less (mean area 15.5 × 103 μm2; SD 9.7 × 10³; n = 5) than the area of dorsal or lateral p75 receptor labeling. Comparison of the p75 receptor cell density in the five cases analyzed showed variation between cases (mean 3.3 cells per 104 μm2; range 2.0–5.4; SD 1.4; n = 5), but within animals there was no difference between the cell densities of the dorsal, lateral, and ventral areas. In the three other animals that showed ventral expression of p75, the labeling consisted of only two or three cells and processes.
The distribution of P0 staining (Fig.8d) followed the spatial pattern observed for p75 labeling occurring in the dorsal and lateral funiculi but occurred at a later time than the p75 labeling. The appearance of P0indicates the transition of the nonmyelinating Schwann cells to the myelinating form; P0 was seen in the dorsal and lateral funiculi at day 24 and in the ventral funiculus of one animal at day 28 after CTB-Sap injection.
DISCUSSION
Methodological considerations
Intrathecal injection of CTB-Sap resulted in the loss of both oligodendrocytes and astrocytes but had little effect on spinal cord neurons or spinal rootlets, including Schwann cells. Although GM1, the ganglioside to which CTB-Sap binds, is expressed on the surface of neurons (Abe and Norton, 1974; Byrne et al., 1988), it is probable that the large amount of myelin in the white matter binds the majority of the injected CTB-Sap, resulting in a diffusion gradient such that the most medial white matter and gray matter are unaffected. The sparing of central axons could be attributable to the lack of internalization of GM1. The absence of toxicity to the rootlet myelin was unexpected because Schwann cell myelin contains GM1 (Fong et al., 1976), and intrathecal administration of cholera toxin or an antiserum against GM1 has been shown to cause demyelination in the spinal rootlets (Schwerer et al., 1986). The mechanisms of sparing of the majority of spinal rootlet myelin by CTB-Sap need further investigation.
For studies requiring extensive demyelination, CTB-Sap has a number of advantages. The high affinity of the CTB to oligodendrocyte myelin, combined with the toxicity of saporin, allows extremely small quantities to be injected intrathecally and avoids the mechanical trauma of direct injections into the spinal cord. The resulting demyelination and remyelination are widespread, involving the dorsal, lateral, and ventral funiculi over many spinal cord segments. Clear, measurable, behavioral deficits can be monitored over time to follow the evolution of functional deficits and relate these to cellular changes in the cord.
Motor restoration
In this study, the most compelling evidence that the recovery from paraplegia was mediated by Schwann cell myelination is that the time course of the return of function closely followed the time course of peripheral myelin spreading throughout the cord. The first sign of return of motor function that occurs between 21 and 30 d coincided with the time that Schwann cells were present in the spinal cord and were remyelinating axons, whereas the time at which the Schwann cell remyelination reached its maximal extent coincided with the full restoration of walking at 75 d. Although there is some oligodendrocyte remyelination during the period of behavioral recovery, the amount is small (<3%) compared with the amount of Schwann cell remyelination and is not likely to be a significant factor in functional recovery. Similarly, the minimal amount of Wallerian degeneration seen in the dorsal and ventral rootlets would not explain the extent of paralysis, nor would peripheral regeneration explain the recovery.
In addition to restoring axonal conduction, Schwann cells also probably aid the survival of axons both by myelinating the fibers and releasing diffusible growth factors (Raabe et al., 1996; Weinstein, 1999). The protective function of Schwann cells on central axons has not received much attention but is worth noting in view of recent evidence showing that there is significant loss of axons after long-term demyelination in multiple sclerosis patients (Trapp et al., 1998; Ganter et al., 1999; Lovas et al., 2000).
There is little evidence for the argument that the behavioral recovery was not supported principally by the Schwann cell remyelination. Studies have shown that Schwann cell myelination is able to restore axonal conduction (Felts and Smith, 1992; Yezierski et al., 1992;Honmou et al., 1996). Jeffery and Blakemore (1997) have shown that there is no improvement in beam walking tests when remyelination by a mixed population of oligodendrocytes and Schwann cells is prevented by irradiation. Finally, evidence from clinical studies shows a close relationship in multiple sclerosis between the degree of demyelination and the degree of functional impairment (Kidd et al., 1996; Stevenson et al., 1998). The possibility that recovery of function is mediated by some form of neural reorganization in the ventral horn is unlikely in the present study, especially because there was little morphological evidence of motor neuron or peripheral nerve damage. Similarly, recovery of conduction by demyelinated fibers (Felts et al., 1997) is not likely to be sufficient to support the degree of recovery seen here.
Astrocytes and the glia limitans
In the present study, the intrathecal injection of CTB-Sap removes the majority of both oligodendrocytes and astrocytes from the periphery of the spinal cord. The subsequent migration and remyelination by Schwann cells then takes place in an environment that is essentially free of macroglia and proceeds until contact is made with a band of reactive astrocytes located medially in the white matter where the oligodendrocyte myelin is present. This apparently unrestricted migration and proliferation of Schwann cells in an astrocyte-free milieu supports the findings of Blakemore (Blakemore and Crang, 1989;Franklin and Blakemore, 1993) and others (Guenard et al., 1994) who have shown that endogenous astrocytes inhibit movement of Schwann cells injected into the spinal cord.
Another issue of importance is the origin of the Schwann cells invading the CNS. The Schwann cell entry through the dorsal root entry zone supports previous studies (Duncan et al., 1988; Gilmore et al., 1993), but in cases in which ventral entry occurred we have no evidence that blood vessels were involved, as is the case in some other models (Sims et al., 1998). A further important site of Schwann cell entry found in this study was the lateral funiculus, where Schwann cells appeared to cross into the lateral white matter at sites of adherence between the dorsal rootlets and the lateral cord. This latter route of entry appears unique to this model and presumably results from the disruption of the glia limitans together with a local inflammation, resulting in adherence of the dorsal rootlets, a situation not reported in other studies. This finding suggests that the entry of Schwann cells into the CNS can occur at any site where there is both an interruption in the glia limitans and a ready source of Schwann cells.
Long-term viability of Schwann cells in the spinal cord
An unexpected finding of this study was the replacement of peripheral myelin by central myelin at long survival times. The underlying event that triggers the removal of Schwann cells is not clear. It is unlikely to be simply the failure of Schwann cells to survive in a CNS milieu, because one would expect to see the loss of Schwann cells throughout the cord rather than the progressive centrifugal loss that does occur. Initially, the expansion of the Schwann cells progresses as far as the band of reactive astrocytes that are already present; then the subsequent retraction of the Schwann cells is concurrent with the advance of the reactive astrocyte layer. It does not appear, however, that the proximity of the Schwann cells to the astrocytes is sufficient to trigger Schwann cell removal. This is best seen at the pial surface of the spinal cord where Schwann cells are immediately adjacent to reformed glia limitans. These Schwann cells had a normal morphology and were still capable of myelinating axons. The astrocytic processes forming the glia limitans were of normal appearance, further indicating that it is not the Schwann cells that trigger the astrocytes to become reactive. It has been suggested that, for the astrocyte to be fully effective in inhibiting Schwann cell remyelination, the presence of oligodendrocytes is also necessary (Franklin and Blakemore, 1993). We suggest that a combination of oligodendrocytes and astrocytes is also necessary for the removal of Schwann cells once they have myelinated CNS axons. Although there have been questions concerning the regenerative capacity of spinal cord oligodendrocytes or progenitors, the amount of oligodendrocyte remyelination in the present study suggests that the supply of new oligodendrocytes in not a limiting factor. In support of this, two recent studies have shown that a large number of proliferating oligodendrocyte progenitors are in the adult rat spinal cord (Horner et al., 2000) and that demyelination triggers the generation of a large progenitor population (di Bello et al., 1999).
Although not all studies have followed Schwann cell survival for the time period of this study, it is generally believed that Schwann cells, once in the CNS, form a stable population (Baron-Van Evercooren et al., 1992). The displacement of Schwann cells in the present model is therefore surprising, and the mechanism underlying this event remains to be determined. Even in the peripheral nervous system, it is not known what factors cause Schwann cells to desheath from injured axons (Mirsky and Jessen, 1996). It is not clear whether the removal of Schwann cells results from the particular conditions of the present model or is indicative of a more general mechanism not fully realized in other models. Therefore, despite the effectiveness of Schwann cells in restoring function shown here, the long-term viability of Schwann cells in the CNS needs further investigation.
Footnotes
This work was supported by The National Multiple Sclerosis Society. We thank Drs. Y. Nakazato, J. Archelos, and L. Reichardt for providing antibodies; Dr. S. Marchand and J.-M. Racicot for assistance on experiments; Duc Tien for technical assistance; and Dr. H. J. Ralston III for encouragement and support.
Correspondence should be addressed to Dr. P. T. Ohara, Department of Anatomy, University of California, San Francisco, 513 Parnassus Avenue, San Francisco, CA 94143-0452. E-mail:pto@itsa.ucsf.edu.
REFERENCES
- 1.Abe T, Norton WT. The characterization of sphingolipids from neurons and astroglia of immature rat brain. J Neurochem. 1974;23:1025–1036. doi: 10.1111/j.1471-4159.1974.tb10755.x. [DOI] [PubMed] [Google Scholar]
- 2.Arai H, Hirato J, Nakazato Y. A novel marker of Schwann cells and myelin of the peripheral nervous system. Pathol Int. 1998;48:206–214. doi: 10.1111/j.1440-1827.1998.tb03894.x. [DOI] [PubMed] [Google Scholar]
- 3.Baron-Van Evercooren A, Clerin-Duhamel E, Lapie P, Gansmuller A, Lachapelle F, Gumpel M. The fate of Schwann cells transplanted in the brain during development. Dev Neurosci. 1992;14:73–84. doi: 10.1159/000111650. [DOI] [PubMed] [Google Scholar]
- 4.Bergamaschi G, Perfetti V, Tonon L, Novella A, Lucotti C, Danova M, Glennie MJ, Merlini G, Cazzola M. Saporin, a ribosome-inactivating protein used to prepare immunotoxins, induces cell death via apoptosis. Br J Haematol. 1996;93:789–794. doi: 10.1046/j.1365-2141.1996.d01-1730.x. [DOI] [PubMed] [Google Scholar]
- 5.Blakemore WF, Crang AJ. The relationship between type-1 astrocytes, Schwann cells and oligodendrocytes following transplantation of glial cell cultures into demyelinating lesions in the adult rat spinal cord. J Neurocytol. 1989;18:519–528. doi: 10.1007/BF01474547. [DOI] [PubMed] [Google Scholar]
- 6.Byrne MC, Farooq M, Sbaschnig-Agler M, Norton WT, Ledeen RW. Ganglioside content of astroglia and neurons isolated from maturing rat brain: consideration of the source of astroglial gangliosides. Brain Res. 1988;461:87–97. doi: 10.1016/0006-8993(88)90727-5. [DOI] [PubMed] [Google Scholar]
- 7.Cochran FB, Jr, Yu RK, Ledeen RW. Myelin gangliosides in vertebrates. J Neurochem. 1982;39:773–779. doi: 10.1111/j.1471-4159.1982.tb07959.x. [DOI] [PubMed] [Google Scholar]
- 8.Cuatrecasas P. Gangliosides and membrane receptors for cholera toxin. Biochemistry. 1973;12:3558–3566. doi: 10.1021/bi00742a032. [DOI] [PubMed] [Google Scholar]
- 9.Czerkinsky C, Sun JB, Lebens M, Li BL, Rask C, Lindblad M, Holmgren J. Cholera toxin B subunit as transmucosal carrier-delivery and immunomodulating system for induction of anti-infectious and antipathological immunity. Ann NY Acad Sci. 1996;778:185–193. doi: 10.1111/j.1749-6632.1996.tb21127.x. [DOI] [PubMed] [Google Scholar]
- 10.di Bello IC, Dawson MR, Levine JM, Reynolds R. Generation of oligodendroglial progenitors in acute inflammatory demyelinating lesions of the rat brain stem is associated with demyelination rather than inflammation. J Neurocytol. 1999;28:365–381. doi: 10.1023/a:1007069815302. [DOI] [PubMed] [Google Scholar]
- 11. Duncan ID, Hoffman RL. Schwann cell invasion of the central nervous system of the myelin mutants. J Anat 190 1997. 35 49 [Erratum (1997) 191:318–319] [DOI] [PMC free article] [PubMed] [Google Scholar]
- 12.Duncan ID, Hammang JP, Gilmore SA. Schwann cell myelination of the myelin deficient rat spinal cord following X-irradiation. Glia. 1988;1:233–239. doi: 10.1002/glia.440010309. [DOI] [PubMed] [Google Scholar]
- 13.Dusart I, Marty S, Peschanski M. Demyelination, and remyelination by Schwann cells and oligodendrocytes after kainate-induced neuronal depletion in the central nervous system. Neuroscience. 1992;51:137–148. doi: 10.1016/0306-4522(92)90478-K. [DOI] [PMC free article] [PubMed] [Google Scholar]
- 14.Felts PA, Smith KJ. Conduction properties of central nerve fibers remyelinated by Schwann cells. Brain Res. 1992;574:178–192. doi: 10.1016/0006-8993(92)90815-q. [DOI] [PubMed] [Google Scholar]
- 15.Felts PA, Baker TA, Smith KJ. Conduction in segmentally demyelinated mammalian central axons. J Neurosci. 1997;17:7267–7277. doi: 10.1523/JNEUROSCI.17-19-07267.1997. [DOI] [PMC free article] [PubMed] [Google Scholar]
- 16.Fong JW, Ledeen RW, Kundu SK, Brostoff SW. Gangliosides of peripheral nerve myelin. J Neurochem. 1976;26:157–162. [PubMed] [Google Scholar]
- 17.Fraher JP. The CNS-PNS transitional zone of the rat. Morphometric studies at cranial and spinal levels. Prog Neurobiol. 1992;38:261–316. doi: 10.1016/0301-0082(92)90022-7. [DOI] [PubMed] [Google Scholar]
- 18.Franklin RJM. Remyelination—a regenerative process in the CNS. The Neuroscientist. 1999;5:184–191. [Google Scholar]
- 19.Franklin RJM, Barnett SC. Do olfactory glia have advantages over Schwann cells for CNS repair? J Neurosci Res. 1997;50:665–672. doi: 10.1002/(SICI)1097-4547(19971201)50:5<665::AID-JNR4>3.0.CO;2-F. [DOI] [PubMed] [Google Scholar]
- 20.Franklin RJM, Blakemore WF. Migration of Schwann cells. Requirements for Schwann cell migration within CNS environments: a viewpoint. Int J Dev Neurosci. 1993;11:641–649. doi: 10.1016/0736-5748(93)90052-F. [DOI] [PMC free article] [PubMed] [Google Scholar]
- 21.Ganter P, Prince C, Esiri MM. Spinal cord axonal loss in multiple sclerosis: a postmortem study. Neuropathol Appl Neurobiol. 1999;25:459–467. doi: 10.1046/j.1365-2990.1999.00205.x. [DOI] [PubMed] [Google Scholar]
- 22.Gilmore SA, Phillips N, White P, Sims TJ. Schwann cell induction in the ventral portion of the spinal cord. Brain Res Bull. 1993;30:339–345. doi: 10.1016/0361-9230(93)90262-a. [DOI] [PubMed] [Google Scholar]
- 23.Guenard V, Gwynn LA, Wood PM. Astrocytes inhibit Schwanncell proliferation and myelination of dorsal root ganglion neurons in vitro. J Neurosci. 1994;14:2980–2992. doi: 10.1523/JNEUROSCI.14-05-02980.1994. [DOI] [PMC free article] [PubMed] [Google Scholar]
- 24.Honmou O, Felts PA, Waxman SG, Kocsis JD. Restoration of normal conduction properties in demyelinated spinal cord axons in the adult rat by transplantation of exogenous Schwann cells. J Neurosci. 1996;16:3199–3208. doi: 10.1523/JNEUROSCI.16-10-03199.1996. [DOI] [PMC free article] [PubMed] [Google Scholar]
- 25.Horner PJ, Power AE, Kempermann G, Kuhn HG, Palmer TD, Winkler J, Thal LJ, Gage FH. Proliferation and differentiation of progenitor cells throughout the intact adult rat spinal cord. J Neurosci. 2000;20:2218–2228. doi: 10.1523/JNEUROSCI.20-06-02218.2000. [DOI] [PMC free article] [PubMed] [Google Scholar]
- 26.Jeffery ND, Blakemore WF. Locomotor deficits induced by experimental spinal cord demyelination are abolished by spontaneous remyelination. Brain. 1997;120:27–37. doi: 10.1093/brain/120.1.27. [DOI] [PubMed] [Google Scholar]
- 27.Johnson EM, Jr, Taniuche M, DiStefano PS. Expression and possible function of nerve growth factor receptors on Schwann cells. Trends Neurosci. 1988;11:299–304. doi: 10.1016/0166-2236(88)90090-2. [DOI] [PubMed] [Google Scholar]
- 28.Kidd D, Thorpe JW, Kendall BE, Barker GJ, Miller DH, McDonald WI, Thompson AJ. MRI dynamics of brain and spinal cord in progressive multiple sclerosis. J Neurol Neurosurg Psychiatry. 1996;60:15–19. doi: 10.1136/jnnp.60.1.15. [DOI] [PMC free article] [PubMed] [Google Scholar]
- 29.Llewellyn-Smith IJ, Martin CL, Arnolda LF, Minson JB. Retrogradely transported CTB-saporin kills sympathetic preganglionic neurons. NeuroReport. 1999;10:307–312. doi: 10.1097/00001756-199902050-00019. [DOI] [PubMed] [Google Scholar]
- 30.Lovas G, Szilagyi N, Majtenyi K, Palkovits M, Komoly S. Axonal changes in chronic demyelinated cervical spinal cord plaques. Brain. 2000;123:308–317. doi: 10.1093/brain/123.2.308. [DOI] [PubMed] [Google Scholar]
- 31.Mantyh PW, Rogers SD, Honore P, Allen BJ, Ghilardi JR, Li J, Daughters RS, Lappi DA, Wiley RG, Simone DA. Inhibition of hyperalgesia by ablation of lamina 1 spinal neurons expressing the substance P receptor. Science. 1997;278:275–279. doi: 10.1126/science.278.5336.275. [DOI] [PubMed] [Google Scholar]
- 32.Mirsky R, Jessen KR. Schwann cell development, differentiation and myelination. Curr Opin Neurobiol. 1996;6:89–96. doi: 10.1016/s0959-4388(96)80013-4. [DOI] [PubMed] [Google Scholar]
- 33.Picklo MJ, Wiley RG, Lappi DA, Robertson D. Noradrenergic lesioning with an anti-dopamine beta-hydroxylase immunotoxin. Brain Res. 1994;666:195–200. doi: 10.1016/0006-8993(94)90772-2. [DOI] [PubMed] [Google Scholar]
- 34.Raabe TD, Clive DR, Neuberger TJ, Wen D, DeVries GH. Cultured neonatal Schwann cells contain and secrete neuregulins. J Neurosci Res. 1996;46:263–270. doi: 10.1002/(SICI)1097-4547(19961015)46:2<263::AID-JNR15>3.0.CO;2-3. [DOI] [PubMed] [Google Scholar]
- 35.Reynolds R, di Bello IC, Meeson A, Piddlesden S. Comparison of a chemically mediated and an immunologically mediated demyelinating lesion model. Methods. 1996;10:440–452. doi: 10.1006/meth.1996.0122. [DOI] [PubMed] [Google Scholar]
- 36.Rohde DS, Basbaum AI. Activation of coeruleospinal noradrenergic inhibitory controls during withdrawal from morphine in the rat. J Neurosci. 1998;18:4393–4402. doi: 10.1523/JNEUROSCI.18-11-04393.1998. [DOI] [PMC free article] [PubMed] [Google Scholar]
- 37.Samorajski T, Friede RL. A quantitative electron microscopic study of myelination in the pyramidal tract of rat. J Comp Neurol. 1968;134:323–338. doi: 10.1002/cne.901340306. [DOI] [PubMed] [Google Scholar]
- 38.Schwerer B, Lassmann H, Kitz K, Bernheimer H. Ganglioside GM1, a molecular target for immunological and toxic attacks: similarity of neuropathological lesions induced by ganglioside-antiserum and cholera toxin. Acta Neuropathol (Berl) 1986;72:55–61. doi: 10.1007/BF00687947. [DOI] [PubMed] [Google Scholar]
- 39.Scolding N, Franklin R, Stevens S, Heldin CH, Compston A, Newcombe J. Oligodendrocyte progenitors are present in the normal adult human CNS and in the lesions of multiple sclerosis. Brain. 1998;121:2221–2228. doi: 10.1093/brain/121.12.2221. [DOI] [PubMed] [Google Scholar]
- 40.Sims TJ, Durgun MB, Gilmore SA. Schwann cell invasion of ventral spinal cord: the effect of irradiation on astrocyte barriers. J Neuropathol Exp Neurol. 1998;57:866–873. doi: 10.1097/00005072-199809000-00008. [DOI] [PubMed] [Google Scholar]
- 41.Stevenson VL, Leary SM, Losseff NA, Parker GJ, Barker GJ, Husmani Y, Miller DH, Thompson AJ. Spinal cord atrophy and disability in MS: a longitudinal study. Neurology. 1998;51:234–238. doi: 10.1212/wnl.51.1.234. [DOI] [PubMed] [Google Scholar]
- 42.Svennerholm L. Interaction of cholera toxin and ganglioside GM1. Adv Exp Med Biol. 1976;71:191–204. doi: 10.1007/978-1-4614-4614-9_12. [DOI] [PubMed] [Google Scholar]
- 43.Trapp BD, Peterson J, Ransohoff RM, Rudick R, Mork S, Bo L. Axonal transection in the lesions of multiple sclerosis. N Engl J Med. 1998;338:278–285. doi: 10.1056/NEJM199801293380502. [DOI] [PubMed] [Google Scholar]
- 44.Weinstein DE. The role of Schwann cells in neural regeneration. The Neuroscientist. 1999;5:208–216. [Google Scholar]
- 45.Wiley RG, Lappi DA. Destruction of neurokinin-1 receptor expressing cells in vitro and in vivo using substance P-saporin in rats. Neurosci Lett. 1997;230:97–100. doi: 10.1016/s0304-3940(97)00490-4. [DOI] [PubMed] [Google Scholar]
- 46.Yezierski RP, Devon RM, Vicedomini JP, Broton JG. Effects of dorsal column demyelination on evoked potentials in nucleus gracilis. J Neurotrauma. 1992;9:231–244. doi: 10.1089/neu.1992.9.231. [DOI] [PubMed] [Google Scholar]
- 47.Yu RK, Iqbal K. Sialosylgalactosyl ceramide as a specific marker for human myelin and oligodendroglial perikarya: gangliosides of human myelin, oligodendroglia and neurons. J Neurochem. 1979;32:293–300. doi: 10.1111/j.1471-4159.1979.tb00351.x. [DOI] [PubMed] [Google Scholar]