

Abstract
The basal forebrain ostensibly plays a dual role in the modulation of cortical activation and behavioral state. It is essential for stimulating cortical activation in association with waking (and paradoxical sleep), yet also important for attenuating cortical activation and promoting slow wave sleep. Using juxtacellular recording and labeling of neurons with Neurobiotin followed by immunohistochemical staining for glutamic acid decarboxylase (GAD), we studied the discharge properties of identified GABAergic basal forebrain neurons in relation to electroencephalographic (EEG) activity in urethane-anesthetized rats to determine the part or parts that they may play in this dual role.
The GABAergic neurons displayed distinct discharge profiles in relation to somatosensory stimulation-evoked cortical activation. Whereas a significant minority increased its average discharge rate, the majority decreased its average discharge rate in association with cortical activation. Moreover, subgroups displayed distinct discharge patterns related to different cortical activities, including very regular high-frequency tonic spiking within a gamma EEG frequency range and rhythmic cluster spiking within a theta-like frequency range during cortical activation. During irregular slow EEG activity in absence of stimulation, one subgroup displayed spike bursts correlated with cortical slow oscillations. As relatively large in size and also antidromically activated from the cortex, many GABAergic neurons recorded were considered to be cortically projecting and thus capable of directly modulating cortical activity. Subgroups of GABAergic basal forebrain neurons would thus have the capacity to promote cortical activation by modulating gamma or theta activity and others to attenuate cortical activation by modulating irregular slow oscillations that normally occur during slow wave sleep.
Keywords: juxtacellular labeling, gamma, paradoxical sleep, slow wave sleep, theta, waking
Although the basal forebrain has been long considered to play an important role in the modulation of cortical activity and sleep–wake states, its role has appeared to be dual and to comprise ostensibly antagonistic processes (for review, seeJones, 2000). As the ventral, extrathalamic relay to the cerebral cortex from the brainstem reticular activating system, it was initially implicated in the stimulation of cortical activation (Starzl et al., 1951). Yet, together with the adjacent preoptic region, it was also shown to be important for cortical slow wave activity and slow wave sleep (Sterman and Clemente, 1962; McGinty and Sterman, 1968). More recent studies applying neurotoxic lesions to the basal forebrain have also yielded seemingly contradictory results with some reporting deficits in cortical activation (Stewart et al., 1984; Buzsaki et al., 1988) and others reductions in slow wave sleep (Szymusiak and McGinty, 1986a). Paralleling these are recent results applying electrical stimulation to the basal forebrain showing that some sites elicit excitation, whereas adjacent sites produce strong inhibition of cortical neurons (Jimenez-Capdeville et al., 1997). The excitation was associated with enhanced release of acetylcholine (ACh), whereas the inhibition was not. These results confirmed the long conceived role of cholinergic basal forebrain neurons in cortical activation (Krnjevic and Phillis, 1963; Celesia and Jasper, 1966), yet also suggested a role for adjacent noncholinergic neurons in antagonistic processes that could be important for slow wave sleep.
Unit recordings in the basal forebrain and adjacent preoptic area during the natural sleep–waking cycle have revealed cell types that behave differently in relation to cortical activity and sleep–wake state (Szymusiak and McGinty, 1986b, 1989; Detari et al., 1987). Some discharge maximally in association with cortical activation during waking called “wake-active”, and others discharge maximally in association with slow wave sleep, called “sleep-active”. Both types could be antidromically activated from the cerebral cortex and some sleep-active cells from the brainstem. These different profiles of activity suggest that different neurons are involved in fulfilling the dual role of the basal forebrain in promoting cortical activation and sleep.
By application of juxtacellular recording-labeling and immunohistochemical identification of basal forebrain neurons, we recently determined that identified cholinergic neurons fire during cortical activation, discharging in rhythmic bursts in association with theta and gamma EEG activity (Cape et al., 2000; Manns et al., 2000). Intermingled with cholinergic are noncholinergic neurons, including a large population of GABAergic neurons, which outnumber the cholinergic and comprise cortically, in addition to caudally or locally projecting neurons (Gritti et al., 1993, 1994, 1997). The aim of the present study was to characterize the discharge properties of basal forebrain GABAergic neurons in relation to cortical activity and to determine whether they may act in parallel with or antagonistic to the cholinergic neurons and thus potentially participate in processes of cortical activation or its attenuation. For this purpose, single units were recorded during irregular slow cortical activity and somatosensory stimulation-evoked cortical activation in urethane-anesthetized rats. Physiologically characterized neurons were labeled with Neurobiotin (Nb) by the juxtacellular technique and subsequently immunostained for glutamic acid decarboxylase (GAD).
MATERIALS AND METHODS
Animals and surgery. Experiments were performed on 60 adult male Long–Evans rats (200–250 gm; Charles River, St. Constant, Canada). All procedures were approved by the McGill University Animal Care Committee and the Canadian Council on Animal Care. The animals were anesthetized with urethane (ethyl carbamate; Sigma, St. Louis, MO) using an initial dose 1.4 gm/kg, intraperitoneally and supplementary doses if necessary of 0.1–0.15 gm/kg, intraperitoneally, to insure an adequate level of anesthesia, as determined by the lack of response to pinching of the hind limb. Body temperature was maintained at 36–37°C by a thermostatically controlled heating pad. According to procedures described in detail in a previous study (Manns et al., 2000), the anesthetized animals were positioned in a stereotaxic apparatus (David Kopf Instruments, Tujunga, CA) for both the surgery and subsequent recording. For EEG recording, stainless steel screws were placed over the retrosplenial cortex [anteroposterior (AP) −4 mm, lateral (L) ±0.5 mm relative to bregma (Paxinos and Watson, 1986)] and in the frontal bone as a reference. The retrosplenial (posterior cingulate) cortex was chosen for recording EEG because of the presence of a prominent theta rhythm during states of cortical activation that was moreover shown to not depend on hippocampal theta and input from the medial septum/diagonal band complex (Borst et al., 1987; Leung and Borst, 1987). For the purpose of antidromic activation of basal forebrain units and recording of the local field potential, a bipolar stimulating electrode was placed in the prefrontal cortex on each side (AP +2.0 mm, L ±1.0 mm, and V −2.0 mm). This region was selected for this purpose because it is known to receive afferents from GABAergic in addition to cholinergic basal forebrain neurons (Gritti et al., 1997) as well as to sit in the path of the major medial basalo-cortical fiber system (Saper, 1984; Luiten et al., 1987).
Unit recording and labeling. Juxtacellular recording and labeling was done with an intracellular amplifier (IR-283; Neurodata Instruments, New York, NY). Unit recordings were performed with glass microelectrodes, filled with 0.5 m sodium acetate and ∼5.0% Nb (Vector Laboratories, Burlingame, CA). Recorded units were characterized during spontaneous EEG activity and during somatosensory stimulation. The stimulation consisted of a continuous pinch of the tail applied by large, blunt forceps. Antidromic activation was tested from the prefrontal cortex. Antidromic responses were distinguished from orthodromic responses if they displayed a constant latency to stimulation, an ability to follow high-frequency discharge, and when present, collision with spontaneously occurring spikes. Orthodromic responses were frequently observed but were not analyzed in the present study. Spike widths were measured from positive inflection to first zero-crossing using >128 averaged spikes.
After the recording and characterization of isolated neurons, they were labeled using the “juxtacellular” method (Pinault, 1996). In the majority of rats (58), only one cell on one side of the brain was submitted to the labeling procedure; in some rats (two), one cell on each side of the brain was so labeled. The animals then received an overdose of urethane and were transcardially perfused with a 4% paraformaldehyde solution.
Histochemistry. Coronal frozen sections were cut at 30 μm and incubated overnight in a primary antibody for GAD (rabbit anti-GAD antiserum, 1:3000; Chemicon, Temecula, CA). They were subsequently coincubated in a Cy2-conjugated streptavidin (1:800) to reveal Nb and a Cy3-conjugated donkey anti-rabbit antiserum (1:1000; Jackson ImmunoResearch, West Grove, PA) to reveal GAD immunostaining. Sections were viewed by fluorescent microscopy using a Leitz Dialux microscope equipped with a Ploemopak 2 reflected light fluorescence illuminator with Leica filter cubes for fluorescein (I3) and rhodamine (N2.1). Cell size was measured from film transparencies, and cells classified as small (≤15 μm) or medium-to-large (16–35 μm) according to their large diameter.
Of the 62 cells submitted to the juxtacellular labeling procedure, 55 cells were recovered in sections from 53 brains that were also successfully dual-immunostained for GAD and thus included in the analysis and results of the present study. In 51 brains, one Nb+ cell was present, and in two brains, one Nb+ cell was present on each side, yielding two cells, for a total of 55 Nb+ cells. Accordingly, 55 of 62 cells (∼90%) were successfully labeled and recovered after application of the juxtacellular procedure. The electrophysiological data from these Nb− cells were not included in the Results of the study.
Data analysis. Analysis of physiological data were performed on 40–80 sec periods during the spontaneous, prestimulation condition and the stimulation condition, as previously described in detail (Manns et al., 2000). To include the most stationary and artifact-free periods in the prestimulation and stimulation conditions, the epochs at the stimulation onset (∼1–2 sec) were excluded because they could be associated with transient DC shifts in the recording. For the EEG, spectral analysis was performed to determine the dominant peak frequency of the power spectra (square millivolts per hertz) in the low-frequency end of the spectrum and to calculate the amplitude of beta (15–29 Hz) and gamma band activity (30–58 Hz) in the high-frequency end. The same EEG segments were analyzed by an autocorrelation function (ACF). For unit discharge, average discharge rate was calculated from the peristimulus histogram (PSH), and predominant instantaneous firing frequency was calculated from the interspike interval histogram (ISIH). Assessment of rhythmic and higherorder interspike interval tendencies was performed using an autocorrelation histogram (ACH). Determination of the dominant frequency of rhythmic ACHs was done using a fast Fourier transform to convert the ACH data to the frequency domain. Unit discharge was considered “rhythmic” if the spectrum of the ACH had a peak that was at least 3 times the amplitude of the average power. The spike-triggered average (STA) was used to estimate the extent of cross-correlation between spike-trains, and EEG activity and tested for being different from random (shuffled) spike trains with the Wilcoxon test. All analyzes of raw data were done using Matlab5 (MathWorks, Natick, MA) and statistical analysis using Systat 9.0 (SPSS, Chicago, IL). Figures were compiled using Adobe Photoshop 5.0 (Adobe Systems, San Jose, CA) for photomicrographs and Origin 5.0 (Microcal Software, Northhampton, MA) for plotting electrophysiological data.
RESULTS
Characterization of EEG and unit activity
Basal forebrain neurons were recorded and characterized in association with EEG activity before their juxtacellular labeling. Unit discharge was examined in relation to EEG occurring spontaneously and to that occurring during somatosensory stimulation under the urethane anesthesia (Fig. 1). Although in no case did the stimulation evoke a motoric response, it consistently caused a prominent change in the EEG. Its pattern shifted from irregular slow activity to rhythmic slow activity. The spontaneous, irregular slow activity contained prominent slow waves, which are similar to the slow oscillation (0–1 Hz) (originally described in cats; Steriade et al., 1993), as well as irregular delta waves. Because of variability in the level of anesthesia within and across experiments, the irregular slow activity during the prestimulation period varied in peak frequency from 0.3 to 2.4 Hz and in amplitude from 3.0 mV to 50 μV as reflecting deeper to lighter levels of anesthesia. Also varying as a function of the depth of anesthesia, the EEG change evoked by the somatosensory stimulation (applied as continuous pressure to the tail) could be somewhat transient (∼20 sec) or long-lasting (up to the full duration of the stimulation, which was maintained for ∼40–80 sec). As measured during the period of stimulation, the evoked rhythmic slow activity varied in frequency from 2.2 to 4.6 Hz and amplitude from 350 to 50 μV. Both in its rhythmicity and frequency, this rhythmic slow activity is the same as that previously described on the retrosplenial (or posterior cingulate) cortex and shown to be correlated with rhythmic slow activity in the hippocampus, corresponding to “theta” in urethane-anesthetized rats (Holsheimer, 1982). Here, despite variability in the level of anesthesia resulting in variability in the spontaneous and evoked frequency and amplitude of the EEG, there was a systematic increase in the average dominant low-frequency spectral peak from 1.14 ± 0.10 to 2.90 ± 0.14 Hz (t = 11.36; df = 41; p < 0.001). This increase in low peak frequency was always associated with an increase in rhythmicity as evident in the ACF for the EEG (Fig. 1, II) and was thus interpreted as a shift from irregular slow activity, indicative of the slow oscillation combined with delta activity, to rhythmic slow activity, indicative of a theta-like oscillation. In addition, there was an increase in high-frequency EEG activity with somatosensory stimulation, marked by a significant increase in the average amplitude of gamma band activity (30–58 Hz; t = 3.33; df = 38; p < 0.01) and no significant change in that of beta band activity (15–30 Hz) across experiments. The increase in gamma EEG activity, which has been shown to reflect cortical activation in naturally sleeping–waking rats (Maloney et al., 1997), is considered, together with the parallel appearance of theta-like activity, to reflect an increase in cortical activation evoked by somatosensory stimulation in the urethane-anesthetized rats.
Fig. 1.
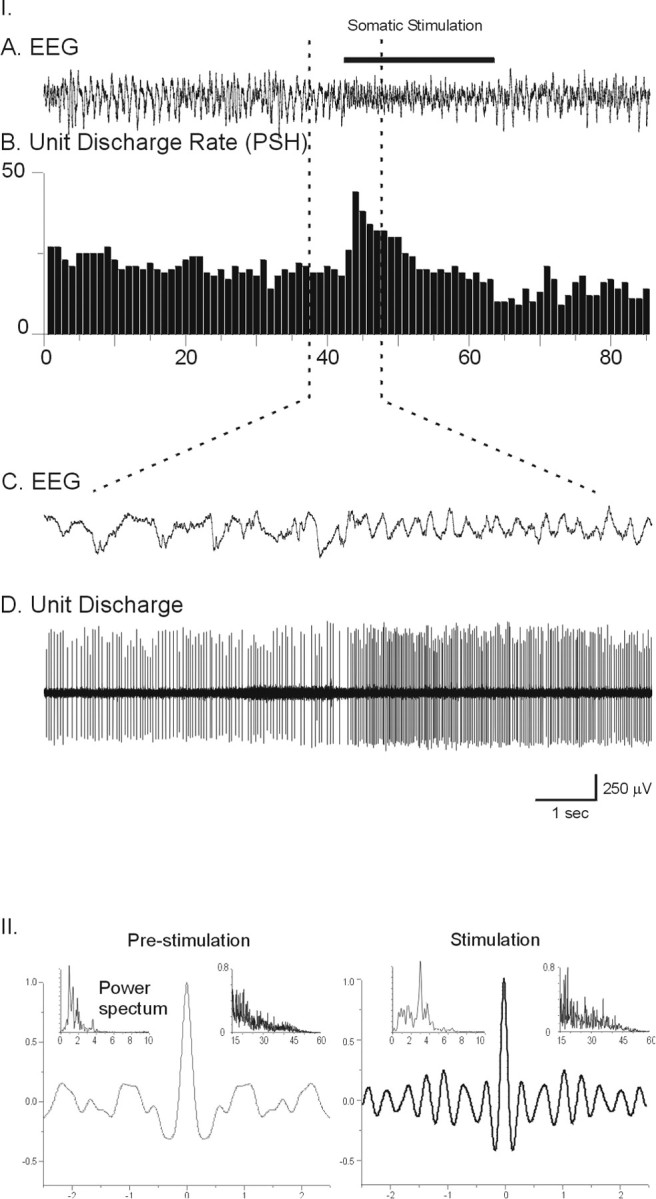
Example of EEG and unit activity patterns before and during somatosensory stimulation. I, EEG (A) from retrosplenial cortex and unit discharge rate (B, PSH of the rate of discharge in spikes per second) for periods preceding and during somatic stimulation conditions. The EEG (C) and unit discharge (D) traces are expanded for the period of transition from irregular slow cortical activity to rhythmic slow activity. Note the change in pattern of the EEG activity and concomitant increase in rate of tonic discharge by the unit.II, EEG analysis during prestimulation and stimulation conditions. EEG ACFs (in A, with correlation coefficient on vertical axes) and power spectra (with low- and high-frequency ranges, respectively placed in left and right insets) are shown for prestimulation and stimulation records. These indicate the shift from low-frequency irregular slow activity to a higher frequency rhythmic slow activity with stimulation, in addition to the concomitant increase in gamma amplitude seen in the high-frequency power spectra (data from neuron #9918014.)
Basal forebrain units were classified into two major categories according to whether they increased or decreased their mean average rate of discharge (by PSH measures) in association with the somatosensory stimulation-induced cortical activation. Although the change in firing rate was not always long-lasting (Fig. 1), the average rate during the stimulation as compared with that during prestimulation reflected the predominant response of the units (as verified statistically by t tests which compared all 1 sec epochs between the two conditions for each unit and were significant for 52/55). Units were respectively referred to as “on” or “off” for simplicity, even though only a small minority of cells discharged at frequencies of <1 Hz during either the prestimulation or stimulation conditions.
Identification and categorization of Nb+/GAD+ and Nb+/GAD− neurons
Of 55 basal forebrain neurons, which were successfully labeled with Nb (Nb+) and processed for GAD immunohistochemistry, 21 were found to be GAD-positive (GAD+), and 34 were GAD-negative (GAD−; Figs.2, 3, Table1). The Nb+/GAD+ and Nb+/GAD− cells were distributed through the magnocellular preoptic nucleus (MCPO) and substantia innominata (SI) nuclei of the basal forebrain with a greater number of both located in the MCPO (Table 1). The GAD+ and GAD− cell groups were indistinguishable morphologically, because both were comprised of proportions of oval-to-fusiform (bipolar) and polygonal (multipolar) neurons (Table 1). The GAD+ neurons were all medium-to-large neurons (range, 16.7–30.0 μm in large diameter), whereas the GAD− neurons, were comprised of some small neurons in addition to medium-to-large ones (range, 13.0–31.1 μm).
Fig. 2.

Photomicrographs of recorded and juxtacellularly labeled Nb+/GAD+ or Nb+/GAD− neurons located in the basal forebrain cholinergic cell area. Nb was revealed with green fluorescent Cy2-conjugated streptavidin (left) and GAD immunostaining with red fluorescent Cy3-conjugated secondary antibodies (right). A, Nb+/GAD+ on (tonic) neuron in SI. B, Nb+/GAD+ off (tonic/cluster) neuron in MCPO.C, Nb+/GAD+ off (burst) neuron in MCPO.D, Nb+/GAD+ off (tonic) neuron in MCPO.E, Nb+/GAD− on (tonic) neuron in MCPO. The location of each cell is shown in the atlas inset to thebottom left of each cell, and together with other cells, as the largest symbol for its subgroup in this figure; the recording of each cell (A–E) is shown in order in subsequent figures (3–7, respectively). Scale bar, 20 μm.
Fig. 3.

Location of Nb+/GAD+ and Nb+/GAD− neurons in the basal forebrain [represented on atlas sections adapted from Gritti et al. (1993)]. Each subgroup of GAD+ cells (triangular symbols) and GAD− cells (circular symbols) is represented by a particular symbol (as indicated in the figure), and the exemplary cell from each subgroup (illustrated in Figs.1A–E, 3–7, respectively) is represented by the largest symbol. Scale bar, 1 mm. Acb, Accumbens nucleus;ac, anterior commissure; BST, bed of the stria terminalis; CPu, caudate putamen;DBB, diagonal band of Broca nucleus; f, fornix; FStr, fundus of striatum; GP, globus pallidus; LPOA, lateral preoptic area;LS, lateral septum; MCPO, magnocellular preoptic nucleus; MS, medial septum; oc, optic chiasm; OTu, olfactory tubercle;Pir, Piriform cortex; Ret, Reticularis nucleus; SIa, substantia innominata pars anterior;SIp, substantia innominata pars posterior;sm, stria medullaris.
Table 1.
Frequency of anatomical and physiological characteristics in GABAergic and non-GABAergic cell groups1-a
| All cells | Nb+/GAD+ cells | Nb+/GAD− cells | Statistic | |
|---|---|---|---|---|
| (n = 55) | (n= 21) | (n = 34) | χ2 (df) | |
| Anatomy | ||||
| Area | 0.004 (1) | |||
| SI | 16 | 6 | 10 | |
| MCPO | 39 | 15 | 24 | |
| Shape | 0.064 (1) | |||
| Oval-fusiform (Bipolar) | 30 | 11 | 19 | |
| Polygonal (Multipolar) | 25 | 10 | 15 | |
| Size | 2.99 (1) | |||
| Small (≤15 μm) | 3 | 0 | 3 | |
| Medium-Large (>15 μm) | 52 | 21 | 31 | |
| Physiology | ||||
| Response to stimulation (PSH1-b) | 10.14 (1)1-165 | |||
| Increase (“on”) | 36 | 8 | 28 | |
| Decrease (“off”) | 18 | 12 | 6 | |
| Discharge pattern | 0.47 (2) | |||
| Tonic | 29 | 12 | 17 | |
| Tonic and/or cluster | 16 | 5 | 11 | |
| Tonic and/or burst | 10 | 4 | 6 | |
| Low-frequency rhythmicity during stimulation (ACH1-c) | 2.31 (1) | |||
| Rhythmic | 20 | 5 | 15 | |
| Not rhythmic | 35 | 16 | 19 | |
| Unit-to-EEG cross-correlation during stimulation (STA1-d) | 3.79 (1)* | |||
| Correlated | 19 | 4 | 15 | |
| Not correlated | 36 | 17 | 19 |
Frequencies (n, number of cells) for the two groups are presented and compared using the likelihood ratio χ2 statistic;
p < 0.05;
F1-160: p < 0.01;
F1-165: p < 0.001.
Classification based on peristimulus histogram (PSH) measure of average discharge rate.
Based on autocorrelation histogram (ACH) values.
Based on unit-to-EEG spike-triggered averages (STA) with EEG from retrosplenial cortex.
The major proportion of the cells in the total sample were on cells (67%), and a minor proportion were off cells (33%). Between the GAD+ and GAD− cell groups, the respective proportions of on and off cells differed significantly, such that the GAD+ neurons represented the largest proportion of the off and the GAD− cells the largest proportion of the on cells in the sample (Table 1). In fact, the majority of the GAD+ neurons (60%) decreased their average discharge rate in response to stimulation, whereas the majority of the GAD− cells (82%) increased their average discharge rate (Table 1). Across the prestimulation and stimulation conditions, the discharge patterns of the sampled units were highly diverse. The predominant patterns were categorized, and the cells accordingly were grouped as manifesting across the two conditions: (1) a tonic mode of discharge, (2) a cluster mode of discharge in addition to tonic or irregular spiking, or (3) a burst mode of discharge in addition to tonic or irregular spiking (Table 1). The burst mode was characterized as recurring high-frequency spike bursts (>80 Hz), and the cluster mode was distinguished from bursting as recurring trains of spikes lacking in high-frequency spike bursts (Manns et al., 2000). GAD+ and GAD− cell groups comprised cells of the three categories and did not differ in the proportions of cells in each (Table 1). However, they did differ in the precise relationship of the unit discharge pattern to EEG activity (below). During stimulation-evoked cortical activation, the proportion of GAD+ neurons displaying low-frequency rhythmic discharge was less than that of the GAD− neurons (24 vs 44%; Table 1; although not significantly so,p = 0.13). Similarly, the proportion of GAD+ neurons exhibiting a cross-correlated discharge with EEG activity at low frequency was also less than that of the GAD− neurons (19 vs 44%; Table 1; p = 0.051). The proportion of GAD+ cells displaying high-frequency regular discharge, which met the criterion of rhythmic (33%), was higher than that of the GAD− cells (15%; χ2 = 7.31; df = 1;p = 0.007).
Characteristics of Nb+/GAD+ cell subgroups
Although the Nb+/GAD+ cells could be characterized as comprising a majority of off and tonically discharging cells, their precise response to stimulation according to both frequency and pattern of discharge differentiated these cells into multiple subgroups with distinctive features. Of the GAD+ on cells, all fired in a predominantly tonic mode and were accordingly categorized as on (tonic). As a subgroup, they showed a significant increase in their average rate of discharge with stimulation (see Table 3). The GAD+ off cells, which collectively showed a significant decrease in their average rate of discharge with stimulation (see Table 3), fired in different patterns and were also accordingly further subdivided. Some cells, displaying a decrease in average discharge rate, discharged tonically during the prestimulation condition and discharged in spike clusters during stimulation with cortical activation, such that they were categorized as off (tonic/cluster) cells (see Table 3). Other cells displaying a decrease in average discharge rate, discharged in high-frequency bursts during the prestimulation condition to virtually cease firing with stimulation and thus be categorized as off (burst) cells (see Table 3). Last, other cells showing a decrease in rate discharged tonically or irregularly during both the prestimulation and stimulation conditions, accordingly being called off (tonic). The two major subgroups of GAD+ cells (on and off) differed morphologically in terms of their average large diameter with the off cells being larger than the on cells (t = 2.055; df = 18; p = 0.055; Table 2). They did not differ according to their average spike width. Not all cell types could be antidromically activated from the prefrontal cortex, but the latency of antidromic activation did not differ among the subgroups that were so activated (Table 2).
Table 3.
GABAergic and non-GABAergic cells' mean average discharge rate (PSH), instantaneous firing frequency (ISIH), rhythmic discharge rate (ACH), unit-to-EEG cross-correlation frequency (STA), and associated dominant EEG spectral peak during prestimulation and stimulation conditions3-a
| Group percent | Unit rate (PSH, Hz) | Unit frequency (ISIH, Hz) | Unit rhythmic frequency (ACH, Hz) | Unit-to-EEG frequency (STA, Hz) | EEG spectral peak (Hz) | ||||||
|---|---|---|---|---|---|---|---|---|---|---|---|
| Prestimulation | Stimulation | Prestimulation | Stimulation | Prestimulation | Stimulation | Prestimulation | Stimulation | Prestimulation | Stimulation | ||
| Nb+/GAD+ cells average† | 100% | 17.91 ± 2.78 (20) | 17.31 ± 3.84 (20) | 60.52 ± 27.69 (20) | 60.62 ± 26.99 (20) | 1.42 ± 0.39 (4) | 1.52 ± 0.14 (5) | 1.08 ± 0.21 (9) | 1.69 ± 0.14 (3) | 0.97 ± 0.13 (16) | 3.20 ± 0.21 (16)3-165 |
| high: 29.34 ± 3.05 (7) | high: 31.81 ± 3.74 (7) | ||||||||||
| “On” average § | 40% | 23.15 ± 5.22 (8) | 33.01 ± 5.61 (8)3-160 | 28.49 ± 6.32 (8) | 49.29 ± 14.63 (8) | 0.86 (1) | — | 0.68 ± 0.01 (3) | — | 1.16 ± 0.21 (8) | 3.21 ± 0.25 (8)3-165 |
| On (tonic) | high: 30.88 ± 5.31 (4) | high: 31.81 ± 3.74 (7) | |||||||||
| “Off” average | 60% | 14.40 ± 2.82 (12) | 6.85 ± 2.03 (12)3-165 | 81.88 ± 45.67 (12) | 68.17 ± 44.64 (12) | 1.61 ± 0.49 (3) | 1.52 ± 0.14 (5) | 1.28 ± 0.29 (6) | 1.69 ± 0.14 (3) | 0.77 ± 0.12 (8) | 3.19 ± 0.36 (8)3-165 |
| high: 27.30 ± 2.22 (3) | |||||||||||
| Off (tonic-cluster) | 25% | 18.90 ± 3.00 (5) | 9.18 ± 3.07 (5)3-160 | 26.32 ± 4.26 (5) | 37.78 ± 6.22 (5) | 1.5 (1) | 1.52 ± 0.14 (5) | 1.49 ± 0.01 (2) | 1.69 ± 0.14 (3) | 0.55 ± 0.05 (2) | 3.66 ± 0.74 (2) |
| high: 27.30 ± 2.22 (3) | |||||||||||
| Off (burst) | 20% | 16.88 ± 5.73 (4) | 8.30 ± 4.23 (4) | 208.6 ± 121.73 (4) | 155.00 ± 133.77 (4) | 0.82 (1) | — | 0.82 ± 0.01 (2) | — | 1.11 ± 0.13 (3) | 3.26 ± 0.52 (3) |
| Off (tonic) | 15% | 3.62 ± 0.75 (3) | 0.99 ± 0.51 (3) | 5.53 ± 1.60 (3) | 3.02 ± 0.68 (3) | 2.5 (1) | — | 1.53 ± 0.98 (2) | — | 0.61 ± 0.16 (3) | 2.80 ± 0.79 (3) |
| Nb+/GAD− cells average | 100% | 8.95 ± 1.51 (34)†† | 12.93 ± 1.84 (34)3-165(†) | 25.17 ± 5.12 (34) | 31.27 ± 8.38 (34) | 1.40 ± 0.28 (10) | 2.02 ± 0.26 (15) | 1.01 ± 0.30 (12) | 2.34 ± 0.31 (15)3-150 | 1.24 ± 0.13 (26) | 2.71 ± 0.18 (26)3-165 |
| high: 23.82 ± 3.57 (6) | high: 33.28 ± 4.92 (5) | ||||||||||
| “On” average | 82% | 8.98 ± 1.58 (28)§§§ | 14.76 ± 1.96 (28)3-165§§§(§) | 26.09 ± 6.00 (28) | 35.85 ± 9.93 (28) | 1.40 ± 0.28 (10) | 2.06 ± 0.28 (14) | 0.71 ± 0.80 (10) | 2.17 ± 0.28 (14)3-150 | 1.14 ± 0.09 (21) | 2.63 ± 0.20 (21)3-165 |
| high: 23.82 ± 3.57 (6) | high: 33.28 ± 4.92 (5) | ||||||||||
| On (tonic) | 35% | 12.10 ± 2.77 (12) | 20.72 ± 3.19 (12)3-165(§) | 26.51 ± 5.34 (12) | 29.90 ± 4.08 (12) | 0.84 ± 0.14 (3) | — | 0.79 ± 0.12 (4) | 2.10 ± 1.42 (2) | 1.30 ± 0.17 (10) | 2.72 ± 0.31 (10)3-165 |
| high: 23.70 ± 0.70 (3) | high: 24.70 ± 5.03 (2) | ||||||||||
| On (cluster) | 29% | 7.57 ± 2.50 (10) | 10.28 ± 2.45 (10)3-160 | 19.32 ± 4.25 (10) | 21.67 ± 4.02 (10) | 1.41 ± 0.30 (4) | 1.62 ± 0.13 (10) | 0.78 ± 0.14 (3) | 1.57 ± 0.12 (7) | 1.14 ± 0.15 (5) | 2.60 ± 0.27 (5)3-150 |
| high: 23.93 ± 7.95 (3) | high: 39.00 ± 5.51 (3) | ||||||||||
| On (burst) | 18% | 5.06 ± 1.61 (6) | 10.3 ± 2.74 (6)3-150 | 40.33 ± 7.67 (6) | 71.37 ± 45.06 (6) | 1.95 ± 0.83 (3) | 3.15 ± 0.71 (4) | 0.55 ± 0.16 (3) | 3.02 ± 0.44 (5)3-150 | 0.91 ± 0.06 (6) | 2.86 ± 0.39 (6)3-160 |
| “Off” average | 18% | 8.81 ± 4.78 (6) | 4.39 ± 3.50 (6)3-150 | 17.10 ± 7.68 (6) | 9.92 ± 5.51 (6)3-150 | — | 1.55 (1) | 2.50 ± 1.71 (2) | 4.73 (1) | 1.61 ± 0.60 (5) | 3.01 ± 0.46 (5)3-150 |
| Off (tonic) | |||||||||||
Mean ± SEM (withn in parentheses) values are presented for the prestimulation and stimulation conditions for Nb+/GAD+ and Nb+/GAD− cell groups and subgroups. Within each group or subgroup, measures were compared across the prestimulation and stimulation conditions by pairedt tests for the unit discharge PSH and ISIH values and for the EEG spectral peak or by unpaired t tests for ACH and STA values (
F3-150: p < 0.05;
F3-160: p < 0.01;
F3-165: p< 0.001). GAD− groups or subgroups were compared with homologous GAD+ cell groups or subgroups by ANOVA, and a significant difference indicated by the specific symbol of the GAD+ group (shown in the first column) with which the comparison was made (with one symbol =p < 0.05, two symbols = p < 0.01, or three symbols = p < 0.001). Symbols in parentheses indicate that the GAD− cell group differed from the GAD+ cell group according to a two-way ANOVA with group (GAD− or GAD+) as a between factor and condition (prestimulation and stimulation) as repeated measure within each group. Symbols out of parentheses indicate that they differed according to a one-way ANOVA between groups in the prestimulation or stimulation condition.
Table 2.
Morphological and physiological measures of GABAergic and non-GABAergic cell groups2-a
| Cell size (μm)2-b | Spike width (msec)2-c | Antidromic latency (msec)2-d | |
|---|---|---|---|
| Nb+/GAD+ cells average† | 23.14 ± 0.99 (21) | 0.56 ± 0.03 (21) | 12.05 ± 2.24 (6) |
| “On” average | 20.85 ± 0.70 (8) | 0.57 ± 0.06 (8) | 11.80 ± 3.94 (3) |
| On (tonic) | |||
| “Off” average ⊗ | 24.80 ± 1.48 (12) | 0.56 ± 0.03 (12) | 12.30 ± 3.10 (3) |
| Off (tonic/cluster) | 24.68 ± 3.33 (5) | 0.48 ± 0.03 (5) | |
| Off (burst) | 23.85 ± 1.38 (4) | 0.60 ± 0.04 (4) | 12.30 ± 3.06 (3) |
| Off (tonic) | 26.20 ± 2.45 (3) | 0.65 ± 0.06 (3) | |
| Nb+/GAD− cells average | 20.53 ± 0.78 (34) † | 0.61 ± 0.02 (34) | 11.09 ± 1.59 (7) |
| “On” average | 21.09 ± 0.88 (28) | 0.61 ± 0.02 (28) | 10.55 ± 1.75 (6) |
| On (tonic) | 20.32 ± 1.00 (12) | 0.63 ± 0.03 (12) | 11.30 ± 1.90 (5) |
| On (cluster) | 21.44 ± 1.76 (10) | 0.56 ± 0.04 (10) | |
| On (burst) | 22.06 ± 2.30 (6) | 0.64 ± 0.06 (6) | 6.50 (1) |
| “Off” average | 17.91 ± 1.29 (6)⊗ | 0.58 ± 0.05 (6) | 14.30 (1) |
| Off (tonic) |
Mean ± SEM values (withn in parentheses) for Nb+/GAD+ and Nb+/GAD− cell groups and subgroups. GAD− groups or subgroups were compared with homologous GAD+ cell groups or subgroups by ANOVA, and a significant difference was indicated by the specific symbol of the GAD+ group (shown in the first column) with which the comparison was made (with one symbol =p < 0.05).
Large diameter of cell soma.
Spike width measured from initial positive inflection to first zero crossing.
Latency to antidromically activated spikes from prefrontal cortex.
The Nb+/GAD+ on (tonic) cells (mapped in Fig. 3) represented the single largest subgroup of GAD+ neurons sampled (40%; Table3). Several could be antidromically activated from the prefrontal cortex (n = 3; Table 2). As illustrated in an exemplary cell (Fig.4, corresponding to Fig.2A), these on (tonic) cells increased discharge rate with stimulation and fired in a tonic mode at a moderately fast rate (up to 65 Hz according to PSH values), often during both prestimulation and stimulation conditions (Table 3). As for the cell illustrated (Fig.4), GAD+ on (tonic) cells showed very regular spiking at relatively high frequencies (∼10–50 Hz, according to ACH values). This spiking was considered to be rhythmic (according to the established criterion detailed in Materials and Methods) for some cells (four of eight) during irregular slow activity and for most cells (seven of eight) during the rhythmic slow activity and accompanying increased gamma on the EEG, which reflect stimulation-evoked cortical activation (Table3).
Fig. 4.

Nb+/GAD+ on (tonic) cell (#98o18009/11 shown in Fig. 1A). I, EEG and unit recording during prestimulation and stimulation conditions. EEG (A) from retrosplenial cortex and unit discharge rate (B, PSH, plotting spikes per second) are shown for periods preceding and during somatic stimulation. The EEG (C) is expanded and shown with the unit traces (D) for each condition (below, left, and right). Note that the unit discharge is tonic during both the prestimulation and stimulation conditions and increases in rate in association with the stimulation-evoked EEG changes from irregular slow to rhythmic slow activity, indicative of cortical activation. II. EEG and unit analysis during prestimulation and stimulation conditions. EEG autocorrelation functions (ACF, in A, with correlation coefficient on vertical axes) and power spectra (with low- and high-frequency ranges, respectively, placed in left and right insets) are shown for prestimulation and stimulation records. These illustrate the shift from low-frequency irregular slow activity to a higher frequency rhythmic slow activity with stimulation and the concomitant increase in gamma amplitude seen in the high-frequency range of the power spectra. Unit autocorrelation histograms (ACH, inB, with normalized incidence on vertical axes) and ISIH (in insets on right) are shown for the same records. An expansion of the ACH is shown (below each) for shorter intervals along with the spectra of the ACH (as insetsin top right corners in which † indicates rhythmic activity according to established criterion). Note that the unit discharge is moderately high and relatively regular during the prestimulation condition with a frequency at ∼20 Hz and higher and very regular (such as to be considered rhythmic) with a frequency at ∼40 Hz during the stimulation-evoked increase in gamma activity and cortical activation.
The Nb+/GAD+ off (tonic/cluster) neurons (mapped in Fig. 3), were the second largest subgroup of GAD+ neurons sampled (25%; Table 3). None of these could be antidromically activated from the prefrontal cortex. As shown for an exemplary cell (Fig. 5, corresponding to the cell in Fig. 2B), their firing pattern was tonic and moderately fast (10–30 Hz) during prestimulation with irregular slow cortical activity, then shifted to a rhythmic cluster spike discharge with stimulation-induced rhythmic slow activity. Although their average rate of discharge decreased significantly with stimulation, their instantaneous firing frequency did not, and the stimulation within cluster spike frequency (15–55 Hz) was similar to the prestimulation tonic spike frequency (10–40 Hz; Fig. 5, Table 3). The cluster discharge during stimulation occurred rhythmically (at 1–2 Hz) in all (tonic/cluster) cells. It was also cross-correlated with the retrosplenial EEG signal in most cells (Fig. 5, Table 3), although typically not with the predominant spectral peak, but with a secondary peak of lower frequency. The rhythmic cluster discharge of some of these units was cross-correlated with the dominant spectral peak of the EEG signal from the prefrontal cortex (data not shown). The within cluster spike discharge was often rather regular (as for the cell shown in Fig. 5), although it did not reach criterion for being classified as rhythmic.
Fig. 5.
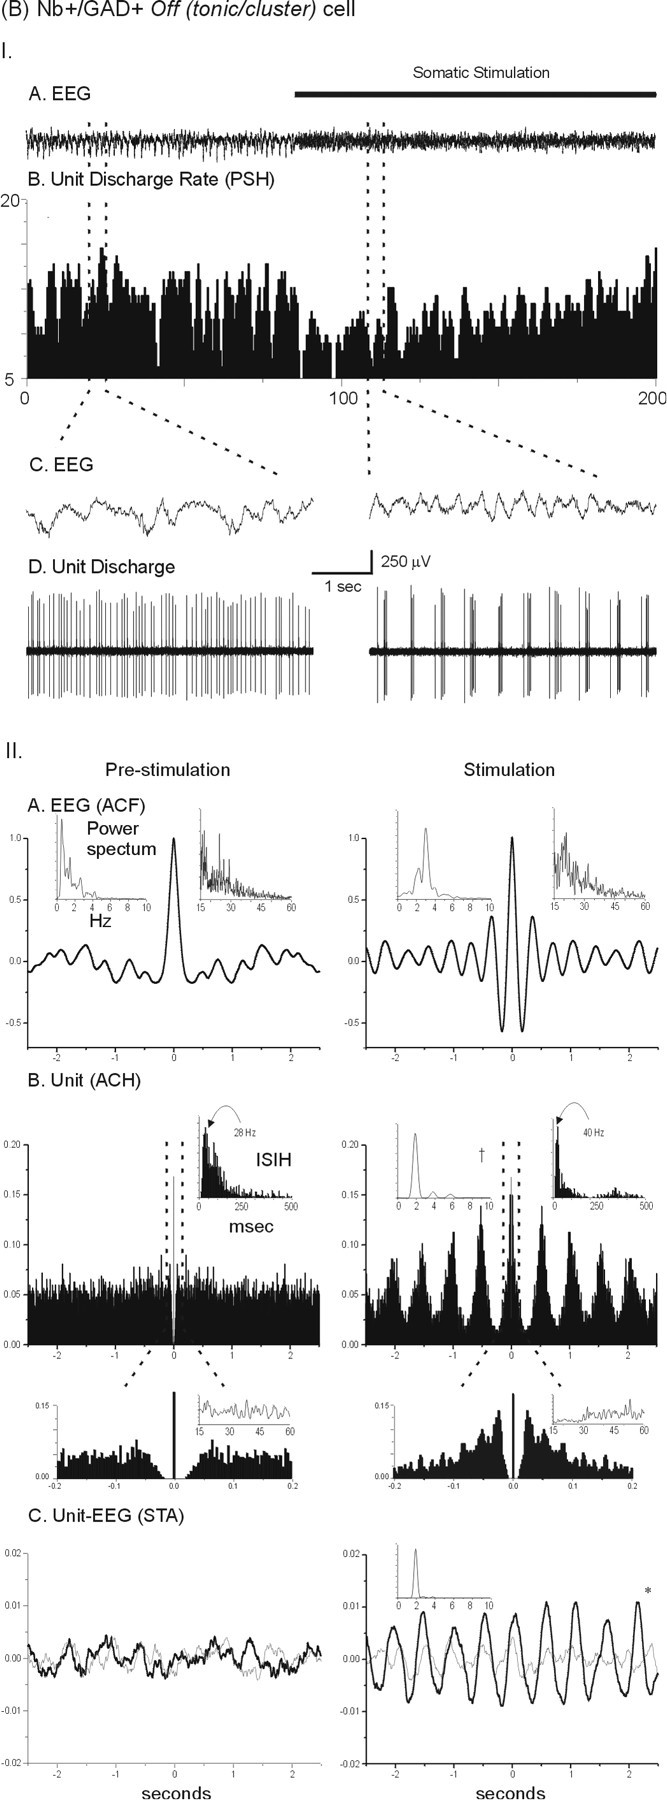
Nb+/GAD+ off (tonic/cluster) cell (#03/25/LM2 shown in Fig. 1B). I, Note in the PSH (B), that the average rate of discharge decreases in association with cortical activation (A). At the same time, the pattern of discharge changed from tonic spiking during prestimulation to a cluster discharge pattern (D) in association with the appearance of rhythmic slow activity that occurred on the EEG (C) during stimulation. II, Note in the analysis, that after stimulation, the EEG shifted from irregular slow activity to a faster rhythmic slow activity, accompanied by an increase in gamma activity. During stimulation the unit discharge is rhythmic (in the ACH shown in B) at ∼2 Hz (as evident in the power spectrum of the ACH shown in inset ontop left). The expanded ACH for the stimulation condition (drop down) indicates that the high-frequency activity within the spike clusters is relatively regular at ∼40 Hz (but does not meet criterion for being rhythmic). STAs (shown in C) of the unit-to-EEG cross-correlation (with millivolts on vertical axes) indicate that the correlation for the unit (black line) is significantly different from that for the randomized-spike train (gray line, Wilcoxon test; *p< 0.05). The power spectrum for the unit-to-EEG STA is shown (ininset). Note that the cross-correlated unit-to-EEG activity occurs at a frequency of ∼2 Hz, which did not correspond to the prominent EEG rhythmic slow activity or spectral peak but to a secondary peak in the power spectrum (shown in A withinset on top left). See Figure 3 for further explanation of measures.
The Nb+/GAD+ off (burst) cells (mapped in Fig. 3) represented 20% of the GAD+ neurons sampled (Table 3). Most of these cells were antidromically activated from the prefrontal cortex (n= 3; Table 2). As illustrated for an exemplary cell (Fig.6, corresponding to Fig. 2C), they typically fired in high frequency bursts (up to 550 Hz from ISIH values) during irregular slow cortical activity and often ceased firing altogether during stimulation-induced cortical activation. The burst firing of these neurons was reflected in the large difference between the average discharge rates (from the PSH) and instantaneous firing frequencies (from the ISIH) during both prestimulation and stimulation conditions (Table 3). The burst discharge during prestimulation occurred at similar frequencies (<1 Hz) as the irregular slow waves on the cortex and as for the cell illustrated (Fig. 6), was in some cases cross-correlated with the slow EEG activity (Table 3).
Fig. 6.

Nb+/GAD+ off (burst) neuron (#98n030016/19 shown in Fig. 1D). I, Note the virtual cessation of discharge (in the PSH in B) with somatic stimulation that evokes cortical activation in the EEG (A). In association with the irregular slow EEG activity during prestimulation (C), high-frequency bursting occurs (D, including inset with blow up below on left). II, Note in the analysis of the EEG a shift from irregular slow to faster rhythmic slow activity with stimulation. The unit analysis for prestimulation indicates the high-frequency spike mode (at ∼200 Hz in the ISIH inB) reflecting the bursting and the slower frequency activity reflecting the recurrence of the bursting at a similar frequency as the EEG activity (at ∼1.2 Hz, evident in the ISIH, ACH, and spectrum of the ACH for the unit in B and in the spectrum of the ACF for the EEG in A). The unit discharge was significantly cross-correlated with the EEG (as shown in the STA in C) at this same frequency (evident in power spectrum in inset). See Figures 3 and 4 for further explanation of measures.
The Nb+/GAD+ off (tonic) cells (mapped in Fig. 3) represented the smallest proportion of the GAD+ neurons sampled (15%; Table 3). None of these cells could be antidromically activated from the prefrontal cortex (Table 2). As for the cell illustrated (Fig.7, corresponding to Fig.2D), GAD+ off (tonic) neurons tended to discharge in a slow (<5 Hz average rate according to PSH values) and irregular tonic manner in association with irregular slow cortical activity and to cease firing with stimulation-induced cortical activation (Table 3). The spiking by these neurons was in some cases cross-correlated with the irregular slow cortical activity (Table3).
Fig. 7.

Nb+/GAD+ off (tonic) cell (#98o16010 shown in Fig.1C). I, Note in the PSH (B), the marked decrease in discharge and in the recording (C), the relatively tonic slow discharge of the unit in association with the irregular slow activity of the EEG (C). II, Note in the analysis, the shift in EEG activity from the irregular slow activity to a higher frequency rhythmic slow activity. Also note, the slow (8.5 Hz mode in ISIH) and relatively irregular discharge of the unit (B) and the lack of relationship with the EEG (B, C). See Figures 3 and 4 for further explanation of measures.
Characteristics of Nb+/GAD− cell subgroups
That the majority of the Nb+/GAD− neurons were on cells (Table 1) was reflected in a significant increase in their mean average discharge rate with stimulation (Table 3). In their response to stimulation, they thus differed significantly as a group from the Nb+/GAD+ cells (Table3). Moreover, their average discharge rate during both prestimulation and stimulation conditions was significantly slower than that of the GAD+ on cells (Table 3). In further contrast, the GAD− on neurons were comprised of subgroups of cells with predominant tonic, cluster, and burst discharge patterns (Table 3). The GAD− off subgroup significantly decreased its average discharge rate with stimulation and was not different in this regard from the GAD+ off subgroup. However, the GAD− off subgroup was different in being homogeneous and composed entirely of tonically discharging cells. The GAD− cells were on average significantly smaller than GAD+ cells, and the GAD− off cells were also significantly smaller than the GAD+ off cells (Table 2). They did not differ significantly according to their spike width or latency of antidromic activation (Table 2).
The Nb+/GAD− on (tonic) neurons (mapped in Fig. 3) represented the largest group of GAD− neurons (35%; Table 3). Many of these cells were antidromically activated from the prefrontal cortex (Table 2). As for the cell illustrated (Fig. 8, corresponding to Fig. 2E), these cells tended to fire regularly and to increase their average rate of discharge (PSH) without markedly changing their instantaneous firing frequency (ISIH; Table 3). When compared with the Nb+/GAD+ on (tonic) subgroup, the average discharge rate of the GAD− on (tonic) cells was significantly slower across conditions (Table 3). Moreover, a lower proportion of these GAD− cells (17%) displayed rhythmic high-frequency spiking during stimulation than the GAD+ on (tonic) cells (88%; χ2 = 19.87; df = 1;p < 0.001; Table 3). They did not differ significantly in size, spike width, or latency of antidromic activation from the GAD+ on (tonic) cells.
Fig. 8.

Nb+/GAD− on (tonic) neuron (#03/23/R2 as shown in Fig. 1E). I, Note the increase in average discharge rate (B) and regularity of discharge, which becomes clearly tonic (D) in association with cortical activation (A, C) during stimulation. II, Note in the analysis that with stimulation the EEG shifts from irregular slow activity to a faster rhythmic slow activity, concomitant with an increase in gamma activity. The tonic discharge of the unit shows no sign of rhythmicity in the high-frequency range (B with drop down) in contrast to the Nb+/GAD+ on (tonic) cell (shown in Fig. 3). See Figure 3 for further explanation of measures.
As a group, the Nb+/GAD− on (cluster) neurons (mapped in Fig. 3) represented the second largest subgroup of GAD− neurons (29%; Table3). None of these cells could be antidromically activated from the prefrontal cortex. Their average rate of discharge increased significantly with stimulation (Table 3) and simultaneously shifted from tonic or irregular spiking to a regular cluster discharge in association with stimulation-induced cortical activation (data not shown). This cluster discharge was rhythmic in all cells (Table 3). In the majority of cases, their rhythmic discharge was also cross-correlated with a signal in the retrosplenial EEG (Table3), although usually corresponding to a slower frequency, secondary peak here and the primary peak on the prefrontal cortex in the power spectra (data not shown). Some of these cells showed very regular to rhythmic high-frequency spiking within the spike clusters during stimulation (Table 3). During the stimulation-evoked cortical activation, the discharge pattern of the GAD− on (cluster) neurons was similar to that of the GAD+ off (tonic/cluster) neurons. During the prestimulation irregular slow activity however, they differed (as reflected in their different response to stimulation), having a significantly lower average discharge rate than the GAD+ off (tonic/cluster) cells (t = −2.729; df = 13;p = 0.017).
The Nb+/GAD− on (burst) neurons (mapped in Fig. 3) represented 18% of the GAD− cell sample (Table 3). One of these neurons was antidromically activated from prefrontal cortex (Table 2). These cells discharged in an irregular manner during prestimulation conditions and shifted their discharge to high-frequency bursting with stimulation (data not shown). They displayed a significant increase in average rate of discharge (PSH) and greater, although insignificant, increase in instantaneous firing frequency (ISIH; Table 3), reflecting their bursting activity. The discharge of most cells was rhythmic and cross-correlated with the retrosplenial EEG during stimulation (Table3), although with activity corresponding to a secondary peak on the retrosplenial EEG and a primary peak on the prefrontal cortex. These GAD− on (burst) neurons did not resemble any GAD+ cells in discharge characteristics across conditions.
The Nb+/GAD− off neurons (mapped in Fig. 3) accounted for a small proportion of the GAD− cells sampled (18%; Table 3) and were composed entirely of off (tonic) neurons. One of these cells was antidromically activated from prefrontal cortex (Table 2). They tended to fire in a irregular slow tonic pattern with irregular slow cortical activity and to cease firing with stimulation (data not shown). They did not differ from Nb+/GAD+ off (tonic) neurons in their response to stimulation and average discharge rates across conditions. They were on average smaller in size than the GAD+ homologous subgroup (t = −2.157; df = 12; p = 0.052; Table 2).
DISCUSSION
This, to our knowledge, is the first physiological characterization of immunohistochemically identified GABA-synthesizing basal forebrain neurons. GABAergic cells behave differently from non-GABAergic cells in terms of their discharge profile in relation to cortical activity. They comprise unique and distinct subgroups of neurons, which could collectively serve in the dual role of the basal forebrain in promoting cortical activation during waking and attenuating cortical activation during slow wave sleep. Moreover, particular subgroups display phasic discharge patterns that may modulate rhythmic gamma or theta oscillations during cortical activation and others, irregular slow wave activity during cortical slow wave activity.
A minority, although significant (40%), of the GABAergic neurons increased their average discharge rate with somatosensory-evoked cortical activation, as compared with the vast majority (∼80%) of non-GABAergic neurons in the current sample and the totality of cholinergic neurons in our previous sample (Manns et al., 2000). All these GAD+ on cells discharged in a tonic mode and were distinguished from the GAD− on cells, including specifically the on (tonic) cells, by their higher frequency discharge (up to 65 Hz). They were furthermore distinguished by the regularity of their tonic discharge, such that it met criterion for being rhythmic at high frequency in almost all cells during cortical activation. Their range of firing frequencies extended across the ranges of EEG activities corresponding to beta (15–30 Hz) and gamma (30–60 Hz) activities, and shifted on average from a beta range into a gamma range with somatosensory stimulation. In naturally sleeping–waking rats, beta activity is higher during slow wave sleep than during waking, whereas gamma activity is higher during waking and highest during active or attentive waking behavior (and during paradoxical sleep), thus reflecting cortical activation in the rat (Maloney et al., 1997). Here, gamma EEG activity was significantly higher during somatosensory stimulation than during the prestimulation condition. Large in size and antidromically activated from the prefrontal cortex, these presumed cortically projecting GABAergic neurons, could contribute by their high-frequency rhythmic discharge to the promotion and/or pacing of gamma EEG activity. Such action could be achieved through the cortical inhibitory interneurons, which GABAergic basal forebrain neurons innervate (Freund and Meskenaite, 1992), by the rhythmic timing of their discharge with IPSPs. Accordingly, they would act in parallel with the cholinergic basalocortical neurons, because the cholinergic neurons increase firing in association with increased gamma (Manns et al., 2000), and ACh promotes gamma by providing a long-lasting facilitation to cortical interneurons and pyramidal cells (Metherate et al., 1992; Buhl et al., 1998).
The majority of GAD+ neurons decreased their average discharge rate with somatosensory stimulation-evoked cortical activation and were, for simplicity, categorized as off cells. These off cells could be further subdivided into distinct subgroups. Among these, the off (tonic/cluster) cells were unique in their discharge profile. During prestimulation, they fired in a tonic spike discharge at a relatively high rate, in what would correspond to a beta range of EEG frequencies. During stimulation, although they decreased their average rate of discharge, they shifted to a rhythmic cluster spike discharge, which was cross-correlated with the stimulation-evoked theta-like EEG activity. They could thus potentially maintain target neurons in a nonrhythmic mode by their tonic discharge during irregular slow wave activity and then in a rhythmic mode by their cluster discharge during rhythmic slow activity. They would accordingly subserve a dual role in preventing theta during slow wave sleep and then promoting theta during waking (and paradoxical sleep). Noncholinergic neurons, which have been presumed to be, although not yet identified as, GABAergic neurons in the medial septum also discharge rhythmically and appear to be important in stimulating theta activity in the hippocampus (Lee et al., 1994; Dragoi et al., 1999). The cluster discharge of the GAD+ off (tonic/cluster) cells recorded here resembled the cluster discharge of the GAD− on (cluster) cells. Together, the cluster pattern of discharge of these two cell groups resembled that of noncholinergic cells previously described in vitro in the basal forebrain (Alonso et al., 1996). Given the relationship of their cluster discharge to the EEG activity and their relatively large size, the GAD+ off (tonic/cluster) neurons, like the GAD− on (cluster) neurons, are likely to project to cortical areas (Zaborszky et al., 1986; Gritti et al., 1997), even though they could not be antidromically activated from the prefrontal cortex. As previously found for the rhythmic bursting discharge of the cholinergic cells (which would correspond to the GAD− on (burst) cells in the present sample), the rhythmic discharge of the cluster spiking cells tended to be cross-correlated with rhythmic slow activity that was slower than that of the primary retrosplenial theta-like activity and more similar to that of the prefrontal activity. Accordingly, the GABAergic cluster discharging neurons could serve, along with the other non-GABAergic cluster discharging cells, in parallel with the burst discharging cholinergic neurons to modulate cortical activity in a rhythmic slow manner at frequencies within the theta range but particular to a cortical region as well as behavioral state (Manns et al., 2000).
The GAD+ off (burst) and off (tonic) cells arrested their discharge in association with cortical activation. With respect to cortical activity, their profile of discharge is similar to that of neurons in the basal forebrain and adjacent preoptic area that were characterized as sleep-active in naturally sleeping–waking, freely moving animals (Szymusiak and McGinty, 1986b; Koyama and Hayaishi, 1994). The majority of sleep-active cells were inhibited by stimulation of the midbrain reticular formation, locus coeruleus, or by iontophoretic application of noradrenaline (NA) (Szymusiak and McGinty, 1989; Osaka and Matsumura, 1994, 1995). In brain slices, a small proportion of noncholinergic basal forebrain neurons were identified that were hyperpolarized by NA and ACh, and thus proposed to potentially represent slow wave sleep-active neurons (Fort et al., 1998). Also in brain slices more recently, a major proportion of neurons in the adjacent lateral preoptic area has been shown to be inhibited by these neurotransmitters and identified (by PCR) as potentially GABAergic (Gallopin et al., 2000). Together with the present results, it would appear that a population of GABAergic neurons distributed through the basal forebrain and in partial continuity with cells in the preoptic region, which are inhibited by ascending activating impulses transmitted in part by noradrenergic and cholinergic fibers (Jones and Cuello, 1989), may serve to dampen cortical activation and promote slow wave sleep.
The GAD+ off (burst) cells fired high-frequency bursts associated with the irregular cortical slow waves during the prestimulation condition. These neurons appear similar to a type of sleep-active cell recorded in the preoptic area and adjacent basal forebrain of freely moving rats that discharged in a phasic manner during slow wave sleep (Koyama and Hayaishi, 1994). They may also be similar to cells in the septum that discharge in association with hippocampal sharp waves (Dragoi et al., 1999). GAD+ off (burst) cells were identified by antidromic activation as cortically projecting neurons, and their discharge was cross-correlated with the irregular slow activity on the cortex. They could accordingly fire in a synchronous manner with the (<1 Hz) slow oscillation (or delta waves, 1–4 Hz) of slow wave sleep, during which cortical neurons discharge in a highly synchronous slow manner (Steriade et al., 1993). GABAergic off (burst) basal forebrain cells could thus attenuate fast cortical activity while modulating irregular slow activity during slow wave sleep.
Nb+/GAD+ off (tonic) neurons discharged in single spikes at very low average rates (<5 Hz) in association with irregular slow cortical activity and virtually ceased firing with cortical activation (<1 Hz). These cells appear to be similar to sleep-active neurons that were described in the cat as firing at <10 Hz during slow wave sleep and <1 Hz during waking (Szymusiak and McGinty, 1986b). Some of the latter neurons were antidromically activated from the cortex, others from the brainstem (Szymusiak and McGinty, 1989). In the present sample, none of the GAD+ off (tonic) cells could be antidromically activated from prefrontal cortex. However, given the relatively large size of these GAD+ cells, it is likely that they are projection neurons and could project to cortical areas (Gritti et al., 1997). On the other hand, given the full range of cell sizes among projecting cells, it is also possible that they could project to subcortical regions, including the thalamus (Asanuma and Porter, 1990; Gritti et al., 1998) and posterior hypothalamus or brainstem (Gritti et al., 1994). Accordingly, they could be involved in attenuating cortical or subcortical activity in a slow tonic manner during slow wave sleep.
In conclusion, the unique and distinct GABAergic basal forebrain cell subgroups identified here reveal GABAergic neurons with the potential to act in parallel with cholinergic and other noncholinergic cortically projecting neurons such as to promote and/or pace gamma activity [by GAD+ on (tonic) cells] and theta-like activity [by GAD+ off (tonic/cluster) cells] during the cortical activation of waking (and/or paradoxical sleep). GABAergic cells would also have the capacity to attenuate cortical activation, including theta activity [by the GAD+ off (tonic/cluster) cells], and modulate cortical activity at very slow frequencies [by GAD+ off (burst) cells] or induce other cortical, subcortical or behavioral changes [by GAD+ off (tonic) cells] associated with slow wave sleep.
Footnotes
This work was supported by the Canadian Medical Research Council Grant MT-13458 and National Institute of Mental Health Grant RO1 MH60119-01A1. I.M. held a graduate student scholarship from the Canadian Natural Science and Engineering Research Council. We thank Lynda Mainville for her technical contribution to this work.
Correspondence should be addressed to Dr. Barbara E. Jones, Montreal Neurological Institute, 3801 University Street, Montreal, Quebec, Canada H3A 2B4. E-mail: mcbj@musica.mcgill.ca.
REFERENCES
- 1.Alonso A, Khateb A, Fort P, Jones BE, Muhlethaler M. Differential oscillatory properties of cholinergic and non-cholinergic nucleus Basalis neurons in guinea pig brain slice. Eur J Neurosci. 1996;8:169–182. doi: 10.1111/j.1460-9568.1996.tb01178.x. [DOI] [PubMed] [Google Scholar]
- 2.Asanuma C, Porter LL. Light and electron microscopic evidence for a GABAergic projection from the caudal basal forebrain to the thalamic reticular nucleus in rats. J Comp Neurol. 1990;302:159–172. doi: 10.1002/cne.903020112. [DOI] [PubMed] [Google Scholar]
- 3.Borst JGG, Leung L-WS, MacFabe DF. Electrical activity of the cingulate cortex. II. Cholinergic modulation. Brain Res. 1987;407:81–93. doi: 10.1016/0006-8993(87)91221-2. [DOI] [PubMed] [Google Scholar]
- 4.Buhl EH, Tamas G, Fisahn A. Cholinergic activation and tonic excitation induce persistent gamma oscillations in mouse somatosensory cortex in vitro. J Physiol (Lond) 1998;513(Pt 1):117–126. doi: 10.1111/j.1469-7793.1998.117by.x. [DOI] [PMC free article] [PubMed] [Google Scholar]
- 5.Buzsaki G, Bickford RG, Ponomareff G, Thal LJ, Mandel R, Gage FH. Nucleus basalis and thalamic control of neocortical activity in the freely moving rat. J Neurosci. 1988;8:4007–4026. doi: 10.1523/JNEUROSCI.08-11-04007.1988. [DOI] [PMC free article] [PubMed] [Google Scholar]
- 6.Cape EG, Manns ID, Alonso A, Beaudet A, Jones BE. Neurotensin-induced bursting of cholinergic basal forebrain neurons promotes gamma and theta cortical activity together with waking and paradoxical sleep. J Neurosci. 2000;20:8452–8461. doi: 10.1523/JNEUROSCI.20-22-08452.2000. [DOI] [PMC free article] [PubMed] [Google Scholar]
- 7.Celesia GG, Jasper HH. Acetylcholine released from cerebral cortex in relation to state of activation. Neurology. 1966;16:1053–1064. doi: 10.1212/wnl.16.11.1053. [DOI] [PubMed] [Google Scholar]
- 8.Detari L, Juhasz G, Kukorelli T. Neuronal firing in the pallidal region: firing patterns during sleep-wakefulness cycle in cats. Electroencephalogr Clin Neurophysiol. 1987;67:159–166. doi: 10.1016/0013-4694(87)90039-3. [DOI] [PubMed] [Google Scholar]
- 9.Dragoi G, Carpi D, Recce M, Cssicsvari J, Buzsaki G. Interactions between hippocampus and medial septum during sharp waves and theta oscillation in the behaving rat. J Neurosci. 1999;19:6191–6199. doi: 10.1523/JNEUROSCI.19-14-06191.1999. [DOI] [PMC free article] [PubMed] [Google Scholar]
- 10.Fort P, Khateb A, Serafin M, Muhlethaler M, Jones BE. Pharmacological characterization and differentiation of non-cholinergic nucleus basalis neurons in vitro. NeuroReport. 1998;9:1–5. doi: 10.1097/00001756-199801050-00013. [DOI] [PubMed] [Google Scholar]
- 11.Freund TF, Meskenaite V. Gamma-aminobutyric acid-containing basal forebrain neurons innervate inhibitory interneurons in the neocortex. Proc Natl Acad Sci USA. 1992;89:738–742. doi: 10.1073/pnas.89.2.738. [DOI] [PMC free article] [PubMed] [Google Scholar]
- 12.Gallopin T, Fort P, Eggermann E, Caull B, Luppi P-H, Rossier J, Audinat E, Muhlethaler M, Serafin M. Identification of sleep-promoting neurons in vitro. Nature. 2000;404:992–995. doi: 10.1038/35010109. [DOI] [PubMed] [Google Scholar]
- 13.Gritti I, Mainville L, Jones BE. Codistribution of GABA- with acetylcholine-synthesizing neurons in the basal forebrain of the rat. J Comp Neurol. 1993;329:438–457. doi: 10.1002/cne.903290403. [DOI] [PubMed] [Google Scholar]
- 14.Gritti I, Mainville L, Jones BE. Projections of GABAergic and cholinergic basal forebrain and GABAergic preoptic-anterior hypothalamic neurons to the posterior lateral hypothalamus of the rat. J Comp Neurol. 1994;339:251–268. doi: 10.1002/cne.903390206. [DOI] [PubMed] [Google Scholar]
- 15.Gritti I, Mainville L, Mancia M, Jones BE. GABAergic and other non-cholinergic basal forebrain neurons project together with cholinergic neurons to meso- and iso-cortex in the rat. J Comp Neurol. 1997;383:163–177. [PubMed] [Google Scholar]
- 16.Gritti I, Mariotti M, Mancia M. GABAergic and cholinergic basal forebrain and preoptic-anterior hypothalamic projections to the mediodorsal nucleus of the thalamus in the cat. Neuroscience. 1998;85:149–178. doi: 10.1016/s0306-4522(97)00573-3. [DOI] [PubMed] [Google Scholar]
- 17.Holsheimer J. Generation of theta activity (RSA) in the cingulate cortex of the rat. Exp Brain Res. 1982;47:309–312. doi: 10.1007/BF00239391. [DOI] [PubMed] [Google Scholar]
- 18.Jimenez-Capdeville ME, Dykes RW, Myasnikov AA. Differential control of cortical activity by the basal forebrain in rats: a role for both cholinergic and inhibitory influences. J Comp Neurol. 1997;381:53–67. [PubMed] [Google Scholar]
- 19.Jones BE. Basic mechanisms of sleep-wake states. In: Kryger MH, Roth T, Dement WC, editors. Principles and practice of sleep medicine, Ed 3. Saunders; Philadelphia: 2000. pp. 134–154. [Google Scholar]
- 20.Jones BE, Cuello AC. Afferents to the basal forebrain cholinergic cell area from pontomesencephalic–catecholamine, serotonin, and acetylcholine–neurons. Neuroscience. 1989;31:37–61. doi: 10.1016/0306-4522(89)90029-8. [DOI] [PubMed] [Google Scholar]
- 21.Koyama Y, Hayaishi O. Firing of neurons in the preoptic/anterior hypothalamic areas in rat: its possible involvement in slow wave sleep and paradoxical sleep. Neurosci Res. 1994;19:31–38. doi: 10.1016/0168-0102(94)90005-1. [DOI] [PubMed] [Google Scholar]
- 22.Krnjevic K, Phillis JW. Pharmacological properties of acetylcholine-sensitive cells in the cerebral cortex. J Physiol (Lond) 1963;166:328–350. doi: 10.1113/jphysiol.1963.sp007107. [DOI] [PMC free article] [PubMed] [Google Scholar]
- 23.Lee MG, Chrobak JJ, Sik A, Wiley RG, Buzsaki G. Hippocampal theta activity following selective lesion of the septal cholinergic system. Neuroscience. 1994;62:1033–1047. doi: 10.1016/0306-4522(94)90341-7. [DOI] [PubMed] [Google Scholar]
- 24.Leung L-WS, Borst JGG. Electrical activity of the cingulate cortex. I. Generating mechanisms and relations to behavior. Brain Res. 1987;407:68–80. doi: 10.1016/0006-8993(87)91220-0. [DOI] [PubMed] [Google Scholar]
- 25.Luiten PGM, Gaykema RPA, Traber J, Spencer DG. Cortical projection patterns of magnocellular basal nucleus subdivisions as revealed by anterogradely transported Phaseolus vulgaris leucoagglutinin. Brain Res. 1987;413:229–250. doi: 10.1016/0006-8993(87)91014-6. [DOI] [PubMed] [Google Scholar]
- 26.Maloney KJ, Cape EG, Gotman J, Jones BE. High frequency gamma electroencephalogram activity in association with sleep-wake states and spontaneous behaviors in the rat. Neuroscience. 1997;76:541–555. doi: 10.1016/s0306-4522(96)00298-9. [DOI] [PubMed] [Google Scholar]
- 27.Manns ID, Alonso A, Jones BE. Discharge properties of juxtacellularly labeled and immunohistochemically identified cholinergic basal forebrain neurons recorded in association with the electroencephalogram in anesthetized rats. J Neurosci. 2000;20:1505–1518. doi: 10.1523/JNEUROSCI.20-04-01505.2000. [DOI] [PMC free article] [PubMed] [Google Scholar]
- 28.McGinty DJ, Sterman MB. Sleep suppression after basal forebrain lesions in the cat. Science. 1968;160:1253–1255. doi: 10.1126/science.160.3833.1253. [DOI] [PubMed] [Google Scholar]
- 29.Metherate R, Cox CL, Ashe JH. Cellular bases of neocortical activation: modulation of neural oscillations by the nucleus basalis and endogenous acetylcholine. J Neurosci. 1992;12:4701–4711. doi: 10.1523/JNEUROSCI.12-12-04701.1992. [DOI] [PMC free article] [PubMed] [Google Scholar]
- 30.Osaka T, Matsumura H. Noradrenergic inputs to sleep-related neurons in the preoptic area from the locus coeruleus and the ventrolateral medulla in the rat. Neurosci Res. 1994;19:39–50. doi: 10.1016/0168-0102(94)90006-x. [DOI] [PubMed] [Google Scholar]
- 31.Osaka T, Matsumura H. Noradrenaline inhibits preoptic sleep-active neurons through α2-receptors in the rat. Neurosci Res. 1995;21:323–330. doi: 10.1016/0168-0102(94)00871-c. [DOI] [PubMed] [Google Scholar]
- 32.Paxinos G, Watson C. The rat brain in stereotaxic coordinates. Academic; Sydney: 1986. [DOI] [PubMed] [Google Scholar]
- 33.Pinault D. A novel single-cell staining procedure performed in vivo under electrophysiological control: morpho-functional features of juxtacellularly labeled thalamic cells and other central neurons with biocytin or Neurobiotin. J Neurosci Methods. 1996;65:113–136. doi: 10.1016/0165-0270(95)00144-1. [DOI] [PubMed] [Google Scholar]
- 34.Saper CB. Organization of cerebral cortical afferent systems in the rat. I. Magnocellular basal nucleus. J Comp Neurol. 1984;222:313–342. doi: 10.1002/cne.902220302. [DOI] [PubMed] [Google Scholar]
- 35.Starzl TE, Taylor CW, Magoun HW. Ascending conduction in reticular activating system, with special reference to the diencephalon. J Neurophysiol. 1951;14:461–477. doi: 10.1152/jn.1951.14.6.461. [DOI] [PMC free article] [PubMed] [Google Scholar]
- 36.Steriade M, Nuñez A, Amzica F. A novel slow (<1 Hz) oscillation of neocortical neurons in vivo: depolarizing and hyperpolarizing components. J Neurosci. 1993;13:3252–3265. doi: 10.1523/JNEUROSCI.13-08-03252.1993. [DOI] [PMC free article] [PubMed] [Google Scholar]
- 37.Sterman MB, Clemente CD. Forebrain inhibitory mechanisms: Sleep patterns induced by basal forebrain stimulation in the behaving cat. Exp Neurol. 1962;6:103–117. doi: 10.1016/0014-4886(62)90081-x. [DOI] [PubMed] [Google Scholar]
- 38.Stewart DJ, Macfabe DF, Vanderwolf CH. Cholinergic activation of the electrocorticogram: role of the substantia innominata and effects of atropine and quinuclidinyl benzilate. Brain Res. 1984;322:219–232. doi: 10.1016/0006-8993(84)90112-4. [DOI] [PubMed] [Google Scholar]
- 39.Szymusiak R, McGinty D. Sleep suppression following kainic acid-induced lesions of the basal forebrain. Exp Neurol. 1986a;94:598–614. doi: 10.1016/0014-4886(86)90240-2. [DOI] [PubMed] [Google Scholar]
- 40.Szymusiak R, McGinty D. Sleep-related neuronal discharge in the basal forebrain of cats. Brain Res. 1986b;370:82–92. doi: 10.1016/0006-8993(86)91107-8. [DOI] [PubMed] [Google Scholar]
- 41.Szymusiak R, McGinty D. Sleep-waking discharge of basal forebrain projection neurons in cats. Brain Res Bull. 1989;22:423–430. doi: 10.1016/0361-9230(89)90069-5. [DOI] [PubMed] [Google Scholar]
- 42.Zaborszky L, Carlsen J, Brashear HR, Heimer L. Cholinergic and GABAergic afferents to the olfactory bulb in the rat with special emphasis on the projection neurons in the nucleus of the horizontal limb of the diagonal band. J Comp Neurol. 1986;243:488–509. doi: 10.1002/cne.902430405. [DOI] [PubMed] [Google Scholar]