Abstract
During disinhibition, the neocortex generates synchronous activities. Block of GABAA receptors in neocortex transforms cortical slow-wave oscillations into large-amplitude ∼1 Hz discharges consisting of a negative spike or multiple negative spikes riding on a positive wave. Further block of GABAB receptors in neocortex slows the discharges to ∼0.5 Hz and increments the number of negative spikes forming rhythmic ∼10 Hz neocortical oscillations. Although the thalamus responds robustly to these neocortical discharges, these are unaffected by thalamic inactivation using tetrodotoxin. Thus, an important problem relates to the origin of these activities within the neocortex. Current source density analysis and intracellular recordings revealed that the first negative spike in a discharge corresponded to a current sink that reflected a paroxysmal depolarizing shift (PDS) and could originate in the lower layers or in the upper layers. Regardless of the origin (upper or lower layer), the initial current sink always spreads to the same site in upper layer V–IV. In contrast, the ∼10 Hz oscillation that follows the initial negative spike corresponds to current sinks that always originate in the lower layers but do not spread to upper layer V–IV, jumping directly to the upper layers. Each current sink in the ∼10 Hz oscillation reflects a small PDS and is followed by a current source that reflects the repolarization after each PDS.
Keywords: epilepsy, seizure, oscillations, thalamus, neocortex, γ-aminobutyric acid, GABAA receptors, GABABreceptors, CGP35348
The neocortex generates highly synchronized oscillatory activity during normal (e.g., sensory processing; Singer, 1993; Rougeul-Buser and Buser, 1997) and abnormal (e.g., seizures; Schwartzkroin, 1993; McNamara, 1994) behavioral states. Synchrony can be generated by a variety of processes. In particular, GABAA receptor blockade in neocortex is especially effective in generating synchrony in isolated slices (Gutnick et al., 1982; Connors, 1984; Hablitz, 1987) and in vivo (Ralston, 1958; Matsumoto and Ajmone-Marsan, 1964a; Gloor et al., 1977; Castro-Alamancos and Borrell, 1995; Steriade and Contreras, 1998). An important issue relates to the location in which these synchronous activities originate in the neocortex. This problem has been studied in slices of brain tissue (Connors, 1984; Chagnac-Amitai and Connors, 1989; Silva et al., 1991;Sutor et al., 1994; Flint and Connors, 1996; Tsau et al., 1999).
The present study further describes the effects of blocking neocortical GABAA and GABAB receptors on spontaneous neocortical and thalamic activity in vivo. Current source density analysis (CSD) combined with microdialysis and intracellular recordings revealed the laminar origin of synchronized oscillations generated by neocortical disinhibition in vivo.
MATERIALS AND METHODS
The methods were similar to those described previously (Castro-Alamancos, 1999). Briefly, Sprague Dawley rats (250–350 gm) were anesthetized with ketamine HCl (100 mg/kg, i.p.) and xylazine (5 mg/kg, i.p.). After induction of surgical anesthesia, the animal was placed in a stereotaxic frame. Body temperature was monitored and maintained constant (36–37°C). Anesthesia was supplemented with a constant (4 μl/min) infusion of ketamine(100 mg/ml) and xylazine (5 mg/ml) or with an equivalent injection delivered every 30 min. All procedures were reviewed and approved by the Animal Care Committee of McGill University.
Electrophysiological recordings. Extracellular recordings were performed in the neocortex using linear 16 channel silicon probes with 100 μm intersite spacing (Center for Neural Communication Technology, University of Michigan, Ann Arbor, MI) as described previously (Castro-Alamancos, 1999). Extracellular recordings were performed in the ventrolateral nucleus of the thalamus using tungsten-insulated microelectrodes (1–3 MΩ impedance). Bandpass filter settings were selected for field potential (1 Hz to 3 kHz) or for multi-unit recordings (300 Hz to 3 kHz). Intracellular recordings were performed using potassium acetate (3m)-filled glass microelectrodes (60–90 MΩ) with an Axoclamp 2B amplifier (Axon Instruments, Foster City, CA). CSDs were performed as described previously (Castro-Alamancos and Connors, 1996a; Castro-Alamancos, 1999).
Microdialysis. Methods were as described previously (Castro-Alamancos,1999). Microdialysis probes were either built in the laboratory or the CMA11 model (CMA Microdialysis, Solna, Sweden).
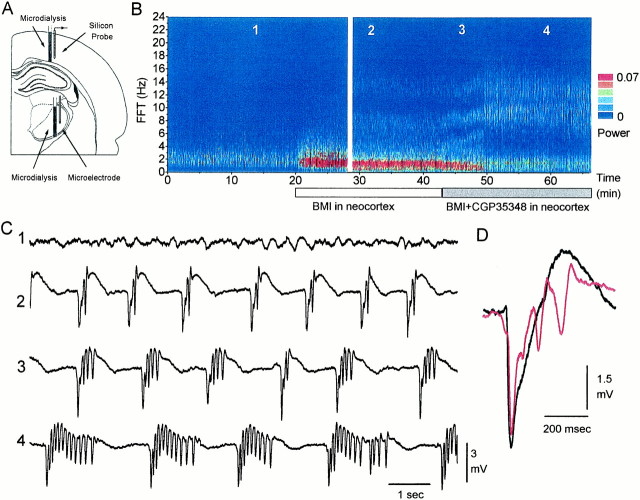
Probe location. Microdialysis probes and recording electrodes were inserted stereotactically in the primary motor neocortex and in the thalamus [all coordinates given are in millimeters, referred to bregma and the dura according to the atlas of Paxinos and Watson (1982)] (Fig.1A). Coordinates for the thalamic microdialysis probe were approximately: anteroposterior, −2 to −3; lateral, 2–3. The microdialysis probe membrane extended 2 mm in depth starting at 5 mm from the dura. The thalamic recording electrode was placed adjacent to the microdialysis probe in the ventrolateral nucleus at approximately: anteroposterior, − 2; lateral, 2.5; ventral, 6. Additional thalamic recording electrodes were placed at anteroposterior, −3, −4, and −5. Coordinates for the microdialysis probe in neocortex were approximately: anteroposterior, 1; lateral, 2.5. The microdialysis probe membrane extended 2 mm in depth starting at the dura. The silicon probe in neocortex was placed in the forelimb primary motor cortex at the following coordinates: anteroposterior, 1; lateral, 3. These coordinates were chosen because they correspond to the location where thalamocortical responses are evoked in the neocortex by stimulating the ventrolateral nucleus (Castro-Alamancos and Connors, 1996a). Insertion of the silicon probe into the neocortex was performed with guidance from a surgical microscope. The recording sites on the probe were visualized, and the most dorsal site was placed at defined distances into the cortex from the surface.
Fig. 1.
Effect of blocking neocortical GABAAreceptors on neocortical field potential activity. A, Schematic diagram depicting the locations of the microdialysis probes used to infuse drugs into the neocortex and thalamus, of the 16-site linear array silicon probe used to record activity from the neocortex, and of the microelectrode used to record activity from the thalamus. The silicon probe was located 3 mm more anterior than the microdialysis probe, but for simplicity, they are shown in the same section.B, Power spectrum derived from every 2 sec of spontaneous field potential activity recorded from the neocortex and displayed as a color contour plot. During infusion of ACSF through the microdialysis probe, neocortical activity consists of slow-wave activity. Infusion of a GABAA receptor antagonist (BMI) into the neocortex results in the generation of ∼1 Hz discharges. Further application of a GABAB receptor antagonist (CGP35348) slows these discharges to ∼0.5 Hz and enhances their duration, giving rise to ∼10 Hz oscillations. The gap at minute 28 represents 15 min. C, Examples of recordings before, during BMI, and during BMI plus CGP35348 application. Thenumbers on the traces correspond to the times indicated in B. Recordings were from a site 1 mm in depth from the surface. Traces are 10 sec long.D, Electrographic pattern of the ∼1 Hz discharges induced in the neocortex by BMI alone, which may consist of a negative spike followed by a positive wave or of a negative spike followed by one to three lower amplitude negative spikes that ride on the wave.
RESULTS
Neocortical GABAA disinhibition generates ∼1 Hz discharges
Microdialysis probes and extracellular recording electrodes were inserted into the neocortex and thalamus (Fig. 1A). Artificial CSF (ACSF) was continuously infused through the microdialysis probes while local field potentials were recorded. Fast Fourier transforms were derived from every 2 sec of neocortical field potential activity recorded from a site located 1 mm in depth. Figure 1B shows the evolution of the power spectrum of neocortical activity over time displayed as a color contour plot. The power for each frequency is color-coded so that an increase in the power is displayed as a hot color (yellow andred), and zero is displayed as blue. Under ketamine–xylazine anesthesia, slow-wave activity (∼1 Hz) is prominent in neocortex (Steriade et al., 1993). When bicuculline methobromide (BMI) (400 μm) is included in the ACSF and infused into the neocortex, the cortical slow-wave activity is transformed into large-amplitude discharges at ∼1 Hz (Fig.1C, trace 2). The cortical discharges induced by blockade of GABAA receptors consist of a negative spike followed by a positive wave (Fig. 1D,black trace) or of a negative spike followed by one to three lower amplitude negative spikes at ∼10 Hz that ride on the positive wave (Fig. 1D, red trace). During BMI application, these discharges occur continuously at ∼1 Hz or less. The same results were obtained in every such experiment conducted (n = 8). As previously indicated, the spread of BMI in the neocortex at this dose is ∼1 mm from the probe (Castro-Alamancos, 1999). Different doses of BMI were tested (40, 400, and 4000 μm), and they produced similar effects. The major difference was that the number of low-amplitude negative spikes that ride on the positive wave increased with the dose of BMI, from zero to two at low doses (40–400 μm) to three to four at higher doses (4000 μm) (Fig.1D) (for simplicity, I will refer to this activity caused by BMI as ∼1 Hz discharges).
Neocortical GABAA and GABAB disinhibition generates ∼10 Hz discharges
GABAB receptor antagonists abolish the 3 Hz discharges induced by thalamic GABAA receptor blockade in vivo (Castro-Alamancos, 1999) and in slices (von Krosigk et al., 1993). The next experiment tested the effect of blocking GABAB receptors on the ∼1 Hz discharges induced by neocortical GABAA receptor blockade. Figure 1B shows that infusing a GABAB receptor antagonist (CGP35348; 10 mm) into the neocortex in the presence of BMI slows the ∼1 Hz discharges generated by BMI to ∼0.5 Hz and increases the number of low-amplitude negative spikes on the discharge from 2–3 to 5–15. These low-amplitude spikes occur at ∼10 Hz (between 7 and 14 Hz) (Fig. 1C, traces 3,4). This result was obtained in every experiment (n = 5). Different doses of CGP35348 were tested (1,10, and 20 mm; n = 3, 5, and 3 animals, respectively), resulting in an increase in the number of low-amplitude spikes with dosage. There was a significant and positive correlation between the dose of CGP35348 and the number of low-amplitude spikes (+0.86; p < 0.0001). It is also important to note that the activity generated by CGP35348 was not a mere consequence of long-term BMI application because simultaneous infusion of BMI plus CGP35348 (n = 3) produced immediately the same result as show in Figure 1B(traces 3, 4). Thus, local cortical disinhibition results in the induction of rhythmic oscillations at 7–14 Hz that recur periodically at ∼0.5 Hz (for simplicity, I will refer to these oscillations caused by BMI plus CGP35348 as ∼10 Hz discharges).
The thalamus does not generate the ∼1 or ∼10 Hz discharges
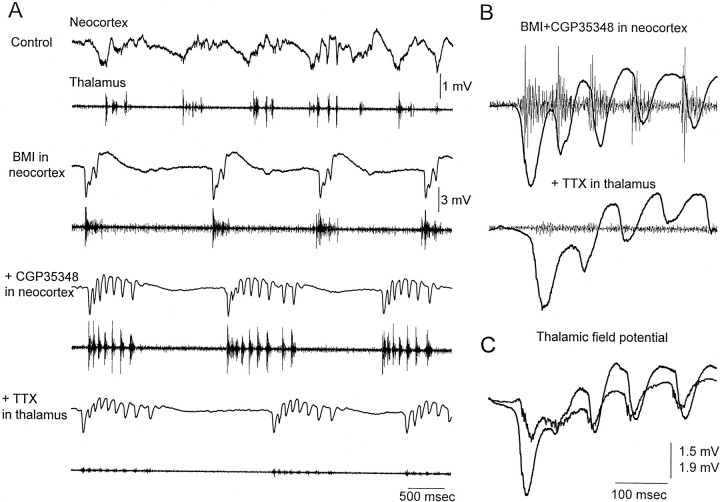
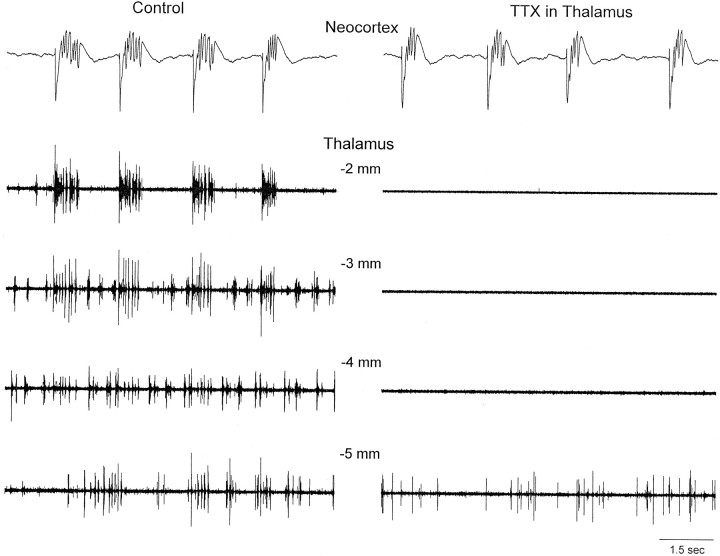
The thalamus generates synchronized oscillations at ∼10 Hz, such as spindle waves (Steriade et al., 1997). This suggested that the thalamus might be generating or participating in the generation of the ∼10 Hz discharges triggered by neocortical disinhibition. For example, the initial large-amplitude negative spike of each discharge could recruit the thalamus and trigger a spindle oscillation that would spread back to the neocortex. To test the involvement of the thalamus, recordings were performed simultaneously from the forelimb primary motor cortex and from the ventrolateral nucleus of the thalamus, and microdialysis probes were placed in both the thalamus and neocortex (Fig. 1A). Application of BMI and CGP35348 into the neocortex produced ∼10 Hz discharges that effectively recruited the thalamus at the same frequency (Fig.2A,B). The thalamic response lagged the first large-amplitude negative spike in the discharge (Fig. 2C). To test whether the thalamus generates or contributes to the generation of the cortical oscillation at ∼10 Hz, the Na+ channel blocker tetrodotoxin (TTX) (20 μm) was infused into the thalamus during the occurrence of ∼10 Hz discharges caused by neocortical disinhibition. The results show that, despite the abolition of thalamic activity by TTX, the neocortical ∼10 Hz discharges were not abolished (Fig. 2A,B). To ensure that no thalamic area was involved in the generation of the ∼10 Hz discharges, I recorded thalamic activity from four microelectrodes (placed at 2, 3, 4, and 5 mm posterior to bregma). The four microelectrodes were moved at different depths along the thalamus (4.5–7 mm from the surface) to monitor multi-unit activity and to ensure that, after TTX, no thalamic region was contributing to the ∼10 Hz discharges. Figure 3 shows the activity measured before and after TTX at 5.5 mm from the surface. The same results were observed for recordings obtained at different depths along the thalamus. Note that the thalamic activity related to the cortical discharges is prominent in the ventrolateral nucleus (2 mm posterior from bregma) and in the ventrobasal thalamus (3 mm posterior from bregma) but basically absent at more posterior thalamic locations (4 and 5 mm). At these posterior locations, the spontaneous activity was mostly unrelated to the cortical discharges and could not be causing them. Despite the complete abolishment of thalamic activity with TTX (2, 3, and 4 mm from bregma), the neocortical discharges at ∼10 Hz were still present. The activity recorded at 5 mm posterior from bregma was not abolished by TTX, but this area did not show activity related to the neocortex before or after the TTX application. Based on the multi-electrode recordings, the thalamic area completely inactivated by TTX included all thalamic nuclei anterior to 4.5 mm (from bregma). In one additional experiment, the microdialysis probe containing TTX was moved posterior (5 mm from bregma) after infusing TTX in the anterior thalamic locations. This abolished all posterior thalamic activity and did not affect the neocortical discharges. In conclusion, the thalamus is not necessary for the generation of the ∼10 Hz discharges caused by neocortical disinhibition. Therefore, these discharges are of cortical origin.
Fig. 2.
Effect of thalamic inactivation on the activity induced by neocortical disinhibition. A, Examples showing simultaneous field potential and multi-unit activity recording in the neocortex (top) and thalamus (bottom) when the different drugs are being applied through the microdialysis probes placed in the neocortex and thalamus. First, ACSF is applied in the neocortex and in the thalamus. Second, ACSF is applied in the thalamus, and BMI is applied in the neocortex. Third, ACSF is applied in the thalamus, and BMI plus CGP35348 is applied in the neocortex. Finally, TTX is applied in the thalamus, and BMI plus CGP35348 is applied in the neocortex. Tracesare 5 sec long. Notice the difference in scale between the control trace (1 mV) and the following traces (3 mV) in neocortex. Neocortical recordings are from a site 1 mm in depth from the surface.B, Close-up of the multi-unit thalamic and field neocortical activity produced during an ∼10 Hz discharge caused by BMI plus CGP35348 in neocortex, before and after the application of TTX to the thalamus. C, Close-up of the field potential thalamic and neocortical activity produced during an ∼10 Hz discharge caused by BMI plus CGP35348 in neocortex.
Fig. 3.
Multiple recordings in the thalamus during inactivation with TTX. Simultaneous field potential and multi-unit recordings from the neocortex and from four sites in the thalamus (2, 3, 4, and 5 mm posterior from bregma; depth of 5.5 mm) before (left) and after (right) the application of TTX into the thalamus.
Laminar origin of the discharges within the neocortex
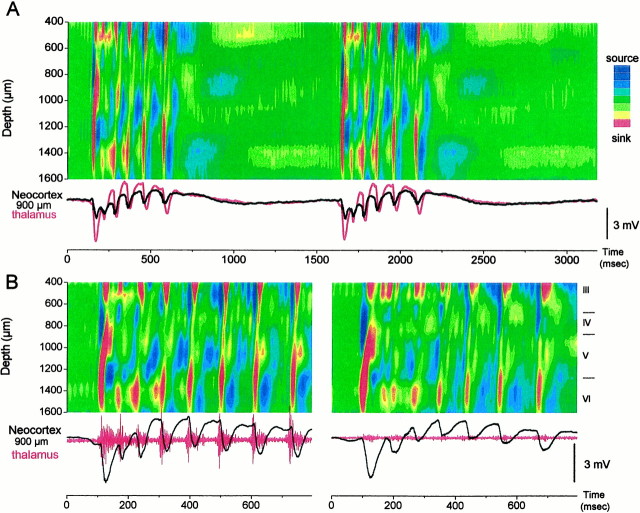
Because the discharges caused by neocortical disinhibition originate in the neocortex, the next question addressed from which layer(s) they begin. The 16 site linear array silicon probes record voltage through the depth of the neocortex and allows calculating CSDs that are displayed as color contour plots. This revealed the laminar current flow through the neocortex during the discharges generated by neocortical disinhibition. Figure 4 shows typical examples of CSD corresponding to the ∼1 Hz discharges induced by application of BMI into the neocortex. The first negative spike in the discharge had a current sink that usually originated in the lower layers (layer VI and lower layer V) with a corresponding current source around layer IV. This current sink propagated upward into upper layer V–IV, from which the sink spread to the upper layers (layer III–II) (Fig. 4A,B, right panel). In some cases, the sink corresponding to the first negative spike originated in the upper layers (layer III–II), from which it spread down to upper layer V–IV (Fig. 4B,left panel). From a total of 100 discharges selected randomly after BMI application, 76% originated in the lower layers (Fig. 4B, right panel) and 24% originated in the upper layers (Fig. 4B, left panel). The thalamic field potential response to discharges that originated in the upper layers had a larger latency because the current sink from the upper layers first spread to upper layer V and then to the thalamus (Fig. 4B). Regardless of the origin (upper or lower layers), the current sink from the first negative spike always propagated to the same location in the middle of the neocortex in upper layer V–IV (Fig. 4B). The current source corresponding to this sink in upper layer V–IV was in lower layer V. After the current sink reached upper layer V–IV, the following low-amplitude negative spikes produced a current flow that was indistinguishable despite the origin of the first negative spike. The low-amplitude negative spikes that ride on the positive wave correspond to a current sink in the lower layers (layer VI and lower layer V) that does not spread (or is less effective in spreading) to upper layer V–IV, jumping directly to layer IV and to layer III–II. Thus, the current flow was very different between the first negative spike and the following low-amplitude negative spikes in a discharge. The low-amplitude spikes display a current source in upper layer V–IV that spreads to layer III. This current source increases in amplitude with each low-amplitude negative spike until the discharge ends. Termination of the discharge coincided with a sequence of four current sources in the following layers: upper V–IV, layer III, layer VI–lower V, and layer IV (Fig. 4A).
Fig. 4.
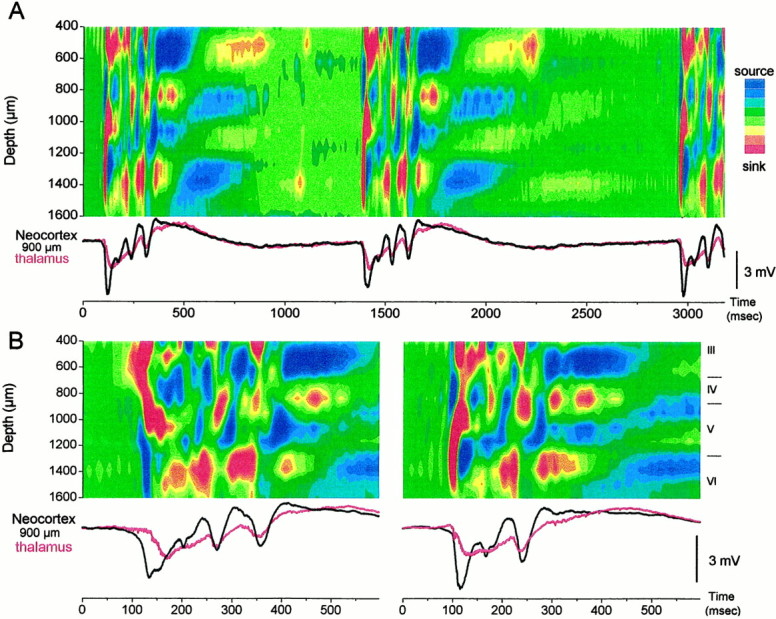
CSD of ∼1 Hz discharges induced by neocortical GABAA receptor block. A, CSD analysis displayed as a color contour plot corresponding to 3.18 sec of ∼1 Hz discharges in the neocortex, induced by neocortical BMI. Thebottom traces correspond to the field potential recorded in the neocortex at 900 μm from the surface (black) and in the thalamus (red). In the CSD contour plots shown, hot colors (red, yellow) represent current sinks, cool colors (blues) represent current sources, and greens are at approximately zero. CSDs were derived from the spontaneous activity without averaging.B, Close-up of CSD corresponding to the same conditions as in A for an ∼1 Hz discharge that began in the upper layers (left) and for an ∼1 Hz discharge that began in the lower layers (right). Notice the longer latency between the cortical field potential (black trace) and the thalamic response (red trace) in the left panel.
Figure 5A shows multi-unit activity recorded through the depth of the neocortex for a discharge that originated in the upper layers (left) and in the lower layers (right). Neuronal firing follows the direction of the current sink and spreads from the upper layers to the lower layers (left) and from the lower layers to the upper layers (right), respectively. When multi-unit activity recorded in the ventrolateral nucleus was related to these discharges (based onn = 25 upper layer and n = 25 lower layer discharges), it became noticeable that every discharge originating in the upper layers showed thalamic neuronal firing that preceded the discharge, whereas every discharge originating in the lower layers did not show thalamic firing preceding the discharge. Figure 5B shows CSDs derived from five averaged discharges originating in the upper layers (left) and in the lower layers (right), as well as the thalamic multi-unit activity recorded in the ventrolateral thalamus for each individual discharge. Note that thalamic activity precedes the upper layer sink (left), which spreads to layer V and then causes a large burst in the thalamus. The corticothalamic response (i.e., the thalamic response evoked by the neocortex) that follows the layer V sink is clearly reflected in the thalamic field potential recordings (Fig. 4). A similar corticothalamic response is also observed in the thalamus when the neocortical discharges originate in the lower layers. Moreover, discharges of upper layer origin were not found after inactivation of the thalamus with TTX (based on 100 discharges measured after thalamic TTX). As described above, ∼25% of the discharges are of upper layer origin when the thalamus is intact. In conclusion, although the thalamus does not generate either the lower layer or the upper layer discharges, thalamic activity triggers the discharges that originate in the upper layers. When the thalamus is inactivated, all of the discharges originated in the lower layers.
Fig. 5.
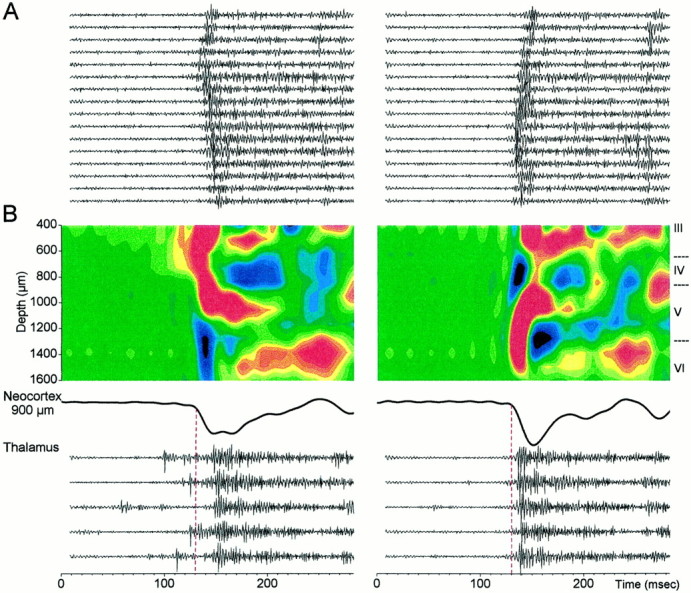
Multi-unit activity in thalamus and neocortex associated with discharges originating in the upper and lower layers.A, Neocortical multi-unit activity recorded through the 16-channel silicon probe during a discharge originating in the upper layers (left) and in the lower layers (right). The activity is from one of the discharges used to calculate the averaged CSD shown below. B,Top, Average of five discharges that originated in the upper layers (left) and in the lower layers (right) displayed as a CSD. Middle, Extracellular field potential recorded at 900 μm from the surface.Bottom, Thalamic multi-unit recordings corresponding to each discharge used to calculate the averaged CSD.
The ∼10 Hz oscillation is driven by the lower layers
Figure 6 shows typical examples of CSDs corresponding to the ∼10 Hz discharges induced by application of BMI plus CGP35348 into the neocortex. As with BMI alone, the first negative spike in the discharge usually originated in the lower layers (layer VI and lower layer V) with a sink that propagated upward into upper layer V–IV, from which the sink spread to the upper layers (layer III–II) (Figs. 4A,B,right panel, 5). The initial sink in layer VI–lower V had a corresponding source in upper layer V–IV, whereas the following sink in upper layer V–IV had a corresponding source in lower layer V. This pattern is similar to the pattern generated by BMI alone (Fig. 4). Clearly, the strong upper layer V–IV sink typical of the first negative spike does not participate in the expression of the low-amplitude spikes at ∼10 Hz. The low-amplitude negative spikes consisted of a sink in layer VI–lower V that did not spread or were less effective in spreading to upper layer V–IV. This was especially true for the initial spikes, which consisted of a small sink in layer VI followed by a sink in layer III. The corresponding source for the layer VI–lower V sink was in layer IV–III. This current source and its corresponding sink both increased with each low-amplitude negative spike until the discharge ceases. An additional current source that follows the layer VI–lower V sink in the same location increases with the discharge. This current source spreads from layer VI up to layer IV, and its increase seems to mark the end of the discharge. When the thalamus was inactivated with TTX, the discharges of upper layer origin were absent. During thalamic inactivation, the CSD of discharges originating in the lower layers was similar to those observed before TTX (Fig. 6B). The only difference was a slight reduction of sinks in layers VI–lower V and IV–III associated with the low-amplitude spikes. This is likely a consequence of a reduction in the feedback of thalamocortical activity to these layers.
Fig. 6.
CSD of ∼10 Hz discharges induced by neocortical GABAA and GABAB receptor block.A, CSD displayed as a color contour plot corresponding to 3.18 sec of ∼10 Hz discharges in the neocortex, induced by neocortical BMI and CGP35348. Plot characteristics are as in Figure 3.B, Close-up of CSD corresponding to the same conditions as in A for an ∼10 Hz discharge during application of ACSF in the thalamus (left) and during the application of TTX in the thalamus (right).
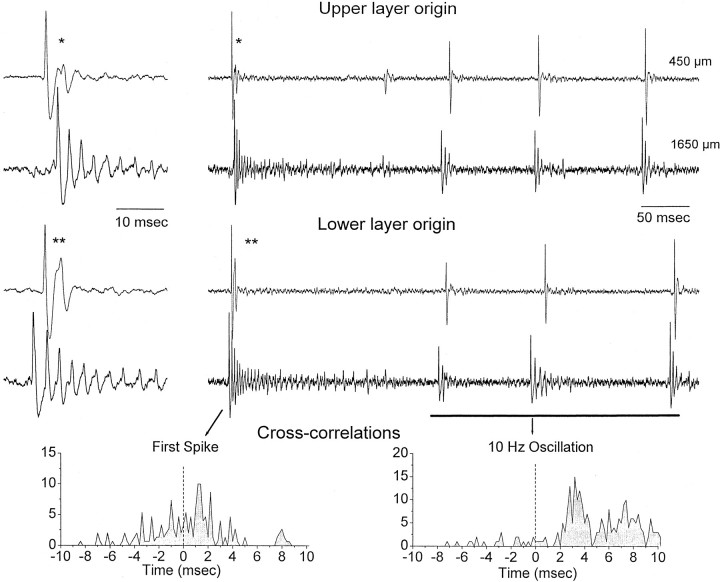
The CSDs showed that the initial large-amplitude spike in a discharge could originate in the upper or lower layers. However, based on the CSDs, the low-amplitude spikes that follow at ∼10 Hz seem to originate exclusively in the lower layers. Pairs (n = 12) of single neurons were recorded during cortical disinhibition at different depths in the neocortex (Fig.7) to test the origin of the low-amplitude spikes. A discharge measured at the single neuron level consisted of a strong burst of action potentials (corresponding to the first large-amplitude spike) that was followed by smaller bursts of attenuated action potentials producing the ∼10 Hz oscillation. Recordings from upper layer and lower layer pairs of neurons simultaneously revealed that, as shown above using CSD analysis, activity could originate in the upper layers and propagate to the lower layers or more commonly originate in the lower layers and propagate to the upper layers. This is shown in Figure 7 for two neurons recorded simultaneously in the upper layers (450 μm from the surface) and in the lower layers (1650 μm from the surface). Two different cross-correlations were performed between the lower layer and upper layer neuron. One cross-correlation considered only the first large-amplitude negative spike in a discharge (First Spike) and the other cross-correlation involved only the low-amplitude spikes in the discharge that form the ∼10 Hz oscillation (10 Hz Oscillation). This analysis revealed that, for the first spike in a discharge, the upper layer activity could precede or (more commonly) follow the lower layer activity (Fig. 7). However, the activity related to the following low-amplitude spikes that form the ∼10 Hz oscillation always originated in the lower layers and spread to the upper layers. Based on five pairs of neurons recorded in the upper and lower layers, I found that the upper layer neuron action potential lagged the lower layer neuron by 2.7 ± 0.17 msec (mean ± SD; n = 5) during the ∼10 Hz oscillation. In conclusion, the first large-amplitude spike in a discharge generated by neocortical disinhibition originates in either the lower layers or the upper layers (the ones that originate in the upper layers are triggered by thalamic activity). The low-amplitude negative spikes in a discharge that form the oscillation at ∼10 Hz are always generated in the lower layers (layer VI–lower V), from which they spread to the upper layers (layer III).
Fig. 7.
Dual single-unit recordings during discharges that originate in the upper layers or in the lower layers. One unit was recorded in the upper layers (450 μm from the surface), and a second unit was simultaneously recorded in the lower layers (1650 μm). Shown are two different discharges in which the first negative spike of the discharge originated in the upper layers (see right panel close-up, asterisk) or in the lower layers (two asterisks). Note that, during the first negative spike in a discharge, the first action potential may occur in the upper or in the lower layer neuron. However, during the 10 Hz oscillation, the first action potential always corresponds to the lower layer neuron. This is displayed in the cross-correlations shown below. The cross-correlations were derived between the lower layer and the upper layer neuron (i.e., the action potential from the lower layer neuron is at zero) for the first negative spike in a discharge (First Spike) or for the low-amplitude negative spikes that form the ∼10 Hz oscillation (10 Hz Oscillation).
There were several interesting observations derived from the CSDs. First, a current source develops and spreads with increasing effectiveness from the lower layers to the upper layers with every negative spike in a discharge. The increase in amplitude of this source coincides with the termination of the discharge. Second, only the first large-amplitude spike in a discharge shows a current sink that propagates from layer VI–lower V to layer V–IV. The following low-amplitude spikes do not propagate. Third, the interdischarge interval is characterized by a long-lasting current source that is followed by a long-lasting current sink in the lower layers. This sink precedes the initiation of the next discharge (Fig.6A). To help with the interpretation of the CSDs, intracellular recordings were performed in vivo.
Intracellular correlates of neocortical discharges
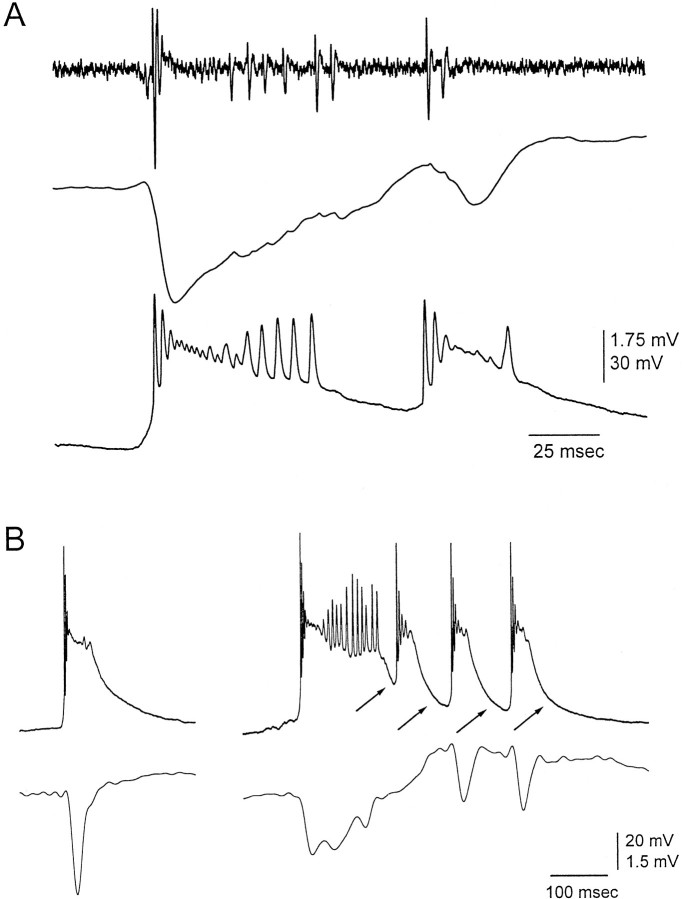
Intracellular recordings (n = 29) were performed in the neocortex adjacent to the microdialysis probe (within 1 mm). To relate the intracellular potentials to the extracellular potentials, an extracellular recording electrode was advanced adjacent to the intracellular electrode. Figure 8 shows typical examples of intracellularly recorded discharges. The first large-amplitude negative spike in a discharge corresponded to a large paroxysmal depolarizing shift (PDS). This explained why the action potentials from the single-unit recordings showed strong attenuation after the initial burst of action potentials (Fig.8A). The attenuation of the action potentials can be explained by the voltage-dependent inactivation of sodium channels caused by the strong depolarizing plateau of the PDS. The size of the PDS corresponded with the degree of disinhibition. The single spike events described extracellularly for low doses of BMI (Fig. 1) corresponded to a single and small PDS (Fig. 8B,left). In contrast, blocking GABAA and GABAB receptors produced longer lasting PDSs that were followed by short PDSs at ∼10 Hz (Fig. 8B,right). The current sinks associated with the negative spikes in a discharge reflect the strong inward current produced by the PDSs.
Fig. 8.
Intracellular recordings corresponding to discharges caused by neocortical disinhibition. A, Simultaneous single-unit and field potential recordings from an electrode at 1050 μm and intracellular recording from an adjacent electrode at the same depth during a single discharge caused by BMI application in the neocortex. The discharge corresponds to a PDS. Note the attenuation of the action potentials extracellularly and intracellularly. B, PDSs recorded during low doses of BMI (100 μm) and during application of BMI plus CPG35348 (800 and 10000 μm, respectively). Neurons were recorded at 1050 (left) and 1100 (left) μm. The extracellular field potential activity recorded from an electrode placed adjacent to the intracellular electrode is also shown. Note the repolarization of the membrane potential between each low-amplitude negative spike (arrows).
Intracellular recordings revealed that the current source that grows with each spike in the ∼10 Hz oscillation until the discharge stops corresponds to a hyperpolarizing potential that increases in amplitude with each of the PDS at ∼10 Hz (Fig. 8B,right, arrows). This hyperpolarizing potential serves to repolarize the membrane potential after each spike in the ∼10 Hz oscillation. The repolarization allows the production of a new PDS with each low-amplitude negative spike. The amplitude of the hyperpolarizing potential increases with each spike until the discharge stops. Thus, the current source that increases with each spike in the discharge reflects the repolarization of the membrane potential after each PDS. This suggests that an active conductance may contribute to the repolarization. Alternatively, the repolarization may result from the decay of the depolarizing event.
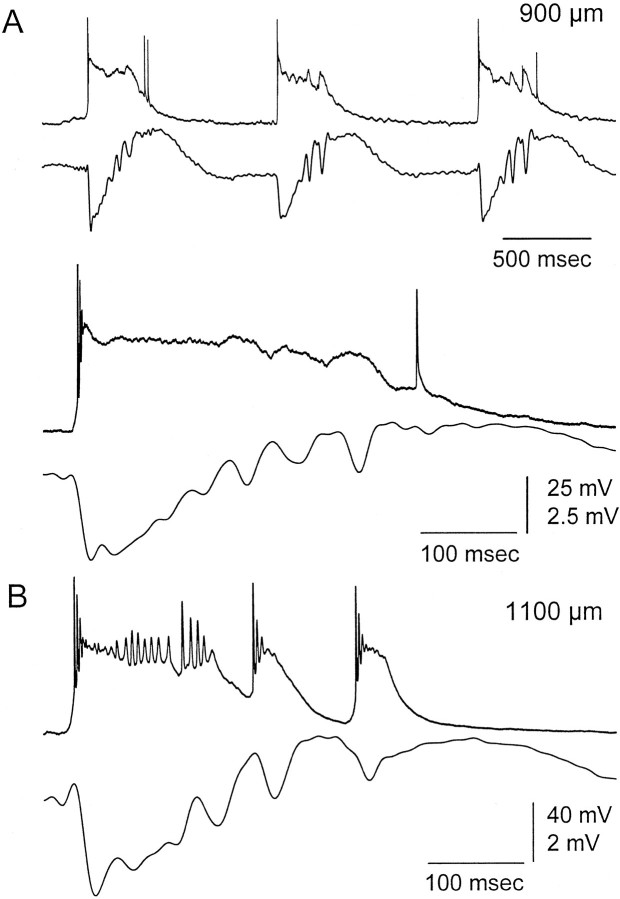
Intracellular recordings provided an interesting observation that may help to explain why the current sink from the first negative spike in a discharge propagates to upper layer V–IV, whereas the following spikes do not propagate. Recordings were obtained from presumed dendrites (n = 3) at 850–950 μm from the surface (Fig.9). These recording were presumed to be intradendritic because they displayed large, stable resting potentials and input resistances and low-amplitude action potentials (<50 mV). They were similar to intradendritic recordings obtained previously in vivo and in vitro (Pockberger, 1991; Amitai et al., 1993; Kim and Connors, 1993; Stuart and Sakmann, 1994; Castro-Alamancos and Connors, 1996b; Schiller et al., 1997). Figure 10A shows one of these recordings that differs from somatic recordings in the fact that the depolarizing paroxysmal shift was not repolarized after each low-amplitude negative spike of the ∼10 Hz oscillation. Instead, the membrane potential remained depolarized until the discharge ended. Dendritic depolarization could impede the backpropagation of somatic potentials (Spruston et al., 1995) and would be reflected in the CSD as a current sink only during the initial depolarizing phase. Interestingly, these recordings were only obtained at the same distance from the surface where the current sink from the first negative spike propagates (∼900 μm). For comparison, a somatic recording obtained minutes later deeper within the same penetration showed the typical repolarization during the ∼10 Hz spikes. Thus, it is possible that the failure of the spikes from the ∼10 Hz oscillation to propagate upward is attributable to the persistent depolarization of dendrites caused by the initial large negative spike.
Fig. 9.
Presumed dendritic impalements suggest that dendrites may not repolarize during an ∼10 Hz discharge.A, Simultaneous field potential and intracellular recordings obtained at 900 μm corresponding to a presumed dendritic impalement. A close-up is shown below. Note the limited repolarization after each low-amplitude negative spike.B, Simultaneous field potential (top) and intracellular (bottom) recordings obtained from the same penetration as in A but at 1150 μm, corresponding to a typical somatic recording during a discharge cause by disinhibition. Note the typical repolarization after each negative spike.
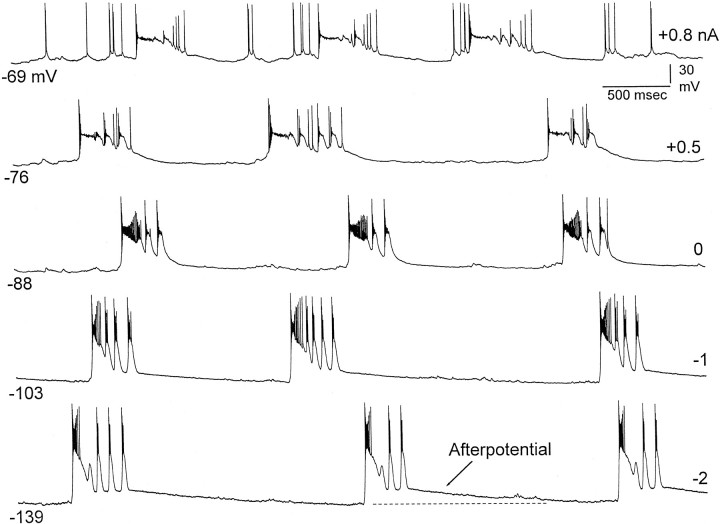
Fig. 10.
Intracellular recordings reveal an afterpotential during the early phase of the interdischarge interval and enhanced activity immediately before the next discharge. Intracellular recording at 1200 μm at different membrane potentials produced by current injection (see right). Note the afterpotential at hyperpolarized levels and the enhanced activity preceding the PDS at depolarized levels.
Intracellular recordings showed the behavior of neurons during the interdischarge interval (Fig. 10). The membrane potential during this interval revealed an afterpotential that followed each discharge. The afterpotential was enhanced at hyperpolarized membrane potentials. The afterpotential corresponds to the large current sources observed in the lower and middle layers immediately after each discharge (Fig. 6A). Interestingly, at depolarized levels, it became apparent that immediately before each PDS there was enhanced activity (Fig. 10, top panel, at +0.8 nA). This activity may correspond to the long-lasting current sink observed in the lower layers before each discharge (Fig.6A).
DISCUSSION
The results show that block of GABAAreceptors in neocortex transforms cortical slow-wave oscillations into large-amplitude ∼1 Hz discharges that consist of a large negative spike followed by a positive wave. With strong GABAA receptor block, the ∼1 Hz discharges contain one to three smaller amplitude negative spikes at ∼10 Hz that ride on the positive wave. Further block of GABABreceptors in neocortex increments the number of low-amplitude negative spikes to 5–15 and slows the discharges to ∼0.5 Hz, forming rhythmic ∼10 Hz (7–14 Hz) neocortical oscillations. Although the thalamus is strongly activated by these discharges, they are unaffected by thalamic inactivation using TTX, demonstrating that they are of cortical origin. Current source density analysis and single-unit recordings revealed that the discharges could originate in the upper or lower layers, but they always propagated to the same location in upper layer V–IV. This was true for the first negative spike in the discharge but not for the low-amplitude negative spikes that follow and form the ∼10 Hz oscillation. The low-amplitude negative spikes always originated in lower layer V–VI and did not spread to upper layer V–IV, jumping instead directly to the upper layers. The large-amplitude negative spikes that originate in the upper layers were triggered (but not generated) by the thalamus because these discharges were always preceded by thalamic activity, and thalamic inactivation eliminated them. Intracellular recordings provided an interpretation for the CSDs. First, the current sinks associated with each negative spike reflect the inward current of PDSs. Second, the current sources that increase in amplitude during the ∼10 Hz discharges and mark their termination correspond to the repolarization after each PDS in a discharge. Finally, the reason why only the first current sink in a discharge spreads to upper layer V–IV may be because of the lack of repolarization of dendrites after the initial large-amplitude negative spike in a discharge.
There are clear differences between the effects of disinhibition in the neocortex and in the thalamus. Application of BMI in the thalamus shifts slow-wave neocortical oscillations in the delta range or spindle oscillations to synchronized oscillations at 3 Hz (von Krosigk et al., 1993; Steriade and Contreras, 1998; Castro-Alamancos, 1999). In contrast, application of BMI in the neocortex does not shift the frequency range of delta activity. It simply enhances the amplitude of the slow-wave oscillations, giving rise to high-amplitude discharges at ∼1 Hz. Furthermore, whereas blockade of GABABreceptors in the thalamus abolishes the 3 Hz discharges generated by thalamic BMI, the same manipulation in the neocortex after BMI application results in an increase in the number of negative spikes in the discharge. This enhances the discharge duration and forms a recurring rhythmic oscillation at ∼10 Hz. GABABreceptor antagonists in neocortical slices also enhance paroxysmal discharges induced by BMI (Sutor and Luhmann, 1998).
Early studies in cats have shown that application of the GABAA receptor antagonist penicillin in neocortex results in the production of discharges consisting of a negative spike followed by a positive wave that recur continuously every 1–3 sec (Ralston, 1958; Matsumoto and Ajmone-Marsan, 1964a). This pattern agrees with the present results obtained in the rat using BMI. However, in cats, this continuous activity is interrupted by seizures that occur spontaneously or “helped” by local repetitive stimulation (Ralston, 1958; Matsumoto and Ajmone-Marsan, 1964b). It has been proposed that these seizures develop from rhythmical “afterdischarges” that follow some of the slowly recurring spike and wave discharges (Ralston, 1958). These afterdischarges are very similar to the ∼10 Hz oscillations observed in the present study after GABAA and GABAB receptor block. Recent work in the cat has further characterized these activities (Neckelmann et al., 1998, 2000; Steriade et al., 1998;Timofeev et al., 1998; Steriade and Amzica, 1999). As with the present results, the slow spike or polyspike wave complexes (2–3 Hz) and the fast runs (10–15 Hz) described in cats do not require the thalamus (Neckelmann et al., 1998; Steriade and Contreras, 1998; Steriade et al., 1998; Timofeev et al., 1998). Likely, the slow spike or polyspike wave complexes observed in cats are similar to the ∼1 Hz discharges described in the present study, whereas the fast runs observed in cats are similar to the ∼10 Hz discharges described in the present study.
Afterdischarges similar to those observed in the neocortex have been described and investigated in the hippocampus in vitro andin vivo (Hablitz, 1984; Miles et al., 1984; Lee and Hablitz, 1990; Traub et al., 1993a,b, 1996; Bragin et al., 1997a,b). Briefly, in the hippocampus, an afterdischarge originates in CA3 and consists of a long initial burst, with gradually subsiding depolarization, followed by a series of brief secondary bursts at 10–20 Hz (Hablitz, 1984;Miles et al., 1984) (for review, see Traub et al., 1996). The secondary bursts can originate from a different site of CA3 than the initial burst (Traub et al., 1993b). Moreover, secondary bursts in the hippocampus have been shown to originate from a prolonged synaptic current (mostly NMDA receptor-mediated) that evokes dendritic calcium spikes producing the secondary bursts (Traub et al., 1996). Accordingly, blockade of NMDA receptors in the hippocampus eliminates the secondary bursts, leaving intact the initial burst (Lee and Hablitz, 1990; Traub et al., 1993a).
Previous work in neocortical slices has shown that application of BMI produces nonrhythmic synchronized activity in adult neocortex (Gutnick et al., 1982; Connors, 1984). Spontaneous rhythmic discharges caused by disinhibition have been described in developing neocortical slices (Hablitz, 1987). Two major characteristics differentiate the activity generated in adult slices and in vivo. First, the activity in slices does not recur periodically and is normally triggered by orthodromic stimulation. In contrast, BMI in vivo produces discharges that recur approximately every second after the frequency of slow oscillations in the neocortex. This difference is perhaps a consequence of the fact that slow oscillations do not occur spontaneously in control slices. Second, disinhibition caused by picrotoxin, BMI, or BMI plus CGP35348 in adult neocortical slices induces nonrhythmic discharges (Connors, 1984; Hablitz, 1987; Sutor and Luhmann, 1998). This contrasts with the effects of disinhibitionin vivo, which produce strong rhythmic activity at 7–14 Hz (∼10 Hz discharges). Interestingly, the oscillations induced by low magnesium in neocortical slices (Silva et al., 1991) are very similar to those observed after disinhibition in vivo. Both consist of a large-amplitude negative spike followed by lower amplitude rhythmic negative spikes at 7–14 Hz that recur periodically (Flint et al., 1996). However, despite the similarities, they have clear mechanistic differences. First, the low-magnesium oscillations in slices depend completely on the activation of NMDA receptors (Silva et al., 1991; Flint et al., 1996), whereas the ones generated in vivo by disinhibition are mediated by non-NMDA receptors (Castro-Alamancos and Borrell, 1995). It is noteworthy that NMDA receptor activation may contribute to the expression of the ∼10 Hz discharges as shown in the disinhibited hippocampus (Lee and Hablitz, 1990; Traub et al., 1996), but this contribution may not be significantly expressed in vivo because of the use of the NMDA receptor antagonist ketamine in the anesthesia. Second, the low-magnesium oscillations induced in vitro require layer V for their occurrence, suggesting that they originate in this layer (Silva et al., 1991). In vivo, the discharges generated by disinhibition could originate in either the upper or lower layers, but they always spread to the same site in upper layer V–IV. This site coincides with the location that has been shown to have the lowest threshold for generating synchronized discharges in neocortical slices (Connors, 1984). However, in vivo the discharges did not begin in upper layer V–IV. Most commonly, they originated in layer VI–lower V and propagated to upper layer V–IV, but they could also originate in layer III. When they originated in the upper layers, thalamic neuronal activity always preceded the discharges, indicating that they were triggered by the thalamus. This was confirmed by the fact that thalamic inactivation abolished the discharges originating in the upper layers, making all discharges of lower layer origin.
Intracellular recordings revealed that, as previously described in the neocortex, with slices (Gutnick et al., 1982; Chagnac-Amitai and Connors, 1989) and in vivo (Neckelmann et al., 1998, 2000;Steriade et al., 1998; Timofeev et al., 1998; Steriade and Amzica, 1999), the discharges caused by disinhibition were associated with PDSs. Thus, the current sink for each negative spike reflected the inward current of a PDS. During the development of a discharge, there was an initial long-lasting PDS that was followed by smaller PDSs at ∼10 Hz. The occurrence of a PDS with each small-amplitude negative spike was possible because of the repolarization of the membrane potential after each negative spike. This repolarization was associated with the current sources that developed from the lower layers and follow each low-amplitude negative spike. The increase of the repolarization and of the current source marks the end of the discharge. After a discharge ended, it was followed by a long-lasting current source in several layers, and this corresponded intracellularly with an afterpotential that could be mediated by a potassium conductance because its amplitude increased below the reversal potential for potassium (Steriade and Amzica, 1999). The afterpotential was followed by enhanced activity immediately before the next discharge. The enhanced activity was apparent in neurons depolarized by current injection (Fig. 10), and it corresponded with a current sink in the lower layers.
Another interesting observation was that, although the initial current sink in a discharge always spreads to upper layer V–IV, the following current sinks associated with the low-amplitude negative spikes at ∼10 Hz always originated in layer VI–lower V and did not spread to upper layer V–IV, jumping directly to the upper layers. Why does this difference occur between the first and the following negative spikes in a discharge? There are several possible explanations. This could reflect the backpropagation of somatic potentials to the dendrites of layer VI and/or lower layer V pyramidal neurons (Stuart and Sakmann, 1994; Spruston et al., 1995; Johnston et al., 1996). The reason why the following current sinks associated with the ∼10 Hz discharge do not propagate may be attributable to the observation that presumed dendrites remained depolarized during the ∼10 Hz oscillation. The lack of a repolarizing potential in dendrites would impede the successive backpropagation of the PDSs at ∼10 Hz. Interestingly, differences in voltage-dependent conductances have been described between the soma and dendrites of pyramidal neurons (Magee and Johnston, 1995; Johnston et al., 1996, 2000). In particular, calcium-dependent potassium channels seem to be present exclusively in the soma of pyramidal neurons (Poolos and Johnston, 1999). This could explain the limited repolarization observed in presumed dendrites during the PDSs associated with the ∼10 Hz oscillations. Also, the lack of repolarization could be attributable to a differential distribution of prolonged synaptic currents, which would be absent in the soma. Alternatively, the lack of backpropagation may reflect the activity-dependent synaptic depression of vertical neocortical pathways. Dual-intracellular impalements from the soma and dendrites of pyramidal neurons in disinhibited slices could test these hypotheses.
Footnotes
This work was supported by the Medical Research Council of Canada, the Natural Sciences and Engineering Council of Canada, Fonds de la Reserche en Sante du Quebec, the Canadian Foundation for Innovation, and the Savoy Foundation. I thank Gyorgy Buzsaki, Barry Connors, and Mircea Steriade for helpful comments. I extend a special thanks to the Center for Neural Communication Technology (University of Michigan) and Jamie Hetke for providing the silicon probes. I also thank Novartis for providing CGP35348.
Correspondence should be addressed to Dr. Manuel Castro-Alamancos, Montreal Neurological Institute, 3801 University Street, Room WB210, Montreal, Quebec H3A 2B4, Canada. E-mail: mcastro@bic.mni.mcgill.ca.
REFERENCES
- 1.Amitai Y, Friedman A, Connors BW, Gutnick MJ. Regenerative activity in apical dendrites of pyramidal cells in neocortex. Cereb Cortex. 1993;3:26–38. doi: 10.1093/cercor/3.1.26. [DOI] [PubMed] [Google Scholar]
- 2.Bragin A, Penttonen M, Buzsaki G. Termination of epileptic afterdischarge. J Neurosci. 1997a;17:2567–2579. doi: 10.1523/JNEUROSCI.17-07-02567.1997. [DOI] [PMC free article] [PubMed] [Google Scholar]
- 3.Bragin A, Csicsvari J, Pettonen M, Buzsaki G. Epileptic afterdischarge in the hippocampo-entorhinal system: current-source density and unit studies. Neuroscience. 1997b;76:1187–1203. doi: 10.1016/s0306-4522(96)00446-0. [DOI] [PubMed] [Google Scholar]
- 4. Castro-Alamancos MA. Neocortical synchronized oscillations induced by thalamic disinhibition in vivo. J Neurosci 19 1999. RC27:1–7. [DOI] [PMC free article] [PubMed] [Google Scholar]
- 5.Castro-Alamancos MA, Borrell J. Contribution of NMDA and non-NMDA glutamate receptors to synchronized excitation and cortical output in the primary motor cortex of the rat. Brain Res Bull. 1995;37:539–543. doi: 10.1016/0361-9230(95)00059-n. [DOI] [PubMed] [Google Scholar]
- 6.Castro-Alamancos MA, Connors BW. Spatiotemporal properties of short-term plasticity in sensorimotor thalamocortical pathways of the rat. J Neurosci. 1996a;16:2767–2779. doi: 10.1523/JNEUROSCI.16-08-02767.1996. [DOI] [PMC free article] [PubMed] [Google Scholar]
- 7.Castro-Alamancos MA, Connors BW. Cellular mechanisms of the augmenting response: short-term plasticity in a thalamocortical pathway. J Neurosci. 1996b;16:7742–7756. doi: 10.1523/JNEUROSCI.16-23-07742.1996. [DOI] [PMC free article] [PubMed] [Google Scholar]
- 8.Chagnac-Amitai Y, Connors BW. Synchronized excitation and inhibition driven by intrinsically bursting neurons in neocortex. J Neurophysiol. 1989;62:1149–1162. doi: 10.1152/jn.1989.62.5.1149. [DOI] [PubMed] [Google Scholar]
- 9.Connors BW. Initiation of synchronized neuronal bursting in neocortex. Nature. 1984;319:685–687. doi: 10.1038/310685a0. [DOI] [PubMed] [Google Scholar]
- 10.Flint AC, Connors BW. Two types of network oscillations in neocortex mediated by distinct glutamate receptor subtypes and neuronal populations. J Neurophysiol. 1996;75:951–957. doi: 10.1152/jn.1996.75.2.951. [DOI] [PubMed] [Google Scholar]
- 11.Gloor P, Quesney LF, Zumstein H. Pathophysiology of generalized penicillin epilepsy in the cat: the role of cortical and subcortical structures. II. Topical application of penicillin to the cerebral cortex and to subcortical structures. Electroencephalogr Clin Neurophysiol. 1977;43:79–94. doi: 10.1016/0013-4694(77)90198-5. [DOI] [PubMed] [Google Scholar]
- 12.Gutnick MJ, Connors BW, Prince DA. Mechanisms of neocortical epileptogenesis in vitro. J Neurophysiol. 1982;48:1321–1335. doi: 10.1152/jn.1982.48.6.1321. [DOI] [PubMed] [Google Scholar]
- 13.Hablitz JJ. Picrotoxin-induced epileptiform activity in the hippocampus: role of endogenous versus synaptic factors. J Neurophysiol. 1984;51:1011–1027. doi: 10.1152/jn.1984.51.5.1011. [DOI] [PubMed] [Google Scholar]
- 14.Hablitz JJ. Spontaneous ictal-like discharges and sustained potential shifts in the developing rat neocortex. J Neurophysiol. 1987;58:1052–1065. doi: 10.1152/jn.1987.58.5.1052. [DOI] [PubMed] [Google Scholar]
- 15.Johnston D, Magee JC, Colbert CM, Cristie BR. Active properties of neuronal dendrites. Annu Rev Neurosci. 1996;19:165–186. doi: 10.1146/annurev.ne.19.030196.001121. [DOI] [PubMed] [Google Scholar]
- 16.Johnston D, Hoffman DA, Magee JC, Poolos NP, Watanabe S, Colbert CM, Migliore M. Dendritic potassium channels in hippocampal pyramidal neurons. J Physiol (Lond) 2000;525:75–81. doi: 10.1111/j.1469-7793.2000.00075.x. [DOI] [PMC free article] [PubMed] [Google Scholar]
- 17.Kim HG, Connors BW. Apical dendrites of the neocortex: correlation between sodium and calcium-dependent spiking and pyramidal cell morphology. J Neurosci. 1993;13:5301–5311. doi: 10.1523/JNEUROSCI.13-12-05301.1993. [DOI] [PMC free article] [PubMed] [Google Scholar]
- 18.Lee W-L, Hablitz JJ. Effect of APV and ketamine on epileptiform activity in the CA1 and CA3 regions of the hippocampus. Epilepsy Res. 1990;6:87–94. doi: 10.1016/0920-1211(90)90082-7. [DOI] [PubMed] [Google Scholar]
- 19.Magee JC, Johnston D. Characterization of single voltage-gated Na+ and Ca2+ channels in apical dendrites of rat CA1 pyramidal neurons. J Physiol (Lond) 1995;487:67–90. doi: 10.1113/jphysiol.1995.sp020862. [DOI] [PMC free article] [PubMed] [Google Scholar]
- 20.Matsumoto H, Ajmone-Marsan C. Cortical cellular phenomena in experimental epilepsy: interictal manifestations. Exp Neurol. 1964a;9:286–304. doi: 10.1016/0014-4886(64)90025-1. [DOI] [PubMed] [Google Scholar]
- 21.Matsumoto H, Ajmone-Marsan C. Cortical cellular phenomena in experimental epilepsy: ictal manifestations. Exp Neurol. 1964b;9:305–326. doi: 10.1016/0014-4886(64)90026-3. [DOI] [PubMed] [Google Scholar]
- 22.McNamara JO. Cellular and molecular basis of epilepsy. J Neurosci. 1994;14:3413–3425. doi: 10.1523/JNEUROSCI.14-06-03413.1994. [DOI] [PMC free article] [PubMed] [Google Scholar]
- 23.Miles R, Wong RKS, Traub RD. Synchronized afterdischarges in the hippocampus: contribution of local synaptic interactions. Neuroscience. 1984;12:1179–1189. doi: 10.1016/0306-4522(84)90012-5. [DOI] [PubMed] [Google Scholar]
- 24.Neckelmann D, Amzica F, Steriade M. Spike-wave complexes and fast components of cortically generated seizures. III. Synchronizing mechanisms. J Neurophysiol. 1998;80:1480–1494. doi: 10.1152/jn.1998.80.3.1480. [DOI] [PubMed] [Google Scholar]
- 25.Neckelmann D, Amzica F, Steriade M. Changes in neuronal conductance during different components of cortically generated spike-wave seizures. Neuroscience. 2000;96:475–485. doi: 10.1016/s0306-4522(99)00571-0. [DOI] [PubMed] [Google Scholar]
- 26.Paxinos G, Watson C. The rat brain in stereotaxic coordinates. Academic; New York: 1982. [DOI] [PubMed] [Google Scholar]
- 27.Pockberger H. Electrophysiological and morphological properties of rat motor cortex neurons in vivo. Brain Res. 1991;539:181–190. doi: 10.1016/0006-8993(91)91619-c. [DOI] [PubMed] [Google Scholar]
- 28.Poolos NP, Johnston D. Calcium-activated potassium conductances contribute to action potential repolarization at the soma but not the dendrites of hippocampal CA1 pyramidal neurons. J Neurosci. 1999;19:5205–5212. doi: 10.1523/JNEUROSCI.19-13-05205.1999. [DOI] [PMC free article] [PubMed] [Google Scholar]
- 29.Ralston BL. The mechanism of transition of interictal spiking foci into ictal seizure discharges. Electroencephalogr Clin Neurophysiol. 1958;10:217–232. doi: 10.1016/0013-4694(58)90029-4. [DOI] [PubMed] [Google Scholar]
- 30.Rougeul-Buser A, Buser P. Rhythms in the alpha band in cats and their behavioural correlates. Int J Psychophysiol. 1997;26:191–203. doi: 10.1016/s0167-8760(97)00764-2. [DOI] [PubMed] [Google Scholar]
- 31.Schiller J, Schiller Y, Stuart G, Sakmann B. Calcium action potentials restricted to distal apical dendrites of rat neocortical pyramidal neurons. J Physiol (Lond) 1997;505:605–616. doi: 10.1111/j.1469-7793.1997.605ba.x. [DOI] [PMC free article] [PubMed] [Google Scholar]
- 32.Schwartzkroin PA. Epilepsy. Models, mechanisms and concepts. Cambridge UP; Cambridge, MA: 1993. [Google Scholar]
- 33.Silva LR, Amitai Y, Connors BW. Intrinsic oscillations of neocortex generated by layer 5 pyramidal neurons. Science. 1991;251:432–435. doi: 10.1126/science.1824881. [DOI] [PubMed] [Google Scholar]
- 34.Singer W. Synchronization of cortical activity and its putative role in information processing and learning. Annu Rev Physiol. 1993;55:349–374. doi: 10.1146/annurev.ph.55.030193.002025. [DOI] [PubMed] [Google Scholar]
- 35.Spruston N, Schiller Y, Stuart G, Sakmann B. Activity-dependent action potential invasion and calcium influx into hippocampal CA1 dendrites. Science. 1995;268:297–300. doi: 10.1126/science.7716524. [DOI] [PubMed] [Google Scholar]
- 36.Steriade M, Amzica F. Intracellular study of excitability in the seizure-prone neocortex in vivo. J Neurophysiol. 1999;82:3108–3122. doi: 10.1152/jn.1999.82.6.3108. [DOI] [PubMed] [Google Scholar]
- 37.Steriade M, Contreras D. Spike-wave complexes and fast components of cortically generated seizures. I. Role of neocortex and thalamus. J Neurophysiol. 1998;80:1439–1455. doi: 10.1152/jn.1998.80.3.1439. [DOI] [PubMed] [Google Scholar]
- 38.Steriade M, Nunez A, Amzica F. A novel slow (<1 Hz) oscillation of neocortical neurons in vivo: depolarizing and hyperpolarizing components. J Neurosci. 1993;13:3252–3265. doi: 10.1523/JNEUROSCI.13-08-03252.1993. [DOI] [PMC free article] [PubMed] [Google Scholar]
- 39.Steriade M, Jones EG, McCormick DA. Thalamus, Vol 1. Elsevier; New York: 1997. [Google Scholar]
- 40.Steriade M, Amzica F, Neckelmann D, Timofeev I. Spike-wave complexes and fast components of cortically generated seizures. II. Extra- and intracellular patterns. J Neurophysiol. 1998;80:1456–1479. doi: 10.1152/jn.1998.80.3.1456. [DOI] [PubMed] [Google Scholar]
- 41.Stuart GJ, Sakmann B. Active propagation of somatic action potentials into neocortical pyramidal cell dendrites. Nature. 1994;367:69–72. doi: 10.1038/367069a0. [DOI] [PubMed] [Google Scholar]
- 42.Sutor B, Luhmann HJ. Involvement of GABA(B) receptors in convulsant induced epileptiform activity in rat neocortex in vitro. Eur J Neurosci. 1998;10:3417–3427. doi: 10.1046/j.1460-9568.1998.00351.x. [DOI] [PubMed] [Google Scholar]
- 43.Sutor B, Hablitz JJ, Rucker F, Bruggencate G. Spread of epileptiform activity in the immature rat neocortex studied with voltage-sensitive dyes and laser scanning microscopy. J Neurophysiol. 1994;72:1756–1768. doi: 10.1152/jn.1994.72.4.1756. [DOI] [PubMed] [Google Scholar]
- 44.Timofeev I, Grenier F, Steriade M. Spike-wave complexes and fast components of cortically generated seizures. IV. Paroxysmal fast runs in cortical and thalamic neurons. J Neurophysiol. 1998;80:1495–1513. doi: 10.1152/jn.1998.80.3.1495. [DOI] [PubMed] [Google Scholar]
- 45.Traub RD, Borck C, Colling SG, Jefferys JGR. On the structure of ictal events in vitro. Epilepsia. 1996;37:879–891. doi: 10.1111/j.1528-1157.1996.tb00042.x. [DOI] [PubMed] [Google Scholar]
- 46.Traub RD, Miles R, Jefferys JGR. Synaptic and intrinsic conductances shape picrotoxin-induced synchronized after-discharges in the guinea-pig hippocampal slice. J Physiol (Lond) 1993a;461:525–547. doi: 10.1113/jphysiol.1993.sp019527. [DOI] [PMC free article] [PubMed] [Google Scholar]
- 47.Traub RD, Jefferys JGR, Miles R. Analysis of the propagation of disinhibition-induced after-discharges along the guinea-pig hippocampal slice in vitro. J Physiol (Lond) 1993b;472:267–287. doi: 10.1113/jphysiol.1993.sp019946. [DOI] [PMC free article] [PubMed] [Google Scholar]
- 48.Tsau Y, Guan L, Wu JY. Epileptiform activity can be initiated in various neocortical layers: an optical imaging study. J Neurophysiol. 1999;82:1965–1973. doi: 10.1152/jn.1999.82.4.1965. [DOI] [PubMed] [Google Scholar]
- 49.von Krosigk M, Bal T, McCormick DA. Cellular mechanisms of a synchronized oscillation in the thalamus. Science. 1993;261:361–364. doi: 10.1126/science.8392750. [DOI] [PubMed] [Google Scholar]


