Abstract
Individual differences in responding to a novel environment predict behavioral and neurochemical responses to psychostimulant drugs. Rats with a high locomotor response to a novel environment (HRs) exhibit enhanced self-administration (SA) behavior, sensitization, and basal or drug-induced dopamine release in the nucleus accumbens compared with rats with a low response to the novel context (LRs). In this study, we determined whether such differences in vulnerability to drug addiction might be related to differences in dopamine (DA) neuron activity. Rats were divided into HRs and LRs according to their response to a novel environment and then tested for acquisition of cocaine SA. HRs rapidly acquired cocaine SA (175 μg/kg per infusion), whereas LRs did not. Differences in cocaine SA were not caused by differences in exploratory behavior or sampling because these behaviors did not differ in HRs and LRs self-administering a saline solution. In a separate experiment, we used extracellular single-unit recordings and found that HRs exhibit higher basal firing rates and bursting activity of DA neurons in the ventral tegmental area and, to a lesser extent, in the substantia nigra pars compacta. The greater activity of midbrain DA cells in HRs was accompanied by reduced sensitivity to the inhibitory effects of a DA D2-class receptor agonist, indicating possible subsensitivity of impulse-regulating DA autoreceptors. These results demonstrate that differences in the basal activity of DA neurons may be critically involved in determining individual vulnerability to drugs of abuse.
Keywords: cocaine self-administration, dopamine, electrophysiology, ventral tegmental area, substantia nigra, individual vulnerability, drug addiction
There is considerable individual variation in sensitivity to the reinforcing effects of addictive drugs in both humans and animals (de Wit et al., 1986; O'Brien et al., 1986). For example, the amount and pattern of drug intake vary across individuals; whereas some subjects more easily acquire drug self-administration (SA) and develop drug addiction, others are more resistant. Elucidating the mechanisms responsible for these differences in drug sensitivity may provide important information for understanding determinants of drug addiction.
In both humans and animals, the individual propensity to develop drug intake can be predicted by drug-independent behavior, such as the level of motor activity during a stressful situation. In humans, children with heightened motor activity during concentration tasks have greater addiction liability compared with children with lower motor activities (Moss et al., 1992). In rats, high levels of locomotor activity in a novel environment predict greater probability to acquire and maintain psychostimulant SA (Piazza et al., 1989; Deroche et al., 1995; Grimm and See, 1997; Pierre and Vezina, 1997). Locomotor response to a novel context also predicts other behavioral responses to psychostimulants. For example, high responders (HRs) show more locomotor activation in response to psychostimulants (Piazza et al., 1990; Hooks et al., 1991a,b; Exner and Clark, 1993), develop stronger contextual conditioning to drugs (Jodogne et al., 1994), and develop behavioral sensitization more readily than do low responders (LRs) (Hooks et al., 1991a, 1992b; Pierre and Vezina, 1997).
Research on the biological substrates underlying individual vulnerability to drug addiction has focused on midbrain dopamine (DA) neurons originating in the ventral tegmental area (VTA) and substantia nigra pars compacta (SNc) and projecting primarily to the nucleus accumbens (NAc), prefrontal cortex (PFC), and dorsal striatum. The mesoaccumbens pathway and, to some extent, the nigrostriatal pathway are considered the main systems mediating the reinforcing and psychomotor-stimulant effects of drugs of abuse (for review, seeRobinson and Berridge, 1993; Robbins and Everitt, 1996; White and Kalivas, 1998; Koob, 1998; Wise, 1998). Using the HR/LR model of individual vulnerability to drugs, different laboratories have shown that increased vulnerability is associated with increased basal and stimulated DA levels in the NAc and striatum (Bradberry et al., 1991;Hooks et al., 1991b, 1992a; Piazza et al., 1991; Rougé-Pont et al., 1993, 1998). Surprisingly, no studies have attempted to determine the functional origins of these differences.
In this study, we determined whether differences in DA neuron activity of HRs and LRs could underlie individual differences in vulnerability to drug addiction. Animals were screened for their response to a novel environment and designated either HRs or LRs. We then tested the two groups for acquisition of cocaine SA; in a separate experiment, we examined the impulse activity of midbrain DA neurons of HRs and LRs using in vivo single-unit extracellular recordings. We evaluated the basal firing rate and bursting activity of VTA and SNc DA cells, as well as the response of these neurons to DA D2 autoreceptor stimulation. We report that HR rats show increased cocaine self-administration and have elevated impulse activity of midbrain DA cells compared with LR rats.
MATERIALS AND METHODS
Subjects. Male Sprague Dawley rats (Harlan Sprague Dawley, Indianapolis, IN) weighing 280–320 gm at the time of the experiments were used in all studies. A 12/12 hr dark/light cycle (lights on at 7:00 A.M.) was maintained in the animal room, and temperature (22°C) and humidity (66%) were kept constant. Animals were housed individually with food and water available ad libitum. They were allowed at least 1 week to acclimate to the animal room before the experiments were started.
Response to a novel environment. Rats were screened for locomotor responses to a novel environment over a period of 2 hr (from 2:00 to 4:00 P.M.) in a novel behavioral-testing facility. The novel context consisted of a shoe box-type cage (50 × 30 × 25 cm;n = 12) physically similar to the home cage. Three photoelectric beams placed equidistant along the long axis of the cage (PAS monitoring system; San Diego Instruments, San Diego, CA) allowed us to determine ambulations (defined as breaks of consecutive beams). Rats with locomotor scores above the sample median were defined as HRs, whereas those below were designated LRs.
Catheter implantation. One day after the novelty test, rats were anesthetized with a ketamine and xylazine solution (65 and 20 mg/kg, respectively, in a 1 ml/kg volume). A SILASTIC catheter (10 μl dead volume) was inserted in the right auricle through the external jugular vein, passed under the skin, and fixed in the midscapular region. After surgery, all rats received an infusion of the antibiotic gentamycin (2 mg/kg, i.v.) for 3 consecutive days. Thereafter, catheters were flushed daily with a sterile solution of heparin (100 μl; 10 IU) to prevent clogging.
Intravenous self-administration. One week after surgery, animals were tested for the acquisition of cocaine (175 μg/kg per infusion) or saline SA over 7 d. Rats were submitted to daily 1 hr SA sessions between 3:00 and 6:00 P.M. Before the start of each session, the catheter was flushed with 50 μl of 0.9% NaCl, and its external end was connected to a pump-driven syringe. No priming infusions were given at any time. The SA cage (41 × 24 cm floor area; 26 cm high; MED Associates, St. Albans, VT) was equipped with two holes located 2 cm above the floor and placed on one of the 24-cm-wide sides. Nose poking in one of the holes (designated active) resulted in a 30 μl infusion of the cocaine or saline solution over a period of 3 sec. Subsequent nose pokes during the infusion period were recorded but had no effect. In addition to delivering cocaine, nose poking in the active hole illuminated the active hole for the duration of the drug infusion (i.e., 3 sec). Nose pokes in the other hole (designated inactive) were without consequence. The number of nose pokes in both holes and the number of infusions were recorded throughout the experiments by commercially available software (MED Associates Instrumentation Software for Research, St. Albans, VT). Animals were considered to perform active SA when the number of nose pokes in the active hole was significantly higher than the number of nose pokes in the inactive one (95% confidence limit). Catheter patency was confirmed the last day of the experiment by delivering 200 μl of the ketamine and xylazine solution through the catheters; rats that did not succumb to the anesthetic within 5 sec were eliminated from the study. Catheter failure and anesthesia overdosing reduced the number of animals to five LRs and five HRs in each SA experiment.
Extracellular single-unit recording. Methods for extracellular recording were similar to those reported previously (Henry et al., 1989). Two to 10 d after the novelty screen, rats were anesthetized with chloral hydrate (400 mg/kg, i.p.) and mounted in a stereotaxic apparatus (Activational Systems, Warren, MI) with the incisor bar set 3.3 mm below the interaural line. A lateral tail vein was catheterized with a 25 gauge hypodermic needle to administer additional anesthetic or drugs (as required). Body temperature was monitored by a rectal thermometer (Poly Medica Healthcare, Golden, CO) and maintained at 36.5–37.0°C with a thermostatically controlled heating pad (Fintronics, Orange, CT). A burr hole was drilled in the skull, and the dura matter was retracted from the area overlying the VTA or SNc. A glass electrode was pulled from 2.0- or 1.5-mm-outer-diameter glass tubing with a vertical electrode puller (Narishige PE-2, Tokyo, Japan), broken back under a microscope to a tip diameter of 1–2 μm, and filled with a 2 m NaCl solution saturated with 1% fast green dye (Fisher Scientific, Houston, TX). The electrode was lowered to 2 mm above the VTA or SNc and then slowly advanced with a hydraulic microdrive (David Kopf Instruments, Tujunga, CA) to the DA cell region. The coordinates for the VTA were 3.0–3.8 mm anterior to lambda, 0.3–0.7 mm lateral from the midline, and 7.5–8.5 mm ventral from the cortical surface. Coordinates for the SNc were 3.4–3.8 mm anterior to lambda, 1.8–2.4 mm lateral from the midline, and 7.0–8.0 mm ventral from the cortical surface (Paxinos and Watson, 1986). In vitro impedance of the electrodes was 1.5–2.1 MΩ, measured at 135 Hz (Winston Electronics BL1000-B, San Francisco, CA).
During extracellular recording, electrical signals were fed into a high-impedance amplifier (Fintronics), filtered at 400 and 500 Hz, displayed on an oscilloscope (Tektronix R5110, Chicago, IL), and monitored by a window discriminator and an audioamplifier (Grass AM8, Quincy, MA). The analog output of the window discriminator was connected to a polygraph recorder (Gould 220, Chicago, IL) that plotted rate histograms and to a printer (DPP-Q7A1; Datel, Mansfield, MA) that printed firing rates. In some experiments, digital outputs were led through an interface (Digidata 1200 series; Axon Instruments, Foster City, CA) to a 586 personal computer running AxoScope software (Axon Instruments) that determined firing activity on-line and stored all data for future analysis. Stored data were then analyzed with a custom-made program that determined firing and bursting activity (percentage of spikes emitted in bursts, burst events, and spikes per burst).
DA cells were identified by anatomical location in the VTA or SNc and according to standard physiological criteria (Bunney et al., 1973;Wang, 1981a; Grace and Bunney, 1983, 1984a,b; White, 1996). These neurons had (1) a characteristic triphasic (+/−/+) waveform with a long action potential of 2.5–3.5 msec, (2) low spontaneous firing rates of 0.5–10 Hz, and (3) either a slow irregular firing pattern or a slow bursting pattern with decreasing spike amplitude and increasing interspike interval within the burst.
Firing rate and bursting activity. Neuronal activity of VTA and SNc DA neurons was determined on three to four cells per rat (no more than six cells). Cells were recorded between 3 and 5 min to establish a mean baseline firing rate. Only cells with stable activity over at least 3 min (<3% variation) were included in the study. In some experiments, we also recorded the bursting activity of the cells. Bursting activity was plotted as the percentage of spikes emitted in bursts. Burst events were initiated by a pair of spikes having an interspike interval ≤80 msec and terminated by interspike intervals ≥160 msec (Grace and Bunney, 1983, 1984b). Usually, the cells displayed several two-spike bursts and a smaller proportion of three or more spikes per burst (for examples of bursting and nonbursting activity, see Figs. 6c, 10c). Cells were classified as “burst-firing cells” if, in addition to exhibiting two-spike bursts, they also exhibited at least two three-spike bursts (two “triplets”) during 500 consecutive spikes (Grace and Bunney, 1984b). To study the impulse activity of the entire cell population of HR and LR rats, data were analyzed and graphed for the entire cell population. Impulse activity in burst-firing versus nonburst-firing cells was analyzed separately (see Table 1).
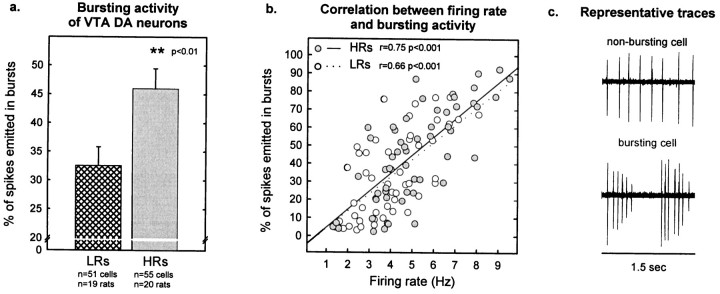
Fig. 6.
Bursting activity in VTA DA cells.a, HRs exhibited a higher percentage of spikes emitted in bursts compared with LRs (t104 = −2.79; p < 0.01). Each vertical bar represents the mean ± SEM of each group.b, The scatter plot illustrates the relationship between firing rate and bursting activity. There was a similar positive correlation between these two variables in both groups of animals (for LRs, r = 0.66; p < 0.001; for HRs, r = 0.75; p < 0.001; comparison of the regression slopes between the two groups,p > 0.4). Each point represents an individual cell. Empty circles depict cells from LRs;filled circles are cells from HRs. c, Representative traces of a nonbursting or bursting DA cell are shown.
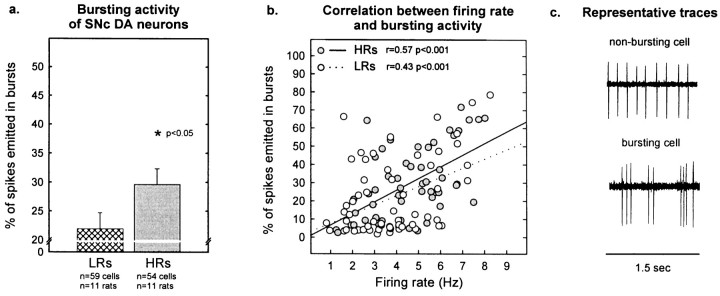
Fig. 10.
Bursting activity in SNc DA cells.a, HRs exhibited a slightly, but significantly, higher percentage of spikes emitted in bursting mode compared with LRs (t111 = −2.00; p< 0.05). Each vertical bar represents the mean ± SEM of each group. b, The scatter plot illustrates the relationship between firing rate and bursting activity. Both HRs and LRs displayed a similar positive correlation between these two factors (for LRs, r = 0.43; p < 0.001; for HRs, r = 0.57; p < 0.001; comparison of the regression slopes between the two groups,p > 0.3). Each point represents an individual cell. Empty circles depict cells from LRs;filled circles are cells from HRs. c, Representative traces of a nonbursting or bursting DA cell are shown.
Table 1.
Impulse activity of VTA and SNc DA cells when the cells were divided into burst-firing cells (cells that in addition to several two-spike bursts also displayed at least two triplets during 500 consecutive spikes) versus nonburst-firing cells
| Cells | VTA LR | VTA HR | SNc LR | SNc HR |
|---|---|---|---|---|
| Burst-firing cells | ||||
| n | 45 | 50 | 39 | 43 |
| % of total population | 88.24% | 90.91% | 66.10% | 79.63% |
| Firing rate (Hz) | 4.25 ± 0.22 | 5.39 ± 0.251-168 | 4.43 ± 0.29 | 4.94 ± 0.25 |
| Bursting activity | 35.54 ± 3.39% | 50.11 ± 3.31%1-165 | 30.31 ± 3.43% | 35.15 ± 2.73% |
| Burst events/10 sec | 5.51 ± 0.58 | 8.28 ± 0.621-160 | 5.07 ± 0.68 | 6.41 ± 0.57 |
| Burst size | 2.82 ± 0.08 | 3.28 ± 0.14* | 2.56 ± 0.08 | 2.74 ± 0.13 |
| Nonburst-firing cells | ||||
| n | 6 | 5 | 20 | 11 |
| % of total population | 11.76% | 9.09% | 33.90% | 20.37% |
| Firing rate (Hz) | 1.86 ± 0.15 | 2.25 ± 0.50 | 2.64 ± 0.25 | 3.13 ± 0.45 |
| Bursting activity | 10.25 ± 5.51% | 4.58 ± 0.76% | 5.67 ± 0.82% | 8.10 ± 0.02% |
| Burst events/10 sec | 0.96 ± 0.54 | 0.45 ± 0.07 | 0.67 ± 0.08 | 1.54 ± 0.68 |
| Burst size | 2.01 ± 0.01 | 2.04 ± 0.03 | 2.04 ± 0.01 | 2.03 ± 0.01 |
For both the VTA and the SNc, the proportion of burst-firing cells versus nonburst-firing cells was greater in both HRs and LRs. In burst-firing cells of the VTA, HRs showed a similar percentage of burst-firing cells (t93 = −0.43;p > 0.67) but increased firing rate, bursting activity, burst events, and burst size compared with LRs (t93 = −3.39,t93 = −3.07,t93 = −3.23,t93 = −2.66;
F1-168: p < 0.001,
F1-165: p < 0.003,
F1-160: p < 0.002,
p < 0.01, respectively). It is difficult to determine whether there were any HR or LR differences in nonburst-firing cells of the VTA, because the number of cells in this cell population was very low for both groups of rats (t9 = 0.14,t9 = −0.8, t9= 0.92, t9 = 0.85,t9 = −1.10; p > 0.14,p > 0.44, p > 0.38, p > 0.41,p > 0.29, for the percentage of nonburst-firing cells, firing rate, bursting activity, burst events, and burst size, respectively). In the SNc, there were no differences between HRs and LRs either in the burst-firing or the nonburst-firing cell population for each of the variables studied (burst-firing cells,t80 = −1.38,t80 = −1.35,t80 = −1.11,t80 = −1.51,t80 = −1.14; p > 0.17,p > 0.18, p > 0.26, p > 0.13,p > 0.25; nonburst-firing cells,t29 = 0.79, t29= −1.04, t29 = −1.19,t29 = −1.71,t29 = 0.71; p > 0.43,p > 0.31, p > 0.24, p > 0.10,p > 0.45, for percent of cells, firing rate, bursting activity, burst events, and burst size, respectively).
Autoreceptor-mediated inhibition. The response of DA neurons to intravenous administration of the D2-class receptor agonist quinpirole was used as a measure of autoreceptor sensitivity (for review, see White, 1996). After 3 min of stable basal firing, quinpirole was administered through the catheterized tail vein using a cumulative dosing regimen in which each dose doubled the previous one at 60–90 sec intervals. The D2-class receptor antagonist eticlopride (0.1 mg/kg, i.v.) was administered to reverse agonist-induced inhibition. Only one cell was recorded from each rat.
Histology. At the end of the recording, the position of the electrode tip was marked by passing a 28 μA cathodal current through the electrode for 20 min. This deposited a discrete dye spot. Rats were then deeply anesthetized with additional chloral hydrate and perfused transcardially with 0.9% NaCl followed by 10% formalin. Brains were stored in 10% formalin until serial coronal sections (30 μm) were cut on a freezing microtome (American Optical Corporation, Buffalo, NY). Sections were then mounted and stained with cresyl violet, and electrode placement was verified using routine light microscopy.
Drugs. Quinpirole HCl and eticlopride HCl were obtained from Research Biochemicals (Natick, MA). Chloral hydrate, ketamine, and heparin were from Sigma (St. Louis, MO). Gentamycin was from ICN Biochemicals (Aurora, IL). Xylazine was from Phoenix Scientific (St. Joseph, MO). Cocaine HCl was obtained from the National Institute on Drug Abuse (Rockville, MD).
Statistical analyses. SA experiments were analyzed with repeated measures ANOVA. This analysis considered the group effect (HRs vs LRs) as a between factor and the following as within factors, when necessary: hole effect (2 levels, active hole vs inactive hole), days effect (7 levels, days 1–7), and drug effect (2 levels, saline vs cocaine). Electrophysiology data were analyzed with two-tailed Student's t tests comparing HRs and LRs. The dose–response effects of quinpirole on cell firing rates were analyzed with repeated measures ANOVA using the doses of quinpirole as the within factor (11 levels, doses 0–512). The effects of quinpirole were also analyzed with repeated measures analysis of covariance (ANCOVA) using basal firing rate (i.e., quinpirole dose 0) as the covariate and the doses of quinpirole as the within factor (10 levels, doses 1–512). This analysis was performed to determine whether any differences between HRs and LRs were caused by differences in basal firing rates (White and Wang, 1984a). All correlation analyses were performed with Pearson's correlation tests. The dose of quinpirole required to produce inhibition of the firing rate was calculated as the dose that did not statistically differ from that producing complete inhibition using a paired t test.
RESULTS
Only HR rats acquired cocaine SA
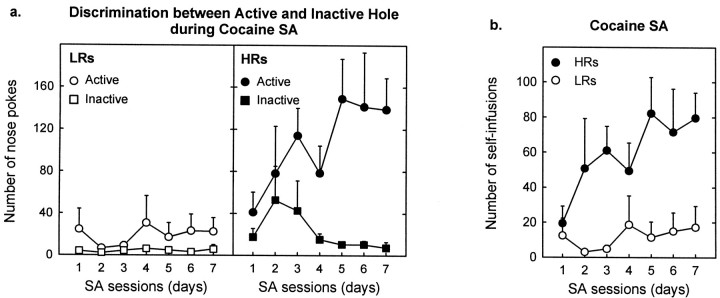
In the first experiment, LR and HR rats were tested for acquisition of cocaine SA (175 μg/kg per injection). Only HR rats developed SA behavior. Thus, as Figure1a shows, HRs, but not LRs, developed preference for the active hole versus the inactive one during the 7 d of testing. In addition, HRs showed greater responding in the active hole compared with LR rats and slightly, but not significantly, higher inactive hole responding. Finally (Fig.1b), the cocaine intake (number of self-infusions) was greater in HR rats compared with LRs.
Fig. 1.
HRs acquire cocaine SA (175 μg/kg per infusion), whereas LRs do not. a, HRs and LRs discriminated differently between the active and inactive holes [group × hole interaction, F(1,8) = 25.0;p < 0.001]. LRs showed no preference for the active hole versus the inactive one throughout the testing procedure [hole effect, F(1,4) = 1.4;p > 0.3; hole × days interaction,F(6,24) = 0.85; p> 0.5], indicating that they did not acquire cocaine SA. Instead, HRs developed active hole preference during the 7 d of testing [hole effect, F(1,4) = 48.1;p < 0.002; hole × days interaction,F(6,24) = 2.67; p< 0.05], denoting the acquisition of cocaine SA behavior. HRs also displayed greater responding in the active hole [group effect,F(1,8) = 37.1; p < 0.001] and slightly higher inactive hole responding [group effect,F(1,8) = 4.3; p = 0.08] compared with LR rats. b, HR rats showed greater cocaine intake (number of self-infusions) compared with LRs [group effect, F(1,8) = 23.4;p < 0.001]. This difference was present throughout the cocaine SA experiment [group × days interaction,F(6,48) = 1.08; p> 0.39]; however, an examination of the figure indicates that no differences were present during the first SA session. Eachpoint represents the mean ± SEM of each group.
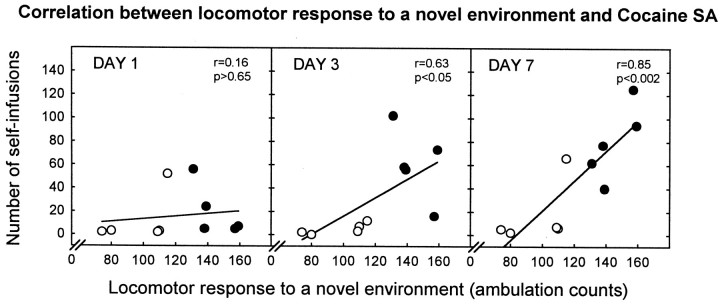
The relationship between the locomotor response to a novel environment and cocaine SA was confirmed by the positive correlation between these two behaviors. This correlation was not present on day 1 of SA; it emerged on day 3 and was maintained until day 7 (Fig.2).
Fig. 2.
The response to a novel environment is correlated with the development of cocaine SA. There was an overall positive correlation between the locomotor response to a novel environment and average infusions of cocaine over the 7 d of testing (data not shown; r = 0.82;p < 0.01). The different scatter plots illustrate that this correlation was not present on day 1; it emerged on day 3 and was maintained until day 7. Each point represents an individual rat. Empty circles represent LR rats;filled circles represent HRs.
Differences in cocaine SA were not caused by differences in sampling behavior
The second experiment was performed to determine whether differences in cocaine SA behavior were attributable to differences in sampling (greater overall nose-poking behavior) or differences in reactivity to the light cue (associated with the active hole). In this experiment, LR and HR rats were initially tested for saline SA and then for cocaine SA. During the first 7 d of testing, nose pokes in the active hole illuminated the hole for 3 sec and delivered saline infusions. During the subsequent 7 d (i.e., days 8–14), saline was replaced with cocaine.
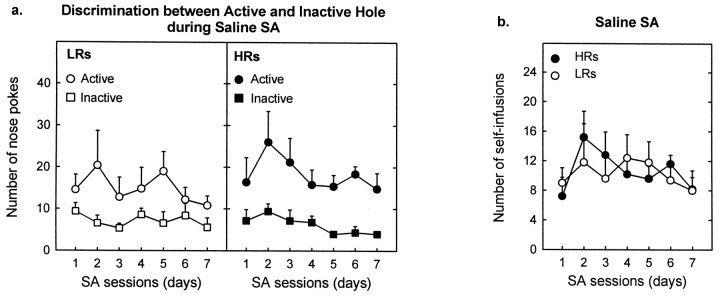
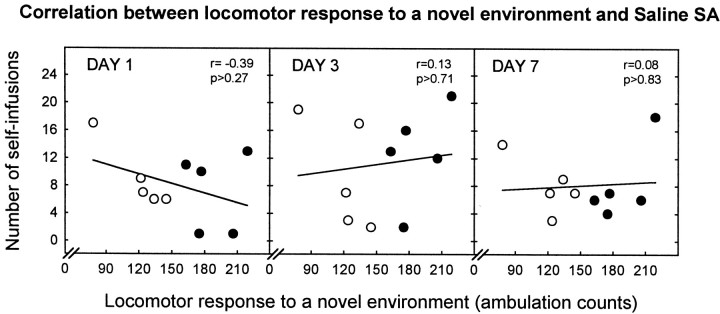
HRs and LRs did not exhibit significant differences in responding during saline SA. Unlike during cocaine SA, both HR and LR rats showed equal discrimination and preference for the active over the inactive hole (Fig. 3a). In addition, HRs and LRs did not differ on any other dependent variable (i.e., number of nose pokes in the active hole and in the inactive hole and number of reinforcers; Fig. 3b). Finally, there was no relationship between the locomotor response to a novel environment and saline SA on any of the SA days (see Fig.4, days 1, 3, and 7).
Fig. 3.
HRs and LRs show no differences in SA for saline.a, The two groups of animals equally discriminated between the active and inactive holes [group × hole interaction,F(1,8) = 1.1; p > 0.3; group × hole × days interaction,F(6,48) = 0.54; p> 0.7], showing a marked preference for the active hole (associated with the 3 sec light and the infusion of saline) over the inactive one [hole effect, F(1,8) = 21.8;p < 0.002]. In addition, HRs and LRs exhibited similar nose-poking behavior in the active and inactive hole [group effect, F(1,8) = 0.37;p > 0.5; F(1,8) = 0.33; p > 0.5, respectively]. When the saline solution was replaced with cocaine (175 μg/kg per infusion), however, nose-poking behavior primarily resembled (data not shown) that observed in our first experiment (see Fig. 1). This change from saline to cocaine induced a change in the active hole responding in HRs but not in LRs [group × drug × days interaction,F(6,48) = 3.5; p < 0.01]. HRs increased nose poking in the active hole [drug effect,F(1,4) = 14.3; p < 0.02], whereas LRs did not modify active hole responding [drug effect, F(1,4) = 1.33;p > 0.3]. Neither group modified inactive hole responding at any time [group × drug interaction,F(1,8) = 0.001; p> 0.98; group × drug × days interaction,F(6,48) = 0.44; p> 0.84]. The change from saline to cocaine modified the discrimination of the active versus inactive hole between the two groups [group × drug × hole × days interaction,F(6,48) = 3.1; p < 0.02]. Thus, in agreement with our first cocaine SA experiment, during cocaine SA, LRs did not show preference for the active versus the inactive hole [hole effect, F(1,4) = 2.3; p > 0.2], whereas HRs maintained a strong preference for the active hole [hole effect,F(1,4) = 14.2; p < 0.02]. Each point represents the mean ± SEM of each group. b, The number of reinforcers (self-infusions of saline associated with a 3 sec light in the active hole) was similar in HR and LR rats [group effect,F(1,8) = 0.02; p > 0.9] and remained constant throughout the saline SA sessions [group × days interaction,F(6,48) = 0.88; p> 0.5]. When saline was replaced with cocaine, however, SA behavior primarily reproduced (data not shown) that obtained in our first experiment (see Fig. 2). This switch from saline to cocaine induced a change in SA behavior in HRs but not in LRs [group × drug × days interaction, F(6,48) = 2.4;p < 0.04]. Thus, HRs rapidly increased their number of self-infusions [drug effect,F(1,4) = 35.3; p < 0.01], whereas LRs did not modify their intake behavior [drug effect,F(1,4) = 1.35; p > 0.3]. Each point represents the mean ± SEM of each group.
Fig. 4.
No relationship between the locomotor response to a novel environment and saline SA. There was no correlation between the response to a novel environment and average infusions of saline over the 7 d of testing (r = −0.12;p > 0.7; data not shown). In addition, there was no correlation between these two behaviors on any of the days tested. The scatter plots depict results from days 1, 3, and 7 of saline SA. Each point represents an individual rat. Empty circles represent LR animals; filled circlesdepict HRs.
When the saline solution was replaced with cocaine, however, SA behavior in HR and LR rats reproduced that observed in our first experiment (data not shown). This change from saline to cocaine induced a rapid increase in SA behavior in HR rats but not in LRs (see Fig. 3legend for statistics). HRs increased active hole responding, augmenting the number of self-infusions (see Fig. 3 legend for statistics). On the other hand, LRs did not modify their active hole responding or intake behavior between the saline and the cocaine tests. Neither group changed their inactive hole responding at any time.
It is interesting to note that the shift from saline to cocaine also induced a change in active versus inactive hole discrimination between the two groups (Fig. 3 legend). Thus, when switched to cocaine, LRs stopped preferring the active hole to the inactive one, and similar to our first experiment (Fig. 1a), they did not differentiate between the two holes. Instead, HRs increased discrimination between the two holes, showing strong preference for the active hole.
The activity of VTA DA neurons was higher in HRs
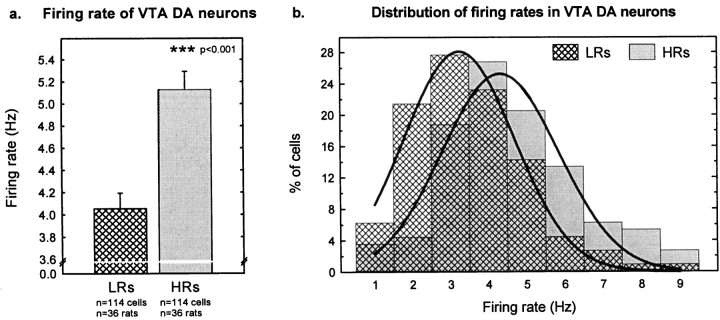
The basal firing rate of VTA DA neurons was higher in HRs than in LRs. The mean firing rate of VTA DA neurons in HRs was 5.1 ± 0.2 Hz compared with 4.1 ± 0.2 Hz in LRs (Fig.5a). Firing rates in both groups of animals were normally distributed (range, 1.0–9.5 Hz), indicating similar neuronal populations in both groups of animals. However, the curve was shifted ∼1 Hz to the right in HRs compared with LRs (Fig. 5b).
Fig. 5.
Firing rates in VTA DA cells. a, HRs exhibited a higher basal firing rate than did LRs (t226 = −4.94; p< 0.001). Each verticalbar represents the mean ± SEM of each group. b, The distribution curve of the DA firing rates (percentage of cells firing at a particular rate) was similar in HRs and LRs, except that the curve was shifted ∼1 Hz to the right in HRs compared with LRs.Verticalbars represent the percentage of cells firing at a particular rate for each group of rats.
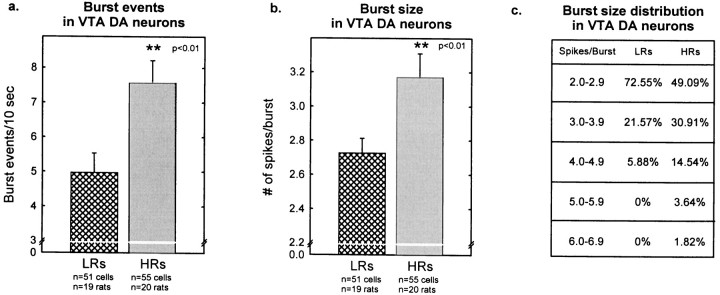
Bursting activity of VTA DA neurons was also higher in HRs than in LRs. The percentage of spikes occurring in bursts was 46.0 ± 3.5% in HRs compared with 32.6 ± 3.3% in LR rats (Fig.6a). This difference in bursting activity paralleled the difference in firing rate. Thus, as Figure 6b shows, there was a similar positive correlation between firing rate and bursting activity in both groups of rats. Figure 7a shows that the number of burst events was greater in HR compared with LR rats (7.6 ± 0.6 vs 5.0 ± 0.6 burst events/10 sec, respectively). HR rats also showed larger burst size (3.2 ± 0.1 spikes/burst) compared with LR animals (2.7 ± 0.1 spikes/burst) (Fig.7b); the distribution of burst sizes indicates that HR rats exhibited a smaller percentage of two-spike bursts and a greater number of larger bursts compared with LRs (Fig. 7c).
Fig. 7.
Burst events and burst size in VTA DA cells.a, HRs exhibited a higher number of burst events per 10 sec compared with LRs (t104 = −3.03;p < 0.01). b, HRs showed larger burst sizes (number of spikes per burst) compared with LR rats (t104 = −2.66; p< 0.01). Each vertical bar represents the mean ± SEM of each group. c, The distribution of burst size illustrates that HR rats had a smaller percentage of cells with two-spike bursts and a greater percentage of cells with larger bursts compared with LRs.
Table 1 considers burst-firing cells (cells with at least two triplets during 500 consecutive spikes) and nonburst-firing cells separately. Both groups of rats showed a greater percentage of burst-firing cells than nonburst-firing cells. In addition, both HRs and LRs exhibited a similar proportion of neurons in each cell population. In the burst-firing cell population, HRs displayed greater firing rate, bursting activity, burst events, and burst size compared with LR rats. No differences were observed between HRs and LRs in the nonburst-firing cells, perhaps because of the low number of nonburst-firing VTA DA cells in both groups (5–6 cells/group).
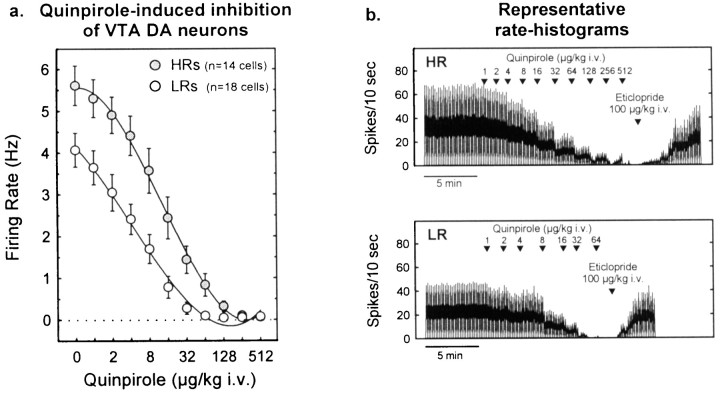
The DA D2-class receptor agonist quinpirole caused a dose-dependent decrease in the firing activity of VTA DA neurons in both groups of animals. However, as Figure 8 shows, quinpirole-induced inhibition was attenuated in HRs compared with LRs. In fact HRs required an eightfold higher dose of quinpirole to produce complete inhibition of neuronal firing compared with LRs (256 vs 32 μg/kg). Because the sensitivity of DA cells to agonist-induced inhibition is negatively correlated with basal firing activity (White and Wang, 1984a), the response to quinpirole was also analyzed using an analysis that controls for differences in baseline firing rates (ANCOVA). When this difference was statistically controlled, there was no longer a significant group effect, although there was a strong trend in that direction (p = 0.06). This suggests that the higher basal firing rates in the HR group contributed substantially to the lower sensitivity to quinpirole.
Fig. 8.
Autoreceptor-mediated inhibition of firing in VTA DA cells. a, Cumulative dose–response curves illustrating that the DA D2-class receptor agonist quinpirole induced a dose-dependent decrease in firing activity in both HRs and LRs [dose effect, F(10,300) = 153.0;p < 0.001]. This inhibition was attenuated in HRs compared with LRs [group effect,F(1,30) = 10.23; p< 0.01; group × dose interaction,F(10,280) = 6.5; p< 0.001]. The ANCOVA considering the basal firing rate (quinpirole dose 0) as the covariate [group effect,F(1,29) = 3.6; p = 0.06; group × dose interaction,F(9,270) = 7.4; p< 0.001] indicates that these differences were not exclusively caused by a difference in basal firing activity. Each pointrepresents the mean ± SEM of each group. b, Representative rate histograms showing examples of recordings from an HR or LR animal. Note the greater doses of quinpirole required to inhibit the firing of VTA DA neurons in HR animals compared with LRs. The effects of quinpirole were reversed by the D2-class receptor antagonist eticlopride (100 μg/kg, i.v.).Arrowheads indicate the time points at which quinpirole or eticlopride was administered; numbers indicate the infusion dose (in micrograms per kilogram).
The activity of SNc DA cells was higher in HRs although these differences were not as large as those observed in the VTA
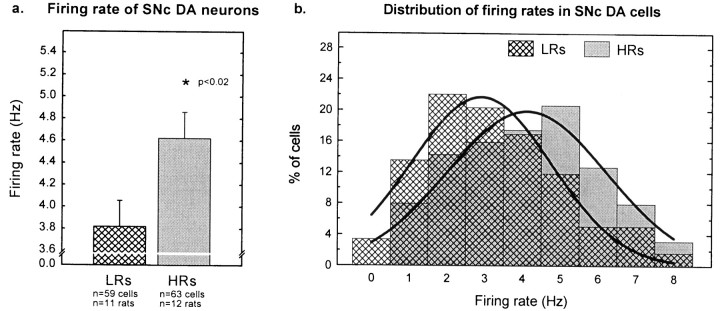
The basal firing rate of SNc DA neurons was higher in HRs than in LRs. The mean firing rate of SNc DA cells in HR rats was 4.6 ± 0.2 Hz compared with 3.8 ± 0.2 Hz in LRs (Fig.9a). As in the VTA, the distribution curves of DA firing rates in the SNc were similar in HRs and LRs (range, 0.5–8.5 Hz) with a 1 Hz rightward shift in HRs compared with LRs (Fig. 9b).
Fig. 9.
Firing rates of SNc DA cells. a, HRs exhibited a higher basal firing rate than did LRs (t120 = −2.40; p< 0.02). Each verticalbar represents the mean ± SEM of each group. b, The distribution curve of DA firing rates (percentage of cells firing at a particular rate) was similar in HRs and LRs, except that the curve was shifted ∼1 Hz to the right in HRs compared with LRs. Verticalbars represent the percentage of cells firing at a particular rate for each group of rats.
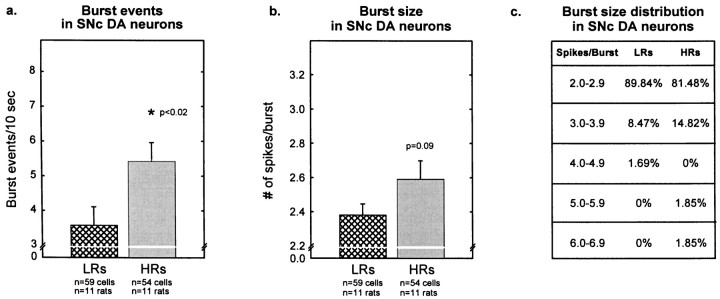
Bursting activity of SNc DA cells was slightly, but significantly, higher in HRs than in LRs. As Figure10a shows, the percentage of spikes emitted in bursts was 29.6 ± 2.7% in HRs compared with 22.0 ± 2.7% in LR rats. The correlation analysis (Fig.10b) revealed that both groups of animals showed a similar relationship between firing rate and bursting activity. This correlation was not as strong as that observed in the VTA but met adequate significance. Figure11a shows that the number of burst events was greater in HR compared with LR rats (5.4 ± 0.6 vs 3.6 ± 0.5 burst events/10 sec, respectively). HRs also showed slightly higher (but nonstatistically significant) burst size compared with LR rats (2.6 ± 0.1 vs 2.4 ± 0.6 spikes/burst, respectively) (Fig. 11b); the distribution of burst sizes (number of spikes per burst) indicates that HR and LR rats exhibited similar percentages of two-spike bursts and low percentages of larger bursts (Fig. 11c).
Fig. 11.
Burst events and burst size in SNc DA cells.a, HRs exhibited a higher number of burst events per 10 sec compared with LRs (t111 = −2.42;p < 0.02). b, HRs showed slightly higher burst sizes (number of spikes per burst) compared with LR rats (t111 = −1.70; p = 0.09). Each vertical bar represents the mean ± SEM of each group. c, The distribution of burst size illustrates a large percentage of cells with two-spike bursts in both HRs and LRs.
Table 1, considering burst-firing and nonburst-firing cells separately, shows that there was a greater percentage of burst-firing than nonburst-firing cells in both groups of rats and that these percentages were similar between HRs and LRs. In addition, for each cell population, there were no differences between HRs and LRs in firing rate, bursting activity, burst events, or burst size.
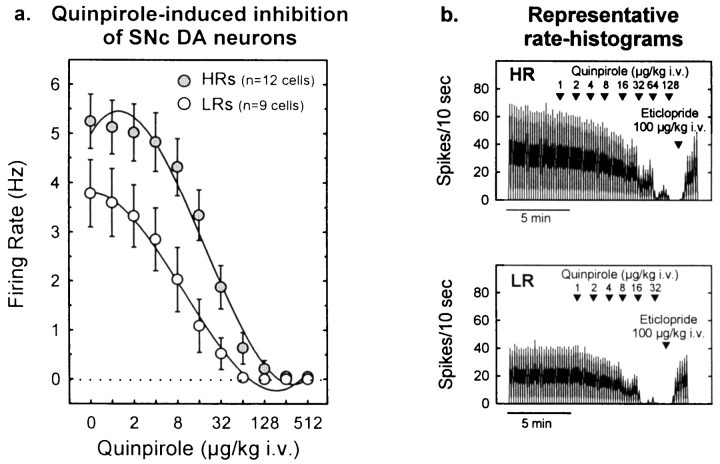
In the SNc, quinpirole dose-dependently decreased DA cell firing in both groups of animals. However (Fig.12), the inhibitory effect of quinpirole was reduced in HRs compared with LRs. As in the VTA, ANCOVA indicated that the group differences in basal firing contributed to the apparent differences in autoreceptor sensitivity.
Fig. 12.
Autoreceptor-mediated inhibition of firing in SNc DA cells. a, Cumulative dose–response curves illustrating that the DA D2-class receptor agonist quinpirole induced a dose-dependent decrease in firing activity in both HRs and LRs [dose effect, F(10,190) = 80.4;p < 0.001]. This inhibition was attenuated in HRs compared with LRs [group effect,F(1,19) = 5.3; p < 0.04; group × dose interaction,F(10,190) = 4.1; p< 0.001]. The ANCOVA considering the basal firing rate (quinpirole dose 0) as the covariate [group effect,F(1,18) = 4.1; p = 0.06; group × dose interaction,F(9,171) = 4.5; p< 0.001] indicates that these differences were not entirely caused by difference in basal firing activity. Each pointrepresents the mean ± SEM of each group. b, Representative rate histograms showing examples of recordings from an HR or LR rat. Note the greater doses of quinpirole required to suppress the firing of SNc DA neurons in HR animals compared with LR animals. The effects of quinpirole were reversed by the D2-class receptor antagonist eticlopride (100 μg/kg, i.v.). Arrowheadsindicate the time points at which quinpirole or eticlopride was administered; numbers indicate the infusion dose (in micrograms per kilogram).
DISCUSSION
These results demonstrate that a vulnerability to self-administer cocaine is associated with increased impulse activity of midbrain DA cells. Thus, animals with increased liability to self-administer cocaine had greater impulse activity of VTA and, to a lesser extent, of SNc DA cells compared with animals with reduced drug vulnerability.
Locomotor response to a novel environment predicts acquisition of cocaine SA
Rats with a high response to a novel environment acquired cocaine SA, whereas rats with low reactivity to the novel context did not. We also found that cocaine intake was positively correlated with the locomotor response to a novel environment and that HRs showed greater drug intake compared with LR rats. Previous findings have shown that the locomotor response to novel environments predicts acquisition of amphetamine SA (Piazza et al., 1989, 1990; Pierre and Vezina, 1997), and here we provide evidence, for the first time, that response to novel contexts also predicts acquisition of cocaine SA in male rats.
The question could arise as to whether these findings reflect differences in cocaine sensitivity or simply reflect behavioral characteristics that could be unrelated to drugs such as differences in hole exploration and/or preference for the light associated with the active hole. However, such factors cannot account for our findings because during sessions in which animals self-administered saline, HRs and LRs showed similar nose-poking behavior and responded equally for a light stimulus and saline infusion. In addition, there was no correlation between the response to a novel environment and saline SA. Similar findings have been reported by Piazza et al. (1990), who showed that differences in amphetamine intake are independent of differences in nose poking in the SA chamber.
Taken together, these results suggest that the locomotor response to a novel environment specifically predicts differences in drug sensitivity. Differences in drug sensitivity between HRs and LRs are also supported by the finding that HRs exhibit higher rates of maintained responding for cocaine over a wide range of doses and ratios compared with LRs (Deroche et al., 1995; Grimm and See, 1997). Furthermore, our results show that, when saline was replaced with cocaine, only HRs increased responding. This implies that low doses of cocaine were reinforcing for HRs but similar to saline for LRs. Actually, LRs showed preference for the active hole (associated with the light cue) over the inactive one during saline SA but not during cocaine SA. Because of this loss of discrimination in LR rats, it is tempting to suggest that low doses of cocaine could have aversive properties in LR animals.
Greater impulse activity of midbrain DA cells in HRs
HRs showed greater impulse activity of VTA DA cells and, to a lesser extent, of SNc DA cells compared with LRs. The level of basal firing activity in midbrain DA cells is determined, in part, by impulse-regulating somatodendritic receptors (Aghajanian and Bunney, 1977a,b; Roth, 1979; Wang, 1981b; White and Wang, 1984a,b; Bunney et al., 1987; Clark and Chiodo, 1988; White, 1996). These autoreceptors, primarily of the D2 subtype (White and Wang, 1984b; Mercuri et al., 1997; Koeltzow et al., 1998), are activated by somatodendritically released DA (Beart et al., 1979; Chéramy et al., 1981; Kalivas and Duffy, 1991) and reduce DA activity by hyperpolarizing the cell (Lacey et al., 1987; Silva and Bunney, 1988;Mercuri et al., 1992). We determined whether differences in firing rates between HRs and LRs could be caused by differences in autoreceptor sensitivity. We tested the effects of quinpirole, a direct D2-class receptor agonist that principally reduces impulse activity by acting on somatodendritic DA autoreceptors (see White, 1996), on impulse activity of midbrain DA cells in HRs and LRs. HRs showed decreased inhibitory effects of quinpirole and required an eightfold higher dose of quinpirole to inhibit DA neurons compared with LR rats. This could suggest that functional subsensitivity of impulse-regulating D2 somatodendritic autoreceptors may, at least in part, contribute to the greater activity of midbrain DA cells in HRs. However, when differences in basal firing rates were statistically controlled (with ANCOVA), the apparent differences in quinpirole sensitivity were no longer statistically significant (p = 0.06). Thus, increased firing rates may produce a system that becomes more difficult to inhibit via D2 autoreceptors or via other inhibitory inputs (for example, see Lacey et al., 1988; Johnson and North, 1992; Engberg et al., 1993; Seutin et al., 1994; Cameron and Williams, 1995; Bonci and Williams, 1996; Brodie and Bunney, 1996; Lucas et al., 1998).
Perhaps one of the most interesting findings in this study is the greater burst event frequency and number of spikes per burst in HRs than in LRs. These differences in bursting could depend on differences in the intrinsic properties of neurons (for example, see Johnson et al., 1992; Seutin et al., 1993, 1994; Mercuri et al., 1994; Amini et al., 1999; Wilson and Callaway, 2000; for review, see Overton and Clark, 1997) or could also be related to differences in excitatory glutamatergic inputs (for review, see Grace, 1991; White, 1996;Overton and Clark, 1997; Clark and Overton, 1998).
Functional implications
The differences in firing rate and bursting activity between HRs and LRs in midbrain DA cells could, at least in part, explain the differences in DA levels that have been reported in the striatal complex between these two groups of animals. Bursting activity of DA neurons dramatically increases DA release (Gonon, 1988; Suaud-Chagny et al., 1992; Chergui et al., 1994). In the NAc (receiving DA input from the VTA), HRs exhibit enhanced DA levels under basal conditions, in response to stress, and after cocaine administration (Bradberry et al., 1991; Piazza et al., 1991; Hooks et al., 1992a; Rougé-Pont et al., 1993, 1998).
The greater differences between HRs and LRs in the VTA versus the SNc could have relevant behavioral consequences and explain our findings with cocaine SA. The mesoaccumbens and mesostriatal pathways play significant roles in mediating the reinforcing and psychomotor properties of drugs of abuse; however, mesoaccumbens DA neurons, particularly those projecting to the shell subregion of the NAc, are presumably involved in regulating motivation and reward, whereas nigrostriatal neurons are more implicated in sensory motor integration (Mogenson et al., 1980; Robbins and Everitt, 1996; Di Chiara, 1998).
Neuroadaptations in mesoaccumbens DA transmission are considered crucial for facilitating drug addiction (for review, see Robinson and Becker, 1986; Robinson and Berridge, 1993; Berridge and Robinson, 1998;White and Kalivas, 1998). From this perspective, heightened DA transmission in HRs would facilitate acquisition and maintenance of SA. In addition, the VTA is an important site for the initiation of behavioral sensitization to psychostimulants (Stewart and Vezina, 1989;Vezina, 1993, 1996; Perugini and Vezina, 1994; Cador et al., 1995,1999; Bjijou et al., 1996), a phenomenon that is considered to be associated with drug craving and addiction (for review, see Robinson and Berridge, 1993). Increased activity of VTA DA cells could thus be responsible for increased sensitization in HRs (Hooks et al., 1991a,1992b; Jodogne et al., 1994; Pierre and Vezina, 1997) making HRs more liable to engage in addictive behaviors. A facilitatory role of increased VTA DA cell activity in drug addiction is also supported by findings that, similar to HRs, rats rendered vulnerable to drugs by repeated administration of psychostimulants exhibit increased activity of midbrain DA cells as well as autoreceptor subsensitivity (White and Wang, 1984c; Henry et al., 1989, 1998; Ackerman and White, 1990, 1992;Wolf et al., 1993; however, see Gao et al., 1998).
In conclusion, we used behavioral (cocaine self-administration) and electrophysiological (single-unit extracellular recordings) techniques to provide the first evidence that animals with an enhanced propensity to self-administer cocaine have elevated basal impulse activity of midbrain DA neurons that are known to modulate the addictive effects of drugs of abuse. These findings could provide new insight on the factors underlying individual vulnerabilities to drug addiction.
Footnotes
This work was supported by United States Public Health Service Grant DA 04093 and Senior Scientist Award DA 00456 from the National Institute on Drug Abuse to F.J.W. M.M. was supported by a National Alliance for Research on Schizophrenia and Depression young investigator award. We thank Lorinda Baker for excellent technical assistance with the histology, Jake Battle and Dr. Donald Cooper for help in writing the burst analysis program, and Cindy Brandon, Dr. Donald Cooper, Dr. Xiuti Hu, Dr. Timothy Koeltzow, and Jayms Peterson for invaluable discussions and advice.
Correspondence should be addressed to Dr. Michela Marinelli, Department of Cellular and Molecular Pharmacology, Finch University of Health Sciences, The Chicago Medical School, 3333 Green Bay Road, North Chicago, IL 60064. E-mail: marinelm@finchcms.edu.
REFERENCES
- 1.Ackerman JM, White FJ. A10 somatodendritic dopamine autoreceptor sensitivity following withdrawal from repeated cocaine treatment. Neurosci Lett. 1990;117:181–187. doi: 10.1016/0304-3940(90)90141-u. [DOI] [PubMed] [Google Scholar]
- 2.Ackerman JM, White FJ. Decreased activity of rat A10 dopamine neurons following withdrawal from repeated cocaine. Eur J Pharmacol. 1992;218:171–173. doi: 10.1016/0014-2999(92)90161-v. [DOI] [PubMed] [Google Scholar]
- 3.Aghajanian GK, Bunney BS. Pharmacological characterization of dopamine “autoreceptors” by microiontophoretic single-cell recording studies. Adv Biochem Psychopharmacol. 1977a;16:433–438. [PubMed] [Google Scholar]
- 4.Aghajanian GK, Bunney BS. Dopamine “autoreceptors”: pharmacological characterization by microiontophoretic single cell recording studies. Naunyn Schmiedebergs Arch Pharmacol. 1977b;297:1–7. doi: 10.1007/BF00508803. [DOI] [PubMed] [Google Scholar]
- 5.Amini B, Clark JW, Jr, Canavier CC. Calcium dynamics underlying pacemaker-like and burst firing oscillations in midbrain dopaminergic neurons: a computational study. J Neurophysiol. 1999;82:2249–2261. doi: 10.1152/jn.1999.82.5.2249. [DOI] [PubMed] [Google Scholar]
- 6.Beart PM, McDonald D, Gundlach AL. Mesolimbic dopaminergic neurones and somatodendritic mechanisms. Neurosci Lett. 1979;15:165–170. doi: 10.1016/0304-3940(79)96107-x. [DOI] [PubMed] [Google Scholar]
- 7.Berridge KC, Robinson TE. What is the role of dopamine in reward: hedonic impact, reward learning, or incentive salience? Brain Res Rev. 1998;28:309–369. doi: 10.1016/s0165-0173(98)00019-8. [DOI] [PubMed] [Google Scholar]
- 8.Bjijou Y, Stinus L, Le Moal M, Cador M. Evidence for selective involvement of dopamine D1 receptors of the ventral tegmental area in the behavioral sensitization induced by intra-ventral tegmental area injections of d-amphetamine. J Pharmacol Exp Ther. 1996;277:1177–1187. [PubMed] [Google Scholar]
- 9.Bonci A, Williams JT. A common mechanism mediates long-term changes in synaptic transmission after chronic cocaine and morphine. Neuron. 1996;6:631–639. doi: 10.1016/s0896-6273(00)80082-3. [DOI] [PubMed] [Google Scholar]
- 10.Bradberry CW, Gruen RJ, Berridge CW, Roth RH. Individual differences in behavioral measures: correlations with nucleus accumbens dopamine measured by microdialysis. Pharmacol Biochem Behav. 1991;39:877–882. doi: 10.1016/0091-3057(91)90047-6. [DOI] [PubMed] [Google Scholar]
- 11.Brodie MS, Bunney EB. Serotonin potentiates dopamine inhibition of ventral tegmental area neurons in vitro. J Neurophysiol. 1996;76:2077–2082. doi: 10.1152/jn.1996.76.3.2077. [DOI] [PubMed] [Google Scholar]
- 12.Bunney BS, Walters JR, Roth RH, Aghajanian GK. Dopaminergic neurons: effect of antipsychotic drugs and amphetamine on single cell activity. J Pharmacol Exp Ther. 1973;185:560–571. [PubMed] [Google Scholar]
- 13.Bunney BS, Sesack SR, Silva NL. Midbrain dopaminergic systems: neurophysiology and electrophysiological pharmacology. In: Meltzer HY, editor. Psychopharmacology: the third generation of progress. Raven; New York: 1987. pp. 113–126. [Google Scholar]
- 14.Cador M, Bjijou Y, Stinus L. Evidence of a complete independence of the neurobiological substrates for the induction and expression of behavioral sensitization to amphetamine. Neuroscience. 1995;65:385–395. doi: 10.1016/0306-4522(94)00524-9. [DOI] [PubMed] [Google Scholar]
- 15.Cador M, Bjijou Y, Cailhol S, Stinus L. d-Amphetamine-induced behavioral sensitization: implication of a glutamatergic medial prefrontal cortex-ventral tegmental area innervation. Neuroscience. 1999;94:705–721. doi: 10.1016/s0306-4522(99)00361-9. [DOI] [PubMed] [Google Scholar]
- 16.Cameron DL, Williams JT. Opposing roles for dopamine and serotonin at presynaptic receptors in the ventral tegmental area. Clin Exp Pharmacol Physiol. 1995;22:841–845. doi: 10.1111/j.1440-1681.1995.tb01947.x. [DOI] [PubMed] [Google Scholar]
- 17.Chéramy A, Leviel V, Glowinski J. Dendritic release of dopamine in the substantia nigra. Nature. 1981;289:537–542. doi: 10.1038/289537a0. [DOI] [PubMed] [Google Scholar]
- 18.Chergui K, Suaud-Chagny MF, Gonon F. Nonlinear relationship between impulse flow, dopamine release and dopamine elimination in the rat brain in vivo. Neuroscience. 1994;62:641–645. doi: 10.1016/0306-4522(94)90465-0. [DOI] [PubMed] [Google Scholar]
- 19.Clark D, Chiodo LA. Electrophysiological and pharmacological characterization of identified nigrostriatal and mesoaccumbens dopamine neurons in the rat. Synapse. 1988;2:474–485. doi: 10.1002/syn.890020503. [DOI] [PubMed] [Google Scholar]
- 20.Clark D, Overton PG. Alterations in excitatory amino acid-mediated regulation of midbrain dopaminergic neurones induced by chronic psychostimulant administration and stress: relevance to behavioral sensitization and drug addiction. Addiction Biol. 1998;3:109–135. doi: 10.1080/13556219872191. [DOI] [PubMed] [Google Scholar]
- 21.Deroche V, Rougé-Pont F, Le Moal M, Piazza PV. Individual differences in cocaine self-administration: dose-response and ratio-response study. Soc Neurosci Abstr. 1995;21:767.9. [Google Scholar]
- 22.de Wit H, Uhlenhuth EH, Johanson CE. Individual differences in the reinforcing and subjective effects of amphetamine and diazepam. Drug Alcohol Depend. 1986;16:341–360. doi: 10.1016/0376-8716(86)90068-2. [DOI] [PubMed] [Google Scholar]
- 23.Di Chiara G. A motivational learning hypothesis of the role of mesolimbic dopamine in compulsive drug use. J Psychopharmacol. 1998;12:54–67. doi: 10.1177/026988119801200108. [DOI] [PubMed] [Google Scholar]
- 24.Engberg G, Kling-Petersen T, Nissbrandt H. GABAB-receptor activation alters the firing pattern of dopamine neurons in the rat substantia nigra. Synapse. 1993;15:229–238. doi: 10.1002/syn.890150308. [DOI] [PubMed] [Google Scholar]
- 25.Exner M, Clark D. Behavior in the novel environment predicts responsiveness to d-amphetamine in the rat: a multivariate approach. Behav Pharmacol. 1993;4:47–56. [PubMed] [Google Scholar]
- 26.Gao WY, Lee TH, King GR, Ellinwood EH. Alterations in baseline activity and quinpirole sensitivity in putative dopamine neurons in the substantia nigra and ventral tegmental area after withdrawal from cocaine pretreatment. Neuropsychopharmacology. 1998;18:222–232. doi: 10.1016/S0893-133X(97)00132-2. [DOI] [PubMed] [Google Scholar]
- 27.Gonon FG. Nonlinear relationship between impulse flow and dopamine released by rat midbrain neurons as studied by in vivo electrochemistry. Neuroscience. 1988;24:19–28. doi: 10.1016/0306-4522(88)90307-7. [DOI] [PubMed] [Google Scholar]
- 28.Grace AA. Regulation of spontaneous activity and oscillatory spike firing in rat midbrain dopamine neurons recorded in vitro. Synapse. 1991;7:221–234. doi: 10.1002/syn.890070307. [DOI] [PubMed] [Google Scholar]
- 29.Grace AA, Bunney BS. Intracellular and extracellular electrophysiology of nigral dopaminergic neurons. I. Identification and characterization. Neuroscience. 1983;10:301–315. doi: 10.1016/0306-4522(83)90135-5. [DOI] [PubMed] [Google Scholar]
- 30.Grace AA, Bunney BS. The control of firing pattern in nigral dopamine neurons: single spike firing. J Neurosci. 1984a;4:2866–2876. doi: 10.1523/JNEUROSCI.04-11-02866.1984. [DOI] [PMC free article] [PubMed] [Google Scholar]
- 31.Grace AA, Bunney BS. The control of firing pattern in nigral dopamine neurons: burst firing. J Neurosci. 1984b;4:2877–2890. doi: 10.1523/JNEUROSCI.04-11-02877.1984. [DOI] [PMC free article] [PubMed] [Google Scholar]
- 32.Grimm JW, See RE. Cocaine self-administration in ovariectomized rats is predicted by response to novelty, attenuated by 17-β estradiol, and associated with abnormal vaginal cytology. Physiol Behav. 1997;61:755–761. doi: 10.1016/s0031-9384(96)00532-x. [DOI] [PubMed] [Google Scholar]
- 33.Henry DJ, Greene MA, White FJ. Electrophysiological effects of cocaine in the mesoaccumbens dopamine system: repeated administration. J Pharmacol Exp Ther. 1989;251:833–839. [PubMed] [Google Scholar]
- 34.Henry DJ, Hu XT, White FJ. Adaptations in the mesoaccumbens dopamine system resulting from repeated administration of dopamine D1 and D2 receptor-selective agonists: relevance to cocaine sensitization. Psychopharmacology (Berl) 1998;140:233–242. doi: 10.1007/s002130050762. [DOI] [PubMed] [Google Scholar]
- 35.Hooks MS, Jones GH, Smith AD, Neill DB, Justice JB., Jr Individual differences in locomotor activity and sensitization. Pharmacol Biochem Behav. 1991a;38:467–470. doi: 10.1016/0091-3057(91)90308-o. [DOI] [PubMed] [Google Scholar]
- 36.Hooks MS, Jones GH, Smith AD, Neill DB, Justice JB., Jr Response to novelty predicts the locomotor and nucleus accumbens dopamine response to cocaine. Synapse. 1991b;9:121–128. doi: 10.1002/syn.890090206. [DOI] [PubMed] [Google Scholar]
- 37.Hooks MS, Colvin AC, Juncos JL, Justice JB., Jr Individual differences in basal and cocaine-stimulated extracellular dopamine in the nucleus accumbens using quantitative microdialysis. Brain Res. 1992a;587:306–312. doi: 10.1016/0006-8993(92)91012-4. [DOI] [PubMed] [Google Scholar]
- 38.Hooks MS, Jones GH, Neill DB, Justice JB., Jr Individual differences in amphetamine sensitization: dose-dependent effects. Pharmacol Biochem Behav. 1992b;41:203–210. doi: 10.1016/0091-3057(92)90083-r. [DOI] [PubMed] [Google Scholar]
- 39.Jodogne C, Marinelli M, Le Moal M, Piazza PV. Animals predisposed to develop amphetamine self-administration show higher susceptibility to develop contextual conditioning of both amphetamine-induced hyperlocomotion and sensitization. Brain Res. 1994;657:236–244. doi: 10.1016/0006-8993(94)90973-3. [DOI] [PubMed] [Google Scholar]
- 40.Johnson SW, North RA. Two types of neurone in the rat ventral tegmental area and their synaptic inputs. J Physiol (Lond) 1992;450:455–468. doi: 10.1113/jphysiol.1992.sp019136. [DOI] [PMC free article] [PubMed] [Google Scholar]
- 41.Johnson SW, Seutin V, North RA. Burst firing in dopamine neurons induced by N-methyl-d-aspartate: role of electrogenic sodium pump. Science. 1992;258:665–667. doi: 10.1126/science.1329209. [DOI] [PubMed] [Google Scholar]
- 42.Kalivas PW, Duffy P. A comparison of axonal and somatodendritic dopamine release using in vivo dialysis. J Neurochem. 1991;56:961–967. doi: 10.1111/j.1471-4159.1991.tb02015.x. [DOI] [PubMed] [Google Scholar]
- 43.Koeltzow TE, Xu M, Cooper DC, Hu XT, Tonegawa S, Wolf ME, White FJ. Alterations in dopamine release but not dopamine autoreceptor function in dopamine D3 receptor mutant mice. J Neurosci. 1998;18:2231–2238. doi: 10.1523/JNEUROSCI.18-06-02231.1998. [DOI] [PMC free article] [PubMed] [Google Scholar]
- 44.Koob GF. Circuits, drugs, and drug addiction. Adv Pharmacol. 1998;42:978–982. doi: 10.1016/s1054-3589(08)60910-2. [DOI] [PubMed] [Google Scholar]
- 45.Lacey MG, Mercuri NB, North RA. Dopamine acts on D2 receptors to increase potassium conductance in neurones of the rat substantia nigra zona compacta. J Physiol (Lond) 1987;392:397–416. doi: 10.1113/jphysiol.1987.sp016787. [DOI] [PMC free article] [PubMed] [Google Scholar]
- 46.Lacey MG, Mercuri NB, North RA. On the potassium conductance increase activated by GABAB and dopamine D2 receptors in rat substantia nigra neurones. J Physiol (Lond) 1988;401:437–453. doi: 10.1113/jphysiol.1988.sp017171. [DOI] [PMC free article] [PubMed] [Google Scholar]
- 47.Lucas LR, Angulo JA, Le Moal M, McEwen BS, Piazza PV. Neurochemical characterization of individual vulnerability to addictive drugs in rats. Eur J Neurosci. 1998;10:3153–3163. doi: 10.1046/j.1460-9568.1998.00321.x. [DOI] [PubMed] [Google Scholar]
- 48.Mercuri NB, Calabresi P, Bernardi G. The electrophysiological actions of dopamine and dopaminergic drugs on neurons of the substantia nigra pars compacta and ventral tegmental area. Life Sci. 1992;51:711–718. doi: 10.1016/0024-3205(92)90479-9. [DOI] [PubMed] [Google Scholar]
- 49.Mercuri NB, Bonci A, Calabresi P, Stratta F, Stefani A, Bernardi G. Effects of dihydropyridine calcium antagonists on rat midbrain dopaminergic neurones. Br J Pharmacol. 1994;113:831–838. doi: 10.1111/j.1476-5381.1994.tb17068.x. [DOI] [PMC free article] [PubMed] [Google Scholar]
- 50.Mercuri NB, Saiardi A, Bonci A, Picetti R, Calabresi P, Bernardi G, Borrelli E. Loss of autoreceptor function in dopaminergic neurons from dopamine D2 receptor deficient mice. Neuroscience. 1997;79:323–327. doi: 10.1016/s0306-4522(97)00135-8. [DOI] [PubMed] [Google Scholar]
- 51.Mogenson GJ, Jones DL, Yim CY. From motivation to action: functional interface between the limbic system and the motor system. Prog Neurobiol. 1980;14:69–97. doi: 10.1016/0301-0082(80)90018-0. [DOI] [PubMed] [Google Scholar]
- 52.Moss HB, Blackson TC, Martin CS, Tarter RE. Heightened motor activity level in male offspring of substance abusing fathers. Biol Psychiatry. 1992;32:1135–1147. doi: 10.1016/0006-3223(92)90193-4. [DOI] [PubMed] [Google Scholar]
- 53.O'Brien CP, Ehrman RN, Terns JN. Classical conditioning in human opioid dependence. In: Goldberg SR, Stolerman IP, editors. Behavioral analysis of drug dependence. Academic; London: 1986. pp. 329–365. [Google Scholar]
- 54.Overton PG, Clark D. Burst firing in midbrain dopaminergic neurons. Brain Res Brain Res Rev. 1997;25:312–334. doi: 10.1016/s0165-0173(97)00039-8. [DOI] [PubMed] [Google Scholar]
- 55.Paxinos G, Watson C. The rat brain in stereotaxic coordinates. Academic; New York: 1986. [DOI] [PubMed] [Google Scholar]
- 56.Perugini M, Vezina P. Amphetamine administered to the ventral tegmental area sensitizes rats to the locomotor effects of nucleus accumbens amphetamine. J Pharmacol Exp Ther. 1994;270:690–696. [PubMed] [Google Scholar]
- 57.Piazza PV, Deminière JM, Le Moal M, Simon H. Factors that predict individual vulnerability to amphetamine self-administration. Science. 1989;245:1511–1513. doi: 10.1126/science.2781295. [DOI] [PubMed] [Google Scholar]
- 58.Piazza PV, Deminière JM, Maccari S, Mormède P, Le Moal M, Simon H. Individual reactivity to novelty predicts probability of amphetamine self-administration. Behav Pharmacol. 1990;1:339–345. doi: 10.1097/00008877-199000140-00007. [DOI] [PubMed] [Google Scholar]
- 59.Piazza PV, Rougé-Pont F, Deminière JM, Kharouby M, Le Moal M, Simon H. Dopaminergic activity is reduced in the prefrontal cortex and increased in the nucleus accumbens of rats predisposed to develop amphetamine self-administration. Brain Res. 1991;567:169–174. doi: 10.1016/0006-8993(91)91452-7. [DOI] [PubMed] [Google Scholar]
- 60.Pierre PJ, Vezina P. Predisposition to self-administer amphetamine: the contribution of response to novelty and prior exposure to the drug. Psychopharmacology (Berl) 1997;129:277–284. doi: 10.1007/s002130050191. [DOI] [PubMed] [Google Scholar]
- 61.Robbins TW, Everitt BJ. Neurobehavioural mechanisms of reward and motivation. Curr Opin Neurobiol. 1996;6:228–236. doi: 10.1016/s0959-4388(96)80077-8. [DOI] [PubMed] [Google Scholar]
- 62.Robinson TE, Becker JB. Enduring changes in brain and behavior produced by chronic amphetamine administration: a review and evaluation of animal models of amphetamine psychosis. Brain Res. 1986;396:157–198. doi: 10.1016/s0006-8993(86)80193-7. [DOI] [PubMed] [Google Scholar]
- 63.Robinson TE, Berridge KC. The neural basis of drug craving: an incentive-sensitization theory of addiction. Brain Res Rev. 1993;18:247–291. doi: 10.1016/0165-0173(93)90013-p. [DOI] [PubMed] [Google Scholar]
- 64.Roth RH. Dopamine autoreceptors: pharmacology, function and comparison with post-synaptic dopamine receptors. Commun Psychopharmacol. 1979;3:429–445. [PubMed] [Google Scholar]
- 65.Rougé-Pont F, Piazza PV, Kharouby M, Le Moal M, Simon H. Higher and longer stress-induced increase in dopamine concentrations in the nucleus accumbens of animals predisposed to amphetamine self-administration. A microdialysis study. Brain Res. 1993;602:169–174. doi: 10.1016/0006-8993(93)90260-t. [DOI] [PubMed] [Google Scholar]
- 66.Rougé-Pont F, Deroche V, Le Moal M, Piazza PV. Individual differences in stress-induced dopamine release in the nucleus accumbens are influenced by corticosterone. Eur J Neurosci. 1998;10:3903–3907. doi: 10.1046/j.1460-9568.1998.00438.x. [DOI] [PubMed] [Google Scholar]
- 67.Seutin V, Johnson SW, North RA. Apamin increases NMDA-induced burst-firing of rat mesencephalic dopamine neurons. Brain Res. 1993;630:341–344. doi: 10.1016/0006-8993(93)90675-d. [DOI] [PubMed] [Google Scholar]
- 68.Seutin V, Johnson SW, North RA. Effect of dopamine and baclofen on N-methyl-d-aspartate-induced burst firing in rat ventral tegmental neurons. Neuroscience. 1994;58:201–206. doi: 10.1016/0306-4522(94)90167-8. [DOI] [PubMed] [Google Scholar]
- 69.Silva NL, Bunney BS. Intracellular studies of dopamine neurons in vitro: pacemakers modulated by dopamine. Eur J Pharmacol. 1988;149:307–315. doi: 10.1016/0014-2999(88)90661-9. [DOI] [PubMed] [Google Scholar]
- 70.Stewart J, Vezina P. Microinjections of Sch-23390 into the ventral tegmental area and substantia nigra pars reticulata attenuate the development of sensitization to the locomotor activating effects of systemic amphetamine. Brain Res. 1989;495:401–406. doi: 10.1016/0006-8993(89)90236-9. [DOI] [PubMed] [Google Scholar]
- 71.Suaud-Chagny MF, Chergui K, Chouvet G, Gonon F. Relationship between dopamine release in the rat nucleus accumbens and the discharge activity of dopaminergic neurons during local in vivo application of amino acids in the ventral tegmental area. Neuroscience. 1992;49:63–72. doi: 10.1016/0306-4522(92)90076-e. [DOI] [PubMed] [Google Scholar]
- 72.Vezina P. Amphetamine injected into the ventral tegmental area sensitizes the nucleus accumbens dopaminergic response to systemic amphetamine: an in vivo microdialysis study in the rat. Brain Res. 1993;605:332–337. doi: 10.1016/0006-8993(93)91761-g. [DOI] [PubMed] [Google Scholar]
- 73.Vezina P. D1 dopamine receptor activation is necessary for the induction of sensitization by amphetamine in the ventral tegmental area. J Neurosci. 1996;16:2411–2420. doi: 10.1523/JNEUROSCI.16-07-02411.1996. [DOI] [PMC free article] [PubMed] [Google Scholar]
- 74.Wang RY. Dopaminergic neurons in the rat ventral tegmental area. I. Identification and characterization. Brain Res Rev. 1981a;3:123–140. [Google Scholar]
- 75.Wang RY. Dopaminergic neurons in the rat ventral tegmental area. II. Evidence for autoregulation. Brain Res Rev. 1981b;3:141–151. [Google Scholar]
- 76.White FJ. Synaptic regulation of mesocorticolimbic dopamine neurons. Annu Rev Neurosci. 1996;19:405–436. doi: 10.1146/annurev.ne.19.030196.002201. [DOI] [PubMed] [Google Scholar]
- 77.White FJ, Kalivas PW. Neuroadaptations involved in amphetamine and cocaine addiction. Drug Alcohol Depend. 1998;51:141–153. doi: 10.1016/s0376-8716(98)00072-6. [DOI] [PubMed] [Google Scholar]
- 78.White FJ, Wang RY. A10 dopamine neurons: role of autoreceptors in determining firing rate and sensitivity to dopamine agonists. Life Sci. 1984a;34:1161–1170. doi: 10.1016/0024-3205(84)90088-2. [DOI] [PubMed] [Google Scholar]
- 79.White FJ, Wang RY. Pharmacological characterization of dopamine autoreceptors in the rat ventral tegmental area: microiontophoretic studies. J Pharmacol Exp Ther. 1984b;231:275–280. [PubMed] [Google Scholar]
- 80.White FJ, Wang RY. Electrophysiological evidence for A10 dopamine autoreceptor subsensitivity following chronic d-amphetamine treatment. Brain Res. 1984c;309:283–292. doi: 10.1016/0006-8993(84)90594-8. [DOI] [PubMed] [Google Scholar]
- 81.Wilson CJ, Callaway JC. Coupled oscillator model of the dopaminergic neuron of the substantia nigra. J Neurophysiol. 2000;83:3084–3100. doi: 10.1152/jn.2000.83.5.3084. [DOI] [PubMed] [Google Scholar]
- 82.Wise RA. Drug-activation of brain reward pathways. Drug Alcohol Depend. 1998;51:13–22. doi: 10.1016/s0376-8716(98)00063-5. [DOI] [PubMed] [Google Scholar]
- 83.Wolf ME, White FJ, Nassar R, Brooderson RJ, Khansa MR. Differential development of autoreceptor subsensitivity and enhanced dopamine release during amphetamine sensitization. J Pharmacol Exp Ther. 1993;264:249–255. [PubMed] [Google Scholar]


