Abstract
To investigate the role of the basal ganglia in parkinsonian tremor, we recorded hand tremor and simultaneous activity of several neurons in the external and internal segments of the globus pallidus (GPe and GPi) in two vervet monkeys, before and after systemic treatment with 1-methyl-4-phenyl-1,2,3,6-tetrahydropyridine (MPTP) and development of parkinsonism with tremor of 5 and 11 Hz.
In healthy monkeys, only 11% (20/174) of the GPe cells and 3% (1/29) of the GPi cells displayed significant 3–19 Hz oscillations. After MPTP treatment, 39% (107/271) of the GPe cells and 43% (26/61) of the GPi cells developed significant oscillations. Oscillation frequencies of single cells after MPTP treatment were bimodally distributed around 7 and 13 Hz. For 10% of the oscillatory cells that were recorded during tremor periods, there was a significant tendency for the tremor and neuronal oscillations to appear simultaneously.
Cross-correlation analysis revealed a very low level of correlated activity between pallidal neurons in the normal state; 95.6% (477/499) of the pairs were not correlated, and oscillatory cross-correlograms were found in only 1% (5/499) of the pairs. After MPTP treatment, the correlations increased dramatically, and 40% (432/1080) of the cross-correlograms had significant oscillations, centered around 13–14 Hz. Phase shifts of the cross-correlograms of GPe pairs, but not of GPi, were clustered around 0°.
The results illustrate that MPTP treatment changes the pattern of activity and synchronization in the GPe and GPi. These changes are related to the symptoms of Parkinson's disease and especially to the parkinsonian tremor.
Keywords: cross-correlations, neural oscillations, tremor, MPTP, globus pallidus, Parkinson's disease
Parkinson's disease (PD) is the most common movement disorder in the elderly. Its main manifestations are tremor, akinesia, rigidity, and postural instability. The most salient feature of PD is a low-frequency rest tremor (Elble and Koller, 1990; Rajput, 1995). The frequency of this tremor typically ranges between 4 and 6 Hz. Higher frequencies, of up to 9 Hz, can be found, especially in early stages of PD (Deuschl et al., 1998) and in patients with an early (<40 years of age) onset PD (Scholz and Bacher, 1995). Another form of tremor that may be found in PD is postural-action tremor, which is characterized by smaller amplitudes and higher frequencies (Findley et al., 1981; Deuschl et al., 1998).
Treatment of primates with 1-methyl-4-phenyl-1,2,3,6-tetrahydropyridine (MPTP) induces a parkinsonian syndrome (Langston et al., 1984; DeLong, 1990). In most species of monkeys, this syndrome consists mainly of akinesia, rigidity, and postural instability with very little tremor (Tetrud and Langston, 1995). In contrast, in vervet monkeys the symptoms include prolonged episodes of tremor as well (Redmond et al., 1985; Bergman et al., 1990).
The underlying pathology of PD and MPTP-induced parkinsonism is a loss of midbrain dopaminergic neurons (Bernheimer et al., 1973; Gerlach et al., 1996; Pifl et al., 1996). This results in a loss of the dopaminergic innervation to the striatum, affecting the neuronal activity in the striatum and in successive basal ganglia (BG) structures (Lozano et al., 1998; Wichmann and DeLong, 1998).
Previous work revealed changes in the activity of globus pallidus (GP) neurons of MPTP-treated monkeys as compared with healthy ones. Firing rates of GPi cells increased, whereas GPe cells displayed decreased firing rates (Miller and DeLong, 1987; Filion and Tremblay, 1991;Bergman et al., 1994). Single electrode recordings performed in human PD patients during surgical intervention designed to relieve parkinsonian symptoms revealed changes in firing rate similar to those found in primates (Hutchison et al., 1994, 1997; Merello et al., 1999).
Changes in firing patterns and synchronization have also been reported (Filion, 1979; Nini et al., 1995; Hutchison et al., 1997; Bergman et al., 1998a; Hurtado et al., 1999). Previous results from our group (Nini et al., 1995) showed that cross-correlograms in the GP of a normal Rhesus monkey were flat, indicating independent firing of the neurons. In MPTP-induced parkinsonism, synchronous oscillations developed. The present study further examines the changes in the oscillatory activity in the two segments of the GP and explores a possible relationship to the tremor.
Portions of these results have been reported previously in review articles (Bergman et al., 1998a,b) and in abstract form (Raz et al., 1997, 1999).
MATERIALS AND METHODS
Two vervet monkeys (monkeys H and I: Cercopithecus aethiops aethiops, female, weight 3–3.5 kg) were trained to perform a visuomotor task. The monkeys were required to respond to visual cues by making arm movements to receive liquid reward [for details see Raz et al. (1996)]. The monkeys performed the task during recordings in the normal state. In the MPTP-treated state, the monkeys were akinetic and did not perform the task.
Surgical procedures. After training, a stainless steel recording chamber (18 mm internal diameter) was attached to the skull to allow access to the GP. The recording chamber was tilted 50° laterally in the coronal plan, with its center targeted at stereotaxic coordinates A12, H1, and L9 (Contreras et al., 1981).
Surgery was performed aseptically under general anesthesia (induced by ketamine hydrochloride, 13 mg/kg, i.m., and maintained with isoflurane 0.5–1% inhalation anesthesia). The monkeys' health was monitored by a veterinarian, and their fluid consumption, diet, and weight were monitored daily. The monkeys' care and surgical procedures were in accordance with the National Institutes of Health Guide for the Care and Use of Laboratory Animals (1996) and with the Hebrew University guidelines for the use and care of laboratory animals in research, supervised by the institutional animal care and use committee.
Recording procedures and data collection. During recording sessions the monkey's head was immobilized, and four to eight glass-coated tungsten microelectrodes (impedance 0.2–1 MΩ at 1000 Hz) confined within a cylindrical guide (2.2 mm diameter) were advanced into the GP. Each electrode was separately advanced and optimally placed in the vicinity of GP cells. The output of each electrode was amplified with a gain of 5–20 K and band-pass-filtered with a 300–8000 Hz four-pole Butterworth filter. The electrical activity recorded from each electrode was sorted and classified on-line using a template-matching algorithm (Worgotter et al., 1986), implemented by a PC-based spike sorter (MSD, Alpha-Omega Engineering, Nazareth, Israel). The spike trains detected by this system, as well as the behavioral events and other measurements of the monkey's behavior, were recorded for off-line analysis. In some sessions we also recorded the analog output of the electrodes, sampled at 12 kHz per channel, using eight-channel digital audio tape (Teac, RD-130T, Teac Corporation, Tokyo, Japan).
Spike trains were divided into two groups according to the quality of their isolation. Well isolated spike trains are likely to be emitted by single neurons, whereas poorly isolated ones may result from a mixture of the spikes emitted by more than one neuron (usually two to three single cells). The two groups were therefore analyzed separately. Results from the two groups are presented together, unless significant differences were observed. Only stable spike trains (as judged by stable spike waveforms, stable firing rates, and consistent responses to behavioral events) were included in this study. All cells included in the study were recorded for >150 sec. Our sample was not biased toward task-related or movement-related cells.
During most of the recording sessions, a miniature monoaxial accelerometer (352A22, PBC, Depew, NY) was attached to the monkey's contralateral hand to measure hand movements and to assess the tremor of the parkinsonian monkey. Parkinsonian akinesia was measured by daily recordings of the spontaneous cage activity of the monkeys. This was done using reflected sonar beams (Young et al., 2000). Recordings were performed for 30 min, after feeding in the cage. During these recordings, the monkey was left alone and undisturbed in the room. Sonar output was sampled at 100 Hz in two perpendicularly oriented channels (measuring movement in the horizontal and vertical plains). The SD of this signal was used to estimate the degree of akinesia.
MPTP treatment. After 11 and 12 recording days in the normal state from monkeys H and I, respectively, the monkeys were treated with the neurotoxin MPTP (Aldrich, Milwaukee, WI). The treatment comprised four daily intramuscular injections of 0.5 and 0.4 mg/kg in monkeys H and I, respectively. The monkeys developed severe parkinsonism 3–4 d after initiation of the treatment. Recordings were resumed 5 and 3 d after completion of the treatment in monkeys H and I, respectively.
Data analysis. We performed quantitative analysis of the tremor frequencies, single cell oscillations, correlated activity in pairs of cells, and relationship of the single cell oscillations to the tremor. For all measured phenomena we set a threshold based on the data set for optimal detection. In all cases same threshold was used for the data before and after MPTP treatment.
Tremor was estimated using the power spectrum of the accelerometer output. The data were segmented into 2.56 sec segments. A power spectrum was calculated for each such segment, allowing 0.4 Hz resolution of the frequencies. We estimated the frequency of the tremor by finding the peaks in the power spectrum between 3 and 19 Hz (>3 and <19 Hz). For every peak in this range we defined a signal-to-noise ratio (SNR) as the difference between the maximum power and the average of the power spectrum (0–50 Hz), divided by the SD of the power spectrum (Lenz et al., 1988). A peak was considered significant if the SNR was larger than 3 SD.
Single-cell periodic oscillations were detected using the autocorrelograms of all recorded spike trains, calculated for ±500 msec offset with bin size of 1 msec. The power spectra of the spike trains were calculated by the Fourier transform of the autocorrelograms, allowing 1 Hz resolution of the frequencies. The power spectra were calculated after removing the trough of the refractory period around time 0 in the autocorrelograms (reducing high-frequency noise) and after subtracting the average firing rate of the cell (reducing the DC offset). A cell was considered oscillatory if a significant peak was found in the power spectrum between 3 and 19 Hz (>3 and <19 Hz). For every peak we calculated the SNR in a similar fashion to the tremor, i.e., the difference between the peak power and the mean power between 3 and 30 Hz, divided by the SD of the entire power spectrum (0–500 Hz, in this case). Additionally, an oscillation index (OI) was calculated for all peaks. The OI was defined as the area under the peak, divided by the total power in the power spectrum. A peak was considered significant if the SNR was larger than 5 SD or if it had an OI of >5%. For cells with more than one significant peak (between 3 and 19 Hz), we measured the power and frequency of all peaks and considered the cell as oscillatory in all of these frequencies.
Correlated activity of cells was estimated using the cross-correlograms of pairs of recorded cells. Cross-correlograms were computed only for pairs recorded by different electrodes to ensure that all pairs reported are indeed pairs of different cells. Only correlograms with over 500 spikes for each cell, recorded simultaneously for >150 sec, were included in the study. The correlograms were calculated for ±500 msec offset, using 1 msec bins. We tested the null hypothesis of independent activity (i.e., flat cross-correlogram) by searching for significant peaks and troughs and by searching for periodic oscillations in the cross-correlograms. A cross-correlogram was considered to have a significant peak if there were more than three consecutive bins with a value higher than the baseline firing rate by at least 2.5 SD. Baseline firing rate and SD were estimated using the first and last 200 msec of the cross-correlogram. The same analysis was repeated to find significant troughs. The power spectra of all the cross-correlograms were calculated after subtracting the baseline firing rate (reducing the DC offset). We used the same methods described for the autocorrelograms to define oscillatory cross-correlograms and measure their frequency. We also estimated the phase shift of the oscillatory cross-correlograms at the peak frequency from the phase of the Fourier transform of the cross-correlogram. Phase shifts larger than 180° were corrected to the complementary phase (equal to the phase of the same pair after switching between the reference and trigger unit).
To explore the relationship between neuronal oscillatory activity and tremor, we cut the data into segments lasting 20.48 sec. For each such segment we calculated the power spectrum of the tremor and the neuronal activity (smoothed using a 25 msec-wide Hamming window and down-sampled to 100 Hz). We calculated the SNR for both power spectra. As before, tremor segments with SNR >3 and neuronal oscillations with SNR >5 were considered significant. Segments included two oscillatory signals, no oscillatory signal, or one oscillatory signal. For each cell we used the χ2 test to estimate the probability of getting this distribution by chance. The coherence function of the tremor and neuronal oscillation was also calculated for short data segments.
Histological analysis. At the conclusion of the experiments, 47 d after MPTP treatment, monkey I was killed with an overdose of sodium pentobarbital. Monkey H, who was strongly affected by the MPTP treatment, survived only 20 d. Both monkeys were perfused transcardially with normal saline, followed by 4% formaldehyde. Alternate 50 μm sections were stained with cresyl violet and tyrosine hydroxylase immunohistochemistry. Recording locations were verified by histological reconstruction of the guide tube and the tracks of the electrode. The tyrosine hydroxylase immunohistochemistry data were used to assess the degree of dopaminergic cell loss in the midbrain.
RESULTS
General effect of MPTP treatment
The MPTP treatment induced severe parkinsonian symptoms in both monkeys. The monkeys displayed akinesia, severe postural abnormalities, including flexed posture, rigidity, and tremor. They could not feed themselves and required feeding with a liquid diet (Ensure Plus, Abbott Laboratories). We did not perform a quantitative analysis of the tyrosine hydroxylase immunohistochemistry results. However, qualitative examination of the tyrosine hydroxylase immunohistochemistry slides clearly revealed severe loss of dopaminergic cells in the midbrain of both monkeys matching the severity of the induced parkinsonism.
On the whole, the severity of the parkinsonism induced in monkey H was greater than that of monkey I. Monkey I developed severe parkinsonian symptoms (Elsworth et al., 2000) but to a lesser extent. Monkey H showed no clinical improvement during the recordings, whereas monkey I improved clinically toward the end of the recordings and could perform simple movements like reaching for fruit. However, even in this state it was severely akinetic and needed nutritional support and feeding.
The effect of MPTP treatment on spontaneous movement of the monkeys
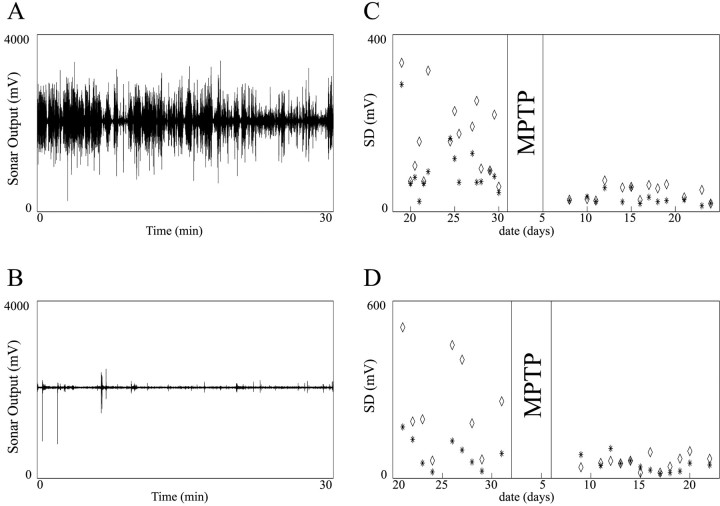
Spontaneous movements of the monkeys in their home cages were recorded in 15 and 9 sessions of monkey H and I, respectively, before MPTP treatment, and in 13 and 12 sessions of monkey H and I, respectively, after MPTP treatment. Figure1, A and B, demonstrates a clear decrease of spontaneous movements of the monkeys after MPTP treatment.
Fig. 1.
Spontaneous movements are reduced after MPTP treatment. The monkey's spontaneous movements in its home cage were measured daily using two reflected sonar beams. Each session lasted 30 min, and each channel was sampled at 100 Hz. A,B, Examples of spontaneous movements of monkey H before and after MPTP treatment, respectively. C,D, SDs of sonar traces of monkeys H and I, respectively, before and after MPTP treatment. Marked areas represent the MPTP injection days (no recordings were performed during that time). ⋄ and asterisks represent horizontal and vertical sonar beams, respectively.
Both monkeys showed decrease in the average SD of activity per session after MPTP treatment. In monkey H (Fig. 1C), the SD of vertical movements dropped by 70% and of horizontal movements by 74% (p < 0.001 for both, t test). In monkey I (Fig. 1D), the SD of vertical movements dropped by 45% (p < 0.05, t test) and of horizontal movements by 79% (p < 0.001,t test).
Tremor in the parkinsonian monkeys
Clinical tremor was observed in both monkeys as early as the last day of MPTP injection and was fully developed within 1 week. The tremor was usually action/postural, appearing mainly in the axial muscles. However, rest tremor and distal muscle tremor were also observed. The tremor often occurred during feeding and other care of the monkey.
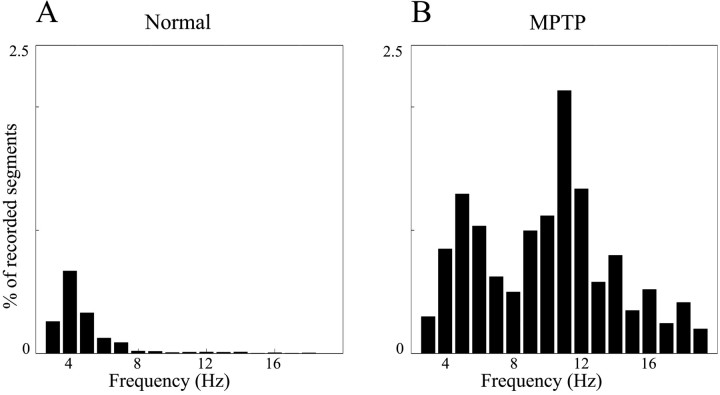
In the normal state, the monkeys performed a behavioral task. In the task the monkeys waited for an instruction to move (a visual cue) with no hand movement. After the instruction the monkeys reached toward a target key (Fig.2A,B). In the normal state, only 1.6% (0.4% in monkey H, 4.2% in monkey I) of the recorded accelerometer segments had a significant peak between 3 and 19 Hz. After MPTP the power spectra were dominated by the tremor oscillations (Fig. 2C,D). In this state, 13.3% (16.8% in monkey H, 10.8% in monkey I) of the recorded accelerometer segments had a significant peak between 3 and 19 Hz.
Fig. 2.
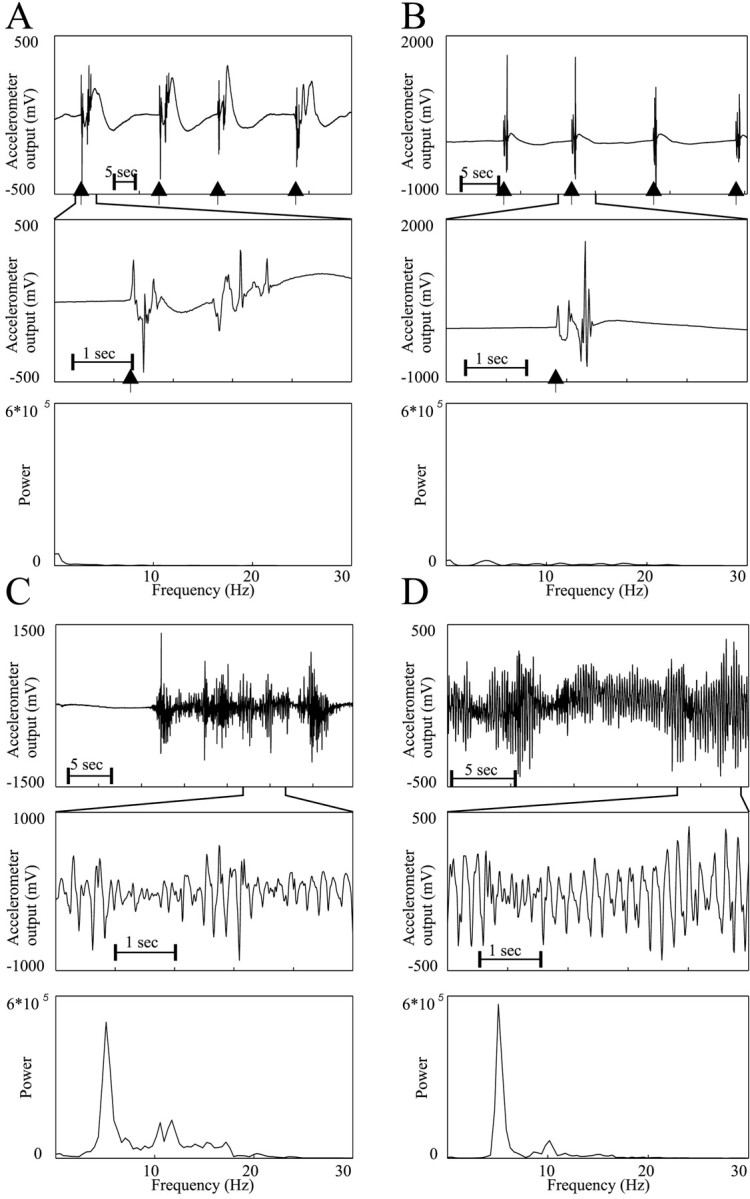
Examples of normal movements and tremor.A, B, Accelerometer recording from monkeys H and I, respectively, in the normal state during task performance. C, D, Accelerometer recording from monkeys H and I, respectively, after MPTP treatment.Top traces display a segment of accelerometer output sampled at 100 Hz. Black arrowhead represents the release of the central key (beginning of movement). Middle traces show an enlargement of 5 sec from the top trace. The bottom plots depict the power spectra of the corresponding top traces.
The distributions of these frequencies are plotted in Figure3. Overall, the tremor frequencies were distributed bimodally around 5 and 11 Hz. On examination of the distribution of tremor frequencies after MPTP administration, it seemed that the tremor phenomena evolved over time (Fig.4A,C). During the first few days after MPTP administration, there was a marked tendency of the tremor to be centered in the low-frequency range (4–6 Hz). After ∼1 week, tremor appeared in the high-frequency range (10–14 Hz) as well. Similar results were obtained for oscillatory cells and will be discussed below.
Fig. 3.
Distribution of the frequencies of significant peaks in the power spectra of segments of accelerometer recordings. Only peaks with SNR >3 SD are included. Segment duration was 2.56 sec. Data of both monkeys were lumped together. A, Distribution in the normal state, n = 79,761 segments. B, Distribution after MPTP treatment,n = 111,755 segments.
Fig. 4.
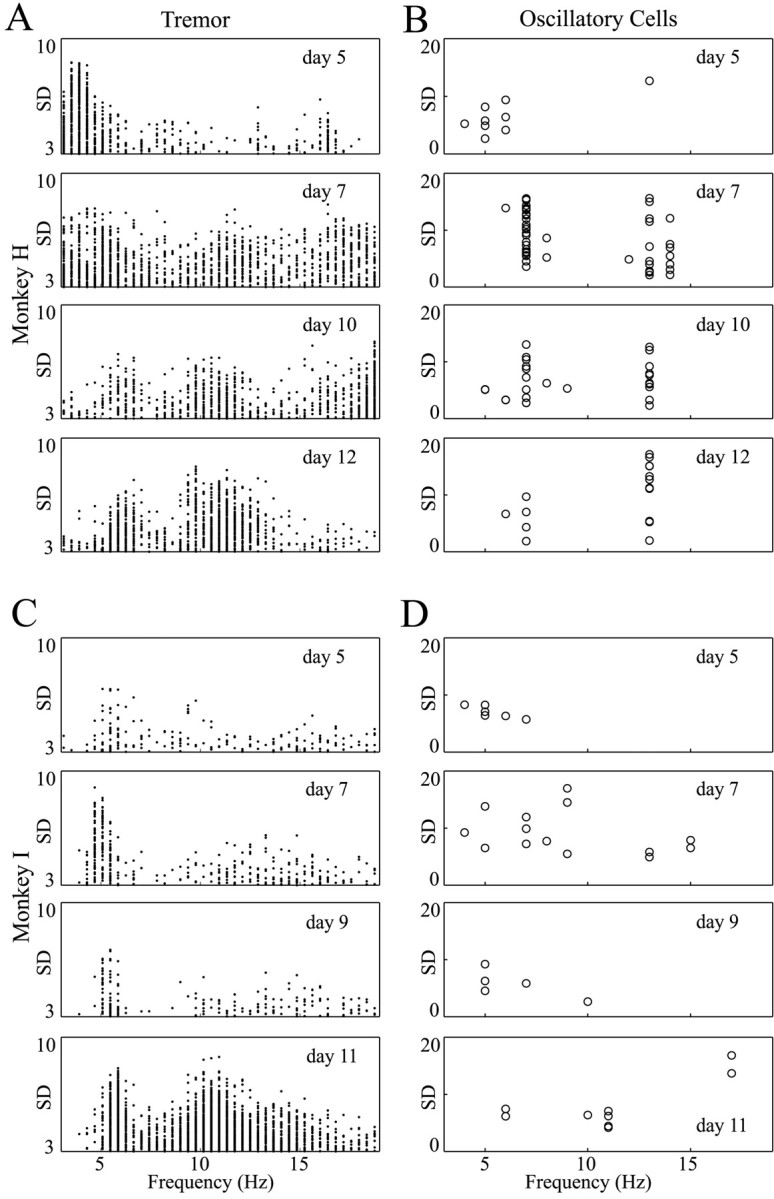
Evolution of tremor and oscillatory activity after MPTP treatment. Each box contains the results of one recording day. In the left column, each point represents a significant tremor segment (duration: 2.56 sec). In the right column, each circle represents a neuron with significant average oscillations. Only peaks between 3 and 19 Hz are shown. A, C, Tremor recorded from monkeys H and I, respectively. B, D, Oscillatory GP cells recorded from monkeys H and I, respectively. The number of days after the last MPTP injection is written on each plot. In both monkeys the tremor in the first few days was mainly ∼4–6 Hz, but as time evolved tremor appeared in the higher frequencies (10–14 Hz) as well. The oscillatory activity of neurons behaved in a similar fashion. This was more pronounced in monkey H, which was more severely parkinsonian than monkey I.
Neuronal database
During 23 recording days in the normal state (11 d with monkey H, 12 d with monkey I), we recorded the activity of 215 GP cells. Using histological and electrophysiological criteria (DeLong, 1972), we identified 174 of the cells as GPe cells, 29 as GPi cells, and 12 as “border” cells.
After MPTP treatment, 18 recording days were performed (9 in monkey H and 9 in monkey I). During this period we recorded the activity of 349 cells (271 GPe cells, 61 GPi cells, and 17 border cells). Note, however, that electrophysiological differentiation between GPe and GPi cells proved more difficult in this state, because cells in both areas changed their firing patterns. In this state, we based our estimation of the cell location mainly on the mapping of the area acquired in the normal state and on the histological reconstruction. However, a few cells may have been classified to the wrong nucleus in this state. The monkeys could not perform the task in the MPTP-treated state, so the recording sessions in this state were done with only external cues (including the reward). In most of these sessions the monkeys did not perform any movements and sometimes fell asleep during the session. Table 1 shows the number of single units and cell mixtures recorded in the two monkeys in each location and state.
Table 1.
Neuronal database: number of cells recorded from the different structures in the different states
| Monkey | State | GPe | GPi | Border | |||
|---|---|---|---|---|---|---|---|
| Single unit | Mixture of units | Single unit | Mixture of units | Single unit | Mixture of units | ||
| H | Normal | 42 | 46 | 5 | 3 | 7 | 4 |
| MPTP | 58 | 75 | 10 | 30 | 8 | 1 | |
| I | Normal | 43 | 43 | 8 | 13 | 1 | |
| MPTP | 62 | 76 | 9 | 12 | 4 | 4 | |
| Total | Normal | 85 | 89 | 13 | 16 | 7 | 5 |
| MPTP | 120 | 151 | 19 | 42 | 12 | 5 | |
The average recording time per cell was 2280 sec (38 min). The maximum recording time was 2.5 hr. The average number of spikes was 134,000 spikes per cell.
Effects of MPTP on firing rates of single cells
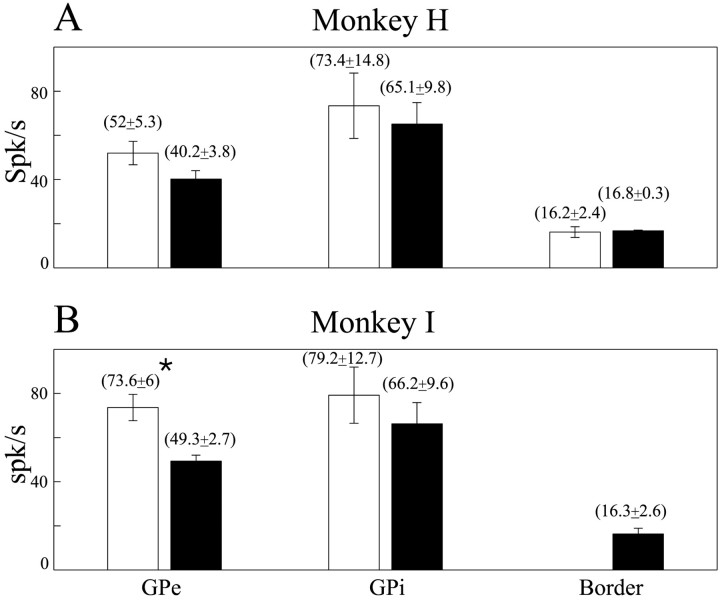
The average firing rates were calculated only for well isolated units. However, units consisting of mixtures of cells showed very similar results. The firing rates of the two monkeys in the different states are presented in Figure 5. The firing rates of GPe cells decreased by 23% (p = 0.07, t test) in monkey H and 33% (p< 0.01, t test) in monkey I after induction of parkinsonism. The firing rates of GPi cells were higher than those of GPe cells in both states. The firing rates of GPi cells also decreased after MPTP treatment. However, the decrease was not significant and much smaller compared with GPe cells (11% for monkey H and 20% for monkey I). Border cells did not display changes in firing rate after induction of parkinsonism.
Fig. 5.
Average firing rates of pallidal cells in the normal and parkinsonian state. A, Monkey H.B, Monkey I. Mean firing rates of well isolated cells and SEM are given in brackets. Error bars represent the SEM. Open bars are the mean firing rate of cells recorded in the normal state; black bars are after MPTP treatment. The bars on left are for GPe cells, bars in middle are for GPi cells, and bars on right are for border cells. The number of cells is given in Table 1. *Significant difference atp < 0.01, t test.
Changes in the firing patterns of single cells: periodic oscillations
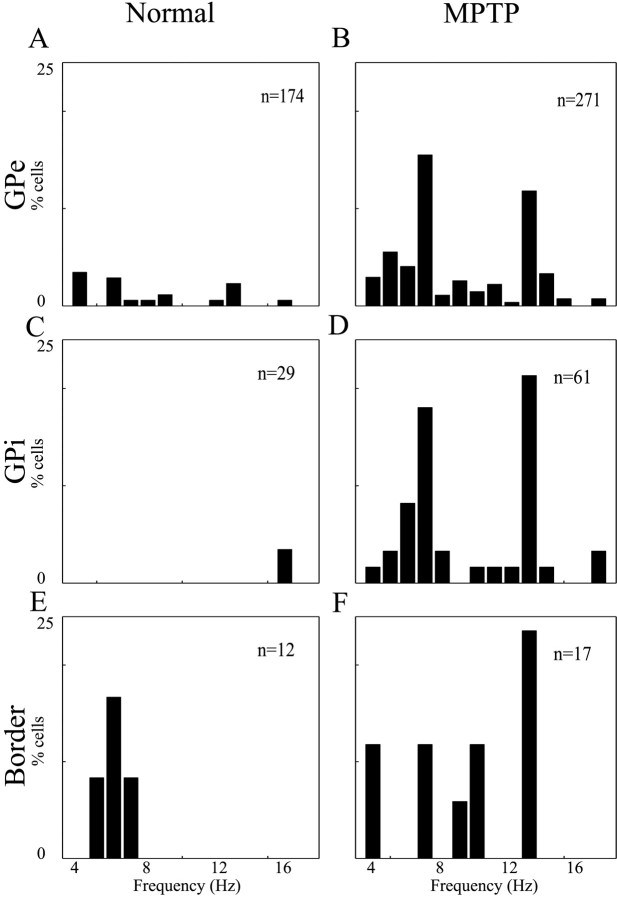
In the normal state, 11% (20/174) of the recorded cells in the GPe and 3% (1/29) in the GPi had oscillatory autocorrelograms (Fig.6A–C). There was no significant difference between well isolated units and mixtures. Only border cells had a considerable portion of oscillatory neurons in this state: 33% (4/12) of the border cells were oscillatory. However, border cell oscillations were composed of single spikes, unlike other GP structures that oscillate with bursts.
Fig. 6.
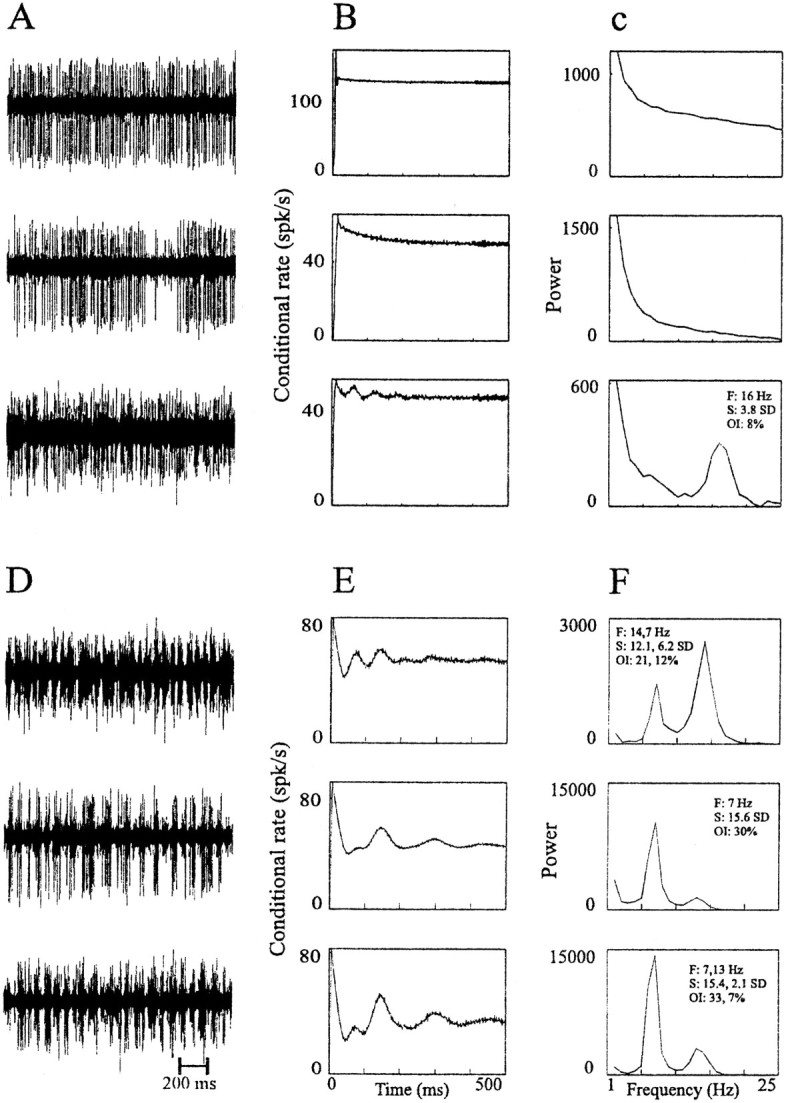
Examples of raw data, autocorrelograms, and power spectra of GP cells. A–C, Cells recorded in the normal state. Top and bottom traces are of GPi cells, and middle trace is of GPe cell. D–F, Cells were recorded in the MPTP-treated state; all of the correlograms shown are of GPe cells.A, D, Examples of 2 sec of raw data.B, E, Autocorrelograms of the respective cell. C, F, Power spectra of the respective autocorrelograms. Raw data are filtered at 300–5000 Hz and sampled at 12,000 Hz. Autocorrelograms are calculated for 500 msec, using 1 msec bins. The power spectrum is calculated by taking the Fourier transform of the autocorrelograms from time −500 to 500 msec after removing the trough around time 0 and after subtracting the average firing rate. The details of each cell with significant oscillations are given on the power spectrum graph. F, Frequency of the significant peaks; S, signal-to-noise ratio; OI, oscillation index. In cases with more than one significant peak, the details of the peaks appear in the order of their strength.
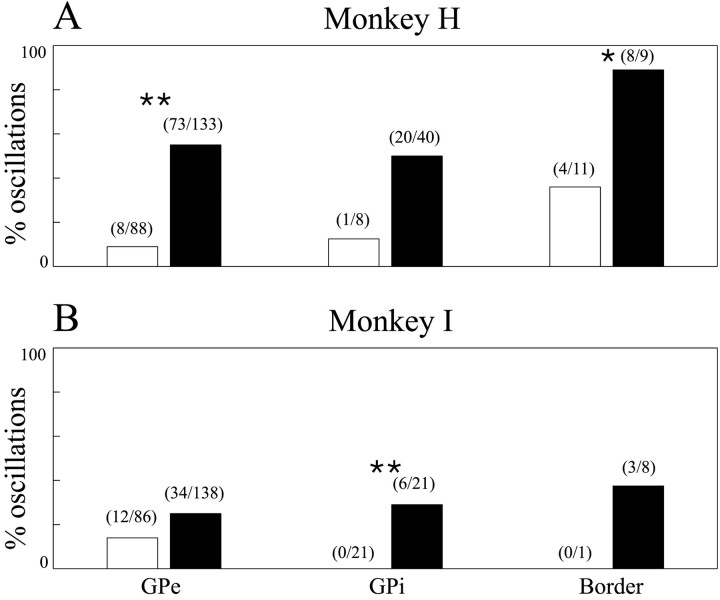
After induction of parkinsonism, 39% (107/271) of the cells in the GPe, 43% (26/61) of the cells in the GPi, and 65% (11/17) of the border cells had oscillatory autocorrelograms (Fig.6D–F). It can be seen that the oscillatory autocorrelograms are a result of rhythmic bursting of the recorded cells (Fig. 6D). Figure7 depicts the number and percentage of neurons with 3–19 Hz periodic oscillations in the two monkeys and the two states. As before, there was no significant difference between the well isolated units and cell mixtures. There was, however, a large difference in the fraction of oscillatory cells between the monkeys after MPTP treatment (Fig. 7). Monkey H had twice the amount of oscillatory neurons as monkey I. This difference between the monkeys was present in both nuclei and border cells and was consistent with the difference in severity of clinical symptoms between the two monkeys.
Fig. 7.
Percentage of oscillatory cells in the normal and parkinsonian state. A, Monkey H. B, Monkey I. Percentages of oscillatory cells are plotted asbars. Numbers of oscillatory cells of all recorded cells are given in brackets. Open bars are cells recorded in the normal state; black bars are after MPTP treatment. Left two bars are for GPe cells,middle two bars are for GPi cells, and right two bars for border cells. *Significant difference atp < 0.05, χ2 test. **Significant difference at p < 0.01, χ2test.
Cells with significant oscillations (OI >5% or SNR >5 SD) in the MPTP-treated state had stronger oscillations compared with cells recorded in the normal state (Fig. 8). The average OI of these cells increased from 0.08 ± 0.05 for cells with significant oscillations in the normal state to 0.12 ± 0.08 after MPTP treatment (p < 0.01,t test). The average SNR tended toward an increase after treatment (6.5 ± 3.2 to 7.8 ± 4.0), but this increase was not statistically significant. The difference in OI values was significant for GPe cells (p < 0.05,t test). However, in the normal state only one GPi cell and four border cells were oscillatory, so we could not estimate the change in OI and SNR of oscillatory cells in these nuclei. There was no significant difference in the strength of single cell oscillations between the two monkeys.
Fig. 8.
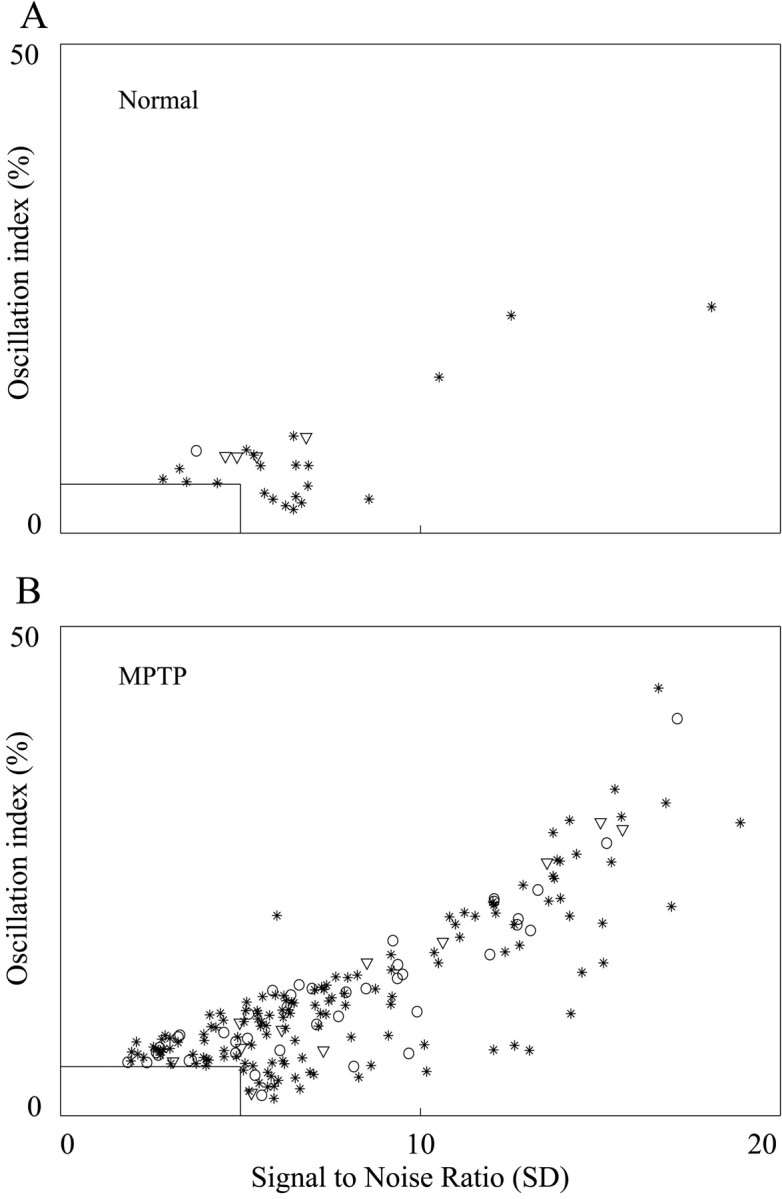
Oscillation strength of GP cells in normal and parkinsonian state. The x-axis is the signal-to-noise ratio; the y-axis is the oscillation index. Only significant peaks with frequency of 3–19 Hz are shown. A peak is significant if SNR is >5 SD or OI is >5%. A, Oscillations in the normal monkeys. B, Oscillations in the MPTP-treated monkeys. *, GPe cells; ○, GPi cells; ▿, border cells.
The oscillations of GPe and GPi cells in the parkinsonian state were centered at 7 and 13 Hz (Fig.9B,D). In the GPe, 30% of the significant oscillations had a frequency of 7 Hz, and 23% had a frequency of 13 Hz. Similar oscillation frequencies were observed in the GPi, where 40% of the oscillations had a frequency of 7 Hz and 32.5% had a frequency of 13 Hz. The oscillatory activity was too rare and weak in the normal state to estimate whether it was confined to a specific frequency (Fig.9A,C).
Fig. 9.
Distribution of the oscillation frequencies of single cells. Frequencies of all the significant peaks between 3 and 19 Hz in the power spectra of the autocorrelograms are shown. The distribution is given as percentage of oscillatory cells of all the cells recorded in the specific nucleus and state. A,B, GPe in the normal and MPTP-treated state, respectively. C, D, GPi in the normal and MPTP-treated state, respectively. E, F, Border cells in the normal and MPTP-treated state, respectively. The total number of cells recorded in each nucleus and state is listed in the top right corner.
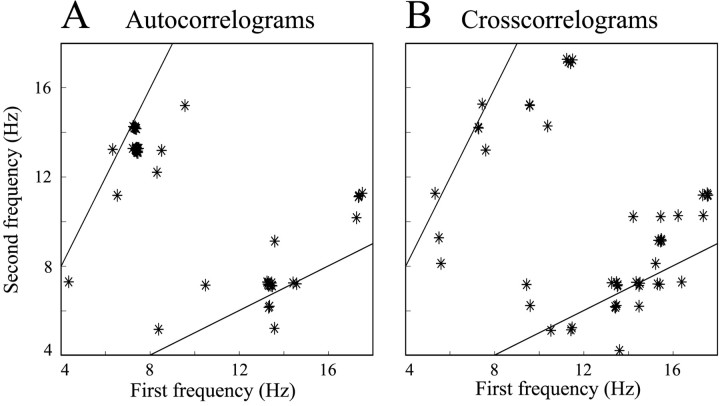
Some of the oscillatory cells in the GPe and GPi oscillated at more than one frequency. A second oscillation frequency was found only in one cell in the normal state. In the parkinsonian state, 47 cells (35% of the oscillatory cells) fired at more than one oscillatory frequency. Thirty-three of these cells were found in the GPe, constituting 31% of the GPe oscillatory cells. In the GPi, 14 cells (54% of the GPi oscillatory cells) followed this pattern. Although we cannot systematically rule out the possibility that the higher frequency in the power spectrum was a harmonic of the lower frequency (Gresty and Buckwell, 1990), there are indications that this is not the case. First, there were cases in which one frequency was not a multiple of the other (Fig. 10A). Second, examination of the raw data and autocorrelograms revealed low-amplitude, high-frequency waves superimposed on slower waves of higher amplitude (Fig. 6E). The appearance of high-frequency waves in the autocorrelograms and high-frequency bursts in the data suggests that a high-frequency activity exists in the data and is not simply a harmonic of the low frequency (Mehta and Bergman, 1995).
Fig. 10.
Relationship between the first oscillation frequency and second oscillation frequency of correlograms with more than one significant oscillation frequency. A, Autocorrelograms. B, Cross-correlograms.x-axis represents the frequency of oscillation frequencies with the highest peak in the power spectrum, andy-axis represents the frequency of the second peak. We jittered the data points by a random value of ±0–0.2 Hz horizontally and vertically to allow the reader to estimate the number of data points in each location. The lines on the graphs represent the cases in which one frequency is a multiplication of the second (y = 2x, y = 0.5x).
After MPTP treatment, the frequencies of oscillatory neurons showed an evolution similar to that of the tremor (Fig. 4). There was a tendency of neurons oscillating at the lower frequency regime to dominate during the first week. In later stages, more neurons were found with oscillations in the higher frequency regime. This was more pronounced in monkey H than in monkey I.
Correlated activity: cross-correlograms database
We calculated all possible cross-correlograms of pairs recorded from different electrodes (distance >0.4 mm). The cross-correlograms were divided into pairs composed only of well isolated neurons and pairs in which at least one of the two was not well isolated. Including only pairs recorded by different electrodes assured us that spikes of one cell could never mix with spikes of the other. In the normal state, we calculated 303 cross-correlograms in monkey H (73 with only well isolated units, 230 with mixtures) and 196 in monkey I (53 with only well isolated units, 143 with mixtures). After MPTP treatment, we calculated 637 cross-correlograms in monkey H (124 with only well isolated units, 513 with mixtures) and 443 in monkey I (89 with only well isolated units, 354 with mixtures). Cross-correlograms were constructed, on average, from 97,905 spikes per neuron and recorded during an average total time of 1697 sec (28 min).
Correlated activity: peaks and troughs
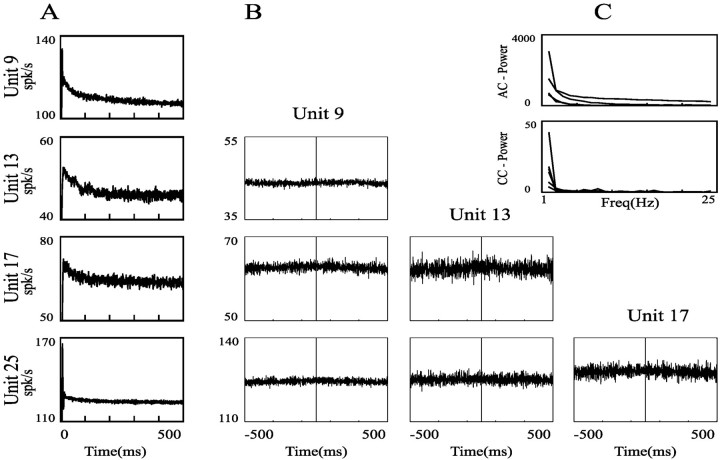
In the normal state, 5% (15/303) of the recorded pallidal pairs in monkey H and 2% (4/196) in monkey I had a significant peak in their cross-correlograms. One percent (4/303) of the recorded pallidal pairs in monkey H and 0.5% (1/196) in monkey I had a significant trough in their cross-correlograms. One cross-correlogram in monkey H and one in monkey I displayed a complex pattern including both peaks and troughs. Overall, most cross-correlograms in this state were flat, and only 4.4% (22/499) had a significant peak or trough. Figure11A depicts typical recordings in the normal state, and Figure12 depicts the auto- and cross-correlograms of the same cells. There was no significant difference between the pairs of well isolated units and all other pairs (Bedenbaugh and Gerstein, 1997). All 22 cross-correlograms with significant effects involved at least one GPe neuron. Eighteen of these cross-correlograms were of pairs of GPe cells, and the other four were between pairs of GPe and border cells. All of the significantly non-flat cross-correlograms in the normal state were non-oscillatory.
Fig. 11.
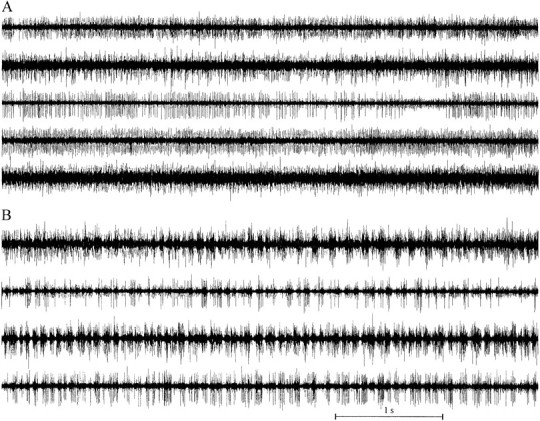
Examples of simultaneous recordings of the activity of a number of cells in the globus pallidus. Electrode output filtered at 300–5000 Hz and sampled at 12,000 Hz. A, Normal monkey. B, MPTP-treated monkey. Auto- and cross-correlograms of these cells are given in Figures 12 and15B.
Fig. 12.
Auto- and cross-correlograms with power spectra of GP cells in a normal monkey. A, Autocorrelograms.B, Cross-correlation matrix. Identification of the trigger unit appears at the top, and identification of the reference unit appears at the left. Bin size was 1 msec, and no smoothing was performed. The y-axis displays conditional firing rate. C, Power spectra of all the autocorrelograms (top) and cross-correlograms (bottom). Cells 9 (Unit 9) and 17 (Unit 17) were from the GPe, and cells 13 (Unit 13) and 25 (Unit 25) were from the GPi. AC, Autocorrelograms; CC, cross-correlograms.
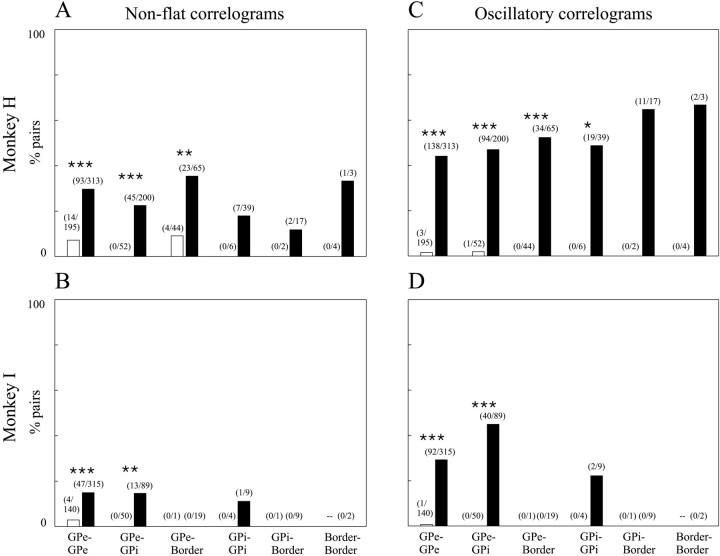
Correlated activity was much more pronounced after MPTP treatment (Fig.13A,B). In this state, 23.5% (150/637) of the recorded pallidal pairs in monkey H and 11.5% (51/443) in monkey I had significant peaks in their cross-correlograms. Eighteen percent (113/637) of the recorded pallidal pairs in monkey H and 7% (31/443) in monkey I had a significant trough in the cross-correlograms. There were 92 correlations with complex patterns including both peaks and troughs in monkey H (54% of the significantly non-flat cross-correlograms) and 21 in monkey I (34% of the significantly non-flat cross-correlograms). Many of these complex patterns consisted of periodic oscillations (see below). Overall, 21.5% (232/1080) of the cross-correlograms after MPTP treatment were significantly non-flat. There was a higher fraction of significantly non-flat cross-correlograms in monkey H than monkey I (Fig.13A,B). There was no significant difference between the pairs of well isolated units and all the other pairs.
Fig. 13.
Percentage of significant non-flat and oscillatory cross-correlograms. A, C, Monkey H. B, D, Monkey I.A, B, Significant non-flat cross-correlograms. C, D, Significant oscillations. Percentages of significant correlograms are plotted asbars. Numbers of significant correlograms of all recorded pairs are given in brackets. Open bars are of pairs recorded in the normal state; black bars are after MPTP treatment. Column order fromleft to right: GPe–GPe pairs, GPe–GPi pairs, GPe–border pairs, GPi–GPi pairs, GPi–border pairs, and border–border pairs. *Significant difference at p< 0.05, χ2 test. **Significant difference atp < 0.01, χ2 test. ***Significant difference at p < 0.001, χ2test.
Correlated activity: oscillations
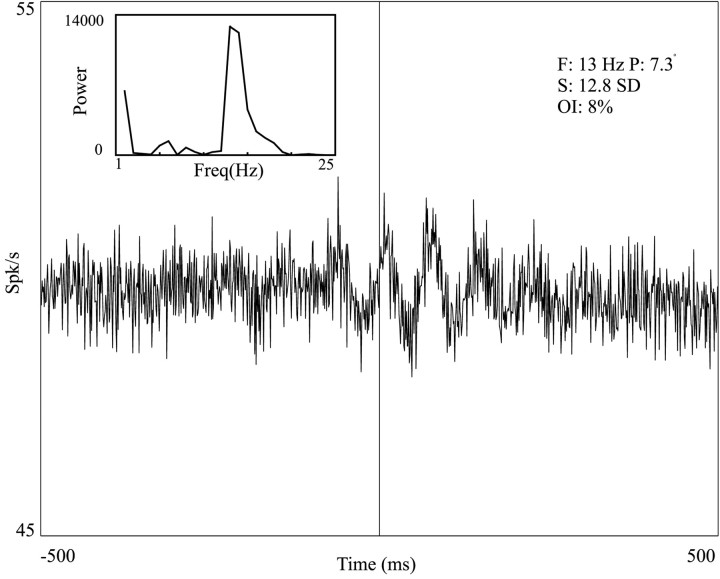
The previous section describes peaks and troughs in cross-correlograms. Most of the non-flat correlograms were also oscillatory (91%, 156/171 in monkey H; 80%, 49/61 in monkey I). Note, however, that identification of periodic oscillations in the cross-correlograms was performed independently of the identification of peaks and troughs (see Materials and Methods). Hence, pairs could have significant correlated oscillations with no significant peaks or troughs in their cross-correlograms. Figure14 demonstrates a typical cross-correlogram with significant oscillations without significant peaks or troughs. Oscillatory cross-correlograms with no significant peaks or troughs were detected in 48% (142/298) of the oscillatory cross-correlograms in monkey H and in 63% (85/134) of these cross-correlograms in monkey I.
Fig. 14.
Cross-correlogram of two GPe cells in an MPTP-treated monkey. Layout is as in Fig. 8. Inset, Power spectrum of the cross-correlogram. This pair displays significant oscillations, but there is no significant peak or trough. Details characterizing the oscillation are given on the graph:F, frequency of oscillatory correlograms;p, phase shift in degrees; S, signal-to-noise ratio; OI, oscillation index.
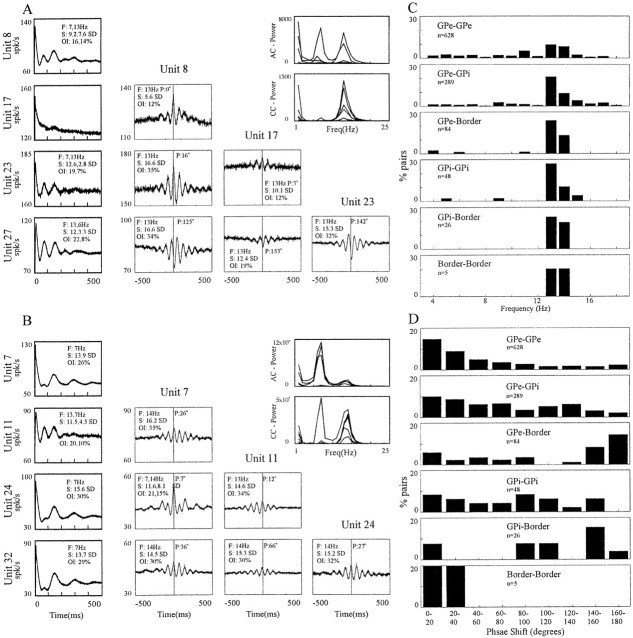
In the normal state, only 1.0% (5/499) of the recorded pallidal neurons had cross-correlograms with significant 3–19 Hz periodic oscillations. Of the five pairs with oscillatory cross-correlograms, four were pairs of well isolated units. We found four oscillatory cross-correlograms in pairs of GPe cells and one between a GPe and GPi cell. This number increased dramatically after MPTP treatment (Fig.13C,D), where 40% (432/1080) of the recorded pairs had oscillatory cross-correlograms. Of the pairs with oscillatory cross-correlograms, 92 were pairs with only well isolated units (43% of the well isolated pairs) and 340 with mixtures (39% of these pairs). There was no significant difference in the fraction of oscillatory correlations between the different nuclei. Figure15, A and B, depicts typical cross-correlograms after MPTP treatment. Most pairs with oscillatory cross-correlograms were composed of at least one cell with an oscillatory autocorrelogram. However, in 17% (75/432) of these pairs, the autocorrelograms of both cells did not display significant oscillations. Typical examples of cells recorded in this state are presented in Figure 11B and their auto- and cross-correlograms are presented in Figure 15B. It can be seen that cells with oscillatory cross-correlograms tend to burst simultaneously.
Fig. 15.
Cross-correlograms and their spectra in the MPTP-treated state. A, B, Auto- and cross-correlograms with power spectra of GP cells in MPTP-treated monkeys. All of the cross-correlograms have multiple significant peaks or troughs, and all of them have significant oscillations. Notice inA that cell 27 (Unit 27) is not in phase with all other cells, whereas in B all cells are phase-locked. In A, cells 8 (Unit 8) and 23 (Unit 23) were from GPe and cells 17 (Unit 17) and 27 (Unit 27) were from GPi. In B, all of the cells were from the GPe. Layout ofA and B is as in Fig. 12. Details characterizing the oscillations are given on the graph:F, frequency of oscillatory correlograms;p, phase shift in degrees; S, signal-to-noise ratio; OI, oscillation index. In cases with more than one significant peak, the details of the peaks appear in order of their strength; AC = autocorrelograms;CC = cross-correlograms. C, Distribution of the frequencies of oscillatory cross-correlograms in the MPTP-treated state. D, Distribution of the phase shifts of oscillatory cross-correlograms in the MPTP-treated state. InC and D the y-axis shows percentage of oscillatory correlograms of all the correlograms recorded from each combination of nuclei. The total number of pairs recorded from each nuclei pair is listed in thegraphs.
We did not compare the strength of oscillation in the cross-correlograms before and after MPTP treatment because there were not enough oscillatory cross-correlograms in the normal state to obtain a reliable estimation. After MPTP treatment, correlated oscillations were stronger and more frequent in monkey H than in monkey I. In monkey H, 47% of the cross-correlograms were oscillatory. The average OI of the cross-correlograms with significant oscillations was 0.121 ± 0.105, and the average SNR was 11.5 ± 4.0. In monkey I, 30% of all cross-correlograms were oscillatory, the average OI was 0.58 ± 0.05 (p < 0.01, t test), and the average SNR was 9.7 ± 3.9 (p < 0.01,t test).
The oscillation frequencies in the parkinsonian state were centered at 13–14 Hz (Fig. 15C). The effect was weaker in the pairs of GPe cells than in all other groups. Overall, 54% (262/482) of the significant oscillation frequencies (including second significant oscillation frequencies; see below) were in the 13–14 Hz frequency range. This effect was weaker in pairs of well isolated units than in mixtures: 39% (43/109) compared with 59% (219/373). This difference was most notable in pairs of GPe cells, where the frequencies of oscillatory pairs with only well isolated neurons were widely distributed. The 13–14 Hz oscillations were always stronger than the rest of the oscillations. The mean OI in this regimen was 0.135 ± 0.108, whereas the mean OI for the rest of the significant oscillations was 0.056 ± 0.049. The mean SNR was 12.3 ± 3.6 for this regimen and 9.1 ± 3.9 for the rest of the significant oscillations.
No second oscillation frequency was observed in any of the pairs in the normal state. In the parkinsonian state we found 47 pairs (11% of pairs with oscillatory cross-correlograms) with more than one oscillation frequency. Both cells had more than one significant oscillation frequency in only two of these pairs, and one of the cells displayed this phenomenon in 19 pairs. These results imply that the second oscillation frequency in the cross-correlograms is not a simple reflection of the single-cell oscillations. As for the autocorrelograms, we cannot rule out the possibility that the higher frequency in the power spectrum is a harmonic of the lower frequency. However, there are many correlograms in which the low frequency is not a multiplication of the higher frequency (Fig. 10B). Examination of the cross-correlograms also revealed similar results of low-amplitude high-frequency oscillations superimposed on high-amplitude low-frequency oscillations [see Fig. 15Bcross-correlogram of cells 7 (Unit 7) and 24 (Unit 24)], implying two independent processes in the cross-correlograms as well.
The phase shifts of oscillatory correlations in the MPTP-treated state were different in the different nuclei (Fig. 15D). Pairs of GPe cells had phase shifts centered on 0°. The phase shifts of pairs of GPi cells and pairs of GPe and GPi cells were widely distributed. GPe and border cells had phase shifts centered at 180°. However, this was mainly because of two border cells that were in anti-phase to all other cells recorded in the same session. Thus, the significance of this result is yet to be determined.
Relationship between the oscillatory neuronal activity and the tremor
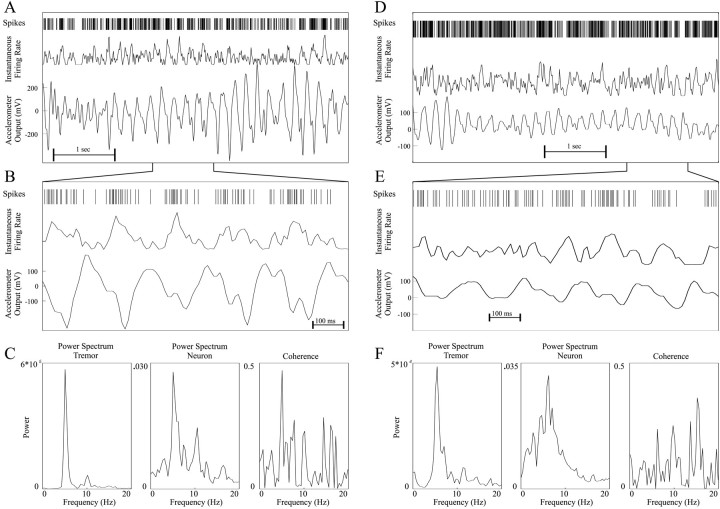
Examination of the raw data indicates that both oscillatory activity and tremor are dynamic phenomena. Tremor was present in some episodes but not in others, and tremor frequency occasionally varied either between episodes or within episodes. A similar pattern was found for the neuronal activity: namely, different cells exhibited a different number of oscillatory episodes and their frequency sometimes varied between the different episodes. An example of such a cell is given in Fig. 16, in which the same cell is oscillatory at 5.1 Hz during one recording session (Fig. 16C, middle) and at 6.2 Hz during a different session (Fig. 16F, middle). There were data segments in which a cell and tremor had significant power in the same frequency as the tremor, as well as a significant coherence function (Fig. 16A–C). However, other segments of the same cell displayed very little coherence to the tremor (Fig. 16D–F).
Fig. 16.
An example of the activity of a GPi cell recorded simultaneously with tremor. The recordings are from monkey I in the MPTP-treated state. A, D, Five seconds of simultaneous recordings. The top trace is the spike train, the middle trace is the spike train smoothed with a digital Hamming window 20 msec wide, and the bottom trace is the accelerometer output. B,E, One second of data from A andD. It can be seen in B that the spike train and the tremor are correlated, whereas in E they are not. C, F, Power spectra of the two signals and their coherence function. The spectral analysis was performed over the entire recording segments (23.8 and 34.7 sec for theleft and right segments, respectively).
To estimate the rate of common occurrences of neuronal oscillations and hand tremor, we searched the segmented data (segment duration of 20.48 sec) for neuronal oscillations and tremor. To do that, we selected cells that were recorded during a period that included segments with hand tremor and segments during which the cell activity was oscillatory. We then calculated the 2 × 2 χ2 distribution for all possible combinations of neuronal oscillations and tremor (counting segments with both oscillations and tremor, segments with no oscillations and no tremor, and segments with only one or the other). For 11% (21/190, 18 GPe, 2 GPi, and 1 border) of these cells there was a significant (p < 0.01) dependence between the timing of tremor and neuronal oscillations. There was a tendency of the recorded segments to be either with both oscillatory or with both non-oscillatory. For the cells with significant dependence, 80% (4162/5203) of the segments were either both oscillatory or both non-oscillatory.
Previous studies (Hutchison et al., 1997) found a linear relationship of the low-range frequencies of neuronal oscillations and tremor. We performed linear regression analysis of the average frequencies of oscillations and tremor over all the recording period and of the average frequencies of oscillations and tremor, choosing only segments with significant oscillations in both signals. However, no significant regression was found in either the entire frequency range (3–19 Hz) or the low frequencies (3–7 Hz). We did find a tendency of the oscillatory cells and the tremor to be in the same frequency regimen according to the bimodal distribution of their frequencies (low frequency, 3–8 Hz; high frequency, 9–18 Hz). However, this was significant only when using SNR >2 for the definition of significant tremor.
DISCUSSION
We studied neuronal activity in the GP of vervet (African green) monkeys before and after MPTP treatment. The results demonstrated dramatic modification of neuronal activity in the GP, including the emergence of oscillatory temporal patterns of single neurons with frequency contents similar to that of the tremor and oscillatory synchronized activity of neuronal pairs confined to the high-frequency range.
Parkinsonism in vervet monkeys
Most electrophysiological studies of MPTP-treated monkeys were conducted on Rhesus monkeys (Miller and DeLong, 1987; Filion and Tremblay, 1991; Nini et al., 1995; Bezard et al., 1998). These monkeys seldom develop tremor. In contrast, MPTP-treated vervet monkeys develop long episodes of tremor (Redmond et al., 1985), similar to those in human patients (Scholz and Bacher, 1995). Interestingly, vervet monkeys were the only species reported to develop a “resting tremor of 4–6 Hz” in early PD models (Goldstein et al., 1976). Tremor frequencies of the MPTP-treated vervet monkeys displayed a bimodal distribution around 5–6 and 11–12 Hz similar to that of human patients. The similar frequency ranges suggest a central origin of the tremor, because peripherally driven tremor should be affected by the different biomechanical characteristics. The higher frequency may be related to postural tremor (Findley et al., 1981), which may be caused by a different mechanism than that of the low-frequency (rest) tremor.
Firing rate of pallidal neurons
In agreement with current models of the BG (Albin et al., 1989;DeLong, 1990; Wichmann and DeLong, 1996; Lang and Lozano, 1998) and previous studies (Miller and DeLong, 1987; Filion and Tremblay, 1991;Boraud et al., 1998), firing rates in the GPe dropped significantly after MPTP treatment. The firing rates in the GPi decreased, unlike in previous studies of Rhesus monkeys (Miller and DeLong, 1987; Filion and Tremblay, 1991) and human physiological studies (Vitek et al., 1993;Hutchison et al., 1994; Beric et al., 1996; Lemstra et al., 1999). However, the decrease of GPi firing rates was not significant. Similarly, less robust changes of the average firing rate of GPi cells in vervet monkeys were reported previously (Bergman et al., 1994;Wichmann et al., 1999). This inconsistency may be because of the difference in species and the chronic effects of levodopa treatment (in the human studies). Other factors may have contributed as well: arousal level of the monkeys, recording techniques (e.g., spike sorting), and different bias in the selection of the recorded cells. Further work is needed to clarify this issue.
Firing pattern of pallidal neurons
A major change in the activity of the GP cells in the parkinsonian state was in the firing pattern. In vitro and in vivo studies (Nambu and Llinas, 1994; Plenz and Kital, 1999;Ruskin et al., 1999; Magill et al., 2000) revealed that GP cells and networks have the tendency toward oscillatory activity. GP cells were reported to form bursting and oscillatory activity in the MPTP primate model of parkinsonism (Miller and DeLong, 1987; Filion and Tremblay, 1991).
In the normal monkeys, 10% of the GP cells demonstrated 3–19 Hz periodic oscillatory activity. This is in line with a previous study (Bergman et al., 1994) using different analysis methods (Karmon and Bergman, 1993) which reported that 5% of the cells demonstrated oscillatory activity in the normal state. After induction of parkinsonism, 41% of GP cells became oscillatory. This suggests that oscillatory activity in the BG is a weak but normal phenomenon, and in the parkinsonian state it increases dramatically in both strength and amount. Oscillatory activity may also be related to the degree of parkinsonism: monkey I was less severely parkinsonian and had fewer oscillations after induction of parkinsonism than monkey H.
Oscillatory activity dominates many regions of the brain during sleep (Steriade et al., 1993, 1994). The monkeys did not perform the task after MPTP treatment and slept during part of the recording time in this state. This raised the possibility that the oscillations reported are a result of the sleep. However, strong oscillatory activity was not dominant in cells recorded during sessions in which the monkeys did not perform the behavioral task and probably slept in the normal state. Furthermore, we found oscillatory activity during sessions in which the monkey was awake after MPTP treatment (data not shown).
In the parkinsonian state, one-third of the oscillatory cells contained oscillations at two frequencies. The high frequency may be a harmonic of the low frequencies (Gresty and Buckwell, 1990). Examination of the raw data and autocorrelograms, however, suggests that the two frequencies emerge by independent processes. Moreover, as reported previously (Filion, 1979), we found that cells shift between different oscillation frequencies.
Correlated activity in the GP of the normal and MPTP-treated monkeys
In agreement with previous reports (Nini et al., 1995), we found that in a normal monkey the firing of cells is typically noncorrelated. More than 95% of the cross-correlograms were flat. The lack of correlated activity supports the notion of “parallel” flow of information through the BG circuitry in the normal monkey (Bergman et al., 1998a).
In the present study we found that 40% of the pallidal pairs exhibited significant synchronous oscillations after MPTP treatment. This is in agreement with previous works that suggested a loss of independence between pallidal neurons after MPTP treatment, based on loss of specificity to passive movement (Filion et al., 1988) and to striatal stimulation (Tremblay et al., 1989). The phase shifts of oscillatory cross-correlograms in our data were different in different nuclei. In GPe they were clustered around zero, and in GPi the distribution was much wider, indicating weaker synchrony in GPi compared with GPe. In a previous study from our laboratory using an MPTP-treated Rhesus monkey (Nini et al., 1995), we grouped GPe and GPi neurons together and found that 19% of the pallidal pairs displayed significant synchronous oscillations and that the phase shifts of these oscillatory cross-correlograms were widely distributed. There is an obvious similarity between our results and the results obtained from the Rhesus monkey. However, the phase shift distribution was totally different, and the fraction of correlated pairs was much higher in the present work (40% compared with 19%). These differences may be key features responsible for the different clinical phenomena between the two species. Nevertheless, we cannot rule out the possibility that the differences are a result of discriminating between the different pallidal nuclei and that the correlated activity is responsible for other parkinsonian phenomena but not the tremor.
The finding that the high-frequency oscillations were found in both auto- and cross-correlograms whereas low-frequency oscillations were found only in the autocorrelograms suggests that the high-frequency oscillations are the result of network dynamics, whereas the low frequency may reflect the dynamics of individual neurons. Oscillatory cells in the GP of normal monkeys were fewer and weaker than in parkinsonian monkeys. Uncorrelated activity kept the oscillations segregated and weak. During coupling, these oscillations presumably increased and propagated throughout the BG–thalamocortical loop. Such a phenomenology of oscillatory neurons has been reported previously (Golomb et al., 1992, 1996). Reports of oscillatory activity in the thalamus and cortex of human PD patients (Lenz et al., 1988; Volkmann et al., 1996; Magnin et al., 2000) support this hypothesis.
Are the neuronal oscillations related to the tremor?
Tremor-related oscillatory activity was reported previously in the GP of human PD patients (Hutchison et al., 1997; Hurtado et al., 1999;Magnin et al., 2000) and monkeys (Filion, 1979; Bergman et al., 1994;Nini et al., 1995). These results led to the hypothesis that neuronal oscillations in the BG cause the parkinsonian tremor. In contrast,Lemstra et al. (1999) found only one cell with significant coherence to the tremor of 44 GPi cells that were recorded simultaneously with the tremor. Our results suggest that the relationship of the tremor and neuronal oscillation is dynamic, thus allowing significant average results as well as examples of short coherent segments.
Both cells and tremor were found to have bimodal distributions of frequency: a low range (5–6 Hz for tremor, 7 Hz for neurons) and a high range (10–13 Hz for tremor, 13–14 Hz for neurons). The shift of the frequencies of the two signals indicates a complex relationship of the oscillatory neuronal activity and the tremor. The number of instances in which there was significant tremor during segments with neuronal oscillations was more than expected by chance in 10% of the studied cells. Furthermore, frequencies of both tremor and oscillatory neural activity evolved in a similar manner after the MPTP treatment. These results suggest a strong relationship between the cells and tremor. However, linear regression analysis failed to show the significant covariation of the average frequencies of tremor and neuronal oscillation reported previously (Hutchison et al., 1997).
An obvious explanation for the lack of significant covariation in our data is a difference in species, but there are also other possibilities. We recorded only hand tremor but did not bias our choice of GP cells, unlike Hutchinson et al. (1997), who chose hand-related GPi cells. Because tremor of different body parts is not correlated (Bergman et al., 1998b; Lauk et al., 1999; Raethjen et al., 2000), we may have included cells related to tremor of different body parts. Moreover, we averaged oscillation frequencies over a long duration, whereas Hutchinson et al. (1997) used frequencies calculated over short time segments. Because tremor and neural oscillations are dynamic, our results included segments with no tremor and no oscillatory neuronal activity, as well as segments with neuronal activity at different frequencies. Averaging over all the data lowered the probability of observing strong covariation. The cell in Figure 16 was strongly coupled to the tremor for a short duration and then decoupled. During the first segment, the cell and tremor had the same frequency and showed a peak in their coherence function. In the second segment, the same cell was not correlated to the tremor.
There seems to be both a temporal and spectral relationship between the neuronal activity and the tremor. Thorough frequency and time domain analysis of these dynamic phenomena is necessary to unveil the specific relations between these phenomena. Nevertheless, we found a significant relationship between the neuronal oscillations and tremor, suggesting that the modification of patterns of activity of single cells and the pattern of correlated activity in the GP constitute the central origin for parkinsonian symptoms, especially the tremor.
Footnotes
The research was supported in part by the Israel Science Foundation, which was founded by the Israel Academy of Sciences and Humanities, and by the United States–Israel Binational Science Foundation. A. Feingold provided help during the data collection. V. Zelanskaya and V. Sharkansky provided technical support. We thank M. Abeles and O. Donchin for providing thoughtful advice and commentary, and T. Wichmann and G. Morris for critical reading.
Correspondence should be addressed to Aeyal Raz, Department of Physiology, The Hebrew University–Hadassah Medical School, P.O. Box 12272, Jerusalem, Israel 91120. E-mail:aeyal@hbf.huji.ac.il.
REFERENCES
- 1.Albin RL, Young AB, Penney JB. The functional anatomy of basal ganglia disorders. Trends Neurosci. 1989;12:366–375. doi: 10.1016/0166-2236(89)90074-x. [DOI] [PubMed] [Google Scholar]
- 2.Bedenbaugh P, Gerstein GL. Multiunit normalized cross correlation differs from the average single-unit normalized correlation. Neural Comput. 1997;9:1265–1275. doi: 10.1162/neco.1997.9.6.1265. [DOI] [PubMed] [Google Scholar]
- 3.Bergman H, Wichmann T, DeLong MR. Reversal of experimental parkinsonism by lesions of the subthalamic nucleus. Science. 1990;249:1436–1438. doi: 10.1126/science.2402638. [DOI] [PubMed] [Google Scholar]
- 4.Bergman H, Wichmann T, Karmon B, DeLong MR. The primate subthalamic nucleus. II. Neuronal activity in the MPTP model of parkinsonism. J Neurophysiol. 1994;72:507–520. doi: 10.1152/jn.1994.72.2.507. [DOI] [PubMed] [Google Scholar]
- 5.Bergman H, Feingold A, Nini A, Raz A, Slovin H, Abeles M, Vaadia E. Physiological aspects of information processing in the basal ganglia of normal and parkinsonian primates. Trends Neurosci. 1998a;21:32–38. doi: 10.1016/s0166-2236(97)01151-x. [DOI] [PubMed] [Google Scholar]
- 6.Bergman H, Raz A, Feingold A, Nini A, Nelken I, Hansel D, Ben-Pazi H, Reches A. Physiology of MPTP tremor. Mov Disord. 1998b;13[Suppl 3]:29–34. doi: 10.1002/mds.870131305. [DOI] [PubMed] [Google Scholar]
- 7.Beric A, Sterio D, Dogali M, Fazzini E, Eidelberg D, Kolodny E. Characteristics of pallidal neuronal discharges in Parkinson's disease patients. Adv Neurol. 1996;69:123–128. [PubMed] [Google Scholar]
- 8.Bernheimer H, Birkmayer W, Hornykiewicz O, Jellinger K, Seitelberger F. Brain dopamine and the syndromes of Parkinson and Huntington. J Neurol Sci. 1973;20:415–455. doi: 10.1016/0022-510x(73)90175-5. [DOI] [PubMed] [Google Scholar]
- 9.Bezard E, Imbert C, Gross CE. Experimental models of Parkinson's disease: from the static to the dynamic. Rev Neurosci. 1998;9:71–90. doi: 10.1515/revneuro.1998.9.2.71. [DOI] [PubMed] [Google Scholar]
- 10.Boraud T, Bezard E, Guehl D, Bioulac B, Gross C. Effects of L-DOPA on neuronal activity of the globus pallidus externalis (GPe) and globus pallidus internalis (GPi) in the MPTP-treated monkey. Brain Res. 1998;787:157–160. doi: 10.1016/s0006-8993(97)01563-1. [DOI] [PubMed] [Google Scholar]
- 11.Contreras CM, Mexicano G, Guzman-Flores CA. Stereotaxic brain atlas of the green monkey (Cercopithecus aethiops aethiops). Bol Estud Med Biol. 1981;31:383–428. [PubMed] [Google Scholar]
- 12.DeLong MR. Activity of basal ganglia neurons during movement. Brain Res. 1972;40:127–135. doi: 10.1016/0006-8993(72)90118-7. [DOI] [PubMed] [Google Scholar]
- 13.DeLong MR. Primate models of movement disorders of basal ganglia origin. Trends Neurosci. 1990;13:281–285. doi: 10.1016/0166-2236(90)90110-v. [DOI] [PubMed] [Google Scholar]
- 14.Deuschl G, Bain P, Brin M. Consensus statement of the Movement Disorder Society on Tremor. Ad Hoc Scientific Committee. Mov Disord. 1998;13[Suppl 3]:2–23. doi: 10.1002/mds.870131303. [DOI] [PubMed] [Google Scholar]
- 15.Elble RJ, Koller WC. Tremor. The Johns Hopkins University; Baltimore: 1990. [Google Scholar]
- 16.Elsworth JD, Taylor JR, Sladek J, Jr, Collier TJ, Redmond DE, Jr, Roth RH. Striatal dopaminergic correlates of stable parkinsonism and degree of recovery in old-world primates one year after MPTP treatment. Neuroscience. 2000;95:399–408. doi: 10.1016/s0306-4522(99)00437-6. [DOI] [PubMed] [Google Scholar]
- 17.Filion M. Effects of interruption of the nigrostriatal pathway and of dopaminergic agents on the spontaneous activity of globus pallidus neurons in the awake monkey. Brain Res. 1979;178:425–441. doi: 10.1016/0006-8993(79)90704-2. [DOI] [PubMed] [Google Scholar]
- 18.Filion M, Tremblay L. Abnormal spontaneous activity of globus pallidus neurons in monkeys with MPTP-induced parkinsonism. Brain Res. 1991;547:142–151. [PubMed] [Google Scholar]
- 19.Filion M, Tremblay L, Bedard PJ. Abnormal influences of passive limb movement on the activity of globus pallidus neurons in parkinsonian monkeys. Brain Res. 1988;444:165–176. doi: 10.1016/0006-8993(88)90924-9. [DOI] [PubMed] [Google Scholar]
- 20.Findley LJ, Gresty MA, Halmagyi GM. Tremor, the cogwheel phenomenon and clonus in Parkinson's disease. J Neurol Neurosurg Psychiatry. 1981;44:534–546. doi: 10.1136/jnnp.44.6.534. [DOI] [PMC free article] [PubMed] [Google Scholar]
- 21.Gerlach M, Gsell W, Kornhuber J, Jellinger K, Krieger V, Pantucek F, Vock R, Riederer P. A post mortem study on neurochemical markers of dopaminergic, GABA-ergic and glutamatergic neurons in basal ganglia-thalamocortical circuits in Parkinson syndrome. Brain Res. 1996;741:142–152. doi: 10.1016/s0006-8993(96)00915-8. [DOI] [PubMed] [Google Scholar]
- 22.Goldstein M, Cesar P, Anagnoste B. Lesions of the nigro-striatal dopamine pathway: effects on the storage and metabolism of striatal dopamine. Pharmacol Ther. 1976;2:89–95. doi: 10.1016/0306-039x(76)90021-0. [DOI] [PubMed] [Google Scholar]
- 23.Golomb D, Hansel D, Shraiman B, Sompolinsky H. Clustering in globally coupled phase oscillators. Physiol Rev. 1992;A45:3516–3530. doi: 10.1103/physreva.45.3516. [DOI] [PubMed] [Google Scholar]
- 24.Golomb D, Wang XJ, Rinzel J. Propagation of spindle waves in a thalamic slice model. J Neurophysiol. 1996;75:750–769. doi: 10.1152/jn.1996.75.2.750. [DOI] [PubMed] [Google Scholar]
- 25.Gresty M, Buckwell D. Spectral analysis of tremor: understanding the results. J Neurol Neurosurg Psychiatry. 1990;53:976–981. doi: 10.1136/jnnp.53.11.976. [DOI] [PMC free article] [PubMed] [Google Scholar]
- 26.Hurtado JM, Gray CM, Tamas LB, Sigvardt KA. Dynamics of tremor-related oscillations in the human globus pallidus: a single case study. Proc Natl Acad Sci USA. 1999;96:1674–1679. doi: 10.1073/pnas.96.4.1674. [DOI] [PMC free article] [PubMed] [Google Scholar]
- 27.Hutchison WD, Lozano AM, Davis KD, Saint Cyr JA, Lang AE, Dostrovsky JO. Differential neuronal activity in segments of globus pallidus in Parkinson's disease patients. NeuroReport. 1994;5:1533–1537. doi: 10.1097/00001756-199407000-00031. [DOI] [PubMed] [Google Scholar]
- 28.Hutchison WD, Lozano AM, Tasker RR, Lang AE, Dostrovsky JO. Identification and characterization of neurons with tremor-frequency activity in human globus pallidus. Exp Brain Res. 1997;113:557–563. doi: 10.1007/pl00005606. [DOI] [PubMed] [Google Scholar]
- 29.Karmon B, Bergman H. Detection of neuronal periodic oscillations in the basal ganglia of normal and parkinsonian monkeys. Isr J Med Sci. 1993;29:570–579. [PubMed] [Google Scholar]
- 30.Lang AE, Lozano AM. Parkinson's disease. Second of two parts. N Engl J Med. 1998;339:1130–1143. doi: 10.1056/NEJM199810153391607. [DOI] [PubMed] [Google Scholar]
- 31.Langston JW, Forno LS, Rebert CS, Irwin I. Selective nigral toxicity after systemic administration of 1-methyl-4-phenyl-1,2,3,6-tetrahydropyrine (MPTP) in the squirrel monkey. Brain Res. 1984;292:390–394. doi: 10.1016/0006-8993(84)90777-7. [DOI] [PubMed] [Google Scholar]
- 32.Lauk M, Koster B, Timmer J, Guschlbauer B, Deuschl G, Lucking CH. Side-to-side correlation of muscle activity in physiological and pathological human tremors. Clin Neurophysiol. 1999;110:1774–1783. doi: 10.1016/s1388-2457(99)00130-3. [DOI] [PubMed] [Google Scholar]
- 33.Lemstra AW, Verhagen ML, Lee JI, Dougherty PM, Lenz FA. Tremor-frequency (3–6 Hz) activity in the sensorimotor arm representation of the internal segment of the globus pallidus in patients with Parkinson's disease. Neurosci Lett. 1999;267:129–132. doi: 10.1016/s0304-3940(99)00343-2. [DOI] [PubMed] [Google Scholar]
- 34.Lenz FA, Tasker RR, Kwan HC, Schnider S, Kwong R, Murayama Y, Dostrovsky JO, Murphy JT. Single unit analysis of the human ventral thalamic nuclear group: correlation of thalamic “tremor cells” with the 3–6 Hz component of parkinsonian tremor. J Neurosci. 1988;8:754–764. doi: 10.1523/JNEUROSCI.08-03-00754.1988. [DOI] [PMC free article] [PubMed] [Google Scholar]
- 35.Lozano AM, Lang AE, Hutchison WD, Dostrovsky JO. New developments in understanding the etiology of Parkinson's disease and in its treatment. Curr Opin Neurobiol. 1998;8:783–790. doi: 10.1016/s0959-4388(98)80122-0. [DOI] [PubMed] [Google Scholar]
- 36.Magill PJ, Bolam JP, Bevan MD. Relationship of activity in the subthalamic nucleus-globus pallidus network to cortical electroencephalogram. J Neurosci. 2000;20:820–833. doi: 10.1523/JNEUROSCI.20-02-00820.2000. [DOI] [PMC free article] [PubMed] [Google Scholar]
- 37.Magnin M, Morel A, Jeanmonod D. Single-unit analysis of the pallidum, thalamus and subthalamic nucleus in parkinsonian patients. Neuroscience. 2000;96:549–564. doi: 10.1016/s0306-4522(99)00583-7. [DOI] [PubMed] [Google Scholar]
- 38.Mehta MR, Bergman H. Loss of frequencies in autocorrelations and a procedure to recover them. J Neurosci Methods. 1995;62:65–71. doi: 10.1016/0165-0270(95)00055-0. [DOI] [PubMed] [Google Scholar]
- 39.Merello M, Balej J, Delfino M, Cammarota A, Betti O, Leiguarda R. Apomorphine induces changes in GPi spontaneous outflow in patients with Parkinson's disease. Mov Disord. 1999;14:45–49. doi: 10.1002/1531-8257(199901)14:1<45::aid-mds1009>3.0.co;2-f. [DOI] [PubMed] [Google Scholar]
- 40.Miller WC, DeLong MR. Altered tonic activity of neurons in the globus pallidus and subthalamic nucleus in the primate MPTP model of parkinsonism. In: Carpenter MB, Jayaraman A, editors. The basal ganglia II. Plenum; New York: 1987. pp. 415–427. [Google Scholar]
- 41.Nambu A, Llinas R. Electrophysiology of globus pallidus neurons in vitro. J Neurophysiol. 1994;72:1127–1139. doi: 10.1152/jn.1994.72.3.1127. [DOI] [PubMed] [Google Scholar]
- 42.Nini A, Feingold A, Slovin H, Bergman H. Neurons in the globus pallidus do not show correlated activity in the normal monkey, but phase-locked oscillations appear in the MPTP model of parkinsonism. J Neurophysiol. 1995;74:1800–1805. doi: 10.1152/jn.1995.74.4.1800. [DOI] [PubMed] [Google Scholar]
- 43.Pifl C, Hornykiewicz O, Giros B, Caron MG. Catecholamine transporters and 1-methyl-4-phenyl-1,2,3,6-tetrahydropyridine neurotoxicity: studies comparing the cloned human noradrenaline and human dopamine transporter. J Pharmacol Exp Ther. 1996;277:1437–1443. [PubMed] [Google Scholar]
- 44.Plenz D, Kital ST. A basal ganglia pacemaker formed by the subthalamic nucleus and external globus pallidus. Nature. 1999;400:677–682. doi: 10.1038/23281. [DOI] [PubMed] [Google Scholar]
- 45.Raethjen J, Lindemann M, Schmaljohann H, Wenzelburger R, Pfister G, Deuschl G. Multiple oscillators are causing parkinsonian and essential tremor. Mov Disord. 2000;15:84–94. doi: 10.1002/1531-8257(200001)15:1<84::aid-mds1014>3.0.co;2-k. [DOI] [PubMed] [Google Scholar]
- 46.Rajput AH. Clinical features of tremor in extrapyramidal syndromes. In: Findley LJ, Koller WC, editors. Handbook of tremor disorders. Marcel Dekker; New York: 1995. pp. 275–291. [Google Scholar]
- 47.Raz A, Feingold A, Vaadia E, Abeles M, Bergman H. In phase neuronal oscillations in the basal ganglia of tremulous MPTP-treated vervet monkeys. Soc Neurosci Abstr. 1997;23:466. [Google Scholar]
- 48.Raz A, Feingold A, Zelanskaya V, Vaadia E, Bergman H. Neuronal synchronization of tonically active neurons in the striatum of normal and parkinsonian primates. J Neurophysiol. 1996;76:2083–2088. doi: 10.1152/jn.1996.76.3.2083. [DOI] [PubMed] [Google Scholar]
- 49.Raz A, Goldberg JA, Vaadia E, Bergman H. Dynamical oscillations of neuronal activity in the globus pallidus of tremulous parkinsonian monkeys. IBRO Abstr. 1999;5:163. [Google Scholar]
- 50.Redmond DE, Roth RH, Sladek JR. MPTP produces classic parkinsonian syndrome in African green monkeys. Soc Neurosci Abstr. 1985;11:166. [Google Scholar]
- 51.Ruskin DN, Bergstrom DA, Kaneoke Y, Patel BN, Twery MJ, Walters JR. Multisecond oscillations in firing rate in the basal ganglia: robust modulation by dopamine receptor activation and anesthesia. J Neurophysiol. 1999;81:2046–2055. doi: 10.1152/jn.1999.81.5.2046. [DOI] [PubMed] [Google Scholar]
- 52.Scholz E, Bacher M. Problems in measurement of parkinsonian tremor. In: Findley LJ, Koller WC, editors. Handbook of tremor disorders. Marcel Dekker; New York: 1995. pp. 293–311. [Google Scholar]
- 53.Steriade M, McCormick DA, Sejnowski TJ. Thalamocortical oscillations in the sleeping and aroused brain. Science. 1993;262:679–685. doi: 10.1126/science.8235588. [DOI] [PubMed] [Google Scholar]
- 54.Steriade M, Contreras D, Amzica F. Synchronized sleep oscillations and their paroxysmal developments. Trends Neurosci. 1994;17:199–208. doi: 10.1016/0166-2236(94)90105-8. [DOI] [PubMed] [Google Scholar]
- 55.Tetrud JW, Langston JW. MPTP-induced parkinsonism and tremor. In: Findley LJ, Koller WC, editors. Handbook of tremor disorders. Marcel Dekker; New York: 1995. pp. 319–332. [Google Scholar]
- 56.Tremblay L, Filion M, Bedard PJ. Responses of pallidal neurons to striatal stimulation in monkeys with MPTP-induced parkinsonism. Brain Res. 1989;498:17–33. doi: 10.1016/0006-8993(89)90395-8. [DOI] [PubMed] [Google Scholar]
- 57.Vitek J, Kaneoke Y, Turner R, Baron M, Bakay R, DeLong M. Neuronal activity in the internal and external segments of the globus pallidus of parkinsonian patients is similar to that in the MPTP-treated primate model of parkinsonism. Soc Neurosci Abstr. 1993;19:1584. [Google Scholar]
- 58.Volkmann J, Joliot M, Mogilner A, Ioannides AA, Lado F, Fazzini E, Ribary U, Llinas R. Central motor loop oscillations in parkinsonian resting tremor revealed by magnetoencephalography. Neurology. 1996;46:1359–1370. doi: 10.1212/wnl.46.5.1359. [DOI] [PubMed] [Google Scholar]
- 59.Wichmann T, DeLong MR. Functional and pathophysiological models of the basal ganglia. Curr Opin Neurobiol. 1996;6:751–758. doi: 10.1016/s0959-4388(96)80024-9. [DOI] [PubMed] [Google Scholar]
- 60.Wichmann T, DeLong MR. Models of basal ganglia function and pathophysiology of movement disorders. Neurosurg Clin N Am. 1998;9:223–236. [PubMed] [Google Scholar]
- 61.Wichmann T, Bergman H, Starr PA, Subramanian T, Watts RL, DeLong MR. Comparison of MPTP-induced changes in spontaneous neuronal discharge in the internal pallidal segment and in the substantia nigra pars reticulata in primates. Exp Brain Res. 1999;125:397–409. doi: 10.1007/s002210050696. [DOI] [PubMed] [Google Scholar]
- 62.Worgotter F, Daunicht WJ, Eckmiller R. An on-line spike form discriminator for extracellular recordings based on an analog correlation technique. J Neurosci Methods. 1986;17:141–151. doi: 10.1016/0165-0270(86)90067-1. [DOI] [PubMed] [Google Scholar]
- 63.Young MS, Young CW, Li YC. A combined system for measuring animal motion activities. J Neurosci Methods. 2000;95:55–63. doi: 10.1016/s0165-0270(99)00156-9. [DOI] [PubMed] [Google Scholar]


