

Abstract
We examined the properties of [Ca2+]i changes that were evoked by backpropagating action potentials in pyramidal neurons in hippocampal slices from the rat. In the presence of the metabotropic glutamate receptor (mGluR) agonists t-ACPD, DHPG, or CHPG, spikes caused Ca2+ waves that initiated in the proximal apical dendrites and spread over this region and in the soma. Consistent with previously described synaptic responses (Nakamura et al., 1999a), pharmacological experiments established that the waves were attributable to Ca2+ release from internal stores mediated by the synergistic effect of receptor-mobilized inositol 1,4,5-trisphosphate (IP3) and spike-evoked Ca2+. The amplitude of the changes reached several micromoles per liter when detected with the low-affinity indicators fura-6F, fura-2-FF, or furaptra. Repetitive brief spike trains at 30–60 sec intervals generated increases of constant amplitude. However, trains at intervals of 10–20 sec evoked smaller increases, suggesting that the stores take 20–30 sec to refill. Release evoked by mGluR agonists was blocked by MCPG, AIDA, 4-CPG, MPEP, and LY367385, a profile consistent with the primacy of group I receptors. At threshold agonist concentrations the release was evoked only in the dendrites; threshold antagonist concentrations were effective only in the soma. Carbachol and 5-HT evoked release with the same spatial distribution ast-ACPD, suggesting that the distribution of neurotransmitter receptors was not responsible for the restricted range of regenerative release. Intracellular BAPTA and EGTA were approximately equally effective in blocking release. Extracellular Cd2+ blocked release, but no single selective Ca2+ channel blocker prevented release. These results suggest that IP3 receptors are not associated closely with specific Ca2+ channels and are not close to each other.
Keywords: pyramidal neuron, dendrite, IP3 receptor, metabotropic receptor, BAPTA, EGTA, carbachol, bis-fura-2, furaptra, endoplasmic reticulum
Synaptically activated action potentials backpropagate over the dendrites of hippocampal pyramidal neurons (Turner et al., 1991; Jaffe et al., 1992; Spruston et al., 1995). There is evidence that the action potentials and the [Ca2+]i increases that are associated with them may be important in the induction of long-term potentiation (LTP) and long-term depression (LTD; Magee and Johnston, 1997; Markram et al., 1997).
When the spikes are activated intrasomatically or antidromically, the associated [Ca2+]iincrease is primarily attributable to Ca2+entry through voltage-sensitive Ca2+channels. The magnitude and spatial distribution of the [Ca2+]i increase depends on the distribution of different Ca2+ channels in the dendrites (Magee and Johnston, 1995) and the amplitude and propagation pattern of the backpropagating spikes (Callaway and Ross, 1995; Spruston et al., 1995). Synaptic input, targeted to the dendrites, can enhance (Magee and Johnston, 1997) or inhibit (Buzsáki et al., 1996; Tsubokawa and Ross, 1996) spike backpropagation by shifting the membrane potential or causing a conductance shunt in the dendrites. Some modulators like carbachol (CCh, a muscarinic receptor agonist;Tsubokawa and Ross, 1997), isoproterenol (a β-adrenergic agonist;Hoffman and Johnston, 1999), and serotonin (5-HT; Ross and Sandler, 1998) affect spike propagation by modulating dendritic conductances. Serotonin (Sandler and Ross, 1999) and possibly other agonists can affect spike-associated [Ca2+]i increases by modulating directly the Ca2+ channels that are opened by the action potentials.
In addition to these mechanisms, we recently showed that action potential-associated [Ca2+]i changes could be enhanced by pairing backpropagating spikes with repetitive synaptic activation (Nakamura et al., 1999a). The enhanced [Ca2+]i increase results from the synergistic action of Ca2+ entering through spike-opened Ca2+ channels and metabotropic glutamate receptor (mGluR)-mobilized inositol 1,4,5-trisphosphate (IP3) acting on IP3receptors (IP3Rs) to release Ca2+ from the endoplasmic reticulum (ER). The magnitude of this increase is much larger than the increase attributable to spikes alone, even when the amplitude of the spikes is increased by neuromodulators.
During the course of these experiments we found that bath application of the mGluR agonist 1-amino-cyclopentyl-1,3-dicarboxylate (t-ACPD) appeared to have the same effect as synaptic activation in generating the synergistic release of Ca2+ by action potentials in pyramidal neurons (Nakamura et al., 1999a). Because other metabotropic agonists coupled to IP3 mobilization are likely to have the same effect, it was of interest to discover which agonists or neurotransmitters could couple with action potentials to evoke Ca2+ release. In addition, analytical experiments with bath-applied agonists allow for more precise targeting of different receptors, eliminate the spatial inhomogeneity of synaptic stimulation, and bypass effects on presynaptic terminals or other neurons in the slice. Several questions were of interest. Which kinds of mGluRs participate in Ca2+ release? Which Ca2+ channels opened by action potentials promote release? What kinds of mechanisms are responsible for the preferred release of Ca2+ in the proximal apical dendrites? How close in space are the Ca2+ channels to the IP3R channels and how close together are different IP3Rs to each other? What levels of [Ca2+]i and IP3 are required to cause regenerative release? These new experiments explore some of these questions.
Parts of this work have been published previously in abstract form (Ross and Sandler, 1998; Barbara et al., 1999; Nakamura et al., 1999b,2000).
MATERIALS AND METHODS
Transverse hippocampal slices (300 μm thick) were prepared from 2- to 3-week-old Sprague Dawley rats as previously described (Tsubokawa and Ross, 1997; Nakamura et al., 1999a). Animals were anesthetized with methoxyflurane before decapitation. Slices were incubated for at least 1 hr in normal artificial CSF (ACSF) composed of (in mm): 124 NaCl, 2.5 KCl, 2 CaCl2, 2 MgCl2, 1.25 NaH2PO4, 26 NaHCO3, and 10–20 glucose, bubbled with a mixture of 95% O2/5% CO2, making a final pH of 7.4. During experiments the ACSF was superfused over the slice at a rate of 1 ml/min. Tight seals on CA1 pyramidal cell somata and electrophysiological recordings were made as previously described (Sakmann and Stuart, 1995; Nakamura et al., 1999a). The standard patch pipette solution contained (in mm): 140 K-gluconate, 4 NaCl, 4 Mg-ATP, 0.3 Na-GTP, and 10 HEPES, pH-adjusted to 7.2–7.4 with KOH. For some experiments we added 14 mmNa2-phosphocreatine. This solution was supplemented with 0.1–1.0 mm of a selected calcium indicator (fura-2, bis-fura, fura-6F, fura-2-FF, furaptra; all from Molecular Probes, Eugene, OR). Typical osmolarity was 300 mOsm. AP-5 [(±)-2-amino-5-phosphonopentanoic acid], CNQX (6-cyano-7-nitroquinoxaline-2,3-dione), MCPG [(R,S)-α-methyl-4-carboxyphenylglycine],t-ACPD, ryanodine, serotonin, α-methyl-serotonin, phenylephrine, dopamine, nimodipine, nifedipine, nitrendipine, ω-conotoxin GVIA, BAPTA [1,2-bis(2-aminophenoxy)ethane-N,N,N′,N′-tetra-acetic acid], EGTA, IP3(d-myo-inositol 1,4,5-trisphosphate), CPA (cyclopiazonic acid), TTX (tetrodotoxin), ruthenium red, and low-molecular-weight heparin were obtained from Sigma/RBI (St. Louis, MO). DHPG [(S)-3,5-dihydroxyphenylglycine], CHPG (2-chloro-5-hydroxyphenyglycine), AIDA (1-aminoindan-1,5-dicarboxylic acid), 4-CPG (4-carboxyphenylglycine), MPEP [2-methyl-6-(phenylethynyl)-pyridine], and LY367385 [(+)-2-methyl-4-carboxyphenylglycine] were obtained from Tocris (Ballwin, MO). ω-Agatoxin-IVA was obtained from Peptides International (Louisville, KY). Thapsigargin and 3-F-IP3(3-deoxy-3-fluoro-d-myo-inositol 1,4,5-trisphosphate) were obtained from Calbiochem (San Diego, CA). Caffeine was obtained from Wako Chemicals (Tokyo, Japan). Adenophostin A was a generous gift from Sankyo (Tokyo, Japan).
Nimodipine, nitrendipine, and nifedipine were prepared as stock solutions in ethanol or DMSO at 1000× final concentration and diluted into ACSF. In separate experiments we found that this concentration of ethanol or DMSO had no measurable effect on the electrical or optical parameters that were measured in these experiments. Dopamine was prepared daily as a 30 mm stock solution containing 0.2% ascorbic acid. For experiments this solution was diluted 100× in ACSF. Control experiments demonstrated that 0.002% ascorbic acid in ACSF did not change the electrical or optical properties of pyramidal neurons. For ACSF containing 10–20 mm caffeine, NaCl was reduced by a comparable amount to preserve osmolarity. The other compounds were added directly to the ACSF or pipette solution at the indicated concentrations.
In a typical experiment a train of backpropagating action potentials was evoked with a train of 1 msec depolarizing pulses from the patch electrode. Time-dependent [Ca2+]imeasurements from different regions of the pyramidal neuron were made as previously described (Lasser-Ross et al., 1991; Nakamura et al., 1999a). Electrical traces were recorded simultaneously and matched to the optical recordings. Data were taken and analyzed with Windows-based software written in our laboratory. Images were taken at 33 msec intervals. Electrical records were sampled at 200 μsec intervals. During the experiments the solution changes were made by switching among different sources without changing the flow rate. In our system the chamber composition was changed by 90% in ∼4 min.
RESULTS
Spike-evoked Ca2+ release in the presence oft-ACPD
Backpropagating action potentials induce [Ca2+]i increases at all pyramidal cell locations by opening voltage-sensitive Ca2+ channels in the dendrites (Jaffe et al., 1992). This is illustrated in the first column of Figure1, which shows the [Ca2+]i change that is associated with a pair of action potentials evoked by brief intrasomatic pulses. The rapid rise in [Ca2+]i occurs at essentially the same time at all dendritic locations, reflecting the high velocity of spike backpropagation (Spruston et al., 1995).
Fig. 1.

Backpropagating action potentials evoke Ca2+ waves in the presence of t-ACPD. In control ACSF (first column) a pair of spikes initiated with brief intrasomatic pulses caused rapid, almost simultaneous, increases in [Ca2+]i(ΔF/F) at all locations in the cell. This increase is shown in two ways. In the top panel the amplitude changes are indicated by a change in color. Positions along the ordinate correspond to the pixels overlaid on the cell image in the fourth column. Positions along the abscissa correspond to the same time scale as in the bottom panel. Below the pseudocolor image the same data are plotted as time-dependent changes for the two regions of interest (red andgreenboxes) indicated on the image of the cell. In ACSF containing 30 μmt-ACPD, the same pair of spikes caused the same synchronous increases in [Ca2+]i, followed by larger increases at different times in different locations. The pseudocolor image shows that this secondary increase propagated as a wave that initiated at a location ∼50 μm from the soma. This wave did not propagate into the distal apical dendrites nor into the basal dendrites. Note that the pseudocolor scale has been changed to include the larger-amplitude secondary response. Five spikes (third column) caused a similar secondary response that initiated earlier and more synchronously at different dendritic locations.
To isolate the effects of metabotropic agonists, we added 10 μm CNQX and 100 μm AP-5 to the ACSF to block ionotropic glutamate receptors in all of the experiments described in this paper. When 30 μmt-ACPD was added to this solution and superfused into the bath, the cell depolarized 5.5 ± 0.3 mV (n = 21). The resting fluorescence of the bis-fura-2-filled cell, at dendritic locations within 30 μm from the soma, decreased by 3.8 ± 0.4% (n = 13) in the first few minutes after the solution change. At later times it was difficult to assess the change because the indicator concentration was increasing slowly and these measurements were made at a single excitation wavelength. Assuming that the resting [Ca2+]i in the cell was ∼100 nm and that theKD for bis-fura-2 binding to Ca2+ is 370 nm(Molecular Probes catalogue), then this fluorescence decrease corresponds to an increase in [Ca2+]i of <20 nm (Lev-Ram et al., 1992). This small increase could result from entry through voltage-sensitive Ca2+ channels opened by the potential change near resting potential (Magee et al., 1996) or through a nonselective cation conductance activated by group I mGluRs (Congar et al., 1997). We did not investigate the mechanism of this increase in the present experiments. When t-ACPD is applied rapidly to the bath (Bianchi et al., 1999) or puffed onto the cell (Jaffe and Brown, 1994), larger [Ca2+]i increases are recorded. However, these increases were not observed in our experiments in which the bath composition was changed slowly by being superfused at ∼1 ml/min.
In the presence of 30 μmt-ACPD the backpropagating spikes evoked a secondary increase in [Ca2+]i that was much larger than in control ACSF (Nakamura et al., 1999a). With one or two action potentials the secondary increase propagated as a wave in the apical dendrites (Fig. 1, second column). The wave did not propagate into the distal dendrites although the sharp spike-evoked [Ca2+]i increase could be observed in this region. In this figure the wave had a clear initiation point ∼50 μm from the soma. The rapid rise in [Ca2+]i at the initiation point began ∼0.5 sec after the spikes. In five cells in which release was activated by a single spike, the delays were 0.15, 0.35, 0.5, 0.8, and 2.1 sec. When there was a single initiation site, this location was always in the proximal apical dendrites. In several cells two initiation points could be observed. In two of these cells the second initiation site was in the basal dendrites, within 10 μm of the soma. However, these waves did not propagate basally >20 μm from the soma. When five action potentials were stimulated (Fig. 1,third column), the initial sharp [Ca2+]i increase was larger and the secondary response appeared more synchronously at all locations at which it was observed and with a much shorter delay. This was the consistent pattern in >100 pyramidal neurons.
To test whether the action potentials or just the brief stimulating pulses were responsible for both the rapid and secondary [Ca2+]i increases, we added TTX (1.0 μm) to the superfusate (Fig.2). In this solution the action potentials were blocked, the rapid spike-evoked [Ca2+]i increase was eliminated, and there was no secondary increase (n= 2). However, when a strong 0.2 sec depolarizing pulse was given, both a rapid increase, time-locked to the pulse, and a secondary increase were recorded. Washing out the t-ACPD left only the rapid [Ca2+]i increase. These results suggest that it was not action potentials, specifically, that caused release but, rather, the membrane depolarization.
Fig. 2.

Membrane depolarization sufficient to cause a significant increase in [Ca2+]i is required to evoke Ca2+ release. In control ACSF a train of 10 backpropagating spikes initiated by 1 msec depolarizing pulses caused a rapid increase in [Ca2+]i at a dendritic location ∼30 μm from the soma. When 30 μmt-ACPD was added to the ACSF, the same 10 spikes caused a secondary [Ca2+]i increase. The addition of 1.0 μm TTX blocked the spikes and eliminated both the primary and secondary [Ca2+]i increases. Substituting a single 200 msec pulse for the train of brief pulses restored both components of the [Ca2+]i transient. Finally, washing out t-ACPD left a rapid [Ca2+]i increase similar to that caused by spikes in the same solution.
Responses with different indicators and different stimulus intervals
The large magnitude of the secondary [Ca2+]i increases (often >50% ΔF/F, using 100–300 μm bis-fura-2 in the pipette) suggested that the released Ca2+ might be saturating the indicator. To examine this possibility, we tested different indicators resembling bis-fura-2. These indicators have similar spectral characteristics (Molecular Probes catalogue), and their properties could be assayed with the same fluorescence filter set. Figure3 shows results with five indicators having different KD values. TheKD values were obtained from the Molecular Probes catalogue except for fura-2-FF (Schneggenburger et al., 1999) and furaptra (Naraghi, 1997). For each indicator the figure shows representative fluorescence changes recorded from a small region ∼30 μm from the soma (fura-2, n = 9; bis-fura-2,n > 100; fura-6F, n = 68; fura-2-FF,n = 2; furaptra, n = 2). The smaller gray traces show the change that follows a train of 20 action potentials in normal ACSF. These traces all have been scaled to the same amplitude on the assumption that they all represent the same magnitude of [Ca2+]i change. This assumption is not exactly true, because the indicators differ in their buffering power and nonlinearity in response to Ca2+. However, the similar time courses for all of the traces except that recorded with fura-2 suggest that the error is not large. Note that the percentage of change in fluorescence is very different between the high-affinity fura-2 and the low-affinity furaptra. In the presence of 30 μmt-ACPD the same train of action potentials evoked much larger fluorescence increases (Fig. 3, darker traces). The rounded tops of the traces recorded with fura-2 and bis-fura-2 (Fig. 3,arrows) suggests that these responses saturated the indicators. Much larger relative changes were recorded with the low-affinity indicators fura-6F, fura-2-FF, and furaptra. None of these responses appeared to saturate the indicators. The larger relative response with furaptra (n = 2) may reflect the fact that this indicator interfered less with the regenerative release process as well as the fact that it was linear throughout the range of physiological fluorescence changes. The 7% fluorescence change detected with furaptra corresponds to a [Ca2+]i increase of ∼3 μm (Lev-Ram et al., 1992; Nakamura et al., 1999a). The 1% increase in normal ACSF corresponds to a change of ∼0.4 μm. This is close to the magnitude reported by Helmchen et al. (1996) for a train of action potentials that used very low concentrations of fura-2.
Fig. 3.

Fluorescence changes evoked by backpropagating action potentials, using indicators of different Ca2+ affinities. The different indicators and their approximate dissociation constants are shown at the top. The gray traces show the increases in normal ACSF that were observed at a location ∼30 μm from the soma. All of these increases have been scaled to the same size, although the amplitudes (ΔF/F) varied from 45 to 1%. The black traces show the fluorescence increases that were observed in ACSF containing 30 μmt-ACPD. The increases that were recorded with fura-2 and bis-fura-2 have flat tops (arrows) suggesting indicator saturation. The ratio of increases in t-ACPD to those in normal ACSF that were recorded with the lower-affinity indicators is much larger.
For pharmacological experiments in the rest of the paper, in which measuring the relative magnitude of the fluorescence change under different conditions was important, we used fura-6F. This indicator is relatively linear in the physiological range, does not buffer the responses significantly, and gives signals with a satisfactory signal-to-noise ratio. For experiments designed to determine qualitatively whether release occurred, we used low concentrations of bis-fura-2. This indicator gives signals that can be recorded with a good signal-to-noise ratio over most of the cell, is not toxic to the cells, and bleaches <1% in a typical trial.
To assess the effect of different pharmacological agents on the release process, we believed that it was important to have stable conditions in which experiments produced repeatable results. Therefore, we tested whether trains of spikes at different trial intervals consistently could evoke [Ca2+]i changes of similar amplitude. Figure 4 shows representative experiments that used 300 μm fura-6F as the indicator. In each case a train of 5–10 action potentials at 30 msec intervals was evoked, first in normal ACSF and then with 30 μmt-ACPD added to the bath. In normal ACSF, 10 action potentials evoked a peak increase of 4% ΔF/F in a region in the proximal apical dendrites. In t-ACPD the spikes evoked Ca2+ release, and the peak fluorescence increase was 18–20%. After the baseline response was established, in each of the panels (Fig. 4A–D) the interval between trials was varied. When the interval was 10 sec (Fig.4A), the magnitude of the fluorescence increase was reduced by 74.6 ± 5.5% from the peak value (n = 7). The percentage of reduction was not sensitive to the position of the selected region over the first 50 μm of the apical dendrites. The selected examples to the right show that the release transient was delayed as well as reduced in size after repetitive stimulation at 10 sec intervals. After a 2 min wait the amplitude and delay recovered almost to their original values. Experiments at longer intertrial intervals showed less of a reduction. At 20 sec intervals the peak was reduced 53.5 ± 4.0% (n = 4); at 30 sec intervals the peak was reduced 23.5 ± 7.8% (n = 4); at 60 sec intervals the peak was reduced by 15.3 ± 3.5% (n = 6). The reductions measured at 30 and 60 sec intervals were not significantly different. Therefore, most experiments were done at 30 or 60 sec intervals.
Fig. 4.
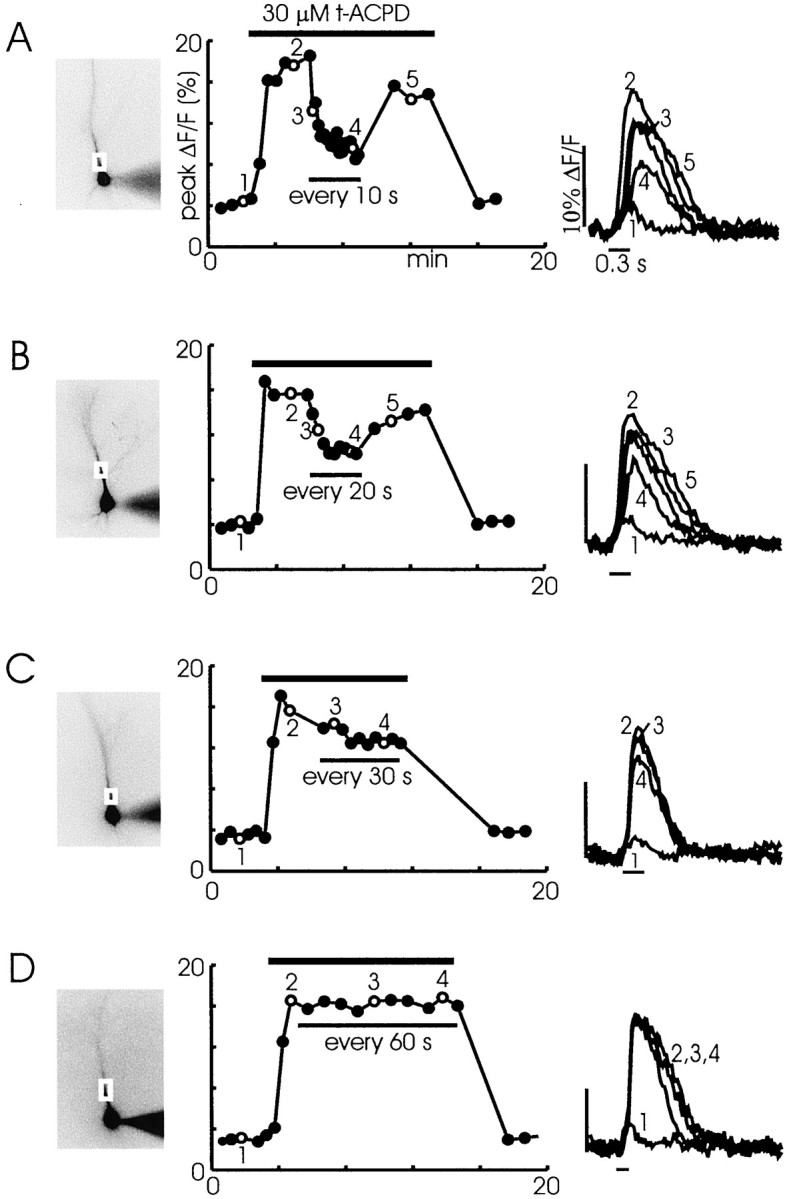
[Ca2+]i increases observed after trains were stimulated at different intervals.A, Trains evoked at 10 sec intervals. A train of 10 spikes at 30 msec intervals was evoked in normal ACSF. Trace 1 in the rightpanel shows the response at the location on the cell image (left panel). This pattern was repeated four times at an intertrain interval of 30 sec. The peak response amplitudes for each of these trials are plotted as the first four points in themiddlegraph. When 30 μmt-ACPD was added to the bath (horizontal bar), the same spike train evoked a secondary [Ca2+]i increase of larger amplitude. This pattern was repeated several times. A representative response (2) is shown in the right panel. When the interval between trains was reduced to 10 sec, the amplitude decreased. At the end of several minutes (4) the amplitude was reduced ∼60%, and the response was delayed. When the intertrain interval was increased, the amplitude increased and the delay was shortened (5). Washing out thet-ACPD restored the initial response. B,A similar experiment that used 20 sec intertrain intervals. The amplitude reduction was less than that observed with 10 sec intervals.C, A similar experiment that used 30 sec intertrain intervals. There was almost no reduction in amplitude.D, A similar experiment that used 60 sec intervals. For these experiments there were only five spikes in the train. There was no observed amplitude reduction from trial to trial.
The strong peak reduction at 10 and 20 sec intervals suggests that the stores did not replenish their Ca2+ in this interval or that the receptors on ER did not recover from inactivation (Hajnoczky and Thomas, 1994). Whichever the explanation, these experiments show that the recovery time constant after spike-evoked regenerative release is ∼30 sec.
These experiments also suggest that the Ca2+ entering the cytoplasm with the spikes did not make a significant contribution to replenishing the stores. The magnitude of the [Ca2+]i increase after five spikes in control conditions was five times less than the magnitude in 30 μmt-ACPD when the trials were conducted at 1 min intervals (Fig. 4D). Nevertheless, this large-amplitude [Ca2+]i increase could be evoked repeatedly over a 15 min interval. It seems unlikely that the small [Ca2+]i increase attributable to the spikes could supply enough Ca2+ to refill the stores. Rather, the stores probably were refilled from the Ca2+ that was released in the previous trial. However, we cannot rule out the possibility that some of the spike-evoked Ca2+ entry replenished Ca2+ that leaked out or was pumped from the cell. We also found that release could be evoked with only a few spikes in the first trial in experiments in which the slice was preincubated with 30 μmt-ACPD (data not shown). In these experiments no action potentials were given to load the stores. This result supports the idea that spikes are not needed to fill the stores. This conclusion differs from that of some previous investigators (Jaffe and Brown, 1994) who emphasized the importance of filling stores before evoking release.
Mechanism of release
In experiments that used synaptic stimulation, we showed that regenerative Ca2+ release was attributable to mGluR-activated IP3 synergistically acting with Ca2+ entering through spike-opened Ca2+ channels to open IP3Rs (Nakamura et al., 1999a). The similar shape of the release transients evoked in t-ACPD suggests that the same mechanism was at work in these new experiments. To test this hypothesis, we repeated the pharmacological experiments of Nakamura et al. (1999a) by using bath-applied t-ACPD. Figure5A shows that spike-evoked release was blocked by 20 μm CPA (n = 6), which blocks the ER Ca2+-ATPase (Seidler et al., 1989). Release also was blocked by 10 μm ryanodine (Fig. 5B; n = 5), which depletes the ER by keeping the ryanodine receptor channel open (Rousseau et al., 1987). Including ruthenium red, which blocks the ryanodine receptor in the closed state (Smith et al., 1988), in the pipette did not block release but did prevent the action of 10 μm ryanodine (Fig. 5C; n = 5). In addition, release was prevented by including low-molecular-weight heparin (1 mg/ml,n = 5; data not shown) in the pipette. Heparin blocks the IP3Rs nonspecifically in a variety of cell types (Ghosh et al., 1988; Kobayashi et al., 1988). Heparin did not block the slow depolarization induced by t-ACPD, suggesting that a non-IP3-dependent pathway requiring mGluR activation mediated this voltage change.
Fig. 5.
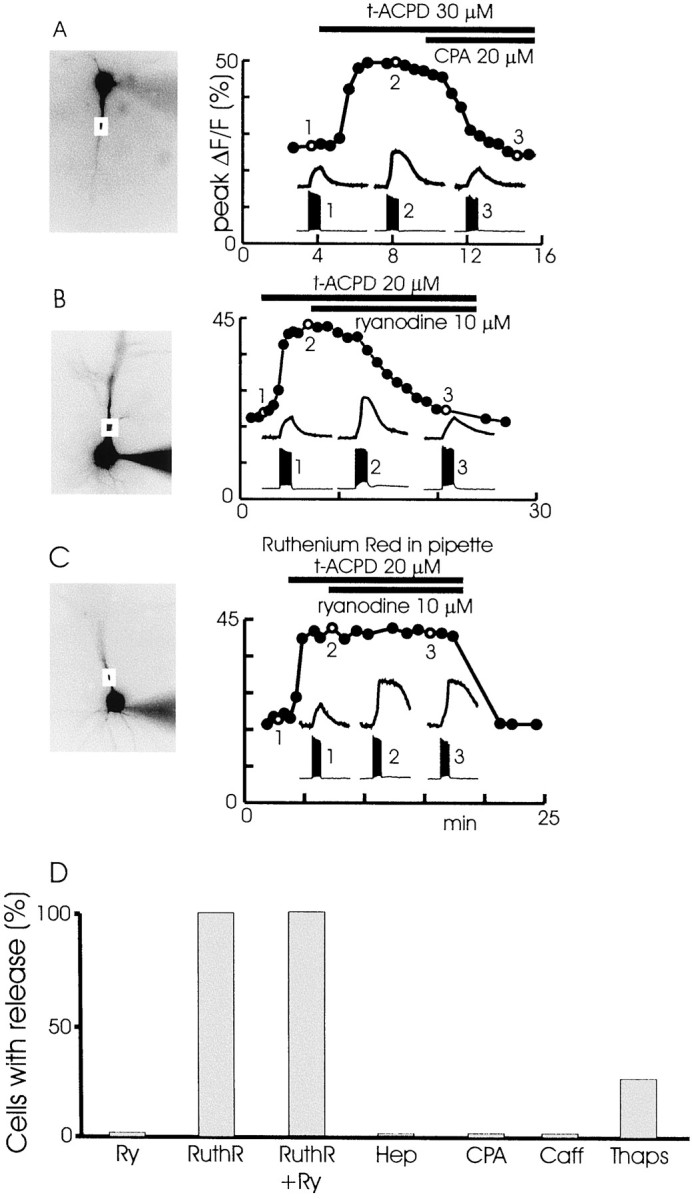
Effect of different pharmacological agents on spike-evoked release in the presence of 30 μmt-ACPD. A, CPA blocks release. Cell image, peak ΔF/F graph, and insets are similar to those shown in Figure 4. In normal ACSF a train of 20 backpropagating spikes evoked at 30 msec intervals caused a small [Ca2+]i increase linked in time to the spikes (1). When 30 μmt-ACPD was added to the bath, a larger increase was observed (2). Adding 20 μm CPA to the solution reduced the [Ca2+]iincrease to the level that was observed in control conditions (3). Each point on the graph represents a separate trial evoked at 30 sec intervals. Some points have been deleted because other protocols were tested at those times.B, A similar experiment showing that 10 μmryanodine added to the ACSF blocked the secondary [Ca2+]i increase. C, A similar experiment showing that 10 μm ryanodine did not block the secondary [Ca2+]i increase when 120 μm ruthenium red was included in the patch pipette. D, Summary histogram showing the effects of the different agents. In addition to showing the results of partsA–C of this figure, the histogram shows that 1 mg/ml of heparin in the pipette blocked release, 20 mm caffeine that was added to the ACSF blocked release, and preincubation with 3 μm thapsigargin blocked release.
These results parallel those we found when mGluRs were activated by synaptic transmission (Nakamura et al., 1999a). We also tested several additional compounds that are known to affect intracellular stores. Thapsigargin, like CPA, blocks the ER Ca2+-ATPase (Thastrup et al., 1990). Preincubation of the slice with 3 μm thapsigargin (n = 3 of 4) prevented spike-evoked release (data not shown). Caffeine sensitizes the ryanodine receptor and, at high concentrations, opens the receptor at rest, depleting the stores (Zucchi and Ronca-Testoni, 1997). Caffeine also blocks IP3Rs in some preparations (Parker and Ivorra, 1991). Caffeine (2–10 mm, n = 7; data not shown) blocked t-ACPD-mediated release in all experiments, an effect compatible with either mechanism. Caffeine by itself caused only a 10–20% increase in the spike-evoked [Ca2+]i change in normal ACSF without altering the time course of the [Ca2+]i transient (Sandler and Barbara, 1999). This small increase may be attributable to the effect of caffeine on the indicator (Muschol et al., 1999). However, we have no direct evidence supporting this explanation. The absence of regenerative spike-evoked release in the presence of 2–5 mm caffeine is interesting because this protocol has been reported to cause all-or-none Ca2+-induced Ca2+ release (CICR) transients in rat sensory neurons (Usachev and Thayer, 1997). That mechanism, mediated by ryanodine receptors, does not appear to be significant in pyramidal neurons. Figure 5D summarizes the results by using agents that modulate intracellular stores.
To reinforce the conclusion that release was mediated by the activation of IP3Rs, we tested several compounds that are relatively specific activators of this receptor. Adenophostin A at low concentrations is a potent IP3R agonist (Takahashi et al., 1994). When 0.3 μm adenophostin A was included in the pipette, a train of action potentials evoked an increase in dendritic [Ca2+]i that outlasted the train of spikes (n = 5; Fig.6A, trace 1). The time course of the [Ca2+]i change resembled that evoked by t-ACPD and spikes (see, for example, Fig. 1). To confirm that this increase was attributable to release of Ca2+ and not some nonspecific effect, we added 10 mm caffeine. Caffeine, as indicated above, empties the stores and blocks IP3Rs. In this condition the same train of spikes evoked a smaller [Ca2+]i increase that was linked in time to the action potentials (Fig.6A, trace 2). In control experiments (data not shown) we found that caffeine did not reduce the spike-evoked [Ca2+]i increase. Washing out the caffeine allowed the stores to refill. Because adenophostin A was still in the cell, spikes again evoked release (Fig.6A, trace 3). Figure 6Bshows similar experiments that used 100 μm3-F-IP3 in the pipette instead of adenophostin A (n = 3). This analog of IP3, resistant to 3-kinase, is equipotent to IP3 in releasing Ca2+ from stores in other preparations (Kozikowski and Fauq, 1990). Finally, IP3 itself, at a concentration of 500 μm in the pipette, also caused Ca2+ release when it was paired with a train of action potentials (Fig. 6C; n = 6). These concentrations of agonists were close to the threshold concentrations for this protocol because 0.1 μmadenophostin A (n = 3), 30 μm3-F-IP3 (n = 5), and 300 μm IP3 (n= 5) did not cause spike-associated Ca2+release. Together, these results strongly support the conclusion that release is mediated via the action of IP3 on the IP3R.
Fig. 6.

Effect of IP3 and analogs in evoking spike-associated Ca2+ release. A,Adenophostin A (0.3 μm) was included in the patch pipette. A train of 10 backpropagating spikes evoked at 30 msec intervals caused a [Ca2+]i increase that had an inflection (arrow) on the rising phase (1). The addition of 10 mm caffeine to the ACSF reduced the amplitude of the [Ca2+]i increase and removed the inflection (2). Washing out the caffeine restored the larger amplitude and rounded time course of the [Ca2+]i increase (3). B, A similar experiment in which 100 μm 3-F-IP3 was included in the pipette. This analog also caused a spike-associated secondary [Ca2+]i increase that was blocked by 10 mm caffeine. C, A similar experiment in which 500 μm IP3 was included in the pipette. IP3 also caused a secondary [Ca2+]i increase that was blocked by 10 mm caffeine. Scale in cell image, 50 μm.
One difference between release mediated by tonic activation of mGluRs and release mediated by intracellular injection of IP3R agonists is that the amplitude of spike-associated Ca2+ release in the presence of intracellular IP3R agonists was smaller than the amplitude in the presence of t-ACPD. Increasing the concentration of IP3R agonists did not increase the amplitude of the [Ca2+]i change. This result might suggest that the IP3 agonists are not activating the same release process as t-ACPD. However, injection of IP3R activators at concentrations high enough to cause release occluded the effect oft-ACPD; i.e., when t-ACPD was added to the bath, large amplitude spike-evoked release did not occur in the presence of intracellular agonists (1.0 μm adenophostin A,n = 5; 100 μm3-F-IP3, n = 3; 500 μm IP3, n= 2; data not shown). Lower concentrations of IP3R agonists (0.1 μmadenophostin A, n = 2; 30 μm3-F-IP3, n = 3; 300 μm IP3, n= 3), which did not cause even a low level of release, did not occlude the effect of t-ACPD. The reason for the small amplitude of release with injected IP3R agonists is not clear. The IP3R agonists did not occlude the resting membrane depolarization caused by t-ACPD, an observation that parallels the results with injected heparin.
Effects of calcium channel blockers
Two kinds of experiments indicate that the critical role of spikes in the release process is to increase transiently the [Ca2+]i in the cells to act cooperatively with IP3 to open the IP3R channels. First, blocking Ca2+ entry with 200 μmCd2+ strongly reduced the immediate [Ca2+]i increase and prevented the secondary [Ca2+]i increase attributable to release (Fig. 7). Because the immediate increase was time-locked to the spikes and its amplitude was insensitive to CPA and ryanodine, it reflects Ca2+ entry through voltage-dependent Ca2+ channels. This figure also shows that Cd2+ had no effect on the resting bis-fura-2 fluorescence intensity, indicating that Cd2+ did not enter the cell to quench the indicator fluorescence. Second, in most experiments that used bis-fura-2 as the indicator, one or two spikes did not cause release, but a larger number of spikes were effective. More spikes increase the peak [Ca2+]i level reached in a train. In contrast, when furaptra was used, only one or two spikes were necessary. This low-affinity indicator does not buffer Ca2+ significantly and allows the peak free [Ca2+]i to reach higher levels. These experiments suggest that spikes produce a threshold level of [Ca2+]i that cooperatively acts with IP3 to trigger release.
Fig. 7.
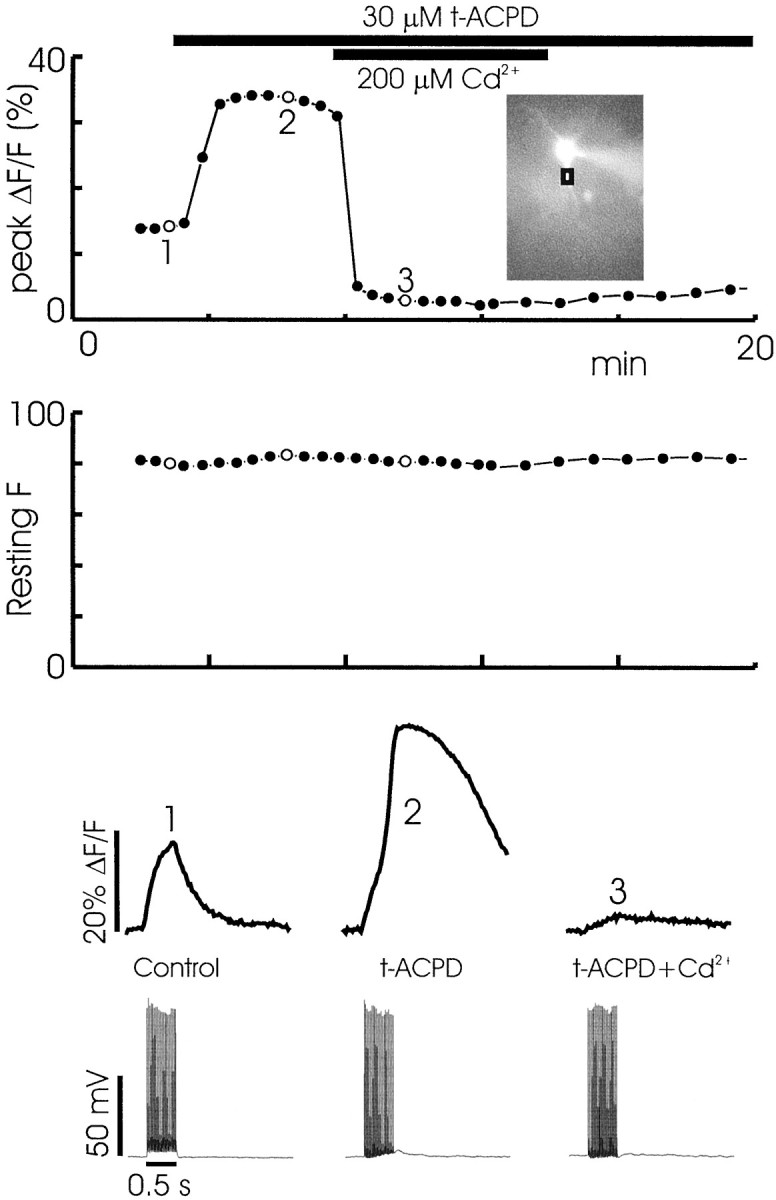
Cd2+ (200 μm) blocks both the primary and secondary spike-associated [Ca2+]i increase in the presence of 30 μmt-ACPD. The middle panelshows that Cd2+ did not affect the resting fluorescence level in the cell, indicating that Cd2+did not enter the cell to quench the indicator fluorescence. Scale is in arbitrary units. The bottom panels show representative responses. A small spike-associated response, insufficient to evoke release, remained in Cd2+-containing ACSF.
Because the almost complete block of Ca2+entry by Cd2+ was effective in preventing release, it was of interest to see whether entry through any of the major kinds of Ca2+ channels was particularly effective in inducing release. Figure8 shows experiments in which we tested several antagonists that are relatively specific for different Ca2+ channel types. At 100 μm, Ni2+ preferentially blocks low-threshold T-type channels (Ozawa et al., 1989; Mogul and Fox, 1991). When superfused over the preparation, Ni2+-containing ACSF reduced the spike-evoked [Ca2+]i increase by 25.3 ± 1.1% (n = 3) as previously reported (Christie et al., 1995). However, with the addition of 30 μmt-ACPD the spikes still were able to evoke a large secondary [Ca2+]i increase (Fig. 8A; n = 4 of 5). Similar results were obtained with 1–5 μmω-conotoxin-GVIA, a blocker of high-threshold N-type Ca2+ channels (McCleskey et al., 1987). This toxin reduced the sharp spike-evoked [Ca2+]i increase by 26.7 ± 1.4% (n = 7) but did not prevent release (Fig. 8B).
Fig. 8.

Selective Ca2+ channel blockers do not prevent spike-associated Ca2+ release in the presence of 30 μmt-ACPD.A, A train of 10 backpropagating spikes evoked at 30 msec intervals caused a rapid [Ca2+]iincrease at a location close to the soma in the apical dendrites. The amplitude of this change was approximately constant when these trains were evoked at 30 sec intervals (1). The addition of 100 μm NiCl2 to the ACSF reduced the amplitude of this increase without changing the shape of the transient (2). When t-ACPD was added to this solution, a secondary [Ca2+]i increase was observed (3). B–D, Similar experiments are shown with 1 μm ω-CTX-GVIA, 10 μm nimodipine, and 400 nm ω-Aga-IVA. None of these agents prevented release by t-ACPD (B, D) or CCh (C). ω-CTX-GVIA reduced the spike-associated [Ca2+]i in normal ACSF, whereas nimodipine and ω-Aga-IVA did not. For the experiment with ω-Aga-IVA, fura-6F was the Ca2+ indicator, resulting in faster transients.
Almost similar results were obtained with dihydropyridine antagonists of L-type Ca2+ channels. Nimodipine (Fig.8C; 10–30 μm; n = 15), nifedipine (10 μm; n = 6), and nitrendipine (10 μm; n = 1) did not prevent spike-evoked Ca2+ release. Interestingly, none of these antagonists had a significant effect on the sharp spike-evoked [Ca2+]i increases in these slice experiments. This result differs from previous sharp electrode experiments that found an L-type channel component in spike-associated [Ca2+]i increases (Christie et al., 1995). Two control experiments confirmed that dihydropyridine-containing ACSF was capable of blocking L-type Ca2+ channels. In one, 10 μm nimodipine reduced the [Ca2+]i increase caused by a 1 sec depolarizing pulse (n = 3; data not shown). This rules out the possibility that many of the L-type Ca2+ channels were washed out (Tombaugh and Somjen, 1997). In the second, the same solution dilated isolated rat blood vessels (Ungvari et al., 2000), confirming the effectiveness of the nimodipine we purchased. Thus, it is likely that few L-type channels are opened by backpropagating action potentials, although these channels are found in CA1 pyramidal neurons (Westenbroek et al., 1990; Magee and Johnston, 1995). One possible explanation for these results is that the activation kinetics of the L-type channels are slow and the channels are not opened by the action potential (Mermelstein et al., 2000). The important result, however, is that L-type channels are not connected specifically to the IP3R-mediated release mechanism in pyramidal neurons. This conclusion applies even if L-type Ca2+ channels are washed out, because in that case there can be no connection between these Ca2+ channels and any intracellular receptor. A strong connection has been implicated between L-type channels and ryanodine receptor-mediated release in other neurons (Chavis et al., 1996).
Similar results were found with the P-type Ca2+ channel blocker, ω-agatoxin-IVA (Mintz et al., 1992). In five experiments 200–400 nm of this toxin did not prevent release and had no significant effect on the sharp spike-evoked [Ca2+]i increase. To test the potency of our sample, we confirmed that ω-agatoxin-IVA could block the voltage-dependent [Ca2+]i increase in rat cerebellar Purkinje cells (n = 2; data not shown). We did not test the possibility that R-type Ca2+ channels could be linked specifically to the release process.
Effect of calcium buffers
The observation that several action potentials were effective in causing Ca2+ release when one or two were not suggests that a threshold [Ca2+]i level might be needed to trigger release. If this hypothesis is correct, then buffering the peak [Ca2+]i level with high concentrations of indicator (Helmchen et al., 1996) will make it more difficult to evoke release. Indeed, we found that 1.0 mm bis-fura-2 prevented synaptically evoked release, whereas 0.3 mm did not (Nakamura et al., 1999a). In new experiments we found that the same conclusion applied to spike-evoked release in the presence of t-ACPD (Fig.9).
Fig. 9.

Effect of different Ca2+buffers on the ability of spikes to evoke Ca2+release in the presence of 30 μmt-ACPD. When the pipette contained 0.5 mm bis-fura-2, release was always observed. Increasing the concentration to 1.0 mmbis-fura-2 prevented release. Different concentrations of EGTA and BAPTA in the pipette were tested with electrodes also containing 100–200 μm of the low-affinity indicator fura-6F. BAPTA (1.0 mm) and EGTA (2.0 mm) prevented release.Numbersover the barsindicate the cells that were tested.
Release measured in the presence of different buffers also can reveal information about whether Ca2+ ions acting on particular IP3Rs diffuse far from their source (either Ca2+ channels or other IP3Rs) or whether the receptors and channels are close to each other. Because the rate constants for Ca2+ binding to EGTA are much slower than the rate constants for binding to BAPTA, a large difference in the effectiveness of these two buffers has been taken to indicate that Ca2+ does not go far before activating its target (Adler et al., 1991). To test this possibility, we included EGTA and BAPTA in the recording pipette at different concentrations. No Ca2+ was added except for trace amounts. We also included a low concentration of fura-6F to monitor the [Ca2+]i change. This low-affinity indicator (KD∼6 μm) has only a weak buffering effect on the spike-evoked [Ca2+]i increase. Figure 9 shows that the effective concentration of BAPTA and EGTA differed by only a factor of two. This result suggests that the source and target of Ca2+ in the release process are not very close to each other.
Pharmacology of mGluRs
In previous experiments (Nakamura et al., 1999a) we showed that synaptically activated Ca2+ release could be blocked by 1 mm MCPG, a group I and II mGluR antagonist (Schoepp et al., 1999). To determine more precisely the receptor types participating in the release process, we tested a series of known mGluR agonists and antagonists. For the agonists we determined the minimum concentration that reliably evoked release after a train of 10–20 action potentials. We found that 20 μmt-ACPD (n = 28), 5 μm DHPG (n = 6), and 500 μm CHPG (n = 9) were effective (Table1). Of these, CHPG is reportedly the most selective agonist, acting preferentially on mGluR5 receptors (Doherty et al., 1997).
Table 1.
Effective concentrations of mGluR agonists and antagonists in controlling Ca2+ release
| Compound | Putative selectivity | Effective concentration | |
|---|---|---|---|
| Agonists | t-ACPD | Groups I and II | 20 μm |
| DHPG | Group I | 5 μm | |
| CHPG | mGluR5 | 500 μm | |
| Antagonists1-a | MCPG | Groups I and II | 1 mm |
| AIDA | Group I | 1 mm | |
| 4-CPG | Group I | 500 μm | |
| MPEP | mGluR5 | 3 μm | |
| LY367385 | mGluR1 | 100 μm | |
| Antagonists1-b | AIDA | Group I | 1 mm |
| LY367385 | mGluR1 | 100 μm | |
| MPEP | mGluR5 | 3 μm |
Against release evoked by 30 μm t-ACPD.
Against release evoked by 500 μm CHPG.
We found that the threshold agonist concentration capable of evoking spike-associated release was not uniform in all regions of the cell. When we used 0.5 mm CHPG, release was detected only in the dendrites (n = 6 of 7). However, 1.0 mm CHPG evoked release in both the dendrites and soma (n = 7 of 8; data not shown). Similarly, 20 μmt-ACPD preferentially evoked release only in the dendrites (n = 16 of 29), whereas 30 μmt-ACPD consistently evoked release in both locations (n = 29 of 30).
We next tested the ability of various mGluR antagonists to block spike-evoked release in the presence of 30 μmt-ACPD. As with the agonists, we found that the sensitivity to the antagonists was not spatially uniform. Figure10A shows that 1 μm MPEP blocked release in the soma but did not block release in the dendrites (n = 3 of 3). However, 3–10 μm MPEP blocked release at both locations (Fig. 10B; n = 6 of 6). This differential sensitivity to antagonists in the soma and dendrites, measured at threshold concentrations, also was observed with AIDA (n = 5 of 7 blocked only in the soma at 1 mm; n = 4 of 4 blocked at both locations at 2 mm) and 4-CPG (n = 1 of 1 blocked only in the soma at 500 μm;n = 2 of 2 blocked at both locations at 1 mm). Table 1 summarizes the results for MCPG, AIDA, 4-CPG, MPEP, and LY367385. Because MPEP is reportedly an mGluR5 antagonist (Gasparini et al., 1999) and LY367385 is reportedly an mGluR1 antagonist (Clark et al., 1997), these results suggest that both mGluR1 and mGluR5 receptors are coupled to IP3 mobilization on CA1 pyramidal neurons.
Fig. 10.

MPEP has a differential effect in blocking release in the soma and dendrites when it is applied at low concentration. A,[Ca2+]i increases in response to a train of backpropagating spikes are shown at two locations, one at the soma and one in the dendrites. When 30 μmt-ACPD was added to the ACSF, a secondary increase of larger amplitude was observed at both locations. When 1 μm MPEP was added to this solution, the secondary increase in the soma was blocked, but the increase in the dendrites remained. B, A similar experiment in which 10 μm MPEP was applied. In this case the secondary increase was blocked at both locations.
Some agonists and antagonists, like MPEP (Gasparini et al., 1999), are reported to be very selective in distinguishing between mGluR1 and mGluR5receptors. Others (Schoepp et al., 1999) are less selective. To examine this selectivity, we tested several antagonists for their ability to block the release induced by the putative mGluR5agonist CHPG. Table 1 shows that AIDA, MPEP, and LY367385 were as effective against 0.5 μm CHPG-induced release as they were against 30 μmt-ACPD-induced release. Because LY367385 is considered a mGluR1antagonist, this result implies that either or both LY367385 and CHPG cannot be completely selective for their putative receptor subtypes. Consequently, these pharmacological experiments, by themselves, cannot establish which of the two group I receptors are most prominent on CA1 pyramidal neurons.
Other metabotropic agonists
The experiments with t-ACPD established that spike-evoked release of Ca2+ from internal stores is mediated by IP3 produced by activation of mGluR. Because other neurotransmitters are known to activate receptors that mobilize IP3, we examined whether these transmitters could participate in spike-evoked Ca2+ release in pyramidal neurons. Figure11 shows the effect of carbachol (CCh), a nonhydrolyzable analog of acetylcholine. In this cell 3 μm CCh evoked release with approximately the same amplitude and spatial distribution as 20 μmt-ACPD (n = 3). The effect of 3 μm (n = 10) or 10 μm (n = 11) CCh was very reliable, producing spike-evoked release in 20 of 21 cells. However, 3 μm was close to threshold, because 1 μm did not cause release (n = 6). CCh probably acts via M1 receptors (Hammer and Giachetti, 1984) because release was blocked by atropine (1 μm, n = 3; 3 μm, n = 4; 10 μm, n = 2) and pirenzepine (0.5 μm, n = 3; data not shown). M1 receptors couple to IP3Rs (Hulme et al., 1990). Consistent with this conclusion and with the similarity to t-ACPD-induced release, we found that including low-molecular-weight heparin in the pipette (1 mg/ml) blocked release in the presence of 10 μm CCh (n = 3). In addition, release mediated by including 3-F-IP3 in the pipette occluded the release mediated by 3 μmCCh (n = 2), similar to the results witht-ACPD. Therefore, it is likely that both t-ACPD and CCh release Ca2+ from the same compartment in the same IP3-dependent manner. Some evidence for the coupling of voltage-dependent Ca2+ entry and muscarinic activation in pyramidal neurons has been reported by other investigators (Irving and Collingridge, 1998; Sah, 1999; Yamamoto et al., 2000).
Fig. 11.

CCh and t-ACPD evoke spike-associated Ca2+ release of similar amplitude and spatial distribution in pyramidal cells. In the presence of 30 μmt-ACPD a train of 20 spikes at 30 msec intervals evoked a secondary increase in the soma and proximal apical dendrites (panel 2). The colored traces show the time-dependent increases at the indicated locations on the cell image (panel 1). The pseudocolor image shows the spatial distribution of the [Ca2+]i increase at the end of the spike train. Panel 3 shows the traces and spatial distribution of the [Ca2+]i increase after t-ACPD was washed from the bath. Panel 4 shows the traces and distribution after 3 μmCCh was added. The traces and spatial distribution are similar to those observed in t-ACPD. The graph on theleft shows the peak amplitude of the [Ca2+]i change recorded at the location of the white arrow during the entire course of the experiment. The events at times 1,2, and 3 are shown in the threepanels.
We tested several other neurotransmitters that are known to couple to IP3 mobilization in other preparations. Figure12 shows typical experiments in which we tested 30 or 100 μm phenylephrine (Phe, an α-adrenergic agonist; n = 5), 100 or 300 μm dopamine (DA; n = 7), and 10 μm 5-HT. In each case the agonists did not cause Ca2+ release from intracellular stores. Subsequent application of either 10 μmCCh or 30 μmt-ACPD did evoke release, demonstrating that the ER was intact and capable of release.
Fig. 12.

The metabotropic agonists Phe, DA, and 5-HT do not evoke spike-associated Ca2+ release in pyramidal neurons. A, In the presence of 100 μm Phe a train of 10 backpropagating action potentials at 30 msec intervals evoked only a small spike-linked [Ca2+]i increase. Trials were repeated at 30 sec intervals. One example (1) is shown at the right. When Phe was washed out and replaced by 10 μm CCh, the same train evoked Ca2+release (2). Scale under the traces: Ordinate, 10% ΔF/F, 50 mV; abscissa, 1 sec. B, A similar experiment showing that 300 μm DA did not cause Ca2+ release.C, A similar experiment showing that in most cases 10 μm 5-HT did not cause release.
The experiments with 5-HT were interesting. Although most cells did not respond to 5-HT, in six experiments we found that spikes evoked Ca2+ release in ACSF containing 10 μm 5-HT (Fig. 13;n = 6 of 35). This [Ca2+]i increase initiated and propagated as a wave in the proximal apical dendrites, similar to the release transients observed with t-ACPD and CCh. Increasing the concentration of 5-HT to 30 μm did not increase the probability of observing release (n = 0 of 3). Tests with 100 μm α-methyl-5-HT, a selective 5-HT2 receptor agonist known to mobilize IP3 (Richardson et al., 1985), also caused release in only a fraction of the tested cells (n = 1 of 5). Because the effect of 5-HT was unreliable, we could not analyze its pharmacology nor the spatial distribution of release in more detail.
Fig. 13.

5-HT sometimes evokes spike-associated Ca2+ release in pyramidal cell dendrites. In control conditions a train of 10 spikes at 100 msec intervals evoked spike-linked [Ca2+]i increases in the soma and along the dendrite. When 10 μm 5-HT was added to the ACSF, the spikes evoked a large secondary increase in the dendrites that peaked at different times at the two marked locations. Thegraph to the right of the cell image shows the delay-to-peak of the secondary release along the cell axis. Time 0 is the peak time at the initiation site. The length scale (ordinate) also applies to the cell image. The increase occurred earliest at a point ∼90 μm from the soma and then spread as a wave in both directions from that point. Washing out the 5-HT restored the transients to the control response.
DISCUSSION
These experiments explore the effects of bath-applied and pipette-injected pharmacological agents on the spike-associated release of Ca2+ from intracellular stores. Although the bath-applied agents affected the entire hippocampal slice, several arguments suggest that the major effects were directly on the tested pyramidal neurons and not mediated via other cells. First, all of the measured properties of release evoked by metabotropic agonists matched those of synaptically activated release (Nakamura et al., 1999a). In those experiments the close correspondence of the site of release to the site of synaptic activation indicated that the effect was mediated directly by glutamate released from stimulated Schaffer axon collaterals and not via intermediate cells. Second, astrocytes primarily release glutamate when activated (Parpura et al., 1994). If these cells or other glutamatergic neurons were stimulated in our experiments, their effects on pyramidal neurons would have been overwhelmed by the bath-applied glutamate agonists. Third, the pharmacological profile of effective agonists (CHPG and CCh, but not Phe and DA) matches the profile of known receptor types on CA1 pyramidal neurons (see below).
Mechanism of release
The properties of agonist-induced regenerative [Ca2+]i increase are consistent with our analysis of synaptically activated Ca2+ waves (Nakamura et al., 1999a). These results indicate that the activation of ryanodine-sensitive stores is not necessary to evoke release, although ryanodine receptors are present on the compartment that releases Ca2+. In new experiments we showed that the injection of adenophostin A, 3-F-IP3, and IP3 could promote spike-associated release without the need for metabotropic agonists. The effectiveness of these specific IP3R agonists is more direct evidence for the involvement of the IP3R. In addition, pharmacological experiments indicate that release was promoted by group I mGluRs, M1 muscarinic receptors, and 5-HT2 receptors. All of these receptors are coupled to the mobilization of IP3 (McKinney, 1993; Conn and Pin, 1997; Hoyer and Martin, 1997). One caution is that high concentrations of IP3R agonists were required to promote release (100 μm3-F-IP3 and 500 μmIP3). These levels are higher than are needed to evoke release in other preparations (Hirota et al., 1995; Missiaen et al., 1996). This difference could mean that the IP3Rs in pyramidal neurons are different from receptors in other preparations or that intracellular kinases or other degradative enzymes rapidly metabolize the injected IP3R agonists. However, all of the injected IP3R agonists occluded the large-amplitude spike-associated release mediated by bath-applied metabotropic agonists. This result suggests that the exogenously applied IP3R agonists also might be exerting some inhibitory effect on the release mechanism. We have no additional information concerning this possibility.
Spike-evoked release reached levels of several micromoles per liter when measured with low-affinity indicators. This suggests that resting [Ca2+]i levels in the stores are in the micromolar per liter range, consistent with indicator measurements in other preparations (Miyawaki et al., 1997). We found that large [Ca2+]i increases were observed consistently when short trains of spikes were evoked at 30–60 sec intervals, but lower amplitudes were recorded when they were stimulated at 10–20 sec intervals. The simplest explanation of this result is that the stores require ∼20 sec to refill after regenerative release. This time is comparable to the recovery time that is observed in these cells after store depletion by caffeine puffs (Garaschuk et al., 1997). However, we cannot rule out the possibility that the IP3Rs are inactivated or desensitized for brief periods after stimulation (Hajnoczky and Thomas, 1994).
Spike-evoked release in the presence of t-ACPD was most prominent in the proximal apical dendrites (Nakamura et al., 1999a). Two new kinds of measurements reinforce the conclusion that this part of the cell is particularly sensitive. First, we found that threshold levels of mGluR agonists caused release only in the proximal apical dendrites, whereas higher concentrations also caused release in the soma. Mirroring this finding, we found that threshold levels of antagonists selectively blocked release in the soma, sparing the dendrites, whereas higher concentrations blocked release everywhere. In addition, when a single initiation site was detected (see, for example, Fig. 1), it was always in the proximal apical dendrites. Second, we found that the same spatial distribution was determined with all of the agonists that evoked release—group I mGluR, M1muscarinic, and 5-HT2. This similarity suggests that the distribution of metabotropic receptors on the surface of the pyramidal neuron is not responsible for the spatial distribution of regenerative release, because this would require the same nonuniform distribution for all receptors. The distribution of Ca2+ channels is also unlikely to be responsible because (1) selective block of different Ca2+ channel types did not affect the pattern of release and (2) the same pattern was observed without spikes when the release was evoked synaptically (Nakamura et al., 1999a). The more likely explanations are either that IP3Rs are distributed more densely on the ER in the proximal apical dendrites or that the IP3Rs are more sensitive in this region of the cell (Thomas et al., 2000).
Receptors contributing to spike-evoked Ca2+ release
Using specific agonists and antagonists, we analyzed the receptors contributing to the regenerative [Ca2+]i increase. Previously (Nakamura et al., 1999a), we found that t-ACPD, a relatively nonselective mGluR agonist, reliably evoked release. In these new experiments we found that DHPG, a group I agonist, and CHPG, a mGluR5 agonist, also evoked release. These results are expected because pyramidal neurons express mGluR5 receptors (Shigemoto et al., 1993; Romano et al., 1995; Lujan et al., 1996). Consistent with these observations, we found that the phenylgycine-related antagonists MCPG, AIDA, and 4-CPG blocked release evoked by t-ACPD. These compounds block both group I receptors, although their relative affinity for mGluR1 and mGluR5 varies (Schoepp et al., 1999). We were not able to determine whether only one of these subtypes releases Ca2+ in pyramidal neurons, because some of the pharmacological agents were not as specific as previously reported. Nevertheless, the presence of either receptor on pyramidal neurons is consistent with our other results because both receptor subtypes are known to couple to IP3 mobilization (Schoepp et al., 1999).
Experiments with other neurotransmitters are consistent with these results and with the known distribution of receptors on pyramidal neurons. CCh and 5-HT evoked spike-associated release with the same spatial distribution as was evoked with mGluR agonists, suggesting that the spatial distribution of release was not determined by the distribution of the transmitter receptors on the surface of pyramidal neurons. Pharmacological experiments indicated that both of these agonists acted on receptors coupled to IP3mobilization. The effect of CCh was reliable, consistent with the strong expression of M1 receptors on pyramidal neurons (Rouse et al., 1999). In contrast, release evoked by 5-HT was observed in only a fraction of cells. Neither DA nor Phe evoked release in pyramidal neurons, although these transmitters are known to mobilize IP3 in other systems. The weak effect of these three agents may be related to the low expression level of the matching receptors or mRNAs in the CA1 region (Wright et al., 1995; Day et al., 1997; Khan et al., 1998). However, the density of these receptors on pyramidal neurons has not been determined carefully at the electron microscope level.
Relative localization of critical molecules
The configuration of mGluR receptors, Ca2+ channels, and IP3Rs can affect the sensitivity and specificity of the signaling process underlying the release of Ca2+ from intracellular stores. In other cell types a close relationship among some of these components has been described. In muscle and some neurons, L-type Ca2+ channels and ryanodine receptors are thought to be close to each other, allowing Ca2+ entry through the L-type channels to activate the ryanodine receptors preferentially (Chavis et al., 1996). In CA1 pyramidal cells, group I mGluR receptors and IP3Rs are linked by Homer, a protein enriched at the postsynaptic density (Tu et al., 1998), suggesting that these IP3Rs are positioned appropriately to detect the IP3 mobilized by mGluR activation. In addition, there is conflicting evidence from different preparations that IP3Rs may be very close to each other in certain regions of the ER. Several of our experiments provide data that can be used to explore these issues.
We found no evidence that specific Ca2+ channel types were linked closely to IP3Rs. Cd2+, a general Ca2+ channel blocker, prevented almost all Ca2+ entry and prevented Ca2+ release. No specifically tested channel blocker (nimodipine, Ni2+, ω-conotoxin-GVIA, or ω-agatoxin-IVA) by itself prevented release. However, the Cd2+ results suggest that a cocktail of blockers might have been effective. We did not test this hypothesis. In addition, the possibility that R-type channels might be linked to IP3Rs was not examined.
Most models of IP3-mediated Ca2+ waves postulate that Ca2+ released through IP3Rs contributes to the activation of nearby IP3Rs (Lechleiter and Clapham, 1992; Wang and Thompson, 1995). In their analysis of waves in neuroblastoma cells,Wang and Thompson (1995) found that BAPTA was much more effective than EGTA in suppressing the waves. Consequently, they concluded that the feedback from one IP3R to the next must be local, with receptors separated from each other by 1 μm or less. In our experiments in which these two buffers were loaded through the pipette, we found that the threshold for suppressing Ca2+ release was only two times higher for EGTA than for BAPTA. This approximately equal value, despite the difference in rate constants for Ca2+binding (Naraghi, 1997), suggests that in pyramidal neurons the IP3Rs are further apart. This more widespread separation of IP3Rs is consistent with results inXenopus oocytes. In those cells Marchant et al. (1999) found that Ca2+ was released in “puffs” from clusters of IP3Rs that were at least several micrometers apart. It is also possible that EGTA is buffering Ca2+ as it diffuses from the Ca2+ channels to the IP3Rs. These experiments do not distinguish between these two possibilities.
It is well established that both EGTA (Lynch et al., 1983) and BAPTA (Huang and Malenka, 1993), injected postsynaptically, can prevent the induction of LTP by tetanic stimulation, whereas only BAPTA can block some other postsynaptic processes (Deisseroth et al., 1996). If regenerative release of Ca2+ from intracellular stores is an important step in the induction of LTP, then our experiments may explain the effectiveness of both of these buffers in blocking it.
Physiological evidence concerning the spatial relationship between mGluRs and IP3Rs is much weaker. In our previous experiments (Nakamura et al., 1999a) we found that spikes had to occur within ∼0.5 sec from the time of synaptic activation of mGluR. Even if IP3 is mobilized instantaneously, this result suggests that IP3 is metabolized rapidly in pyramidal cells. Therefore, IP3 cannot diffuse far from its source before activating IP3Rs. From this perspective the close association of mGluRs and IP3Rs mediated by Homer ensures the effectiveness of IP3 before it is metabolized. We do not know whether there is a parallel mechanism associating muscarinic receptors and IP3Rs.
Footnotes
This work was supported in part by National Institutes of Health Grant NS16295 and a grant and a fellowship (J.-G.B.) from the Human Frontier Science Program. We thank Drs. M. Takahashi and K. Tanzawa for the generous gift of adenophostin A and Drs. Michael Massett and Zoltan Ungvari for help with measurements on isolated rat arterioles.
Correspondence should be addressed to Dr. William Ross, Department of Physiology, New York Medical College, Valhalla, NY 10595. E-mail:ross@nymc.edu.
REFERENCES
- 1.Adler EM, Augustine GL, Duffy SN, Charlton MP. Alien intracellular calcium chelators attenuate neurotransmitter release at the squid giant synapse. J Neurosci. 1991;11:1496–1507. doi: 10.1523/JNEUROSCI.11-06-01496.1991. [DOI] [PMC free article] [PubMed] [Google Scholar]
- 2.Barbara J-G, Nakamura T, Nakamura K, Ross WN. Spike-evoked Ca2+ release in hippocampal pyramidal neurons is mediated by InsP3 and not calcium-induced calcium release. Soc Neurosci Abstr. 1999;25:1248. [Google Scholar]
- 3.Bianchi R, Young SR, Wong RKS. Group I mGluR activation causes voltage-dependent and voltage-independent Ca2+ increases in hippocampal pyramidal cells. J Neurophysiol. 1999;81:2903–2913. doi: 10.1152/jn.1999.81.6.2903. [DOI] [PubMed] [Google Scholar]
- 4.Buzsáki G, Penttonen M, Nadasdy Z, Bragin A. Pattern and inhibition-dependent invasion of pyramidal cell dendrites by fast spikes in the hippocampus in vivo. Proc Natl Acad Sci USA. 1996;93:9921–9925. doi: 10.1073/pnas.93.18.9921. [DOI] [PMC free article] [PubMed] [Google Scholar]
- 5.Callaway JC, Ross WN. Frequency-dependent propagation of sodium action potentials in dendrites of hippocampal CA1 pyramidal neurons. J Neurophysiol. 1995;74:1395–1403. doi: 10.1152/jn.1995.74.4.1395. [DOI] [PubMed] [Google Scholar]
- 6.Chavis P, Fagni L, Lansman JB, Bockaert J. Functional coupling between ryanodine receptors and L-type calcium channels in neurons. Nature. 1996;382:719–722. doi: 10.1038/382719a0. [DOI] [PubMed] [Google Scholar]
- 7.Christie BR, Eliot LS, Ito K-I, Miyakawa H, Johnston D. Different Ca2+ channels in soma and dendrites of hippocampal pyramidal neurons mediate spike-induced Ca2+ influx. J Neurophysiol. 1995;73:2553–2557. doi: 10.1152/jn.1995.73.6.2553. [DOI] [PubMed] [Google Scholar]
- 8.Clark BP, Baker SR, Goldsworthy J, Harris JR, Kingston AE. 2-Methoxy-4-carboxyphenyglycine (LY367385) selectively antagonizes metabotropic glutamate mGluR1 receptors. Bioorg Med Chem Lett. 1997;7:2777–2780. [Google Scholar]
- 9.Congar P, Leinekugel X, Ben-Ari Y, Crepel V. A long-lasting calcium-activated nonselective cationic current is generated by synaptic stimulation or exogenous activation of group I metabotropic glutamate receptors in CA1 pyramidal neurons. J Neurosci. 1997;17:5366–5379. doi: 10.1523/JNEUROSCI.17-14-05366.1997. [DOI] [PMC free article] [PubMed] [Google Scholar]
- 10.Conn PJ, Pin JP. Pharmacology and function of metabotropic glutamate receptors. Annu Rev Pharmacol Toxicol. 1997;37:205–237. doi: 10.1146/annurev.pharmtox.37.1.205. [DOI] [PubMed] [Google Scholar]
- 11.Day HE, Campeau S, Watson SJ, Jr, Akil H. Distribution of α1a, α1b-, and α1d-adrenergic receptor mRNA in the rat brain and spinal cord. J Chem Neuroanat. 1997;13:115–139. doi: 10.1016/s0891-0618(97)00042-2. [DOI] [PubMed] [Google Scholar]
- 12.Deisseroth K, Bito H, Tsien RW. Signaling from synapse to nucleus: postsynaptic CREB phosphorylation during multiple forms of hippocampal synaptic plasticity. Neuron. 1996;16:89–101. doi: 10.1016/s0896-6273(00)80026-4. [DOI] [PubMed] [Google Scholar]
- 13.Doherty AJ, Palmer MJ, Henley JM, Collingridge GL, Jane DE. (R,S)-2-Chloro-5-hydroxyphenylglycine (CHPG) activates mGlu5, but not mGlu1, receptors expressed in CHO cells and potentiates NMDA responses in the hippocampus. Neuropharmacology. 1997;36:265–267. doi: 10.1016/s0028-3908(97)00001-4. [DOI] [PubMed] [Google Scholar]
- 14.Garaschuk O, Yaari Y, Konnerth A. Release and sequestration of calcium by ryanodine-sensitive stores in rat hippocampal neurones. J Physiol (Lond) 1997;502:13–30. doi: 10.1111/j.1469-7793.1997.013bl.x. [DOI] [PMC free article] [PubMed] [Google Scholar]
- 15.Gasparini F, Lingenhohl K, Stoehr N, Flor PJ, Heinrich M, Vranesic I, Biollaz M, Allgeier H, Heckendorn R, Urwyler S, Varney MA, Johnson EC, Hess SD, Rao SP, Sacaan AI, Santori EM, Velicelebi G, Kuhn R. 2-Methyl-6-(phenylethynyl)-pyridine (MPEP), a potent, selective, and systemically active mGlu5 receptor antagonist. Neuropharmacology. 1999;38:1493–1503. doi: 10.1016/s0028-3908(99)00082-9. [DOI] [PubMed] [Google Scholar]
- 16.Ghosh TK, Eis PS, Mullaney JM, Ebert CL, Gill DL. Competitive, reversible, and potent antagonism of inositol 1,4,5-trisphosphate-activated calcium release by heparin. J Biol Chem. 1988;263:11075–11079. [PubMed] [Google Scholar]
- 17.Hajnoczky G, Thomas AP. The inositol trisphosphate calcium channel is inactivated by inositol trisphosphate. Nature. 1994;370:474–477. doi: 10.1038/370474a0. [DOI] [PubMed] [Google Scholar]
- 18.Hammer R, Giachetti A. Selective muscarinic receptor antagonists. Trends Pharmacol Sci. 1984;5:18–20. [Google Scholar]
- 19.Helmchen F, Imoto K, Sakmann B. Ca2+ buffering and action potential-evoked Ca2+ signaling in dendrites of pyramidal neurons. Biophys J. 1996;70:1069–1081. doi: 10.1016/S0006-3495(96)79653-4. [DOI] [PMC free article] [PubMed] [Google Scholar]
- 20.Hirota J, Michikawa T, Miyawaki A, Takahashi M, Tanzawa K, Okura I, Furuichi T, Mikoshiba K. Adenophostin-mediated quantal Ca2+ release in the purified and reconstituted inositol 1,4,5-trisphosphate receptor type 1. FEBS Lett. 1995;368:248–252. doi: 10.1016/0014-5793(95)00659-w. [DOI] [PubMed] [Google Scholar]
- 21.Hoffman DA, Johnston D. Neuromodulation of dendritic action potentials. J Neurophysiol. 1999;81:408–411. doi: 10.1152/jn.1999.81.1.408. [DOI] [PubMed] [Google Scholar]
- 22.Hoyer D, Martin G. 5-HT receptor classification and nomenclature: towards a harmonization with the human genome. Neuropharmacology. 1997;36:419–428. doi: 10.1016/s0028-3908(97)00036-1. [DOI] [PubMed] [Google Scholar]
- 23.Huang YY, Malenka RC. Examination of TEA-induced synaptic enhancement in area CA1 of the hippocampus: the role of voltage-dependent Ca2+ channels in the induction of LTP. J Neurosci. 1993;13:568–576. doi: 10.1523/JNEUROSCI.13-02-00568.1993. [DOI] [PMC free article] [PubMed] [Google Scholar]
- 24.Hulme EC, Birdsall NJM, Buckley NJ. Muscarinic receptor subtypes. Annu Rev Pharmacol Toxicol. 1990;30:633–673. doi: 10.1146/annurev.pa.30.040190.003221. [DOI] [PubMed] [Google Scholar]
- 25.Irving AJ, Collingridge GL. A characterization of muscarinic receptor-mediated intracellular Ca2+ mobilization in cultured rat hippocampal neurones. J Physiol (Lond) 1998;511:747–759. doi: 10.1111/j.1469-7793.1998.747bg.x. [DOI] [PMC free article] [PubMed] [Google Scholar]
- 26.Jaffe DB, Brown TH. Metabotropic glutamate receptor activation induces calcium waves within hippocampal dendrites. J Neurophysiol. 1994;72:471–474. doi: 10.1152/jn.1994.72.1.471. [DOI] [PubMed] [Google Scholar]
- 27.Jaffe DB, Johnston D, Lasser-Ross N, Lisman JE, Miyakawa H, Ross WN. The spread of Na+ spikes determines the pattern of dendritic Ca2+ entry into hippocampal neurons. Nature. 1992;357:244–246. doi: 10.1038/357244a0. [DOI] [PubMed] [Google Scholar]
- 28.Khan ZU, Gutierrez A, Martin R, Penafiel A, Rivera A, De La Calle A. Differential regional and cellular distribution of dopamine D2-like receptors: an immunocytochemical study of subtype-specific antibodies in rat and human brain. J Comp Neurol. 1998;402:353–371. doi: 10.1002/(sici)1096-9861(19981221)402:3<353::aid-cne5>3.0.co;2-4. [DOI] [PubMed] [Google Scholar]
- 29.Kobayashi S, Somlyo AV, Somlyo AP. Heparin inhibits the inositol 1,4,5-trisphosphate-dependent, but not the independent, calcium release induced by guanine nucleotide in vascular smooth muscle. Biochem Biophys Res Commun. 1988;153:625–631. doi: 10.1016/s0006-291x(88)81141-0. [DOI] [PubMed] [Google Scholar]
- 30.Kozikowski AP, Fauq AH. Synthesis of the first optically pure, fluorinated inositol 1,4,5-trisphosphate of myo-inositol stereochemistry and its effect on Ca2+ release in Swiss 3T3 cells. J Am Chem Soc. 1990;112:7403–7404. [Google Scholar]
- 31.Lasser-Ross N, Miyakawa H, Lev-Ram V, Young SR, Ross WN. High time resolution fluorescence imaging with a CCD camera. J Neurosci Methods. 1991;36:253–261. doi: 10.1016/0165-0270(91)90051-z. [DOI] [PubMed] [Google Scholar]
- 32.Lechleiter JD, Clapham DE. Molecular mechanisms of intracellular calcium excitability in Xenopus laevis oocytes. Cell. 1992;69:283–294. doi: 10.1016/0092-8674(92)90409-6. [DOI] [PubMed] [Google Scholar]
- 33.Lev-Ram V, Miyakawa H, Lasser-Ross N, Ross WN. Calcium transients in cerebellar Purkinje neurons evoked by intracellular stimulation. J Neurophysiol. 1992;68:1167–1177. doi: 10.1152/jn.1992.68.4.1167. [DOI] [PubMed] [Google Scholar]
- 34.Lujan R, Nusser Z, Roberts JD, Shigemoto R, Somogyi P. Perisynaptic location of metabotropic glutamate receptors mGluR1 and mGluR5 on dendrites and dendritic spines in the rat hippocampus. Eur J Neurosci. 1996;8:1488–1500. doi: 10.1111/j.1460-9568.1996.tb01611.x. [DOI] [PubMed] [Google Scholar]
- 35.Lynch G, Larson J, Kelso S, Barrionuevo G, Schottler F. Intracellular injections of EGTA block induction of hippocampal long-term potentiation. Nature. 1983;305:719–721. doi: 10.1038/305719a0. [DOI] [PubMed] [Google Scholar]
- 36.Magee JC, Johnston D. Characterization of single voltage-gated Na+ and Ca2+ channels in apical dendrites of rat CA1 pyramidal neurons. J Physiol (Lond) 1995;487:67–90. doi: 10.1113/jphysiol.1995.sp020862. [DOI] [PMC free article] [PubMed] [Google Scholar]
- 37.Magee JC, Johnston D. A synaptically controlled associative signal for Hebbian plasticity in hippocampal neurons. Science. 1997;275:209–213. doi: 10.1126/science.275.5297.209. [DOI] [PubMed] [Google Scholar]
- 38.Magee JC, Avery RB, Christie BR, Johnston D. Dihydropyridine-sensitive, voltage-gated Ca2+ channels contribute to the resting intracellular Ca2+ concentration of hippocampal CA1 pyramidal neurons. J Neurophysiol. 1996;76:3460–3470. doi: 10.1152/jn.1996.76.5.3460. [DOI] [PubMed] [Google Scholar]
- 39.Marchant J, Callamaras N, Parker I. Initiation of IP3-mediated Ca2+ waves in Xenopus oocytes. EMBO J. 1999;18:5285–5299. doi: 10.1093/emboj/18.19.5285. [DOI] [PMC free article] [PubMed] [Google Scholar]
- 40.Markram H, Lubke J, Frotscher M, Sakmann B. Regulation of synaptic efficacy by coincidence of postsynaptic APs and EPSPs. Science. 1997;275:213–215. doi: 10.1126/science.275.5297.213. [DOI] [PubMed] [Google Scholar]
- 41.McCleskey EW, Fox AP, Feldman DH, Cruz LJ, Olivera BM, Tsien RW, Yoshikami D. Omega-conotoxin: direct and persistent blockage of specific types of calcium channels in neurons, but not muscle. Proc Natl Acad Sci USA. 1987;84:4327–4331. doi: 10.1073/pnas.84.12.4327. [DOI] [PMC free article] [PubMed] [Google Scholar]
- 42.McKinney M. Muscarinic receptor subtype-specific coupling to second messengers in neuronal systems. Prog Brain Res. 1993;98:333–340. doi: 10.1016/s0079-6123(08)62416-4. [DOI] [PubMed] [Google Scholar]
- 43.Mermelstein PG, Bito H, Deisseroth K, Tsien RW. Critical dependence of cAMP response element-binding protein phosphorylation on L-type calcium channels supports a selective response to EPSPs in preference to action potentials. J Neurosci. 2000;20:266–273. doi: 10.1523/JNEUROSCI.20-01-00266.2000. [DOI] [PMC free article] [PubMed] [Google Scholar]
- 44.Mintz IM, Venema VJ, Swiderek KM, Lee TD, Bean BP, Adams ME. P-type calcium channels blocked by the spider toxin ω-Aga-IVA. Nature. 1992;355:827–829. doi: 10.1038/355827a0. [DOI] [PubMed] [Google Scholar]
- 45.Missiaen L, DeSmedt H, Parys JB, Sienaert I, Valingen S, Casteels R. Threshold for inositol 1,4,5-trisphosphate action. J Biol Chem. 1996;271:12287–12293. doi: 10.1074/jbc.271.21.12287. [DOI] [PubMed] [Google Scholar]
- 46.Miyawaki A, Llopis J, Heim R, McCaffery JM, Adams JA, Ikura M, Tsien RY. Fluorescent indicators for Ca2+ based on green fluorescent proteins and calmodulin. Nature. 1997;388:882–887. doi: 10.1038/42264. [DOI] [PubMed] [Google Scholar]
- 47.Mogul DJ, Fox AP. Evidence for multiple types of Ca2+ channels in acutely isolated hippocampal CA3 neurones of the guinea-pig. J Physiol (Lond) 1991;433:259–281. doi: 10.1113/jphysiol.1991.sp018425. [DOI] [PMC free article] [PubMed] [Google Scholar]
- 48.Muschol M, Dasgupta BR, Salzberg BM. Caffeine interaction with fluorescent calcium indicators. Biophys J. 1999;77:577–586. doi: 10.1016/S0006-3495(99)76914-6. [DOI] [PMC free article] [PubMed] [Google Scholar]
- 49.Nakamura T, Barbara J-G, Nakamura K, Ross WN. Synerigistic release of Ca2+ from InsP3-sensitive stores evoked by synaptic activation of mGlu receptors paired with backpropagating action potentials. Neuron. 1999a;24:727–737. doi: 10.1016/s0896-6273(00)81125-3. [DOI] [PubMed] [Google Scholar]
- 50.Nakamura T, Barbara J-G, Nakamura K, Lasser-Ross N, Ross WN. Spike-evoked release of Ca2+ from internal stores in the presence of t-ACPD or carbachol. Soc Neurosci Abstr. 1999b;25:1248. [Google Scholar]
- 51.Nakamura T, Nakamura K, Lasser-Ross N, Ross WN. Properties of Ca2+ release evoked by metabotropic agonists and backpropagating action potentials in the dendrites of CA1 pyramidal neurons. Soc Neurosci Abstr. 2000;26:1627. doi: 10.1523/JNEUROSCI.20-22-08365.2000. [DOI] [PMC free article] [PubMed] [Google Scholar]
- 52.Naraghi M. T-jump study of calcium binding kinetics of calcium chelators. Cell Calcium. 1997;22:255–268. doi: 10.1016/s0143-4160(97)90064-6. [DOI] [PubMed] [Google Scholar]
- 53.Ozawa S, Tsuzuki K, Iino M, Ogura A, Kudo Y. Three types of voltage-dependent calcium current in cultured rat hippocampal neurons. Brain Res. 1989;495:329–336. doi: 10.1016/0006-8993(89)90225-4. [DOI] [PubMed] [Google Scholar]
- 54.Parker I, Ivorra I. Caffeine inhibits inositol trisphosphate-mediated liberation of intracellular calcium in Xenopus oocytes. J Physiol (Lond) 1991;433:229–240. doi: 10.1113/jphysiol.1991.sp018423. [DOI] [PMC free article] [PubMed] [Google Scholar]
- 55.Parpura P, Basarsky TA, Liu F, Jeftinija K, Haydon PG. Glutamate-mediated astrocyte–neuron signaling. Nature. 1994;369:744–747. doi: 10.1038/369744a0. [DOI] [PubMed] [Google Scholar]
- 56.Richardson BP, Engel G, Donatsch P, Stadler PA. Identification of serotonin M-receptor subtypes and their specific blockage by a new class of drugs. Nature. 1985;316:126–131. doi: 10.1038/316126a0. [DOI] [PubMed] [Google Scholar]
- 57.Romano C, Sesma MA, McDonald CT, O'Malley K, van den Pol AN, Olney JW. Distribution of metabotropic glutamate receptor mGluR5 immunoreactivity in rat brain. J Comp Neurol. 1995;355:455–469. doi: 10.1002/cne.903550310. [DOI] [PubMed] [Google Scholar]
- 58.Ross WN, Sandler V. Serotonin and spikes synergistically release calcium in dendrites of hippocampal pyramidal cells. Soc Neurosci Abstr. 1998;24:80. [Google Scholar]
- 59.Rouse ST, Marino MJ, Potter LT, Conn PJ, Levey AI. Muscarinic receptor subtypes involved in hippocampal circuits. Life Sci. 1999;64:501–509. doi: 10.1016/s0024-3205(98)00594-3. [DOI] [PubMed] [Google Scholar]
- 60.Rousseau E, Smith JS, Meissner G. Ryanodine modifies conductance and gating behavior of single Ca2+ release channel. Am J Physiol. 1987;253:C364–C368. doi: 10.1152/ajpcell.1987.253.3.C364. [DOI] [PubMed] [Google Scholar]
- 61.Sah P. Calcium waves and oscillations evoked by muscarinic stimulation in hippocampal CA1 pyramidal neurons. Soc Neurosci Abstr. 1999;25:1249. [Google Scholar]
- 62.Sakmann B, Stuart G. Patch-pipette recordings from the soma, dendrites, and axon of neurons in brain slices. In: Sakmann B, Neher E, editors. Single channel recording, 2nd Ed. Plenum; New York: 1995. pp. 199–211. [Google Scholar]
- 63.Sandler VM, Barbara J-G. Calcium-induced calcium release contributes to action potential-evoked calcium transients in hippocampal CA1 pyramidal neurons. J Neurosci. 1999;19:4325–4336. doi: 10.1523/JNEUROSCI.19-11-04325.1999. [DOI] [PMC free article] [PubMed] [Google Scholar]
- 64.Sandler VM, Ross WN. Serotonin modulates spike backpropagation and associated [Ca2+]i changes in the apical dendrites of hippocampal CA1 pyramidal neurons. J Neurophysiol. 1999;81:216–224. doi: 10.1152/jn.1999.81.1.216. [DOI] [PubMed] [Google Scholar]
- 65.Schneggenburger R, Meyer AC, Neher E. Released fraction and total size of a pool of immediately available transmitter quanta at a calyx synapse. Neuron. 1999;23:399–409. doi: 10.1016/s0896-6273(00)80789-8. [DOI] [PubMed] [Google Scholar]
- 66.Schoepp DD, Jane DE, Monn JA. Pharmacological agents acting at subtypes of metabotropic glutamate receptors. Neuropharmacology. 1999;38:1431–1476. doi: 10.1016/s0028-3908(99)00092-1. [DOI] [PubMed] [Google Scholar]
- 67.Seidler NW, Jona I, Vegh M, Martonosi A. Cyclopiazonic acid is a specific inhibitor of the Ca2+-ATPase of sarcoplasmic reticulum. J Biol Chem. 1989;264:17816–17823. [PubMed] [Google Scholar]
- 68.Shigemoto R, Nomura S, Ohishi H, Sugihara H, Nakanishi S, Mizuno N. Immunohistochemical localization of a metabotropic glutamate receptor, mGluR5, in the rat brain. Neurosci Lett. 1993;163:53–57. doi: 10.1016/0304-3940(93)90227-c. [DOI] [PubMed] [Google Scholar]
- 69.Smith SJ, Imagawa T, Ma J, Fill M, Campbell KP, Coronado R. Purified ryanodine receptor from rabbit skeletal muscle is the calcium-release channel of sarcoplasmic reticulum. J Gen Physiol. 1988;92:1–26. doi: 10.1085/jgp.92.1.1. [DOI] [PMC free article] [PubMed] [Google Scholar]
- 70.Spruston N, Schiller Y, Stuart G, Sakmann B. Activity-dependent action potential invasion and calcium influx into hippocampal CA1 dendrites. Science. 1995;268:297–300. doi: 10.1126/science.7716524. [DOI] [PubMed] [Google Scholar]
- 71.Takahashi M, Tanzawa K, Takahashi S. Adenophostins, newly discovered metabolites of Penicillium brevecompactum, act as potent agonists of the inositol 1,4,5-trisphosphate receptor. J Biol Chem. 1994;269:369–372. [PubMed] [Google Scholar]
- 72.Thastrup O, Cullen PJ, Drobak BK, Hanley MR, Dawson AP. Thapsigargin, a tumor promotor, discharges intracellular Ca2+ stores by specific inhibition of the endoplasmic reticulum Ca2+-ATPase. Proc Natl Acad Sci USA. 1990;87:2466–2470. doi: 10.1073/pnas.87.7.2466. [DOI] [PMC free article] [PubMed] [Google Scholar]
- 73.Thomas D, Lipp P, Tovey SC, Berridge MJ, Li W, Tsien RY, Bootman MD. Microscopic properties of elementary Ca2+ release sites in nonexcitable cells. Curr Biol. 2000;10:8–15. doi: 10.1016/s0960-9822(99)00258-4. [DOI] [PubMed] [Google Scholar]
- 74.Tombaugh GC, Somjen GG. Differential sensitivity to intracellular pH among high- and low-threshold Ca2+ currents in isolated rat CA1 neurons. J Neurophysiol. 1997;77:639–653. doi: 10.1152/jn.1997.77.2.639. [DOI] [PubMed] [Google Scholar]
- 75.Tsubokawa H, Ross WN. IPSPs modulate spike backpropagation and associated [Ca2+]i changes in the dendrites of hippocampal CA1 pyramidal neurons. J Neurophysiol. 1996;76:2896–2906. doi: 10.1152/jn.1996.76.5.2896. [DOI] [PubMed] [Google Scholar]
- 76.Tsubokawa H, Ross WN. Muscarinic modulation of spike backpropagation in the apical dendrites of hippocampal CA1 pyramidal neurons. J Neurosci. 1997;17:5782–5791. doi: 10.1523/JNEUROSCI.17-15-05782.1997. [DOI] [PMC free article] [PubMed] [Google Scholar]
- 77.Tu JC, Xiao B, Yuan JP, Lanahan AA, Leoffert K, Li M, Linden DJ, Worley PF. Homer binds a novel proline-rich motif and links group I metabotropic glutamate receptors with IP3 receptors. Neuron. 1998;21:717–726. doi: 10.1016/s0896-6273(00)80589-9. [DOI] [PubMed] [Google Scholar]
- 78.Turner RW, Meyers DE, Richardson TL, Barker JL. The site for initiation of action potential discharge over the somatodendritic axis of hippocampal CA1 pyramidal neurons. J Neurosci. 1991;11:2270–2280. doi: 10.1523/JNEUROSCI.11-07-02270.1991. [DOI] [PMC free article] [PubMed] [Google Scholar]
- 79.Ungvari Z, Pacher P, Koller A. Serotonin reuptake inhibitor fluoxetine decreases arteriolar myogenic tone by reducing smooth muscle [Ca2+]i. J Cardiovasc Pharmacol. 2000;35:849–854. doi: 10.1097/00005344-200006000-00004. [DOI] [PubMed] [Google Scholar]
- 80.Usachev YM, Thayer SA. All-or-none Ca2+ release from intracellular stores triggered by Ca2+ influx through voltage-gated Ca2+ channels in rat sensory neurons. J Neurosci. 1997;17:7404–7414. doi: 10.1523/JNEUROSCI.17-19-07404.1997. [DOI] [PMC free article] [PubMed] [Google Scholar]
- 81.Wang S-H, Thompson SH. Local positive feedback by calcium in the propagation of intracellular calcium waves. Biophys J. 1995;69:1683–1697. doi: 10.1016/S0006-3495(95)80086-X. [DOI] [PMC free article] [PubMed] [Google Scholar]
- 82.Westenbroek RE, Ahlijanian MK, Catterall WA. Clustering of L-type Ca2+ channels at the base of major dendrites in hippocampal pyramidal neurons. Nature. 1990;347:281–284. doi: 10.1038/347281a0. [DOI] [PubMed] [Google Scholar]
- 83.Wright DE, Seroogy KB, Lundgren KH, Davis BM, Jennes L. Comparative localization of serotonin 1A, 1C, and 2 receptor subtype mRNAs in rat brain. J Comp Neurol. 1995;16:357–373. doi: 10.1002/cne.903510304. [DOI] [PubMed] [Google Scholar]
- 84.Yamamoto K, Hashimoto K, Isomura Y, Shimohama S, Kato N. An IP3-assisted form of Ca2+-induced Ca2+ release in neocortical neurons. NeuroReport. 2000;11:535–539. doi: 10.1097/00001756-200002280-00022. [DOI] [PubMed] [Google Scholar]
- 85.Zucchi R, Ronca-Testoni S. The sarcoplasmic reticulum Ca2+ channel/ryanodine receptor—modulation by endogenous effectors, drugs, and disease states. Pharmacol Rev. 1997;49:1–51. [PubMed] [Google Scholar]