

Abstract
Male stingrays use their ampullary electroreceptors to locate mates, but the effect of gonadal androgens on electrosensory encoding during the reproductive season is unknown. We tested the hypothesis that gonadal androgens induce neurophysiological changes in the electrosense of male Atlantic stingrays. During the primary androgen increase in wild males, the electrosensory primary afferent neurons show an increase in discharge regularity, a downshift in best frequency (BF) and bandpass, and a greater sensitivity to low-frequency stimuli from 0.01 to 4 Hz. Experimental implants of dihydrotestosterone in male stingrays induced a similar lowered BF and bandpass and increased average neural sensitivity to low-frequency stimuli (0.5–2 Hz) by a factor of 1.5. Primary afferents from long ampullary canals (>3 cm) were more sensitive and had a lower bandpass and BF than did afferents from short canals (<2 cm). We propose that these androgen-induced changes in the frequency response properties of electrosensory afferents enhance mate detection by male stingrays and may ultimately increase the number of male reproductive encounters with females. Furthermore, differences in primary afferent sensitivity among short and long canals may facilitate detection, orientation, and localization of conspecifics during social interactions.
Keywords: ampullae of Lorenzini, androgen, elasmobranch, electroreceptor, DHT, frequency response
Gonadal steroid hormones can exert profound influences on the vertebrate CNS during prematuration development and during periodic reproductive cycles as adults. Steroids that are produced by gametogenic tissues can induce changes in neuronal ultrastructure, synaptic morphology, membrane conductances, and electrical activity in behaviorally important motor circuits (Kelly, 1982; Arnold and Gorski, 1984; Matsumoto et al., 1988; Harrison et al., 1989). These influences can ultimately induce behavioral changes in aggression, parental care, and reproductive behavior (Kelley, 1988).
Previous studies of electromotor and electroreceptor systems of weakly electric fishes show that androgens and estrogens can alter the electromotor properties and tuning of tuberous electroreceptors associated with this sensorimotor system, which is used for electrolocation and social communication (Bass, 1986; Zakon, 1996). Although the teleost electrosensory system is a productive model for gonadal steroid effects on tuberous electroreceptors, nothing is published about gonadal steroid effects on the ampullary electroreceptor system, which is also used for orientation and social communication in elasmobranchs (Kalmijn, 1974; Paulin, 1995; Tricas et al., 1995).
Elasmobranch fishes (sharks and rays) lack tuberous electroreceptors but have evolved an elaborate ampullary electroreceptor system that can detect weak bioelectric fields <5 nV/cm (Kalmijn, 1982). Male stingrays use the electrosensory system to detect and locate female conspecifics during the mating season (Tricas et al., 1995). Populations of the Atlantic stingray, Dasyatis sabina, exhibit a protracted mating period from August through April (Maruska et al., 1996). In males, androgens cycle in four phases (see Fig. 1) (Tricas et al., 2000): (1) androgen suppression (AS), which occurs between reproductive seasons during which testis tissue is inactive and serum androgen levels are low; (2) primary androgen increase (PAI), which occurs during the onset of spermatocyte development and reproductive season; (3) androgen decrease (AD), which occurs after maximum testis growth and spermatocyte development; and (4) secondary androgen increase (SAI), which occurs during the peak of sperm maturation and the end of the reproductive season. These periodic fluctuations in serum androgen levels are also correlated with variation in dental sexual dimorphism, aggression, and reproductive behavior (Kajiura and Tricas, 1996; Kajiura et al., 2000; Tricas et al., 2000). The importance of the electrosense during mating and associated seasonal changes in serum steroids provides an excellent model system to investigate the possible effects of gonadal steroids on the ampullary electroreceptor system.
Fig. 1.

Annual cycle of serum dihydrotestosterone (DHT) hormone concentrations (median values) in male Atlantic stingrays, D. sabina, collected from the Banana River estuary between April 1993 and May 1994. This Figure was modified from Tricas et al. (2000). Serum DHT levels in male stingrays show four phases within the annual cycle: (1) androgen suppression (AS) between reproductive seasons (April – July), (2) primary androgen increase (PIA) during the onset of spermatocyte development (August – October), (3) androgen decrease (AD) after maximum testis growth and spermatocyte development (November – December), and (4) secondary androgen increase (SAI) during the peak of sperm maturation (January – March).
We test the hypothesis that periodic changes in serum dihydrotestosterone (DHT) can modulate the neurophysiological response properties of the ampullary electrosensory system in male Atlantic stingrays. This work shows that in a wild population of stingrays the discharge properties and response dynamics of ampullary primary afferent neurons change with the androgen steroid production cycle. The androgen effect is confirmed by laboratory DHT-implant experiments. In addition, we show that electrosensory primary afferents from long ampullary canals (>3 cm) are more sensitive and have a lower bandpass than do primary afferents associated with short canals (<2 cm). These dynamic features of the stingray ampullary system are interpreted in relation to their social behavior and the enhancement of mate detection during the mating season.
MATERIALS AND METHODS
Animal collections. Atlantic stingrays show distinct reproductive activities that are associated with varying serum androgen levels (Tricas et al., 2000). Adult males were collected during the four annual phases (Fig. 1) of the male androgen cycle (Tricas et al., 2000) that are indentified as (1) AS, which occurs between reproductive seasons (April – July) during which the serum androgen levels are low and testes are inactive, (2) PAI, which occurs at the onset of the mating season and spermatocyte development (August – October), (3) AD, which occurs after maximum gonadal growth and spermatocyte development (November – December), and (4) SAI, which occurs at the end of the mating season and peak period of sperm maturation (January – March). Mature male stingrays (≥22 cm disk width) were collected from a natural population near the southern end of the Banana River on the east coast of Florida used in other studies (Kajiura and Tricas, 1996; Maruska et al., 1996; Kajiura et al., 2000;Tricas et al., 2000). Rays were maintained in aquaria at 21–23°C ∼1–3 d before use in experiments. Adult males used in implantation experiments were collected during the AS period (April – July) and fed an ad libitum diet of frozen shrimp and fish every 2–3 d.
Neurophysiology experiments. Rays were anesthetized in 0.02% tricane methanesulfonate (MS-222) and then immobilized by intramuscular injection of pancuronium bromide (∼3.0 mg/kg). Experimental animals were clamped lightly on an acrylic stage in a 61-cm-long × 41-cm-wide × 15-cm-deep acrylic experimental tank and positioned with a rigid acrylic head and tail holder. A small incision was made just caudal to the left spiracle exposing the anterior lateral line nerve, which contains electrosensory primary afferent neurons from hyoid, superficial ophthalmic, and mandibular groups of ampullae of Lorenzini. Rays were continuously perfused with fresh seawater (resistivity = 32–44 Ωcm) at 21–23°C through the mouth and over the gills during all neurophysiological experiments. These experimental procedures followed National Institutes of Health guidelines for the care and use of animals and were approved by the Institutional Animal Care and Use Committee at Florida Institute of Technology.
Extracellular single unit discharges were recorded from electrosensory primary afferent neurons with glass microelectrodes filled with 4m NaCl (10–30 MΩ), visually guided to the surface of the nerve, and amplified using standard electrophysiology techniques as described previously by Tricas and New (1998) and Sisneros et al. (1998). Single units were identified with a search stimulus [a 1 Hz uniform bipolar sinewave with an amplitude of 2.4 μV/cm peak-to-peak (PTP)] as the microelectrode was advanced through the nerve. At least 500 consecutive spikes were collected without any stimulation for the determination of resting discharge rate and variability. Analog unit discharges were amplified, filtered at 300–3000 Hz, and stored on tape.
Ampullary electroreceptors were stimulated with a bipolar sinusoidal uniform field that was generated by a function generator and isolation amplifier. Electric field stimuli were delivered along either the transverse or longitudinal axis of the animal via two sets of carbon electrodes. Before stimulation, any DC offset present at the output of the stimulus amplifier was nulled. Stimulus field intensities used in experiments ranged from 0.03 to 6.6 μV/cm PTP. For determination of the unit's frequency tuning curve, a single sinusoidal stimulus intensity was chosen so that the peak discharge was 25–75% above resting discharge rate to avoid saturation response that occurs above full (100%) modulation (Tricas and New, 1998). Frequency response curves were determined for 0.01–40 Hz stimuli. For each stimulus frequency, a minimum of 500 consecutive spikes were collected over at least one cycle of stimulation. In addition to the analog unit data, the stimulus analog signal and synch pulse were also recorded during all experiments.
The location of canals from physiologically identified ampullary electroreceptors was determined with a hand-held 1 cm separation dipole electrode (9 V battery and 1 MΩ resistor). The electrodes were swept over the ventral and dorsal surfaces of the ray's pectoral disk while positioned ∼1 cm above the skin with the dipole axis normal to the skin surface. In cases where the pore of the physiologically characterized electroreceptor could be located, the length of the ampullary canal then was measured to the nearest 0.5 cm.
Analysis of neurophysiology data. All spike analyses were performed off-line. Discriminated analog unit discharges, stimulus waveforms, and stimulus synch pulses were converted to digital files via a Cambridge Electronic Design 1401 running under Spike 2 software. Resting discharge activity was characterized from 500 consecutive spikes and used to generate an interspike interval (ISI) histogram. Resting discharge variability was expressed as the coefficient of variation (CV), the ratio of SD to mean interspike interval duration.
Period histograms were constructed and used to determine the neural sensitivity (gain) and frequency and phase response of the unit to the stimulus. For each stimulus frequency, a minimum of 500 consecutive spikes were collected for at least one stimulus cycle and distributed in a period histogram with 128 bins. A Fourier transformation was performed on the period histogram data as described by Tricas and New (1998) to generate coefficients for mean resting rate, peak discharge rate, and the phase relationship of unit response to the stimulus frequency. From these parameters a sinusoid curve was fit to the data to determine the frequency response. Data used to generate frequency response curves were normalized to a relative value of 0 dB assigned to the best frequency (BF) for each unit. The BF of a tuning curve was defined as the frequency that evoked the greatest increase in the number of spikes above mean resting discharge (peak discharge rate minus mean discharge rate). The phase relationship of unit response to stimulus frequency was calculated as the difference in arc degrees between peak discharge rate and peak stimulus amplitude.
To estimate the maximum neural response of a unit to a uniform electric field in the tank and correct for ampullary canals not aligned with either the transverse or longitudinal stimulation axis, peak discharge for a field parallel to the major axis of stimulation was estimated by the following method. Peak unit responses were first recorded for uniform electric fields applied along the transverse and longitudinal axes. Then the angular deviation of the ampullary canal was estimated by the arc tangent of their gain (peak discharge minus mean discharge rate) ratio. The estimated angle of the ampullary canal relative to the transverse and longitudinal axis of the animal was verified to an accuracy of ≤5° based on the ampullary canals that could be located and identified. Maximum neural gain was then estimated by the product of the measured gain along one axis and the associated secant (transverse axis) or cosecant (longitudinal axis) identity. Neural sensitivity (gain) of electrosensory primary afferents was then calculated as the net increase in the number of spikes above mean resting discharge rate (peak minus mean discharge rate) per one-half the PTP stimulation intensity and expressed as spikes/second per microvolt/ centimeter.
Hormone implantation. Because testosterone can be metabolized to 17β-estradiol (Becker et al., 1992) and we wanted to test for androgen specificity of a possible testosterone effect, we implanted rays with DHT, a testosterone derivative that binds with androgen receptors and also occurs in our study species (Tricas et al., 2000). One to three days after capture from the field, adult male rays were randomly assigned to two treatment groups: DHT implants or controls. Adult males used in implantation experiments were collected during the period of androgen suppression (April – July) when androgens are at the lowest levels (Tricas et al., 2000). Rays in the DHT group (n = 6) received seven capsules filled with DHT (Sigma D-5027, Sigma, St. Louis, MO), and rays in the control group (n = 6) received seven empty capsules. Because the implanted animals had similar body weights (range = 410–580 gm), which did not vary >16% of the mean body weight (490.4 gm), animals in each treatment group were given approximately the same number of implant capsules. Capsule implanted rays were allowed to survive for 10–21 d after implant before neurophysiology experiments were conducted. For hormone capsule implantation, rays were anesthetized in 0.0075% MS-222, and a small (∼2 cm) incision was made in the posterior ventrolateral body wall where capsules were inserted into the intraperitoneal cavity. After the capsules were inserted, the incision was closed with six to nine sutures (5.0 surgical silk), and then the rays were returned to their aquaria. Capsules were constructed from a SILASTIC tube (1.47 mm inner diameter × 1.96 mm outer diameter; Dow Corning model 508-006) to which powder DHT crystals were added and then sealed at each end with SILASTIC adhesive. Each filled capsule contained ∼20 mg DHT, which resulted in a total dosage of ∼280 μg DHT per gram of body weight.
Blood collection and steroid assays. Blood samples were taken from implanted males immediately after capture in the field and before neurophysiology experiments, which was 10–21 d after hormone implantation. Rays were lightly anesthetized by immersion in 0.0075% MS-222, and 1 ml of blood was collected via direct cardiac puncture using a 5 ml syringe equipped with a 25 or 27 gauge needle. Blood samples were immediately placed on ice for 3–6 hr and then centrifuged for 15 min at 7000 rpm (∼4100 × g). The serum was removed and stored at −20°C. Serum DHT concentrations were determined by radioimmunoassay in the laboratory of L. E. L. Rasmussen (Oregon Graduate Institute) as described by Tricas et al. (2000).
Statistical analysis. The effect of annual periods associated with varying serum androgen levels (suppression, primary increase, decrease, and secondary increase) and the effect of DHT treatment (DHT vs controls) on resting discharge variability, BF, phase lag of frequency response, and neural sensitivity at BF were analyzed using a one-way ANOVA followed by the Newman–Keuls method for pairwise multiple comparisons. In cases where data sets failed tests of normal distribution or equal variance, data were analyzed using the nonparametric Kruskal–Wallis one-way ANOVA followed by the Dunn's method for pairwise multiple comparisons. Differences in the low- and high-frequency slopes of neural sensitivity (gain) among males were determined by analysis of covariance (ANCOVA). Associations between BF and canal length of ampullary units were determined using Pearson's correlation and linear regression. The effects of treatment (DHT vs control) and ampullary canal group (mandibular vs superficial ophthalmic vs hyoid) and the effects of treatment and ampullary canal length (short vs long) were determined by two-way ANOVA followed by the Newman–Keuls method for pairwise multiple comparisons.
RESULTS
Annual periodic changes in resting discharge activity
Resting discharge activity was recorded from a total of 198 electrosensory primary afferent neurons in 31 adult male stingrays collected during AS in April – July, PAI in August – October, AD in November – December, and SAI in January – March. Resting discharge rates ranged from 32.6 to 71.4 spikes/sec for males during AS, 28.1 to 69.3 spikes/sec during PAI, 31.6 to 65.0 spikes/sec during AD, and 36.8 to 63.4 spikes/sec during SAI. Although average resting discharge rate for males did not differ among AS ( x= 53.2 ± 2.1 SE spikes/sec; n = 8 animals, 41 units), PAI ( x = 50.4 ± 2.5 SE spikes/sec;n = 5, 38), AD ( x = 50.0 ± 1.9 SE spikes/sec; n = 8, 55) or SAI ( x = 50.5 ± 1.0 SE spikes/sec;n = 11, 64) periods (one-way ANOVA; F = 0.59; df = 3, 26; p = 0.62), the discharge variability did. The CV of resting discharge activity for males collected during PAI ( x = 0.119 ± 0.017 SE;n = 5, 38) was lower than that for males collected during AD ( x = 0.173 ± 0.011 SE;n = 8, 55), SAI ( x = 0.173 ± 0.007 SE; n = 11, 64) and AS ( x= 0.180 ± 0.007 SE; n = 8, 41) (Fig. 2) (one-way ANOVA and Newman–Keuls method; F = 4.73; df = 3, 26;p < 0.01). There was no difference in mean ISI of primary afferent discharges among males collected during periods of AS ( x = 19.4 ± 0.9 SE msec; n= 8, 41), PAI ( x = 20.8 ± 1.1 SE msec;n = 5, 38), AD ( x = 20.7 ± 0.5 SE msec; n = 8, 55), and SAI ( x = 19.9 ± 0.4 SE msec; n= 11, 64) (one-way ANOVA; F = 0.83; df = 3, 26;p = 0.49). Thus, electrosensory primary afferents in males collected during PAI did not change discharge rates but exhibited a more regular discharge pattern than during other times of the year.
Fig. 2.

Relationship between resting discharge variability and mean interspike interval for electrosensory primary afferent neurons in wild adult male Atlantic stingrays, D. sabina. Animals were collected during androgen suppression (AS), primary androgen increase (PAI), androgen decrease (AD), and secondary androgen increase (SAI) periods as reported by Tricas et al. (2000). Discharge variability is expressed as coefficient of variation (CV), a dimensionless ratio of SD to mean interspike interval (ISI). Note that the decrease in CV for PAI indicates an increase in discharge regularity during the onset of the reproductive season. The numbers of animals and electrosensory primary afferent neurons tested are indicated in parentheses. All data were plotted as mean ± SE.
Periodic changes in the frequency response and sensitivity to electrosensory stimuli
BF of electrosensory primary afferents for adult males differed with phase of the androgen cycle (Fig.3). The median BF for males collected during PAI was lower than that for males collected during AS, AD, and SAI (Kruskal–Wallis one-way ANOVA and Dunn's method;F = 15.28; df = 2; p < 0.005). During AS when serum androgen levels are lowest, median BF was 7 Hz. This was followed by a downshift to 5 Hz during the subsequent PAI months. Median BF then returned to 7 Hz during periods of AD and SAI. The lowered BF is best seen when the distribution of BFs is compared among the sampled periods. Only 3% of the primary afferents had BFs ≤5 Hz during AS, whereas a much higher percentage of fibers had BFs ≤5 Hz during PAI (59%), AD (26%), and SAI (22%) (Fig. 3). These results demonstrate that the frequency response of electrosensory primary afferents have an annual downward shift in BF during the rise in serum androgen levels at the onset of the mating season.
Fig. 3.

Best frequency histogram for electrosensory primary afferent neurons recorded from adult male Atlantic stingrays,D. sabina. Animals were collected during annual periods of androgen suppression (AS), primary androgen increase (PAI), androgen decrease (AD), and secondary androgen increase (SAI). The numbers of animals and electrosensory primary afferent neurons tested are indicated in parentheses. Note the decrease in best frequency for males collected during PAI at the onset of the reproductive season and the increased number of units with low BF.
Neural sensitivity (gain) of the electrosensory primary afferents increased gradually at frequencies of ∼0.025–5 Hz and rapidly decreased above BF (Fig. 4). The low variability of the peak frequency response and shape of the tuning curves among males collected during different phases of the androgen cycle indicates that differences in peak frequency response and tuning are phase specific and not individual specific. The neural sensitivity at BF did not differ among AS ( x = 7.4 ± 1.1 SE spikes/sec per μV/cm; n = 7 animals, 17 units), PAI ( x = 8.7 ± 1.9 SE spikes/sec per μV/cm; n = 5, 32), AD ( x = 6.8 ± 1.3 SE spikes/sec per μV/cm; n = 4, 19), and SAI ( x = 5.2 ± 0.4 SE spikes/sec per μV/cm; n = 11, 60) periods (one-way ANOVA and Newman–Keuls method; F = 1.79; df = 3, 23;p = 0.18). The −3 dB bandwidth of the primary afferent electrosensory system collected during PAI (1.5–9.6 Hz) was shifted ∼2 Hz lower than that during AS (3.5–11.9 Hz), AD (3.8–11.6 Hz), and SAI (2.8–10.9 Hz). The phase of peak neural response and the stimulus frequency were aligned at 2–3 Hz for males collected during PAI and near 3–4 Hz for males collected during AS, AD, and SAI (Fig.4). The phase lag at BF for males collected during PAI ( x = 41.5 ± 2.8° SE; n = 4, 33) was less than that during SAI ( x = 53.8 ± 4.0° SE; n = 11, 62), AD ( x = 60.3 ± 3.7° SE; n = 4, 17), and AS ( x = 63.5 ± 4.1° SE;n = 6, 25) (Fig. 4) (one-way ANOVA and Newman–Keuls method; F = 3.10; df = 3, 21; p < 0.05). There was no difference in the low-frequency slope among males collected during AS (β = 10.1 ± 0.7 SE dB/decade from 0.1 to 6 Hz), PAI (β = 9.0 ± 0.7 SE dB/decade from 0.05 to 4 Hz), AD (β = 9.9 ± 0.5 SE dB/decade from 0.25 to 6 Hz), or SAI (β = 8.9 ± 0.4 SE dB/decade from 0.25 to 6 Hz) (ANCOVA; F = 1.17; df = 3, 147; p= 0.32). Similarly, there was no difference in the high-frequency slope roll-off from 9 to 20 Hz during AS (β = −23.4 ± 2.2 SE dB/decade), PAI (β = −24.7 ± 1.7 SE dB/decade), AD (β = −27.0 ± 1.6 SE dB/decade), or SAI (β = −26.8 ± 1.2 SE dB/decade) (ANCOVA; F = 0.93; df = 3, 129; p = 0.43). However, there was a 2–9 dB difference in sensitivity (gain) of low-frequency slopes from 0.01 to 4 Hz between the primary afferents from males collected during PAI and those collected during AS (Fig. 5). These results indicate that during PAI the electrosensory primary afferents exhibit a downward shift in bandwidth, a reduction in phase lag at BF, and a 1.3 to 2.8-fold (2–9 dB) increase in neural sensitivity to low-frequency information between 0.01 and 4 Hz.
Fig. 4.

Bode plot and phase diagram for frequency response of electrosensory primary afferent neurons recorded from adult male Atlantic stingrays, D. sabina. Animals were collected during annual periods of androgen suppression (AS), primary androgen increase (PAI), AD, and secondary androgen increase (SAI). Because there were no differences in the median BF or the low- and high-frequency slopes among males collected during AS, AD, and SAI, only data for males collected during AS and SAI were plotted for comparison with males collected during PAI. The numbers of animals and electrosensory primary afferent neurons tested are indicated inparentheses. Peak frequency sensitivity for males during PAI is 4–5 Hz and 7–8 Hz during AS and SAI. Data were calculated from period histogram analysis and are plotted as the mean discharge peak. To control for absolute sensitivity of different units, data were normalized to a relative value of 0 dB assigned to the peak response for each unit and then expressed in relative dB. All data were plotted as mean ± 1 SE. Note that some SE bars are obscured by symbols.
Fig. 5.

Change in frequency sensitivity during primary and secondary androgen increase relative to the period of androgen suppression in male Atlantic stingrays, D. sabina. Data for males collected during primary androgen increase (PIA) and secondary androgen increase (SAI) are normalized relative to the frequency response of electrosensory primary afferents of male rays collected during androgen suppression (AS). The numbers of animals and electrosensory primary afferent neurons tested are indicated inparentheses. All data were plotted as mean ± 1 SE. Note that the frequency response from 0.01 to 4 Hz in males collected during PAI is ∼2–9 dB higher than that in males collected during AS.
The effect of DHT implants on electrosensory neurophysiology
Serum DHT levels were lower in control implanted rays than in the DHT implanted rays. Although control implants did not elevate serum DHT levels, the implants of DHT in treated rays considerably raised the serum DHT levels by ∼60 times that observed in the preimplanted rays (Table 1). Resting discharge activity was recorded from a total of 131 electrosensory primary afferent neurons in the 12 implanted stingrays (six control and six DHT implants). Resting discharge rates ranged from 25.8 to 68.6 spikes/sec for controls and 33.2 to 70.4 spikes/sec for DHT-treated fish. Resting discharge rates did not differ among control ( x = 54.9 ± 0.8 SE spikes/sec) and DHT-treated fish ( x = 49.8 ± 2.8 SE spikes/sec) (Kruskal–Wallis one-way ANOVA;F = 2.56; df = 1; p = 0.11). Similarly there were no differences in discharge variability (CV) among control ( x = 0.152 ± 0.005 SE) and DHT-treated fish ( x = 0.134 ± 0.014 SE) (Kruskal–Wallis one-way ANOVA; F = 0.10; df = 1; p = 0.75). Neither resting discharge rate nor discharge variability of electrosensory primary afferents changed after DHT treatment. Thus, DHT does not appear to reduce the resting discharge variability of electrosensory primary afferents relative to the low endogenous variance of primary afferent discharges in males collected during primary androgen production in the early mating season (Fig. 2).
Table 1.
Serum DHT concentrations of adult male Atlantic stingrays,D. sabina, implanted with either seven empty capsules (control) or seven capsules filled with DHT
| Treatment (n = number of animals) | DHT concentration (ng/ml) pre-implant | DHT concentration (ng/ml) post-implant |
|---|---|---|
| Control (6) | 0.14 (min) | 0.09 (min) |
| 2.40 (median) | 0.35 (median) | |
| 4.57 (max) | 0.46 (max) | |
| DHT (6) | 0.09 (min) | 57.3 (min) |
| 1.50 (median) | 96.4 (median) | |
| 8.20 (max) | 183.3 (max) |
The effect of DHT on frequency response and sensitivity to electrosensory stimuli
Implants of DHT capsules into male rays induced changes in the frequency response and neural sensitivity of ampullary electrosensory primary afferent neurons (Table 2). The frequency response of the primary afferents for treated and control fish is summarized in the Bode plot and phase diagram shown in Figure6. Best frequency differed among control and DHT-treated fish (Fig. 7). Median BF for DHT-treated fish was 6 Hz and 8 Hz for control fish (Table 2) (Kruskal–Wallis one-way ANOVA; F = 12.69; df = 1; p < 0.001). The −3 dB bandwidth of the primary afferent frequency response for DHT-treated fish was shifted ∼2 Hz lower than that for control fish (Table 2). Neural sensitivity at BF did not change in DHT-treated fish (Table 2) (Kruskal–Wallis one-way ANOVA; F = 0.10; df = 1; p= 0.75). Peak neural response at BF lagged the stimulus peak by 52° in control and 43° in DHT-treated animals (Fig. 6, Table 2) (Kruskal–Wallis one-way ANOVA; F = 4.33; df = 1; p < 0.05). These results indicate that treatment of DHT lowers BF, bandwidth, and phase lag at BF in electrosensory primary afferent neurons. Furthermore, these androgen-induced changes are similar to the changes that occur to the frequency response of electrosensory primary afferents during primary androgen production in the early mating season (Figs. 3, 4).
Table 2.
Frequency response characteristics of electrosensory primary afferent neurons recorded from adult male Atlantic stingrays,D. sabina, implanted with either seven empty capsules (control) or seven capsules filled with DHT
| Treatment group | BF (Hz) median (min, max) ± SD | −3 dB bandwidth (Hz) | Phase at BF ± SD (°) | Neural sensitivity at BF ± SD (spikes/sec per μV/cm) range |
|---|---|---|---|---|
| Control (N = 6) | 8 (4, 10) | −51.8 ± 5.0 | 7.4 ± 1.9 | |
| 7.4 ± 1.7 | 4.0–12.1 | n = 59 | 2.3–26.1 | |
| n = 59 | n = 54 | |||
| DHT (N = 6) | 6 (3, 12)* | −42.8 ± 4.92-160 | 6.3 ± 2.5 | |
| 6.0 ± 2.4 | 2.2–10.9 | n = 59 | 0.7–14.5 | |
| n = 59 | n = 58 |
p < 0.001 (Kruskal-Wallis one-way ANOVA; df = 1);
F2-160: p < 0.05 (Kruskal-Wallis one-way ANOVA; df = 1). N, Number of animals; n, number of units.
Fig. 6.

Bode plot and phase diagram for frequency response of electrosensory primary afferent neurons recorded from adult male Atlantic stingrays, D. sabina, after DHT implants. Peak frequency sensitivity is 7–8 Hz for control fish and 5–6 Hz for DHT-treated fish. The numbers of animals and electrosensory primary afferent neurons tested are indicated in parentheses. Data were calculated from the period histogram analysis and are plotted as the mean discharge peak. To control for absolute sensitivity of different units, data were normalized to a relative value of 0 dB assigned to the peak response for each unit and then expressed in relative dB. All data are plotted as mean ± 1 SE. Note that some SE bars are obscured by symbols.
Fig. 7.

Best frequency histogram for electrosensory primary afferent neurons for control and DHT-treated Atlantic stingrays, D. sabina. The numbers of animals and electrosensory primary afferent neurons tested are indicated inparentheses. Note that there is an induced downward shift in BFs of electrosensory primary afferents in DHT-treated rays.
The neural sensitivity of the electrosensory primary afferents showed a gradual increase from 0.25 to 5 Hz and a rapid decline from 9 to 20 Hz in control and DHT-treated fish (Fig. 6). There was no difference in the low-frequency roll-off from 0.25 to 5 Hz among control (β = 9.4 ± 0.3 SE dB/decade) and DHT-treated fish (β = 9.1 ± 0.3 SE dB/decade) (ANCOVA; F = 0.33; df = 1, 104; p = 0.57). Similarly, there was no was difference in the high-frequency slope from 9 to 20 Hz among control (β = −23.8 ± 1.3 SE dB/decade) and DHT-treated fish (β = −21.9 ± 1.6 SE dB/decade) (ANCOVA; F = 0.82; df = 1, 90; p = 0.37). However, the neural sensitivity changed in the low-frequency range in DHT-treated fish (Fig. 8). At low frequencies from 0.5 to 2 Hz, neural gain increased from 3.6 to 4.1 dB. These data show that treatment with DHT increases primary afferent sensitivity to low-frequency stimuli (0.5–2 Hz) by a factor of 1.5×. This increased sensitivity is very similar to that observed in wild males during primary androgen production in the early mating season (Fig. 5).
Fig. 8.

Frequency response of electrosensory primary afferent neurons between control and DHT-treated Atlantic stingrays,D. sabina. Data are normalized relative to the frequency response of electrosensory primary afferents in control rays. All data were plotted as mean ± 1 SE. Note that the neural response from 0.5 to 4 Hz in DHT-treated rays is ∼2–4 dB higher than that in control rays.
Relationship between BF and canal length of ampullary electroreceptors
A linear relationship was identified between BF of primary afferents and canal length of their physiologically identified ampullary electroreceptors. Mean BF was negatively correlated with the mean canal length for each ampullary cluster group (Fig.9) (mandibular, superficial ophthalmic, and hyoid) in control [r = −0.96 null hypothesis (HO): β = 0, t = −4.90,p < 0.05] and DHT-treated fish (r = −0.99; Ho: β = 0 , t = −11.35,p < 0.01). Because the slopes of these regression lines did not differ between control and DHT-treated fish (ANCOVA , F = 3.58; df = 1, 5;p = 0.12), data were pooled and a linear relationship between mean BF and mean canal length for each ampullary group was plotted (Fig. 10) (r = −0.93; Ho: β = 0, t = −6.36, p< 0.001). Mean BFs of ampullary units with relatively short canals (<2 cm) were 1.3–2 times higher than units with long canals (>3 cm) (Fig. 10). Of the three ampullary canal groups tested, the mandibular had the smallest range of canal lengths (0.5–1.0 cm), superficial ophthalmic had an intermediate range (1.0–6.0 cm), and hyoid had the greatest range of canal lengths (0.5–12.5 cm) (Table3). Similarly, mean BF of primary afferents from mandibular units (which only possess relatively short canals ≤1 cm) was 1.2 times higher than that of superficial ophthalmic and hyoid units (which possess a large number of relatively longer canals) (Table 3) (two-way ANOVA; Newman–Keuls test; effect of ampullary canal group; F = 3.80, df = 2, 61;p < 0.05).
Fig. 9.

Distribution of the electrosensory canals of the ampullae of Lorenzini over the ventral (left) and dorsal (right) surfaces of the Atlantic stingray, D. sabina. Figure was modified from Puzdrowski and Leonard (1993).H, Hyoid cluster group; M, mandibular cluster group; SO, superficial ophthalmic cluster group. Scale bar, 1 cm.
Fig. 10.

Relationship between best frequency of electrosensory primary afferent neurons and canal length in adult male Atlantic stingrays, D. sabina, after implants of DHT. Best frequency (BF) was determined for electrosensory units from the mandibular (M), superficial ophthalmic (SO), short hyoid (SH) (<2 cm), and long hyoid (LH) (>3 cm) canals. Mean best frequency is plotted for the mean canal length (CL) of each ampullary group. Note that best frequency decreases with canal length for DHT implant and control (C) animals. All data were plotted as mean ± 1 SD.
Table 3.
Best frequency (BF) of electrosensory primary afferent neurons for three types of ampullary groups (mandibular, superficial ophthalmic, and hyoid) recorded from adult male Atlantic stingrays,D. sabina
| Treatment group | Mandibular units | Superficial ophthalmic units | Hyoid units | Hyoid units with short canals (<2 cm) | Hyoid units with long canals (>3 cm) |
|---|---|---|---|---|---|
| BF ± SD (Hz) mean canal length (cm) range (cm) | BF ± SD (Hz) mean canal length (cm) range (cm) | BF ± SD (Hz) mean canal length (cm) range (cm) | BF ± SD (Hz) mean canal length (cm) range (cm) | BF ± SD (Hz) mean canal length (cm) range (cm) | |
| Control (N = 6) | 8.5 ± 1.0 | 7.3 ± 0.5 | 7.6 ± 2.0 | 9.0 ± 1.0 | 5.8 ± 1.1 |
| <1 | 2.5 ± 1.1 | 2.4 ± 1.8 | 1.1 ± 0.4 | 4.8 ± 1.5 | |
| 0.5–1.0 | 1.5–4.0 | 0.5–7.0 | 0.5–1.5 | 3.5–7.0 | |
| n = 6 | n = 3 | n = 19 | n = 11 | n = 6 | |
| DHT (N = 6) | 8.3 ± 2.0 | 6.4 ± 1.9 | 5.6 ± 2.2 | 8.0 ± 2.1 | 3.6 ± 0.9 |
| <1 | 3.1 ± 1.6 | 3.3 ± 2.3 | 1.1 ± 0.3 | 5.1 ± 2.6 | |
| 0.5–1.0 | 1.0–6.0 | 0.5–12.5 | 0.5–1.5 | 3.5–12.5 | |
| n = 6 | n = 7 | n = 26 | n = 6 | n = 10 |
Rays were implanted with either seven empty capsules (control) or seven capsules filled with DHT. N, Number of animals;n, number of units.
The frequency responses of primary afferents from mandibular, superficial ophthalmic, and hyoid ampullary units in control and DHT-treated fish are shown in Figure 11and illustrate distinct differences in the shape of the tuning curves among clusters and treatment groups. These data represent a sub-sample of the primary afferent data in which the ampullary canal and cluster group type could be identified. Although mean BF of primary afferents from each ampullary group did not differ among control and DHT-treated fish (two-way ANOVA; effect of DHT treatment; F = 2.50; df = 1, 61; p = 0.12), there was a difference in BFs among hyoid units when units with short (<2 cm) and long (>3 cm) ampullary canals were compared among control and DHT-treated fish. Mean BF of primary afferents from hyoid units with short canals (<2 cm) was 1.6–2.5 times greater than that of units with long canals (>3 cm) in both control and DHT-treated fish (Table 3) (two-way ANOVA; Newman–Keuls test; effect of canal length; F = 59.50; df = 1, 29; p < 0.001). In addition, BF of hyoid units from long canals decreased when treated with DHT implants (Fig.12, Table 3) (two-way ANOVA; Newman–Keuls test; effect of DHT treatment; F = 10.86; df = 1, 29; p < 0.005).
Fig. 11.

Bode plots of the frequency response of electrosensory primary afferents recorded from mandibular, superficial ophthalmic, and hyoid ampullary units in adult male Atlantic stingrays,D. sabina, after DHT implants. Treatment with DHT altered tuning characteristics (best frequency or roll-off slopes) in all ampullary groups. Peak sensitivity is 8–9 Hz for mandibular units in control (C) and DHT-treated fish, 6–7 Hz for superficial ophthalmic (SO) units in DHT-treated fish, 7–9 Hz for SO units in control fish and hyoid units with short canals <2 cm in control and DHT-treated fish, 3–4 Hz for hyoid units with long canals >3 cm in DHT-treated fish, and 5–6 Hz for hyoid units with long canals in control fish. Data were calculated from period histogram analysis and are plotted as mean discharge peak for mandibular, SO, short hyoid, and long hyoid units. The numbers of animals and electrosensory primary afferent neurons tested are indicated in parentheses. To control for absolute sensitivity of different units, data were normalized to a relative value of 0 dB assigned to the peak response for each unit and then expressed in relative dB. All data were plotted as mean ± 1 SE. Note that some SE bars are obscured by symbols.
Fig. 12.

Best frequency bar graph for electrosensory primary afferents recorded from hyoid ampullary units with short (<2 cm) and long (>3 cm) canals in adult male Atlantic stingrays,D. sabina. The numbers of animals and electrosensory primary afferent neurons tested are indicated inparentheses. Asterisk indicates difference between the control and DHT-treated fish (p < 0.01). All data were plotted as mean ± 1 SD.
Neural sensitivity of the electrosensory primary afferents increased with canal length. Sensitivity of the primary afferents was positively correlated with the canal length of the physiologically identified ampullary electroreceptors in control (r = 0.70; Ho: β = 0, t = 3.89, p < 0.01) and DHT-treated fish (r = 0.54; Ho: β = 0,t = 3.69, p < 0.001). Because the regression of neural sensitivity versus ampullary canal length did not differ between control and DHT-treated fish (ANCOVA; F= 0.18; df = 1, 50; p = 0.68), the data were pooled, and a linear relationship between neural sensitivity (gain) and canal length of the identified ampullary electroreceptors for the electrosensory primary afferents was plotted (Fig.13) (r = 0.61; Ho: β = 0, t = 5.46, p < 0.0001). This analysis shows that neural sensitivity increases with canal length. In addition, DHT appears to act differentially on short and long hyoid canals. Units that innervate ampullae with short canals showed a 6 dB increase in sensitivity when DHT-treated. In hyoid units associated with long canals, DHT treatment had a less dramatic effect at lower frequencies and decreased sensitivity to higher frequencies (Fig. 14). These results demonstrate that the electrosensory primary afferents of short ampullary canals have higher BFs and are less sensitive than the primary afferents of electroreceptors with long canals. In addition, these results demonstrate that DHT lowers the BF of electrosensory primary afferents that innervate hyoid electroreceptors with long ampullary canals and confirm previous results that DHT treatment increases the sensitivity of the primary afferent electrosensory system to low-frequency electric stimuli (0.5–2Hz).
Fig. 13.

Relationship between neural sensitivity (gain) of electrosensory primary afferent neurons and ampullary electroreceptor canal length in adult male Atlantic stingrays, D. sabina, after implants. Data are shown for mandibular (M), superficial ophthalmic (SO), and hyoid (H) canals. Note that neural sensitivity (G) increases with ampullary canal length (CL) for both DHT-treated and control (C) rays.
Fig. 14.
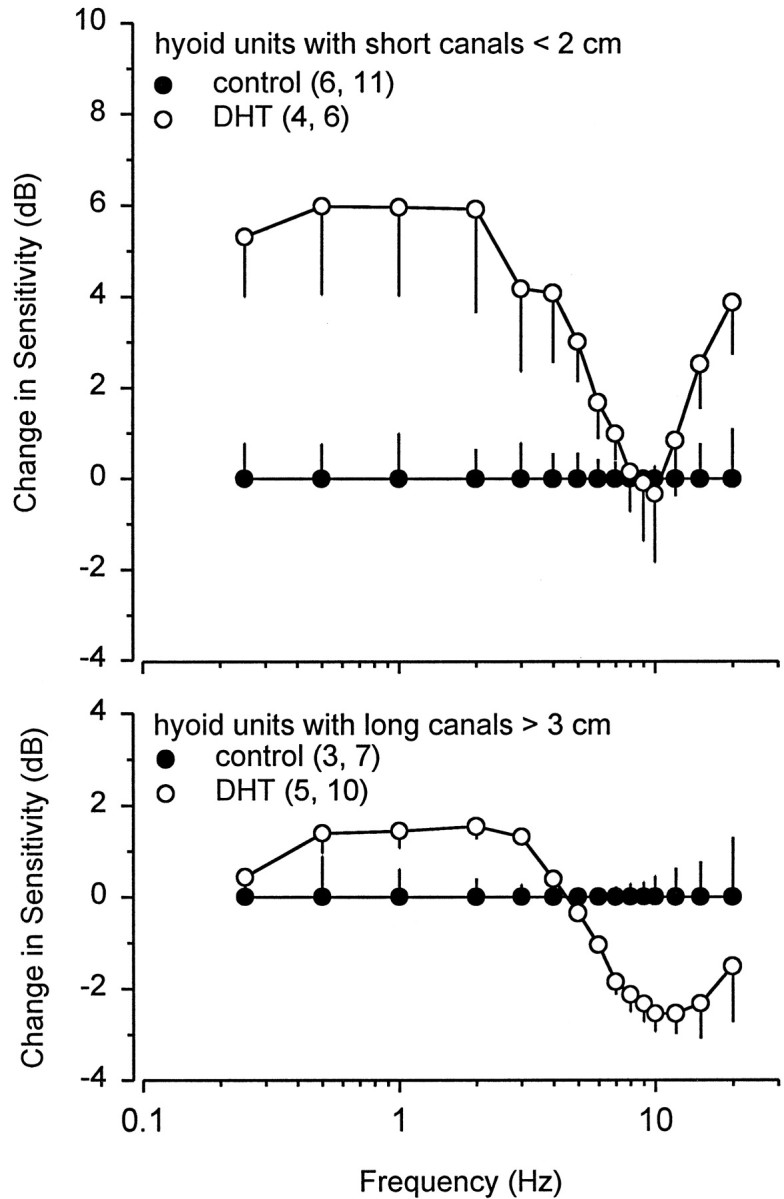
Frequency response of electrosensory primary afferent neurons from hyoid electroreceptors with short (<2 cm) and long (>3 cm) ampullary canals in control and DHT-treated male Atlantic stingrays, D. sabina. Data are normalized relative to the frequency response of electrosensory primary afferents in control rays and expressed in relative gain difference decibels. All data were plotted as mean ± 1 SE. The numbers of animals and electrosensory primary afferent neurons tested are indicated inparentheses. Note that the frequency response between 0.25 and 5 Hz for primary afferents of hyoid units with short canals <2 cm in DHT-treated rays is ∼3–6 dB higher than that in control rays. In contrast, the frequency response of electrosensory primary afferents is ∼1.5 dB higher between 0.5 and 3 Hz and 2.5–3 dB lower between 8 and 15 Hz for primary afferents of hyoid units with long canals >3 cm in DHT-treated rays than in control rays.
DISCUSSION
We show that there is an annual decrease in the resting discharge variability of electrosensory primary afferents in D. sabinaduring the period associated with primary androgen production. This decrease in discharge variability coincides with the onset of spermatocyte production and the annual peak in serum gonadal steroid levels for the population (Tricas et al., 2000). A decrease in the discharge variability of electrosensory primary afferents may facilitate the encoding of low-frequency information as discussed byStein (1967). Electrosensory primary afferents that discharge with a relative high level of certainty (i.e., low endogenous variance) can encode changes in slowly varying electric fields more reliably than irregular units. In addition to annual changes in discharge variability, BF and bandpass of electrosensory primary afferents also change seasonally, which results in increased sensitivity to low frequencies from 0.01 to 4 Hz during PAI. Our implant experiments confirm that androgen steroids are the most likely cause for the downshift in frequency tuning of electrosensory primary afferents in the wild D. sabina population. We show that elevated DHT lowers both BF and low-frequency bandpass.
The downward shift in BF and bandpass induced by DHT may function to increase the probability of conspecific detection during natural social behaviors. Recent work on a wild mating population of round stingrays,Urolophus halleri, shows that male stingrays use electroreception to detect the bioelectric fields produced by visually cryptic buried females (Tricas et al., 1995). Like other fishes, stingrays produce a significant standing DC field that is partially modulated by ventilatory movements of the mouth and gill slits (Kalmijn, 1974; Tricas et al., 1995). Both the static and modulated portions of the DC field can be used by searching males to locate buried mates. The static portion of the DC field is an attractive bioelectric cue because it appears to vary at low frequency as the elasmobranch electroreceptor system passes through it (Kalmijn, 1988). The modulated portion of the bioelectric field of the stingray is also an attractive feature because it varies with the natural ventilatory rate of the animal (∼0.25–2 Hz) and would be a particularly important signal when the male is at rest near a female. For male Atlantic stingrays, the bandwidth of electrosensory primary afferents is shifted lower near the frequency spectrum associated with the ventilatory rate during PAI. Our implant experiments show that DHT increases the sensitivity of electrosensory primary afferents to low-frequency electric stimuli (0.5–2 Hz) similar to the natural phasic signals (0.25–2 Hz) produced by conspecifics. Thus, the androgen-induced changes in the frequency response properties of ampullary electrosensory primary afferents may represent an adaptation of the male elasmobranch electrosensory system to enhance the probability of mate detection as well as the detection of other consexuals, which may be a target of intrasexual aggression during male competition for the access to females.
We were unable to induce a decrease in discharge variability with DHT implants as observed in the wild population, but this may be because of the relatively high dose of DHT used in the study. Similarly, the high DHT dose, which originally was chosen to ensure DHT treatment effects in implanted animals, may explain why the downshift in BF of the electrosensory primary afferents was not as robust as that found in wild males during PAI. The median serum DHT concentration measured from treated rays, which was ∼1.5 times higher than the maximum reported for wild caught males during PAI (Tricas et al., 2000), may have downregulated the number of androgen receptor sites within the peripheral ampullary electroreceptor system and decreased the DHT effect. Similarly, the relative sustained elevation of serum androgen levels (Fig. 1) throughout the protracted mating season (August – April) may also contribute to a downregulation of androgen receptor sites within the peripheral ampullary electroreceptor system in the wild population and may explain the decreased androgen effect associated with SAI in wild caught males. Alternatively, other gonadal hormones may also influence seasonal change in the frequency response and discharge properties of ampullary primary afferent neurons. The decrease in resting discharge variability of ampullary primary afferents early in the mating season also coincides with primary production of estradiol and progesterone in male Atlantic stingrays (Tricas et al., 2000). Thus, the possibility exits that estrogen or progesterone, or both, may be responsible for modulating changes in resting discharge variability. Additional steroid implant studies will be necessary to determine how other reproductive hormones affect the response properties of the ampullary electroreceptor system.
The precise mechanism by which androgen induces changes in the discharge and response properties of ampullary primary afferents remains unknown. Previous studies indicate that androgen treatment lowers both BF of tuberous electroreceptors and electric organ discharge (EOD) frequency in tandem so that the electrosensory and electromotor systems of weakly electric fishes remain matched for social communication and electrolocation (Meyer and Zakon, 1982; Bass and Hopkins, 1984). DHT is known to slow the activation and inactivation kinetics of the Na+ current in electrocytes, thereby increasing the pulse duration of the EOD (Ferrari et al., 1995). These changes in the current kinetics of electrocytes are thought to result from the differential expression of multiple channels (e.g., Na+ and/or K+) genomically regulated by androgens (Zakon, 1996, 1998). Previous work on ampullary electroreceptors implicates Ca+2 and K+ currents, but not Na+, in the tuning mechanism of electroreceptors (Clusin and Bennett, 1979; Lu and Fishman, 1995b) and in the hair cell receptors of other less recently derived vertebrates (Crawford and Fettiplace, 1981). Similar androgen-induced changes to these currents may also affect the current kinetics of electroreceptor cells and their frequency tuning. Our results show that DHT alters the frequency tuning of hyoid electroreceptors (Figs. 11, 14). Future studies that examine the expression of androgen receptors in the ampullary electroreceptor system during the androgen production cycle and detail the genomic effects of DHT on the electroreceptor ionic membrane properties will provide important insight into the mechanism responsible for the androgen-induced neurophysiological changes seen in ampullary electroreceptors.
Our results show that BF and neural sensitivity of electrosensory primary afferents are correlated with canal length of ampullary electroreceptors. Mean BF was negatively correlated with the mean canal length of identified mandibular, superficial ophthalmic, and hyoid electroreceptors. Montgomery (1984) reported that the low-frequency bandpass response of all electrosensory primary afferents in thornback rays (Platyrhinoidis triseriata) was independent of canal length. In contrast, we show that electrosensory primary afferents of hyoid units with long canals (>3 cm) had a lower mean BF and bandpass than did primary afferents of short canals (<2 cm) (Figs. 11, 12).Waltman (1966) predicted a decreased high-frequency response in ampullary electroreceptors with long canals because of their cable properties and high canal wall capacitance. He estimated a theoretical “turnover frequency” (−3 dB low pass roll-off) of 9 Hz for a skate electroreceptor with a 10 cm hyoid canal and 300 Hz for an electroreceptor with a 1 cm hyoid canal. We report a −3 dB low pass roll-off of 8–11 Hz for hyoid units with long canals (>3 cm) and 13–14 Hz for hyoid units with short canals (<2 cm) (Fig. 11). Although cable properties of the ampullary canals may partially explain some of the decreased high-frequency response for hyoid units with long canals, characteristics of the low pass filter and frequency response of the hyoid units, especially those with canal lengths <10 cm, are most likely established at the cellular level by the ionic membrane properties of the receptor cell as discussed by Fettiplace (1987) andLu and Fishman (1995a,b). Also, experiments are needed to test whether the ionic membrane properties of electroreceptors are associated with morphological variables such as ampullae size and cluster group.
We also show that neural sensitivity of electrosensory primary afferents to uniform electric fields is positively correlated with ampullary canal length. Electrosensory primary afferents of hyoid units with 6- to 7-cm-long canals were two to three times more sensitive to uniform electric fields than those of hyoid units with canals <2 cm (Fig. 13). These results support the conclusion of Broun et al. (1979)that the less sensitive ampullae with short canals are best adapted for the detection of high-frequency information, whereas the more sensitive ampullae with long canals are better adapted for the detection of weak DC and low-frequency electric stimuli. We show that short ampullary mandibular canals (≤1 cm) near the mouth can best detect 8–10 Hz stimuli such as that associated with the rhythmic AC field potentials generated by small invertebrate prey (Wilkens et al., 1997), which are also a main food resource for D. sabina (Cook, 1994). In contrast, long ampullary hyoid canals (>3 cm), which are distributed over the pectoral disk of the stingray, are more sensitive to lower-frequency stimuli (2–4 Hz) such as those associated with potential mates, or geomagnetic-induced electric fields used for orientation (Kalmijn, 1974; Paulin, 1995). Our results show that DHT downshifts BF and increases the sensitivity to low-frequency stimuli (0.5–2 Hz) to potentially enhance mate detection. However, DHT did not affect mandibular electroreceptors, which have shortest canals. Thus, the differential effect of DHT has the benefit of increasing the probability of conspecific detection but not greatly inhibiting the electroreceptor system to detect higher frequencies associated with potential prey. There is no indication that androgen-induced changes in the ampullary electroreceptor system affect feeding behavior and the ability of males to consume prey during the mating season (Cook, 1994). Thus, the differential distributions of short and long ampullary canals may reflect evolutionary adaptations in elasmobranchs to enhance prey detection, orientation, and social–reproductive interactions. Furthermore, the androgen-induced changes in the frequency response properties of ampullary electrosensory primary afferents may represent adaptations to seasonally enhance mate detection and increase the number of male reproductive encounters with females.
Footnotes
This research was supported by a Minority Access to Research Careers predoctoral fellowship from National Institutes of Health (J.A.S.), by Holmes Regional Medical Center, and by the Florida Institute of Technology, Department of Biological Sciences. We thank L. E. L. Rasmussen (Oregon Graduate Institute) for steroid analysis, P. Forlano, K. Maruska, C. Lowrance, C. Guigand, R. B. Brodie, and M. Callahan for field assistance, H. Zakon, J. Trumbull, C. Manire, and P. Piermarini for technical advice and assistance, and D. Bodnar for helpful comments on this manuscript.
Correspondence should be addressed to Dr. Joseph A. Sisneros, Department of Neurobiology and Behavior, Cornell University, Seeley G. Mudd Hall, Ithaca, New York 14853. E-mail: jas226@cornell.edu.
Dr. Tricas' present address: Department of Zoology, University of Hawaii at Manoa, 2538 McCarthy Mall, Edmondson Hall, Honolulu, HI 96822. E-mail: tricas@hawaii.edu.
REFERENCES
- 1.Arnold AP, Gorski RA. Gonadal steroid induction of structural sex differences in the central nervous system. Annu Rev Neurosci. 1984;7:413–442. doi: 10.1146/annurev.ne.07.030184.002213. [DOI] [PubMed] [Google Scholar]
- 2.Bass AH. A hormone-sensitive communication system in an electric fish. J Neurobiol. 1986;17:131–156. doi: 10.1002/neu.480170303. [DOI] [PubMed] [Google Scholar]
- 3.Bass AH, Hopkins CD. Shifts in frequency tuning of electroreceptors in androgen-treated mormyrid fish. J Comp Physiol [A] 1984;155:713–724. [Google Scholar]
- 4.Becker JB, Breedlove SM, Crews D. Behavioral endocrinology. MIT; Cambridge, MA: 1992. [Google Scholar]
- 5.Broun GR, Il'inskii OB, Krylov BV. Responses of the ampullae of Lorenzini in a uniform electric field. Neurophysiology. 1979;11:118–124. [PubMed] [Google Scholar]
- 6.Clusin WT, Bennett MVL. The ionic basis of oscillatory responses of skate electroreceptors. J Gen Physiol. 1979;73:703–723. doi: 10.1085/jgp.73.6.703. [DOI] [PMC free article] [PubMed] [Google Scholar]
- 7.Cook DA. Temporal patterns of food habits of the Atlantic stingray, Dasyatis sabina (LeSeur 1824), from the Banana River Lagoon, Florida. MS thesis. Florida Institute of Technology; 1994. [Google Scholar]
- 8.Crawford AC, Fettiplace R. An electrical tuning mechanism in turtle cochlear hair cells. J Physiol (Lond) 1981;312:377–412. doi: 10.1113/jphysiol.1981.sp013634. [DOI] [PMC free article] [PubMed] [Google Scholar]
- 9.Ferrari MB, McAnelly ML, Zakon HH. Individual variation in and androgen-modulation of the sodium current in electric organ. J Neurosci. 1995;15:4023–4032. doi: 10.1523/JNEUROSCI.15-05-04023.1995. [DOI] [PMC free article] [PubMed] [Google Scholar]
- 10.Fettiplace R. Electrical tuning of hair cells in the inner ear. Trends Neurosci. 1987;10:421–425. [Google Scholar]
- 11.Harrison NL, Majewska MD, Meyers DER, Barker JL. Rapid actions of steroids on CNS neurons. In: Lakoski JM, Perez-Polo JR, Rassin DK, editors. Neural control of reproductive function. Alan R. Liss; New York: 1989. pp. 137–166. [Google Scholar]
- 12.Kajiura SM, Tricas TC. Seasonal dynamics of dental sexual dimorphism in the Atlantic stingray, Dasyatis sabina. J Exp Biol. 1996;199:2297–2306. doi: 10.1242/jeb.199.10.2297. [DOI] [PubMed] [Google Scholar]
- 13.Kajiura SM, Sebastian AP, Tricas TC. Dermal bite wounds as indicators of reproductive seasonality and behavior in the Atlantic stingray, Dasyatis sabina. Environ Biol Fishes. 2000;58:23–31. [Google Scholar]
- 14.Kalmijn AJ. The detection of electric fields from inanimate and animate sources other than electric organs. In: Fessard A, editor. Handbook of sensory physiology, Vol III/3. Springer; New York: 1974. pp. 147–200. [Google Scholar]
- 15.Kalmijn AJ. Electric and magnetic field detection in elasmobranch fishes. Science. 1982;218:916–918. doi: 10.1126/science.7134985. [DOI] [PubMed] [Google Scholar]
- 16.Kalmijn AJ. Detection of weak electric fields. In: Atema J, Fay RR, Popper AN, Tavolga WN, editors. Sensory biology of aquatic animals. Springer; New York: 1988. pp. 151–186. [Google Scholar]
- 17.Kelley DB. Sexually dimorphic behaviors. Annu Rev Neurosci. 1988;11:225–251. doi: 10.1146/annurev.ne.11.030188.001301. [DOI] [PubMed] [Google Scholar]
- 18.Kelly MJ. Electrical effects of steroids in neurons. In: McKerns KW, Pantic V, editors. Hormonally active brain peptides. Plenum; New York: 1982. pp. 253–265. [Google Scholar]
- 19.Lu J, Fishman HM. Localization and function of the electrical oscillation in electroreceptive ampullary epithelium from skates. Biophys J. 1995a;69:2458–2466. doi: 10.1016/S0006-3495(95)80116-5. [DOI] [PMC free article] [PubMed] [Google Scholar]
- 20.Lu J, Fishman HM. Ion channels and transporters in the electroreceptive ampullary epithelium from skates. Biophys J. 1995b;69:2467–2475. doi: 10.1016/S0006-3495(95)80117-7. [DOI] [PMC free article] [PubMed] [Google Scholar]
- 21.Maruska KP, Cowie EG, Tricas TC. Periodic gonadal activity and protracted mating in elasmobranch fishes. J Exp Zool. 1996;276:219–232. [Google Scholar]
- 22.Matsumoto A, Micevych PE, Arnold AP. Androgen regulates synaptic input to motorneurons of the adult rat spinal cord. J Neurosci. 1988;8:4168–4176. doi: 10.1523/JNEUROSCI.08-11-04168.1988. [DOI] [PMC free article] [PubMed] [Google Scholar]
- 23.Meyer JH, Zakon HH. Androgens alter the tuning of electroreceptors. Science. 1982;217:635–637. doi: 10.1126/science.217.4560.635. [DOI] [PubMed] [Google Scholar]
- 24.Montgomery JC. Frequency response characteristics of primary and secondary neurons in the electrosensory system of the thornback ray. Comp Biochem Physiol. 1984;79:189–195. [Google Scholar]
- 25.Paulin MG. Electroreception and the compass sense of sharks. J Theor Biol. 1995;174:325–339. [Google Scholar]
- 26.Puzdrowski RL, Leonard RB. The octavolateral systems in the stingray, Dasyatis sabina. I. Primary projections of the octaval and lateral line nerves. J Comp Neurol. 1993;332:21–37. doi: 10.1002/cne.903320103. [DOI] [PubMed] [Google Scholar]
- 27.Sisneros JA, Tricas TC, Luer CA. Response properties and biological function of the skate electrosensory system during ontogeny. J Comp Physiol [A] 1998;183:87–99. doi: 10.1007/s003590050237. [DOI] [PubMed] [Google Scholar]
- 28.Stein RB. The information capacity of nerve cells using a frequency code. Biophys J. 1967;7:797–826. doi: 10.1016/S0006-3495(67)86623-2. [DOI] [PMC free article] [PubMed] [Google Scholar]
- 29.Tricas TC, New JG. Sensitivity and response dynamics of electrosensory primary afferent neurons to near threshold fields in the round stingray. J Comp Physiol [A] 1998;182:89–101. doi: 10.1007/s003590050161. [DOI] [PubMed] [Google Scholar]
- 30.Tricas TC, Michael SW, Sisneros JA. Electrosensory optimization to conspecific phasic signals for mating. Neurosci Lett. 1995;202:129–131. doi: 10.1016/0304-3940(95)12230-3. [DOI] [PubMed] [Google Scholar]
- 31.Tricas TC, Maruska KP, Rasmussen LEL. Annual cycles of steroid hormone production, gonad development, and reproductive behavior in the Atlantic stingray. Gen Comp Endocrinol. 2000;118:209–225. doi: 10.1006/gcen.2000.7466. [DOI] [PubMed] [Google Scholar]
- 32.Waltman B. Electrical properties and fine structure of the ampullary canals of Lorenzini. Acta Physiol Scand. 1966;66[Suppl 264]:1–60. [PubMed] [Google Scholar]
- 33.Wilkens LA, Russell DF, Pei X, Gurgens C. The paddlefish rostrum functions as an electrosensory antenna in plankton feeding. Proc R Soc Lond B Biol Sci. 1997;264:1723–1729. [Google Scholar]
- 34.Zakon HH. Hormonal modulation of communication signals in electric fish. Dev Neurosci. 1996;18:115–123. doi: 10.1159/000111399. [DOI] [PubMed] [Google Scholar]
- 35.Zakon HH. The effects of steroid hormones on electrical activity of excitable cells. Trends Neurosci. 1998;21:202–207. doi: 10.1016/s0166-2236(97)01209-5. [DOI] [PubMed] [Google Scholar]