Article title: Up-regulation of SNHG6 activates SERPINH1 expression by competitive binding to miR-139-5p to promote hepatocellular carcinoma progression
Authors: Wu G, Ju X, Wang Y, Li Z, Gan X
Journal: Cell Cycle
Bibliometrics: Volume 18, Number 16, pages 1849-1867
DOI: https://doi.org/10.1080/15384101.2019.1629772
It has been noted by the authors that the Figures 8 and 10 were published with errors. These errors have now been corrected as shown below. This correction has not changed the description, interpretation, or the original conclusions of the article. The authors apologize for any inconvenience caused.
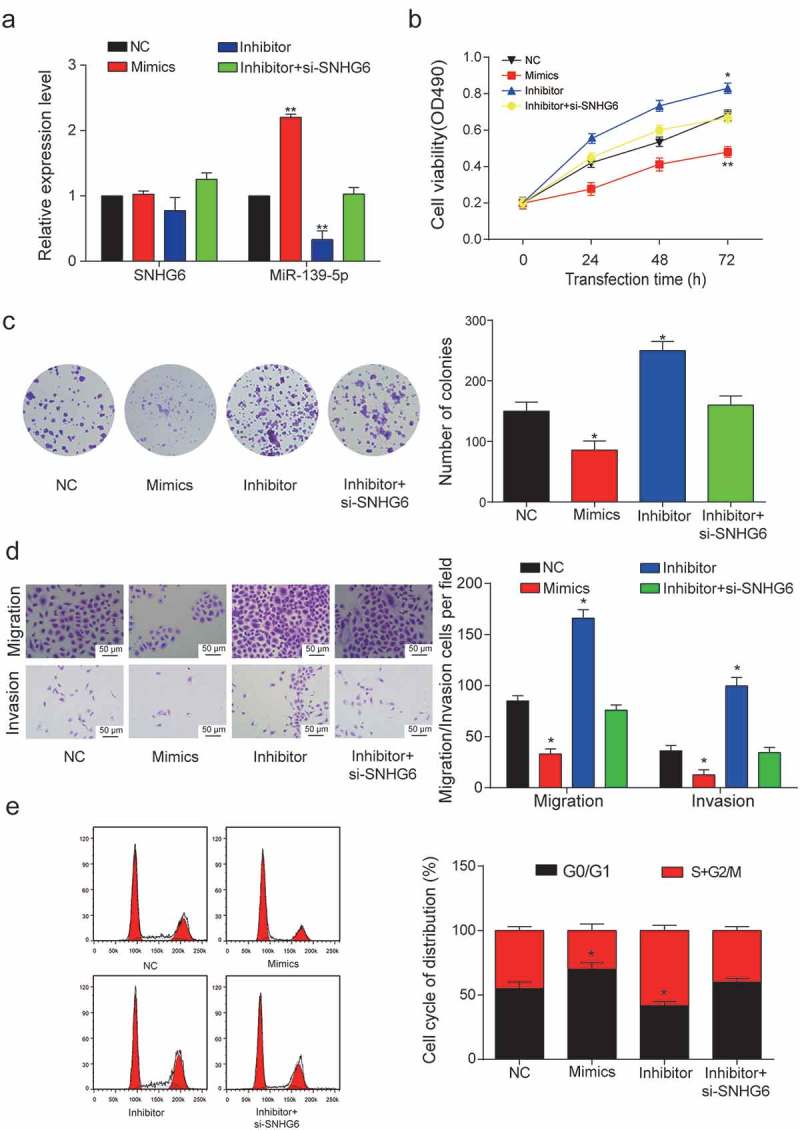
Figure 8.

miR-139-5p inhibited the proliferation and viability of HCC cells. (a) Relative expression levels of SNHG6 and miR-139-5p in four transfection groups. (**P< 0.01, compared with NC group) (b) Cell viability of HepG2 cells was analyzed by MTT assay. OD value measurement was carried out in four transfection groups under 490 nm. (*P< 0.05, **P< 0.01, compared with NC group) (c) Colony numbers in four transfection groups were counted and compared. The inhibition of miR-139-5p showed a significant increase in the number of HCC cells. (*P< 0.05, compared with NC group) (d) Migration and invasion rate of HepG2 cells in different transfection groups, the migration cells and invasion cells per field suggested the migration and invasion rate of cells. (*P< 0.05, compared with NC group) (e) Cell cycle analysis of the cell cycle phase distribution. Representative cell cycle analysis (left panel). (*P< 0.05, compared with NC group). One-way ANOVA was used in Figure 8B. Student’s two-tailed t-test was used in the remaining figures. Every experiment was performed for 3 times at least.
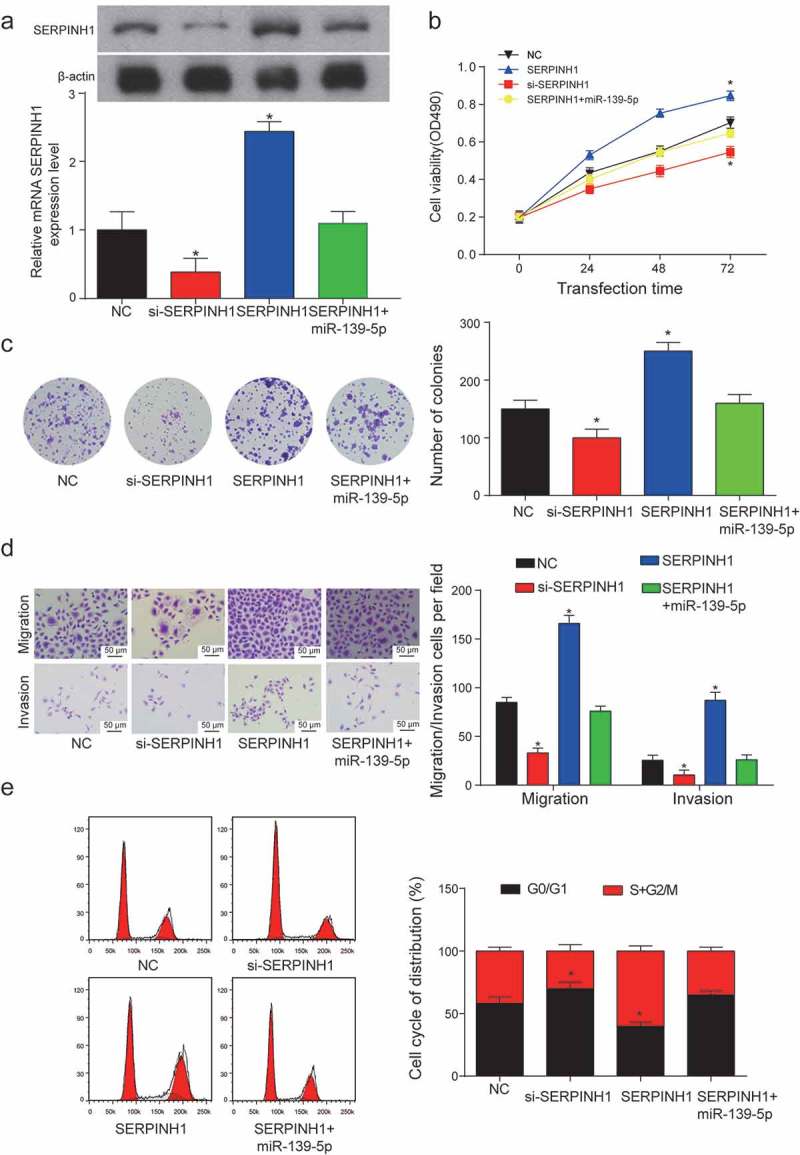
Figure 10.

SERPINH1 promoted the proliferation and viability of HCC cells. (a) Relative expression levels of SERPINH1 in NC group, si- SERPINH1 transfection group, SERPINH1 group and SERPINH1+ miR-139-5p transfection group (*P< 0.05, compared with NC group). (b) Cell viability of HepG2 cell line was analyzed by MTT assay. (*P< 0.05, compared with NC group) (c) Colony numbers were counted and compared between three transfection groups and NC group. The inhibition of SERPINH1 showed a significant decrease in the number of HepG2 cells. (*P< 0.05, compared with NC group) (d) Migration and invasion rate of HepG2 cells in different transfection groups, the migration cells and invasion cells per field suggest the migration and invasion rate of cells. (*P< 0.05, compared with NC group) (e) Cell cycle analysis of the cell cycle phase distribution was represented as mean ± SD (* means P< 0.05 compared to NC group). Every experiment was performed for 3 times at least.


